
溪月 Xīyuè
8k Publicaciones

溪月 Xīyuè
 Verificado Plus de Binance Square
Denunciar
Bloquear usuario
加密分析师 | 市场洞察短期与长期信号 | 比特币、以太坊及其他币种分享实时设置与基于研究的观点 与加密女王👸
Abrir trade
Trader frecuente
2.5 año(s)
655 Siguiendo
30.0K+ Seguidores
4.7K+ Me gusta
Publicaciones
Cartera
Todo
Citas
Live
·
--
Alcista
Verificado
#21shareslauncheseuropesfirstzcashetp
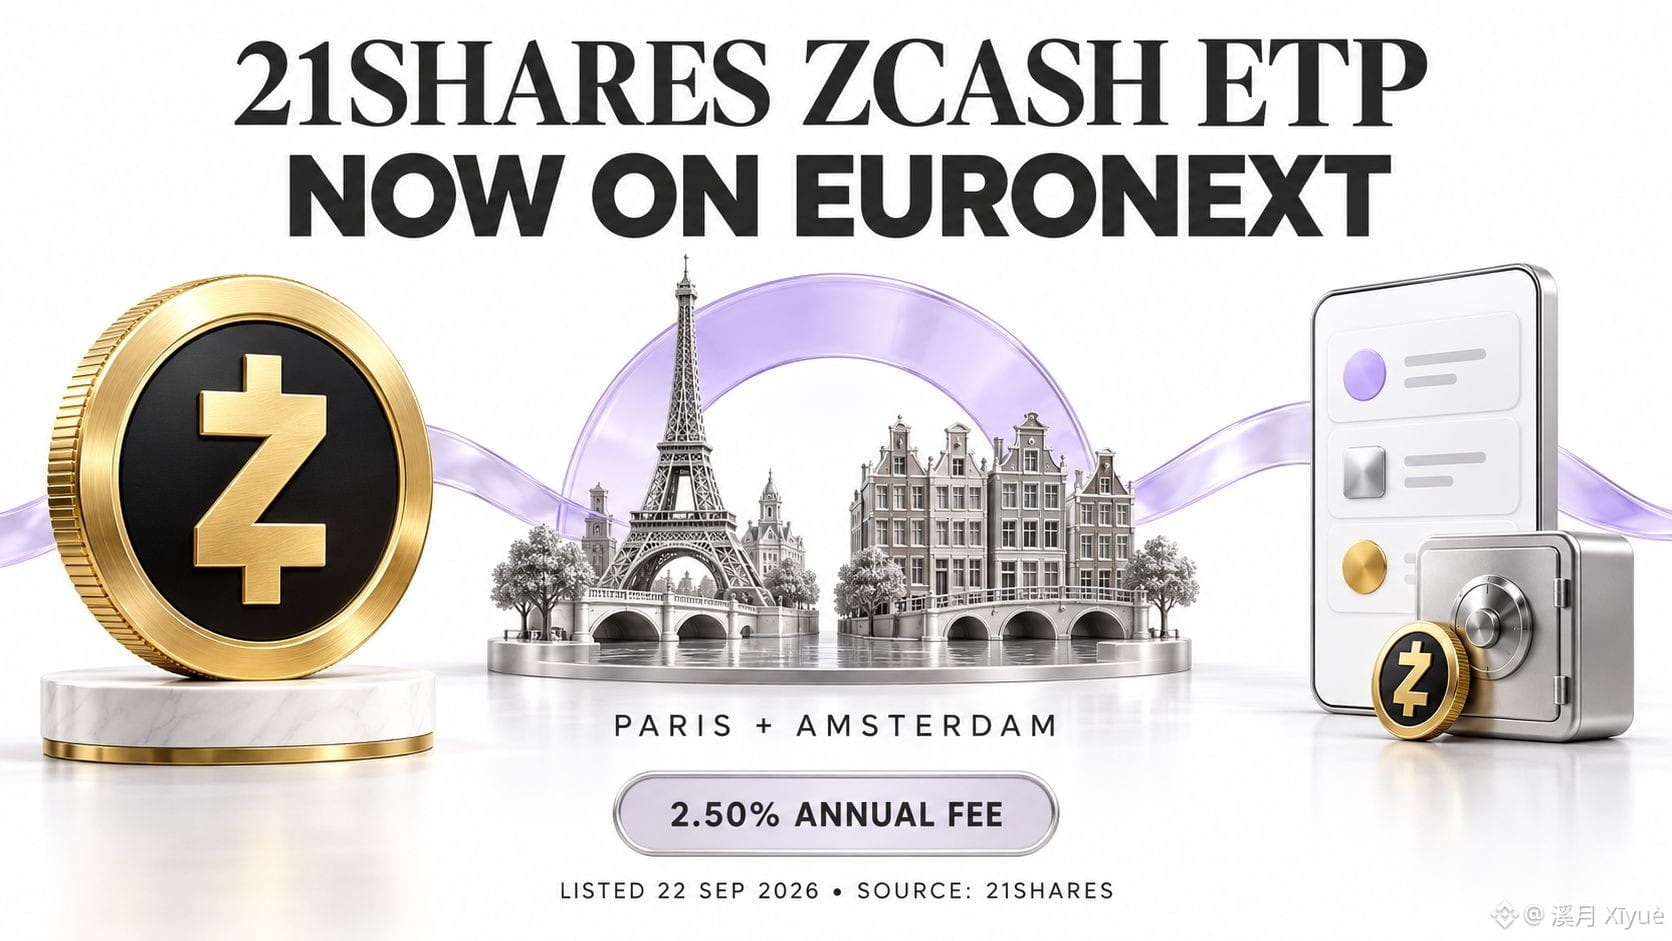
21Shares lanza un ETP de Zcash respaldado físicamente en Euronext
Zcash está llegando a inversores que prefieren mantener una exposición a criptomonedas dentro de una cuenta regular de valores.
El 22 de septiembre de 2026, 21Shares lanzó su ETP de Zcash respaldado físicamente en Euronext Paris y Amsterdam, bajo el ticker ZCASH. El producto tiene una comisión anual del 2.50%, con tokens subyacentes mantenidos mediante acuerdos de custodia institucional.
Cointelegraph describe la cotización como el primer ETP de Zcash en Europa, ampliando el acceso de la moneda de privacidad a los canales de inversión tradicionales.
Mi opinión: este lanzamiento podría facilitar la inclusión de Zcash en carteras que ya utilizan cuentas de corretaje convencionales. El intercambio práctico es el pago continuo de comisiones del producto y la dependencia de la estructura del emisor y sus custodios. Los inversores siguen expuestos a las fluctuaciones del precio de ZEC.
Para evaluar la demanda, observaría las creaciones netas, las unidades en circulación y los spreads de negociación durante las próximas semanas. Los activos bajo gestión pueden aumentar simplemente porque ZEC se aprecia, por lo que un saldo mayor por sí solo no puede establecer una compra nueva. Las suscripciones constantes y una negociación líquida aportarían una evidencia más sólida de un interés sostenido de los inversores.
También hay una distinción útil entre el acceso a la inversión y la adopción de la red. Tener este valor proporciona exposición al precio; no significa que el inversor esté utilizando las funciones de pagos protegidos (shielded) de Zcash.
¿El acceso más fácil a través de brókers se traducirá en una demanda duradera de Zcash?
#21SharesLaunchesEuropesFirstZcashETP #zcash #zec
$TAKE $NIL $ZEC
{future}(ZECUSDT)
{future}(NILUSDT)
{future}(TAKEUSDT)
#21shareslauncheseuropesfirstzcashetp
21Shares lanza un ETP de Zcash respaldado físicamente en Euronext
Zcash está llegando a inversores que prefieren mantener una exposición a criptomonedas dentro de una cuenta regular de valores.
El 22 de septiembre de 2026, 21Shares lanzó su ETP de Zcash respaldado físicamente en Euronext Paris y Amsterdam, bajo el ticker ZCASH. El producto tiene una comisión anual del 2.50%, con tokens subyacentes mantenidos mediante acuerdos de custodia institucional.
Cointelegraph describe la cotización como el primer ETP de Zcash en Europa, ampliando el acceso de la moneda de privacidad a los canales de inversión tradicionales.
Mi opinión: este lanzamiento podría facilitar la inclusión de Zcash en carteras que ya utilizan cuentas de corretaje convencionales. El intercambio práctico es el pago continuo de comisiones del producto y la dependencia de la estructura del emisor y sus custodios. Los inversores siguen expuestos a las fluctuaciones del precio de ZEC.
Para evaluar la demanda, observaría las creaciones netas, las unidades en circulación y los spreads de negociación durante las próximas semanas. Los activos bajo gestión pueden aumentar simplemente porque ZEC se aprecia, por lo que un saldo mayor por sí solo no puede establecer una compra nueva. Las suscripciones constantes y una negociación líquida aportarían una evidencia más sólida de un interés sostenido de los inversores.
También hay una distinción útil entre el acceso a la inversión y la adopción de la red. Tener este valor proporciona exposición al precio; no significa que el inversor esté utilizando las funciones de pagos protegidos (shielded) de Zcash.
¿El acceso más fácil a través de brókers se traducirá en una demanda duradera de Zcash?
#21SharesLaunchesEuropesFirstZcashETP #zcash #zec
$TAKE $NIL $ZEC
21Shares lanza un ETP de Zcash respaldado físicamente en Euronext
Zcash está llegando a inversores que prefieren mantener una exposición a criptomonedas dentro de una cuenta regular de valores.
El 22 de septiembre de 2026, 21Shares lanzó su ETP de Zcash respaldado físicamente en Euronext Paris y Amsterdam, bajo el ticker ZCASH. El producto tiene una comisión anual del 2.50%, con tokens subyacentes mantenidos mediante acuerdos de custodia institucional.
Cointelegraph describe la cotización como el primer ETP de Zcash en Europa, ampliando el acceso de la moneda de privacidad a los canales de inversión tradicionales.
Mi opinión: este lanzamiento podría facilitar la inclusión de Zcash en carteras que ya utilizan cuentas de corretaje convencionales. El intercambio práctico es el pago continuo de comisiones del producto y la dependencia de la estructura del emisor y sus custodios. Los inversores siguen expuestos a las fluctuaciones del precio de ZEC.
Para evaluar la demanda, observaría las creaciones netas, las unidades en circulación y los spreads de negociación durante las próximas semanas. Los activos bajo gestión pueden aumentar simplemente porque ZEC se aprecia, por lo que un saldo mayor por sí solo no puede establecer una compra nueva. Las suscripciones constantes y una negociación líquida aportarían una evidencia más sólida de un interés sostenido de los inversores.
También hay una distinción útil entre el acceso a la inversión y la adopción de la red. Tener este valor proporciona exposición al precio; no significa que el inversor esté utilizando las funciones de pagos protegidos (shielded) de Zcash.
¿El acceso más fácil a través de brókers se traducirá en una demanda duradera de Zcash?
#21SharesLaunchesEuropesFirstZcashETP #zcash #zec
$TAKE $NIL $ZEC
564
·
--
Alcista
Verificado
#cardanojoinsx402paymentstandard
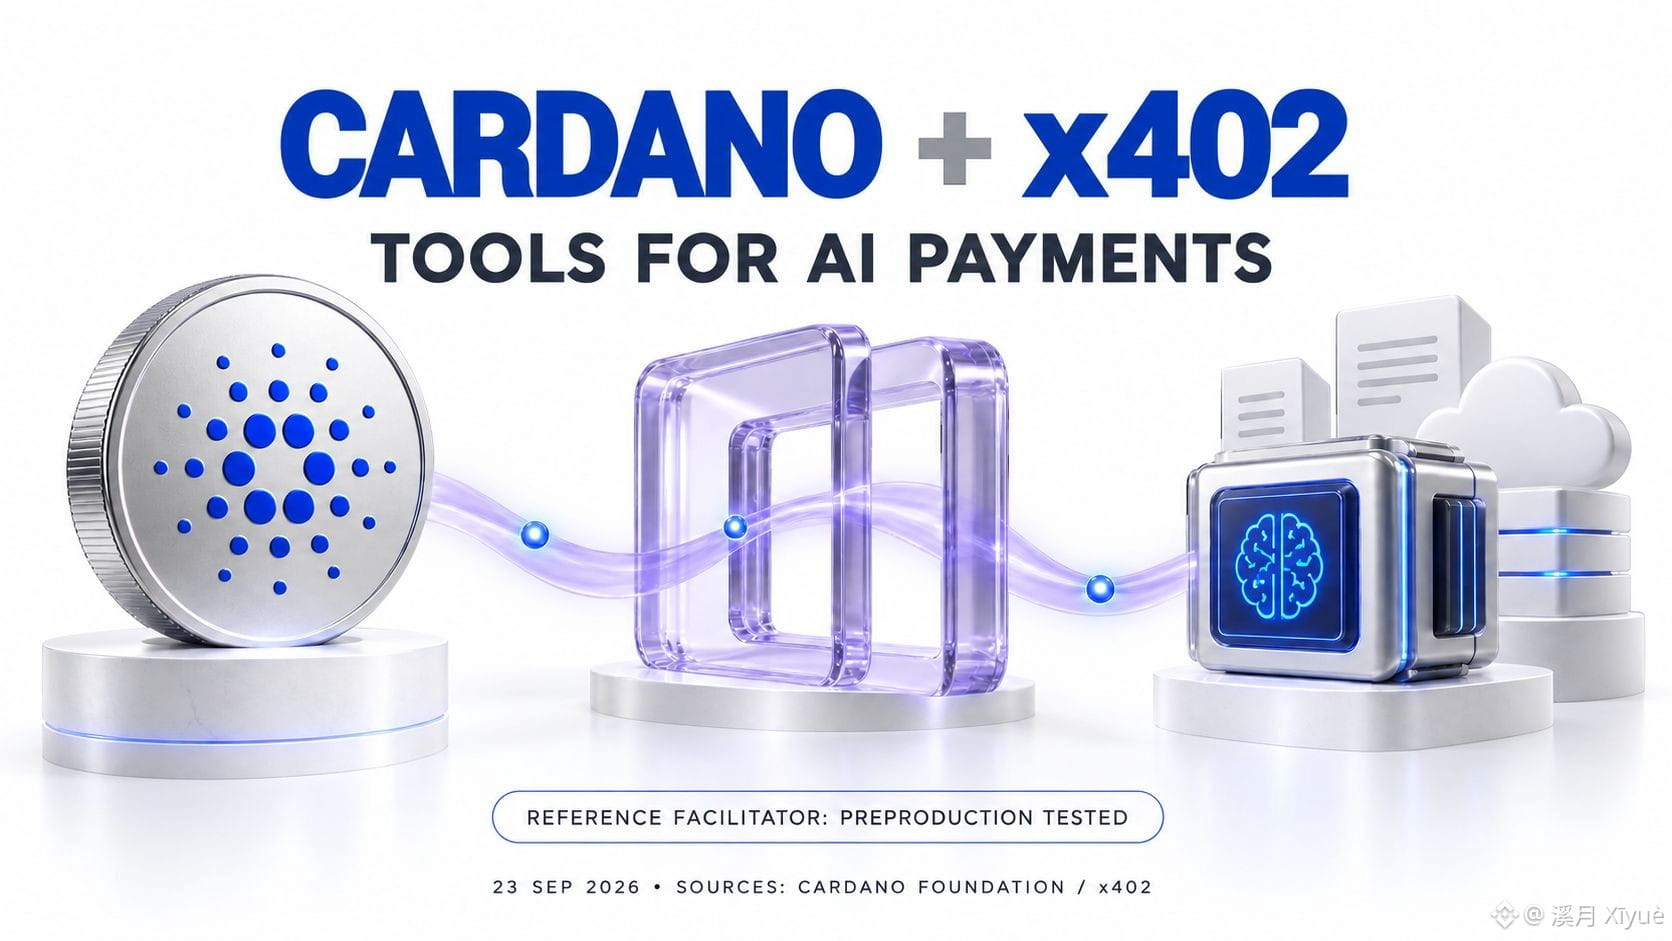
El soporte de x402 de Cardano abre una vía para los pagos con agentes de IA
Un asistente de IA podría comprar una sola pieza de datos con activos de Cardano, sin que una persona tenga que completar un pago en cada ocasión.
Cardano está incluido en la especificación oficial de x402 y en el kit de software de TypeScript. Los desarrolladores pueden crear flujos de pago usando ADA y tokens nativos, incluidos los stablecoins emitidos en Cardano.
La idea es esta: un servicio cotiza su precio mediante la respuesta “402 Payment Required” del sitio web. El software firma un pago y el acceso sigue a la verificación y la liquidación. Eso podría respaldar solicitudes de datos y llamadas a API de pago sin una suscripción mensual.
La fase de despliegue importa: el facilitador de referencia de la Cardano Foundation ha completado una prueba de pago onchain en preproducción. Su documentación indica que aún no se ha ejecutado contra mainnet.
Mi opinión: la oportunidad práctica es una facturación más sencilla para el software que necesita pequeñas cantidades de datos o cómputo bajo demanda. La adopción dependerá de una liquidación fiable, costos predecibles y servicios que valgan la pena pagar.
Para ADA, yo observaría pagos comerciales completados, clientes recurrentes y tarifas generadas. Los desarrolladores también necesitan controles de gasto razonables para que los agentes se mantengan dentro de los presupuestos de los usuarios. El soporte del kit crea una oportunidad; el uso sostenido mostraría si esa oportunidad genera una actividad económica significativa.
¿Qué servicio te gustaría que pagara automáticamente un agente de IA?
#CardanoJoinsX402PaymentStandard #ADA #AIAgents
$TAKE $NIL $MET
{future}(METUSDT)
{future}(NILUSDT)
{future}(TAKEUSDT)
#cardanojoinsx402paymentstandard
El soporte de x402 de Cardano abre una vía para los pagos con agentes de IA
Un asistente de IA podría comprar una sola pieza de datos con activos de Cardano, sin que una persona tenga que completar un pago en cada ocasión.
Cardano está incluido en la especificación oficial de x402 y en el kit de software de TypeScript. Los desarrolladores pueden crear flujos de pago usando ADA y tokens nativos, incluidos los stablecoins emitidos en Cardano.
La idea es esta: un servicio cotiza su precio mediante la respuesta “402 Payment Required” del sitio web. El software firma un pago y el acceso sigue a la verificación y la liquidación. Eso podría respaldar solicitudes de datos y llamadas a API de pago sin una suscripción mensual.
La fase de despliegue importa: el facilitador de referencia de la Cardano Foundation ha completado una prueba de pago onchain en preproducción. Su documentación indica que aún no se ha ejecutado contra mainnet.
Mi opinión: la oportunidad práctica es una facturación más sencilla para el software que necesita pequeñas cantidades de datos o cómputo bajo demanda. La adopción dependerá de una liquidación fiable, costos predecibles y servicios que valgan la pena pagar.
Para ADA, yo observaría pagos comerciales completados, clientes recurrentes y tarifas generadas. Los desarrolladores también necesitan controles de gasto razonables para que los agentes se mantengan dentro de los presupuestos de los usuarios. El soporte del kit crea una oportunidad; el uso sostenido mostraría si esa oportunidad genera una actividad económica significativa.
¿Qué servicio te gustaría que pagara automáticamente un agente de IA?
#CardanoJoinsX402PaymentStandard #ADA #AIAgents
$TAKE $NIL $MET
El soporte de x402 de Cardano abre una vía para los pagos con agentes de IA
Un asistente de IA podría comprar una sola pieza de datos con activos de Cardano, sin que una persona tenga que completar un pago en cada ocasión.
Cardano está incluido en la especificación oficial de x402 y en el kit de software de TypeScript. Los desarrolladores pueden crear flujos de pago usando ADA y tokens nativos, incluidos los stablecoins emitidos en Cardano.
La idea es esta: un servicio cotiza su precio mediante la respuesta “402 Payment Required” del sitio web. El software firma un pago y el acceso sigue a la verificación y la liquidación. Eso podría respaldar solicitudes de datos y llamadas a API de pago sin una suscripción mensual.
La fase de despliegue importa: el facilitador de referencia de la Cardano Foundation ha completado una prueba de pago onchain en preproducción. Su documentación indica que aún no se ha ejecutado contra mainnet.
Mi opinión: la oportunidad práctica es una facturación más sencilla para el software que necesita pequeñas cantidades de datos o cómputo bajo demanda. La adopción dependerá de una liquidación fiable, costos predecibles y servicios que valgan la pena pagar.
Para ADA, yo observaría pagos comerciales completados, clientes recurrentes y tarifas generadas. Los desarrolladores también necesitan controles de gasto razonables para que los agentes se mantengan dentro de los presupuestos de los usuarios. El soporte del kit crea una oportunidad; el uso sostenido mostraría si esa oportunidad genera una actividad económica significativa.
¿Qué servicio te gustaría que pagara automáticamente un agente de IA?
#CardanoJoinsX402PaymentStandard #ADA #AIAgents
$TAKE $NIL $MET
1.2k
·
--
Alcista
#ZECBreaksAbove$1600AtRecordHigh
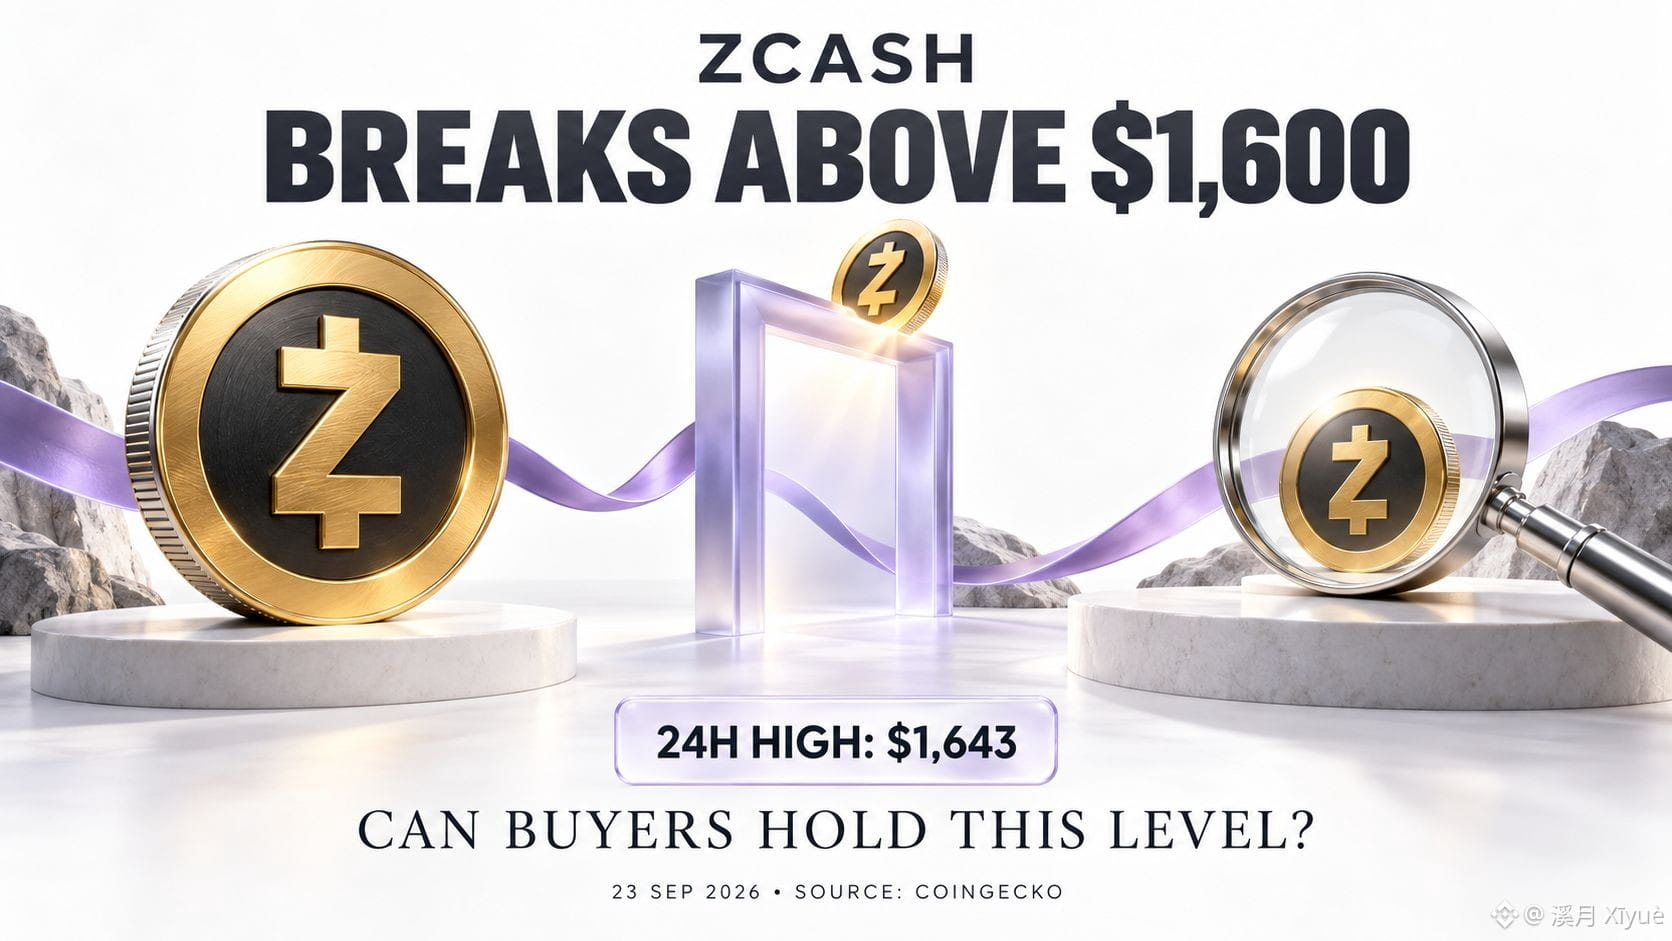
Zcash supera los $1,600 — ¿Puede mantenerse la ruptura?
ZEC ha superado los $1,600, poniendo el foco en si los compradores pueden establecer soporte en torno a este nivel.
Durante una revisión de mercado del 23 de septiembre de 2026, CoinGecko mostró ZEC cerca de $1,613, con un máximo de 24 horas de aproximadamente $1,643 e informó un volumen de operaciones de alrededor de $1.76 mil millones.
La etiqueta de “récord histórico” necesita contexto: CoinGecko aún muestra el máximo histórico (all-time high) de ZEC en $3,191.93. La ruptura de $1,600 está confirmada, pero sigue por debajo de ese pico histórico registrado.
Mi opinión: Mantenerse por encima de $1,600 durante un retroceso haría el movimiento más convincente. Una retest exitosa, respaldada por una actividad spot estable, podría indicar que los compradores se sienten cómodos aceptando precios más altos. Un giro rápido por debajo del nivel debilitaría esa interpretación y dejaría el soporte sin confirmar.
También compararía la actividad spot con el interés abierto en derivados y las tasas de financiación. Si las posiciones apalancadas se expanden rápidamente mientras la demanda spot se enfría, el avance podría volverse más vulnerable a retrocesos repentinos. Estas son condiciones para vigilar, más que afirmaciones sobre la posición actual.
Por ahora, la pregunta útil es cómo se comporta el precio después de cruzar los $1,600. Un movimiento fuerte le da a los traders un punto de referencia; el trading posterior mostrará si se mantiene.
¿Qué evidencia te convencería de que esta ruptura tiene continuidad?
#zcash #zec #PrivacyCoins
$MARSCOIN $ZEC $USELESS
{future}(USELESSUSDT)
{future}(ZECUSDT)
{future}(MARSCOINUSDT)
#ZECBreaksAbove$1600AtRecordHigh
Zcash supera los $1,600 — ¿Puede mantenerse la ruptura?
ZEC ha superado los $1,600, poniendo el foco en si los compradores pueden establecer soporte en torno a este nivel.
Durante una revisión de mercado del 23 de septiembre de 2026, CoinGecko mostró ZEC cerca de $1,613, con un máximo de 24 horas de aproximadamente $1,643 e informó un volumen de operaciones de alrededor de $1.76 mil millones.
La etiqueta de “récord histórico” necesita contexto: CoinGecko aún muestra el máximo histórico (all-time high) de ZEC en $3,191.93. La ruptura de $1,600 está confirmada, pero sigue por debajo de ese pico histórico registrado.
Mi opinión: Mantenerse por encima de $1,600 durante un retroceso haría el movimiento más convincente. Una retest exitosa, respaldada por una actividad spot estable, podría indicar que los compradores se sienten cómodos aceptando precios más altos. Un giro rápido por debajo del nivel debilitaría esa interpretación y dejaría el soporte sin confirmar.
También compararía la actividad spot con el interés abierto en derivados y las tasas de financiación. Si las posiciones apalancadas se expanden rápidamente mientras la demanda spot se enfría, el avance podría volverse más vulnerable a retrocesos repentinos. Estas son condiciones para vigilar, más que afirmaciones sobre la posición actual.
Por ahora, la pregunta útil es cómo se comporta el precio después de cruzar los $1,600. Un movimiento fuerte le da a los traders un punto de referencia; el trading posterior mostrará si se mantiene.
¿Qué evidencia te convencería de que esta ruptura tiene continuidad?
#zcash #zec #PrivacyCoins
$MARSCOIN $ZEC $USELESS
Zcash supera los $1,600 — ¿Puede mantenerse la ruptura?
ZEC ha superado los $1,600, poniendo el foco en si los compradores pueden establecer soporte en torno a este nivel.
Durante una revisión de mercado del 23 de septiembre de 2026, CoinGecko mostró ZEC cerca de $1,613, con un máximo de 24 horas de aproximadamente $1,643 e informó un volumen de operaciones de alrededor de $1.76 mil millones.
La etiqueta de “récord histórico” necesita contexto: CoinGecko aún muestra el máximo histórico (all-time high) de ZEC en $3,191.93. La ruptura de $1,600 está confirmada, pero sigue por debajo de ese pico histórico registrado.
Mi opinión: Mantenerse por encima de $1,600 durante un retroceso haría el movimiento más convincente. Una retest exitosa, respaldada por una actividad spot estable, podría indicar que los compradores se sienten cómodos aceptando precios más altos. Un giro rápido por debajo del nivel debilitaría esa interpretación y dejaría el soporte sin confirmar.
También compararía la actividad spot con el interés abierto en derivados y las tasas de financiación. Si las posiciones apalancadas se expanden rápidamente mientras la demanda spot se enfría, el avance podría volverse más vulnerable a retrocesos repentinos. Estas son condiciones para vigilar, más que afirmaciones sobre la posición actual.
Por ahora, la pregunta útil es cómo se comporta el precio después de cruzar los $1,600. Un movimiento fuerte le da a los traders un punto de referencia; el trading posterior mostrará si se mantiene.
¿Qué evidencia te convencería de que esta ruptura tiene continuidad?
#zcash #zec #PrivacyCoins
$MARSCOIN $ZEC $USELESS
454
·
--
Alcista
#BitwiseNEARStakingETPAssetsTop$100M
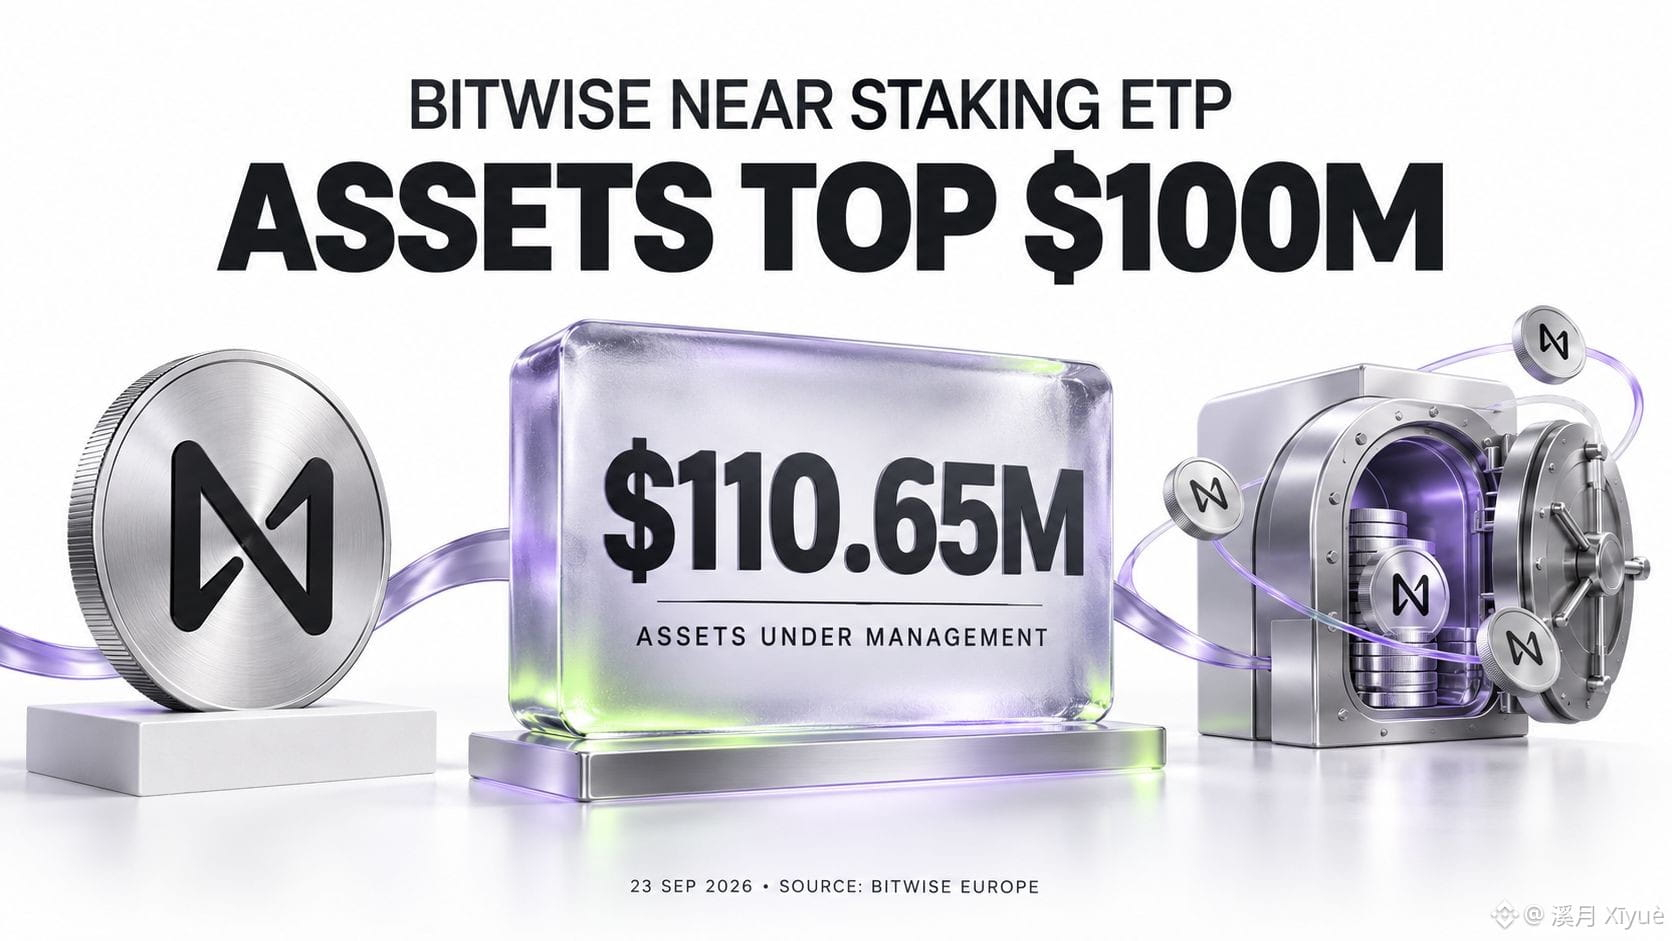
El ETP de staking en NEAR de Bitwise supera los 100M$ a medida que los activos alcanzan los 110,65M$
El alcance de inversión en formato ETF de NEAR ha cruzado un hito destacado.
Bitwise informa 110,65 millones de dólares en activos bajo gestión a 23 de septiembre de 2026. Su ETP de staking en NEAR mantiene aproximadamente 25,43 millones de tokens NEAR en 4,91 millones de unidades en circulación.
El producto europeo ofrece exposición a NEAR a través de una cuenta de corretaje. Está respaldado totalmente por tokens mantenidos en custodia profesional, con recompensas de staking acumuladas dentro del producto. Esas recompensas varían y las comisiones afectan los rendimientos.
Mi opinión: Este es un hito importante para el tamaño del producto, pero la siguiente pregunta es cuánto crecimiento proviene de nuevas suscripciones. El AUM cambia con los precios de los tokens, las creaciones o reembolsos, y los incrementos por staking. Un saldo en dólares al alza por sí solo no puede determinar cuánto dinero nuevo comprometieron los inversores.
Observar las unidades en circulación a lo largo del tiempo ayudaría a separar la demanda de los inversores del aumento de valor del mercado. Si las unidades siguen expandiéndose mientras el precio de NEAR se mantiene estable, eso reforzaría el argumento de una demanda más amplia a través de este canal de inversión.
Para la perspectiva de más largo plazo de NEAR, también compararía el crecimiento del producto con la actividad de la red. Un acceso a inversión más fácil y un mayor uso de la blockchain responden a preguntas distintas sobre la adopción.
¿Qué observarías con más atención: el AUM total o el crecimiento en las unidades del ETP?
#Near #staking
$MUBARAK $MARSCOIN $USELESS
{future}(USELESSUSDT)
{future}(MARSCOINUSDT)
{future}(MUBARAKUSDT)
#BitwiseNEARStakingETPAssetsTop$100M
El ETP de staking en NEAR de Bitwise supera los 100M$ a medida que los activos alcanzan los 110,65M$
El alcance de inversión en formato ETF de NEAR ha cruzado un hito destacado.
Bitwise informa 110,65 millones de dólares en activos bajo gestión a 23 de septiembre de 2026. Su ETP de staking en NEAR mantiene aproximadamente 25,43 millones de tokens NEAR en 4,91 millones de unidades en circulación.
El producto europeo ofrece exposición a NEAR a través de una cuenta de corretaje. Está respaldado totalmente por tokens mantenidos en custodia profesional, con recompensas de staking acumuladas dentro del producto. Esas recompensas varían y las comisiones afectan los rendimientos.
Mi opinión: Este es un hito importante para el tamaño del producto, pero la siguiente pregunta es cuánto crecimiento proviene de nuevas suscripciones. El AUM cambia con los precios de los tokens, las creaciones o reembolsos, y los incrementos por staking. Un saldo en dólares al alza por sí solo no puede determinar cuánto dinero nuevo comprometieron los inversores.
Observar las unidades en circulación a lo largo del tiempo ayudaría a separar la demanda de los inversores del aumento de valor del mercado. Si las unidades siguen expandiéndose mientras el precio de NEAR se mantiene estable, eso reforzaría el argumento de una demanda más amplia a través de este canal de inversión.
Para la perspectiva de más largo plazo de NEAR, también compararía el crecimiento del producto con la actividad de la red. Un acceso a inversión más fácil y un mayor uso de la blockchain responden a preguntas distintas sobre la adopción.
¿Qué observarías con más atención: el AUM total o el crecimiento en las unidades del ETP?
#Near #staking
$MUBARAK $MARSCOIN $USELESS
El ETP de staking en NEAR de Bitwise supera los 100M$ a medida que los activos alcanzan los 110,65M$
El alcance de inversión en formato ETF de NEAR ha cruzado un hito destacado.
Bitwise informa 110,65 millones de dólares en activos bajo gestión a 23 de septiembre de 2026. Su ETP de staking en NEAR mantiene aproximadamente 25,43 millones de tokens NEAR en 4,91 millones de unidades en circulación.
El producto europeo ofrece exposición a NEAR a través de una cuenta de corretaje. Está respaldado totalmente por tokens mantenidos en custodia profesional, con recompensas de staking acumuladas dentro del producto. Esas recompensas varían y las comisiones afectan los rendimientos.
Mi opinión: Este es un hito importante para el tamaño del producto, pero la siguiente pregunta es cuánto crecimiento proviene de nuevas suscripciones. El AUM cambia con los precios de los tokens, las creaciones o reembolsos, y los incrementos por staking. Un saldo en dólares al alza por sí solo no puede determinar cuánto dinero nuevo comprometieron los inversores.
Observar las unidades en circulación a lo largo del tiempo ayudaría a separar la demanda de los inversores del aumento de valor del mercado. Si las unidades siguen expandiéndose mientras el precio de NEAR se mantiene estable, eso reforzaría el argumento de una demanda más amplia a través de este canal de inversión.
Para la perspectiva de más largo plazo de NEAR, también compararía el crecimiento del producto con la actividad de la red. Un acceso a inversión más fácil y un mayor uso de la blockchain responden a preguntas distintas sobre la adopción.
¿Qué observarías con más atención: el AUM total o el crecimiento en las unidades del ETP?
#Near #staking
$MUBARAK $MARSCOIN $USELESS
322
·
--
Alcista
#dogecoinrises15%
El rally del 15% de Dogecoin pone la zona de $0.10 en el punto de mira
DOGE lideró el rebote inicial, pero la siguiente prueba es mantener sus ganancias.
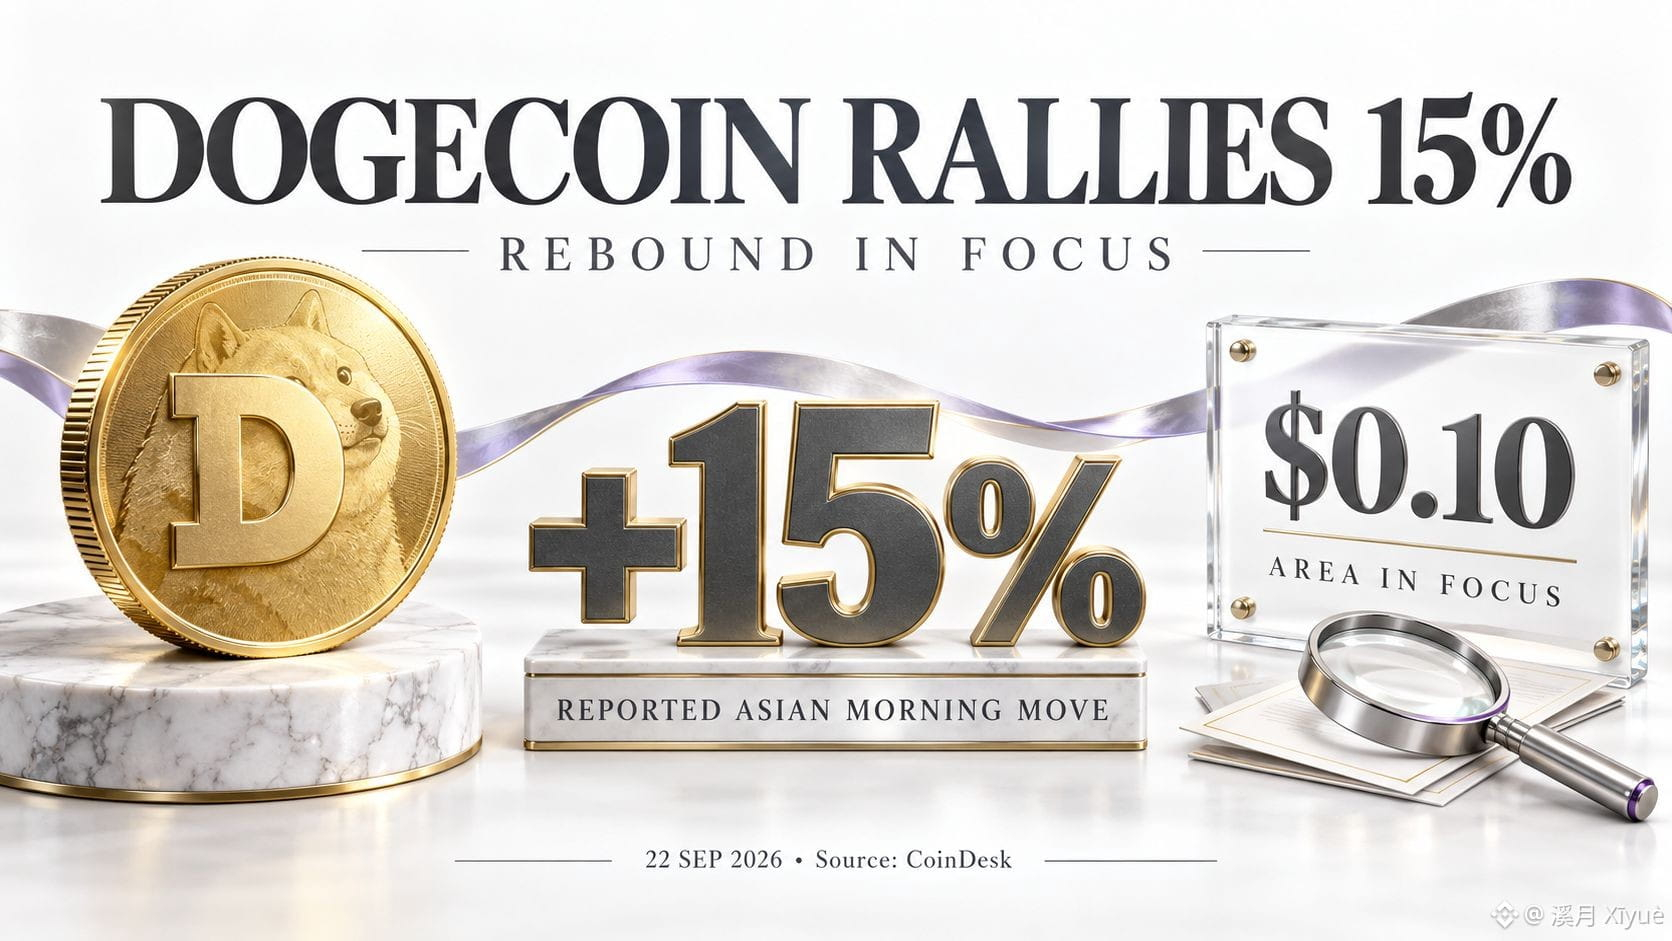
Dogecoin subió más de un 15% hasta apenas por encima de $0.10 durante la sesión asiática del 22 de septiembre de 2026, según CoinDesk. Fue el mejor desempeño entre los principales tokens en esa instantánea.
Una instantánea posterior de CoinGecko mostró a DOGE alrededor de $0.0996, por debajo de su máximo de 24 horas reportado de $0.1056, con aproximadamente $3.22 mil millones en volumen de operaciones durante el día anterior. El titular del 15% describe, por tanto, el movimiento reportado con anterioridad.
Mi opinión: Después de un salto brusco, me centraría en si DOGE puede recuperar y mantener la zona de $0.10 con actividad sostenida al contado. Un número redondo puede llamar la atención, pero las compras repetidas a través de retrocesos normales aportarían una evidencia más útil de la demanda.
El volumen también necesita contexto: el trading activo incluye tanto compradores como vendedores. Comparar la participación al contado con los cambios en el interés abierto en futuros puede ayudar a evaluar si el movimiento se vuelve cada vez más dependiente del apalancamiento.
Las próximas sesiones deberían ofrecer una imagen más clara de cuánto del rebote pueden conservar los compradores. Una fortaleza continua mientras el mercado en general se estabiliza sería más informativa que el salto porcentual inicial por sí solo.
¿Qué aumentaría tu nivel de confianza en el rebote de DOGE: un volumen sostenido al contado o una retención más firme por encima de $0.10?
#DogecoinRises15% #DOGE #CryptoMarket
$DOGE $MUBARAK $FLOCK
{future}(MUBARAKUSDT)
{future}(FLOCKUSDT)
{future}(DOGEUSDT)
#dogecoinrises15%
El rally del 15% de Dogecoin pone la zona de $0.10 en el punto de mira
DOGE lideró el rebote inicial, pero la siguiente prueba es mantener sus ganancias.
Dogecoin subió más de un 15% hasta apenas por encima de $0.10 durante la sesión asiática del 22 de septiembre de 2026, según CoinDesk. Fue el mejor desempeño entre los principales tokens en esa instantánea.
Una instantánea posterior de CoinGecko mostró a DOGE alrededor de $0.0996, por debajo de su máximo de 24 horas reportado de $0.1056, con aproximadamente $3.22 mil millones en volumen de operaciones durante el día anterior. El titular del 15% describe, por tanto, el movimiento reportado con anterioridad.
Mi opinión: Después de un salto brusco, me centraría en si DOGE puede recuperar y mantener la zona de $0.10 con actividad sostenida al contado. Un número redondo puede llamar la atención, pero las compras repetidas a través de retrocesos normales aportarían una evidencia más útil de la demanda.
El volumen también necesita contexto: el trading activo incluye tanto compradores como vendedores. Comparar la participación al contado con los cambios en el interés abierto en futuros puede ayudar a evaluar si el movimiento se vuelve cada vez más dependiente del apalancamiento.
Las próximas sesiones deberían ofrecer una imagen más clara de cuánto del rebote pueden conservar los compradores. Una fortaleza continua mientras el mercado en general se estabiliza sería más informativa que el salto porcentual inicial por sí solo.
¿Qué aumentaría tu nivel de confianza en el rebote de DOGE: un volumen sostenido al contado o una retención más firme por encima de $0.10?
#DogecoinRises15% #DOGE #CryptoMarket
$DOGE $MUBARAK $FLOCK
El rally del 15% de Dogecoin pone la zona de $0.10 en el punto de mira
DOGE lideró el rebote inicial, pero la siguiente prueba es mantener sus ganancias.
Dogecoin subió más de un 15% hasta apenas por encima de $0.10 durante la sesión asiática del 22 de septiembre de 2026, según CoinDesk. Fue el mejor desempeño entre los principales tokens en esa instantánea.
Una instantánea posterior de CoinGecko mostró a DOGE alrededor de $0.0996, por debajo de su máximo de 24 horas reportado de $0.1056, con aproximadamente $3.22 mil millones en volumen de operaciones durante el día anterior. El titular del 15% describe, por tanto, el movimiento reportado con anterioridad.
Mi opinión: Después de un salto brusco, me centraría en si DOGE puede recuperar y mantener la zona de $0.10 con actividad sostenida al contado. Un número redondo puede llamar la atención, pero las compras repetidas a través de retrocesos normales aportarían una evidencia más útil de la demanda.
El volumen también necesita contexto: el trading activo incluye tanto compradores como vendedores. Comparar la participación al contado con los cambios en el interés abierto en futuros puede ayudar a evaluar si el movimiento se vuelve cada vez más dependiente del apalancamiento.
Las próximas sesiones deberían ofrecer una imagen más clara de cuánto del rebote pueden conservar los compradores. Una fortaleza continua mientras el mercado en general se estabiliza sería más informativa que el salto porcentual inicial por sí solo.
¿Qué aumentaría tu nivel de confianza en el rebote de DOGE: un volumen sostenido al contado o una retención más firme por encima de $0.10?
#DogecoinRises15% #DOGE #CryptoMarket
$DOGE $MUBARAK $FLOCK
204
·
--
Alcista
Verificado
#bnbmarketcappassesbnymellon
BNB supera a BNY Mellon en capitalización de mercado — ¿Qué nos dice?
BNB se ha adelantado a una importante institución financiera tradicional en valor de mercado.
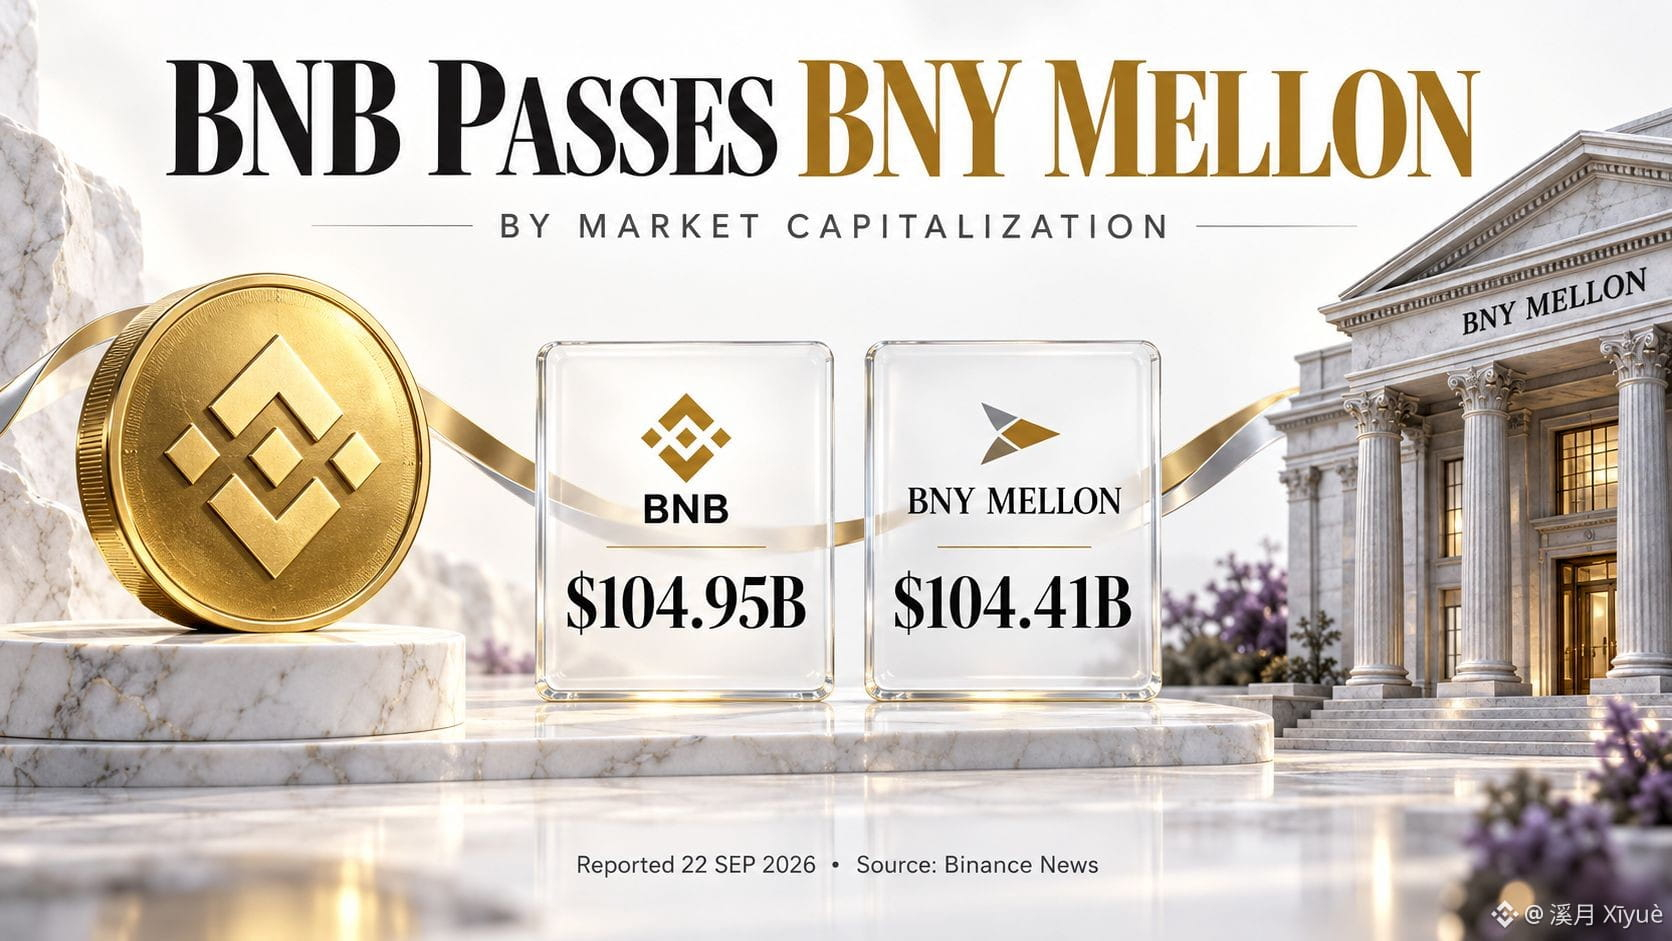
El 22 de septiembre de 2026, Binance News informó que la capitalización de mercado de BNB era de 104,95 mil millones de dólares, frente a los 104,41 mil millones de BNY Mellon. Esto representa una brecha de aproximadamente 540 millones de dólares, o 0,5%, usando las cifras reportadas.
La comparación necesita contexto. La cifra de BNB valora los tokens en circulación, mientras que la de BNY valora el capital listado del banco. Los activos que BNY protege para sus clientes son una medida separada.
Mi opinión: este hito muestra la magnitud de la valoración de BNB, pero evaluar si ese valor está respaldado requiere mirar más allá del ranking.
Para BNB, yo seguiría la actividad sostenida de la red, la demanda de comisiones por transacciones, los cambios en la oferta y la liquidez del mercado. Estos factores ayudan a explicar si la demanda de tokens puede persistir a través de cambios en el sentimiento.
Para un banco, las ganancias, la solidez del capital y las distribuciones a los accionistas proporcionan una base de valoración diferente. Por lo tanto, capitalizaciones de mercado similares representan distintas exposiciones económicas y derechos de propiedad.
La estrecha brecha reportada también importa. Las criptomonedas se negocian de forma continua, mientras que las acciones bancarias siguen las sesiones del mercado bursátil, por lo que los rankings pueden cambiar a medida que los precios y las marcas de tiempo se actualizan.
Lo más útil como seguimiento es si la actividad subyacente de BNB se desarrolla junto con su valoración.
¿Qué te dice más sobre el progreso de BNB: su puesto en la capitalización de mercado o el crecimiento sostenido en el uso de la red?
#BNBMarketCapPassesBNYMellon #bnb #CryptoMarket
$BNB $MUBARAK $NIL
{future}(NILUSDT)
{future}(MUBARAKUSDT)
{future}(BNBUSDT)
#bnbmarketcappassesbnymellon
BNB supera a BNY Mellon en capitalización de mercado — ¿Qué nos dice?
BNB se ha adelantado a una importante institución financiera tradicional en valor de mercado.
El 22 de septiembre de 2026, Binance News informó que la capitalización de mercado de BNB era de 104,95 mil millones de dólares, frente a los 104,41 mil millones de BNY Mellon. Esto representa una brecha de aproximadamente 540 millones de dólares, o 0,5%, usando las cifras reportadas.
La comparación necesita contexto. La cifra de BNB valora los tokens en circulación, mientras que la de BNY valora el capital listado del banco. Los activos que BNY protege para sus clientes son una medida separada.
Mi opinión: este hito muestra la magnitud de la valoración de BNB, pero evaluar si ese valor está respaldado requiere mirar más allá del ranking.
Para BNB, yo seguiría la actividad sostenida de la red, la demanda de comisiones por transacciones, los cambios en la oferta y la liquidez del mercado. Estos factores ayudan a explicar si la demanda de tokens puede persistir a través de cambios en el sentimiento.
Para un banco, las ganancias, la solidez del capital y las distribuciones a los accionistas proporcionan una base de valoración diferente. Por lo tanto, capitalizaciones de mercado similares representan distintas exposiciones económicas y derechos de propiedad.
La estrecha brecha reportada también importa. Las criptomonedas se negocian de forma continua, mientras que las acciones bancarias siguen las sesiones del mercado bursátil, por lo que los rankings pueden cambiar a medida que los precios y las marcas de tiempo se actualizan.
Lo más útil como seguimiento es si la actividad subyacente de BNB se desarrolla junto con su valoración.
¿Qué te dice más sobre el progreso de BNB: su puesto en la capitalización de mercado o el crecimiento sostenido en el uso de la red?
#BNBMarketCapPassesBNYMellon #bnb #CryptoMarket
$BNB $MUBARAK $NIL
BNB supera a BNY Mellon en capitalización de mercado — ¿Qué nos dice?
BNB se ha adelantado a una importante institución financiera tradicional en valor de mercado.
El 22 de septiembre de 2026, Binance News informó que la capitalización de mercado de BNB era de 104,95 mil millones de dólares, frente a los 104,41 mil millones de BNY Mellon. Esto representa una brecha de aproximadamente 540 millones de dólares, o 0,5%, usando las cifras reportadas.
La comparación necesita contexto. La cifra de BNB valora los tokens en circulación, mientras que la de BNY valora el capital listado del banco. Los activos que BNY protege para sus clientes son una medida separada.
Mi opinión: este hito muestra la magnitud de la valoración de BNB, pero evaluar si ese valor está respaldado requiere mirar más allá del ranking.
Para BNB, yo seguiría la actividad sostenida de la red, la demanda de comisiones por transacciones, los cambios en la oferta y la liquidez del mercado. Estos factores ayudan a explicar si la demanda de tokens puede persistir a través de cambios en el sentimiento.
Para un banco, las ganancias, la solidez del capital y las distribuciones a los accionistas proporcionan una base de valoración diferente. Por lo tanto, capitalizaciones de mercado similares representan distintas exposiciones económicas y derechos de propiedad.
La estrecha brecha reportada también importa. Las criptomonedas se negocian de forma continua, mientras que las acciones bancarias siguen las sesiones del mercado bursátil, por lo que los rankings pueden cambiar a medida que los precios y las marcas de tiempo se actualizan.
Lo más útil como seguimiento es si la actividad subyacente de BNB se desarrolla junto con su valoración.
¿Qué te dice más sobre el progreso de BNB: su puesto en la capitalización de mercado o el crecimiento sostenido en el uso de la red?
#BNBMarketCapPassesBNYMellon #bnb #CryptoMarket
$BNB $MUBARAK $NIL
2
1.1k
·
--
Alcista
#CryptoMarketCapReclaims$3Trillion
Bitcoin acaba de tocar un máximo de ocho meses — pero la señal más grande podría estar en otro lugar
Las criptomonedas, en silencio, volvieron a subir a un nivel que no veían desde hace meses — y el movimiento puede tener menos que ver con las cripto en sí.
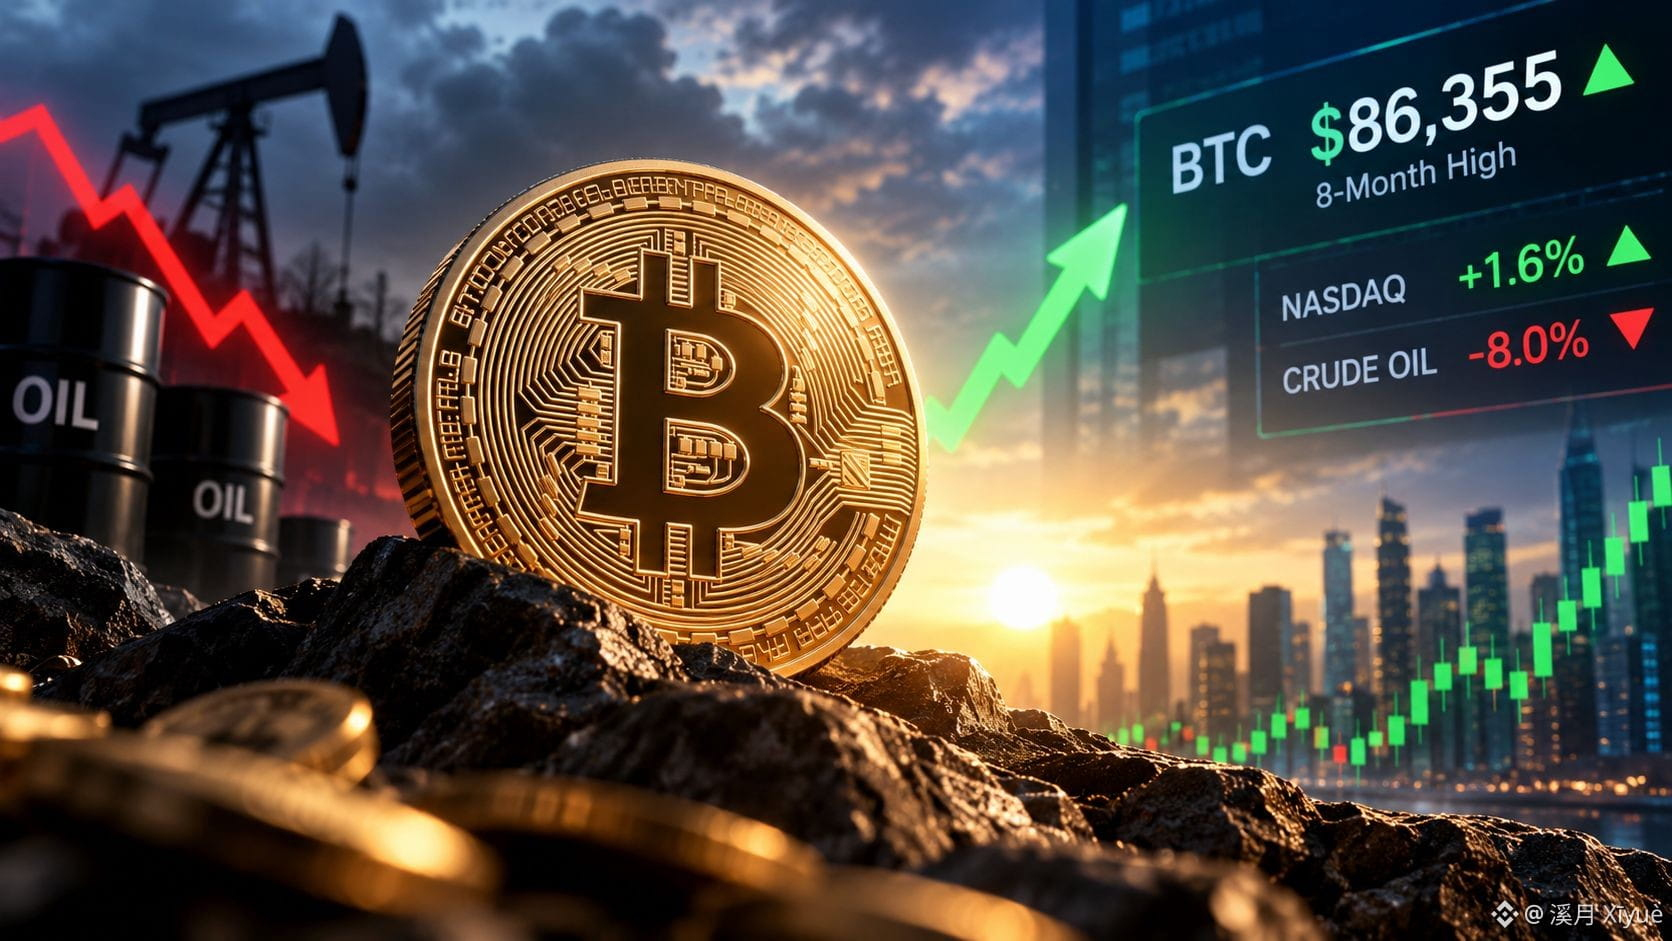
Bitcoin llegó a cotizar tan alto como $86,355 el lunes, su mejor nivel desde el 29 de enero. El mercado general también se movió con él: 106 de los 125 tokens principales no vinculados a stablecoins estaban en verde. Eso indica una participación más amplia, no solo un movimiento de BTC.
Lo interesante es lo que pasó en otros lugares. El crudo de West Texas cayó más de 8%, mientras que el Nasdaq abrió 1.6% más alto. El petróleo baja, la tecnología sube, las cripto suben — todo al mismo tiempo, aproximadamente. Eso podría señalar un cambio más amplio en la aversión o apetito por el riesgo, aunque una sola sesión no basta para afirmar que se trate de una rotación duradera.
El panorama del apalancamiento también parece relativamente contenido. Las tasas de financiación en mercados perpetuos están cerca de cero, mientras que los swaps de BTC y ETH se negocian por debajo de los niveles del índice. Eso es bastante distinto de las condiciones de alto apalancamiento que suelen verse durante rallies más especulativos.
La imagen general sigue incompleta. La capitalización total del mercado cripto alcanzó un máximo cercano a $4.27 billones el pasado octubre, luego perdió alrededor de un tercio antes de recuperarse por encima de $2.8 billones a principios de este mes.
Hasta ahora, esto parece más una recuperación que una euforia.
La pregunta real es si la amplitud y la financiación se mantienen saludables si los precios siguen subiendo.
$BTC $MUBARAK $ETH
{future}(ETHUSDT)
{future}(MUBARAKUSDT)
{future}(BTCUSDT)
#CryptoMarketCapReclaims$3Trillion
Bitcoin acaba de tocar un máximo de ocho meses — pero la señal más grande podría estar en otro lugar
Las criptomonedas, en silencio, volvieron a subir a un nivel que no veían desde hace meses — y el movimiento puede tener menos que ver con las cripto en sí.
Bitcoin llegó a cotizar tan alto como $86,355 el lunes, su mejor nivel desde el 29 de enero. El mercado general también se movió con él: 106 de los 125 tokens principales no vinculados a stablecoins estaban en verde. Eso indica una participación más amplia, no solo un movimiento de BTC.
Lo interesante es lo que pasó en otros lugares. El crudo de West Texas cayó más de 8%, mientras que el Nasdaq abrió 1.6% más alto. El petróleo baja, la tecnología sube, las cripto suben — todo al mismo tiempo, aproximadamente. Eso podría señalar un cambio más amplio en la aversión o apetito por el riesgo, aunque una sola sesión no basta para afirmar que se trate de una rotación duradera.
El panorama del apalancamiento también parece relativamente contenido. Las tasas de financiación en mercados perpetuos están cerca de cero, mientras que los swaps de BTC y ETH se negocian por debajo de los niveles del índice. Eso es bastante distinto de las condiciones de alto apalancamiento que suelen verse durante rallies más especulativos.
La imagen general sigue incompleta. La capitalización total del mercado cripto alcanzó un máximo cercano a $4.27 billones el pasado octubre, luego perdió alrededor de un tercio antes de recuperarse por encima de $2.8 billones a principios de este mes.
Hasta ahora, esto parece más una recuperación que una euforia.
La pregunta real es si la amplitud y la financiación se mantienen saludables si los precios siguen subiendo.
$BTC $MUBARAK $ETH
Bitcoin acaba de tocar un máximo de ocho meses — pero la señal más grande podría estar en otro lugar
Las criptomonedas, en silencio, volvieron a subir a un nivel que no veían desde hace meses — y el movimiento puede tener menos que ver con las cripto en sí.
Bitcoin llegó a cotizar tan alto como $86,355 el lunes, su mejor nivel desde el 29 de enero. El mercado general también se movió con él: 106 de los 125 tokens principales no vinculados a stablecoins estaban en verde. Eso indica una participación más amplia, no solo un movimiento de BTC.
Lo interesante es lo que pasó en otros lugares. El crudo de West Texas cayó más de 8%, mientras que el Nasdaq abrió 1.6% más alto. El petróleo baja, la tecnología sube, las cripto suben — todo al mismo tiempo, aproximadamente. Eso podría señalar un cambio más amplio en la aversión o apetito por el riesgo, aunque una sola sesión no basta para afirmar que se trate de una rotación duradera.
El panorama del apalancamiento también parece relativamente contenido. Las tasas de financiación en mercados perpetuos están cerca de cero, mientras que los swaps de BTC y ETH se negocian por debajo de los niveles del índice. Eso es bastante distinto de las condiciones de alto apalancamiento que suelen verse durante rallies más especulativos.
La imagen general sigue incompleta. La capitalización total del mercado cripto alcanzó un máximo cercano a $4.27 billones el pasado octubre, luego perdió alrededor de un tercio antes de recuperarse por encima de $2.8 billones a principios de este mes.
Hasta ahora, esto parece más una recuperación que una euforia.
La pregunta real es si la amplitud y la financiación se mantienen saludables si los precios siguen subiendo.
$BTC $MUBARAK $ETH
268
·
--
Alcista
#museovertakeschatgptastopfreeiosapp
Muse supera a ChatGPT en el ranking de iPhone en EE. UU.
La carrera de la IA para consumidores tiene un nuevo líder en el ranking.
El 22 de septiembre de 2026, la App Store de Apple en Estados Unidos colocó a Muse de Meta como la app gratuita número 1 para iPhone, por delante de ChatGPT en el puesto 2.
Meta lanzó Muse el 8 de septiembre como un agente personal de IA diseñado para encargarse de tareas como correos electrónicos, planificación de viajes y compras. La empresa afirma que los usuarios controlan el acceso a los servicios conectados y aprueban acciones sensibles, incluidas el envío de mensajes o la realización de compras. Combina acceso gratuito con opciones de suscripción de pago.
Mi opinión: Este ranking le da a Meta una gran ventaja inicial en la competencia por el uso cotidiano de la IA. La prueba comercial más grande es si las personas siguen delegando tareas útiles después de que se desvanezca la emoción del lanzamiento.
Para los inversores, con el tiempo importarán el uso repetido, la finalización exitosa de tareas y la conversión a pago. Un ranking regional de apps ofrece una señal temprana; la adopción sostenida requiere evidencia a lo largo de varios meses.
Un agente que gestione compras o mensajes también necesita permisos claros y una recuperación fiable cuando algo sale mal. Conectar más servicios crea oportunidades, pero esas conexiones deben ahorrar suficiente tiempo como para convertirse en un hábito.
¿Qué te haría usar un agente de IA todos los días: la fiabilidad, la comodidad o el precio?
#MuseOvertakesChatGPTAsTopFreeIOSApp #Aİ #Meta
$MUBARAK $NIL $KERNEL
{future}(KERNELUSDT)
{future}(NILUSDT)
{future}(MUBARAKUSDT)
#museovertakeschatgptastopfreeiosapp
Muse supera a ChatGPT en el ranking de iPhone en EE. UU.
La carrera de la IA para consumidores tiene un nuevo líder en el ranking.
El 22 de septiembre de 2026, la App Store de Apple en Estados Unidos colocó a Muse de Meta como la app gratuita número 1 para iPhone, por delante de ChatGPT en el puesto 2.
Meta lanzó Muse el 8 de septiembre como un agente personal de IA diseñado para encargarse de tareas como correos electrónicos, planificación de viajes y compras. La empresa afirma que los usuarios controlan el acceso a los servicios conectados y aprueban acciones sensibles, incluidas el envío de mensajes o la realización de compras. Combina acceso gratuito con opciones de suscripción de pago.
Mi opinión: Este ranking le da a Meta una gran ventaja inicial en la competencia por el uso cotidiano de la IA. La prueba comercial más grande es si las personas siguen delegando tareas útiles después de que se desvanezca la emoción del lanzamiento.
Para los inversores, con el tiempo importarán el uso repetido, la finalización exitosa de tareas y la conversión a pago. Un ranking regional de apps ofrece una señal temprana; la adopción sostenida requiere evidencia a lo largo de varios meses.
Un agente que gestione compras o mensajes también necesita permisos claros y una recuperación fiable cuando algo sale mal. Conectar más servicios crea oportunidades, pero esas conexiones deben ahorrar suficiente tiempo como para convertirse en un hábito.
¿Qué te haría usar un agente de IA todos los días: la fiabilidad, la comodidad o el precio?
#MuseOvertakesChatGPTAsTopFreeIOSApp #Aİ #Meta
$MUBARAK $NIL $KERNEL
Muse supera a ChatGPT en el ranking de iPhone en EE. UU.
La carrera de la IA para consumidores tiene un nuevo líder en el ranking.
El 22 de septiembre de 2026, la App Store de Apple en Estados Unidos colocó a Muse de Meta como la app gratuita número 1 para iPhone, por delante de ChatGPT en el puesto 2.
Meta lanzó Muse el 8 de septiembre como un agente personal de IA diseñado para encargarse de tareas como correos electrónicos, planificación de viajes y compras. La empresa afirma que los usuarios controlan el acceso a los servicios conectados y aprueban acciones sensibles, incluidas el envío de mensajes o la realización de compras. Combina acceso gratuito con opciones de suscripción de pago.
Mi opinión: Este ranking le da a Meta una gran ventaja inicial en la competencia por el uso cotidiano de la IA. La prueba comercial más grande es si las personas siguen delegando tareas útiles después de que se desvanezca la emoción del lanzamiento.
Para los inversores, con el tiempo importarán el uso repetido, la finalización exitosa de tareas y la conversión a pago. Un ranking regional de apps ofrece una señal temprana; la adopción sostenida requiere evidencia a lo largo de varios meses.
Un agente que gestione compras o mensajes también necesita permisos claros y una recuperación fiable cuando algo sale mal. Conectar más servicios crea oportunidades, pero esas conexiones deben ahorrar suficiente tiempo como para convertirse en un hábito.
¿Qué te haría usar un agente de IA todos los días: la fiabilidad, la comodidad o el precio?
#MuseOvertakesChatGPTAsTopFreeIOSApp #Aİ #Meta
$MUBARAK $NIL $KERNEL

1.1k
·
--
Alcista
Verificado
#tokenizedstockplatformscouldlaunchnextquarter
🏛️ Las acciones tokenizadas se acercan a la negociación onchain regulada
El puente entre las acciones tradicionales y los mercados blockchain podría volverse mucho más concreto el próximo trimestre.
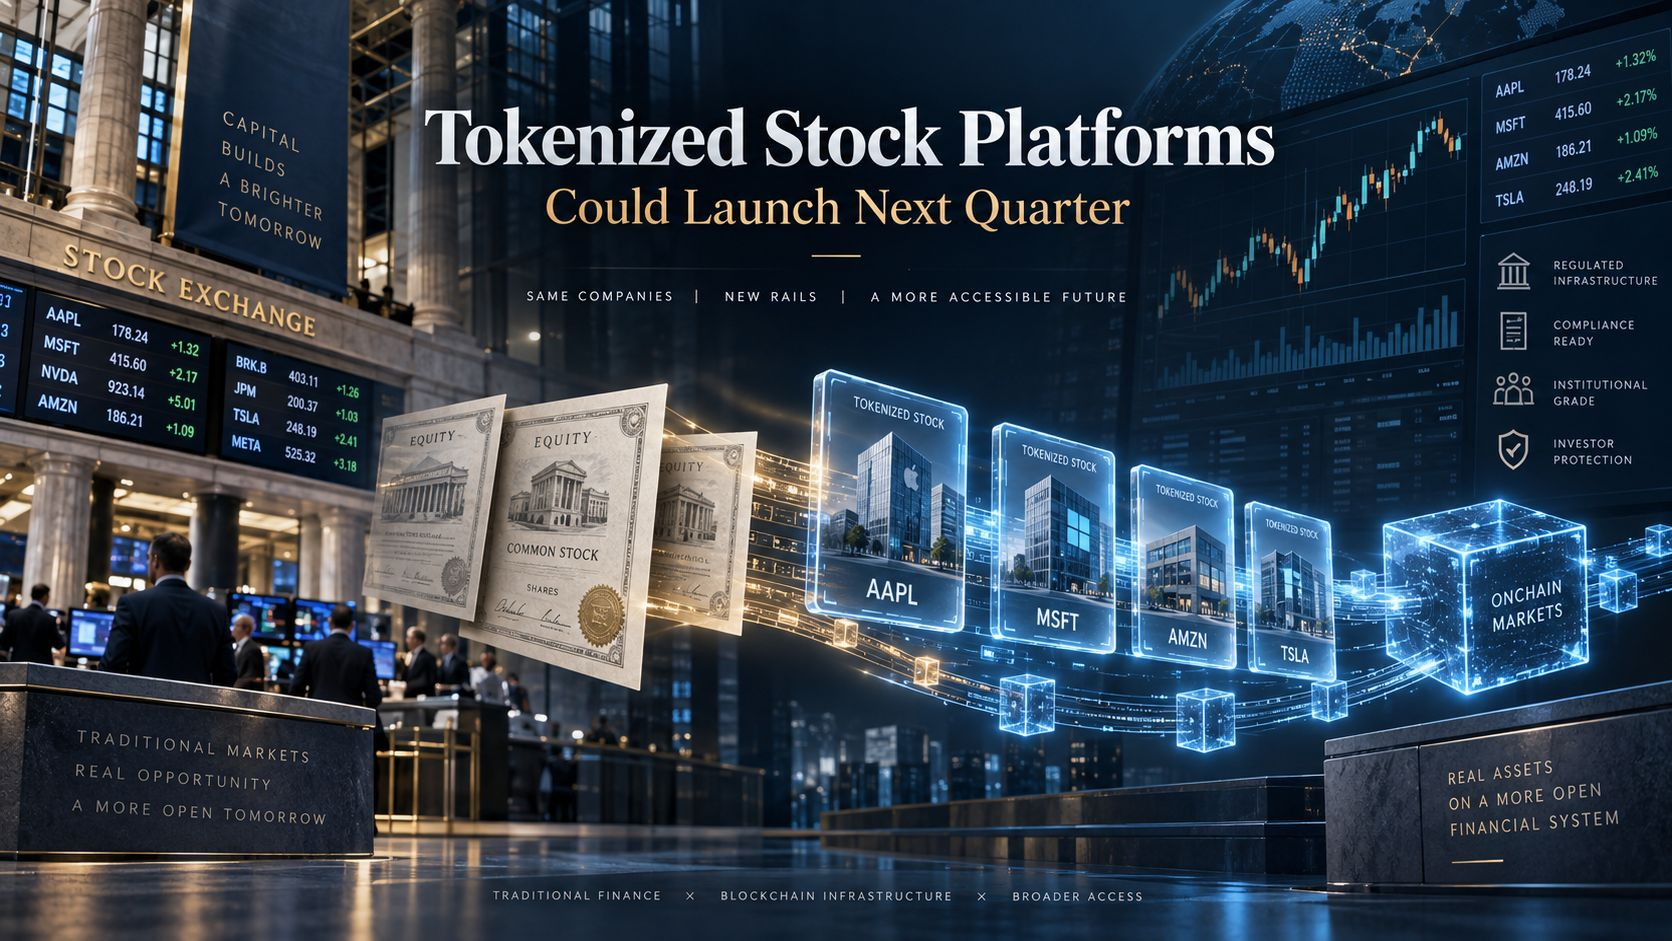
Un alto funcionario del Grupo de Trabajo Cripto de la SEC dijo que las empresas interesadas podrían empezar a publicar avisos operativos para los Centros de Valores Tokenizados (TSVs) en el próximo trimestre. Los comentarios siguen a la nueva “Exención de Innovación” temporal de la SEC, que permite que los centros que cumplan los requisitos faciliten la negociación de acciones tokenizadas cotizadas en EE. UU. mediante “market makers” automatizados y pools de liquidez autorizados.
Importante: el marco no es un “todo vale”. Las acciones tokenizadas elegibles deben representar los valores subyacentes y conservar derechos como dividendos y voto. Además, las plataformas deben cumplir condiciones de transparencia, acceso, mantenimiento de registros y volumen de negociación.
Por qué importa:
Si las empresas empiezan a pasar de la aprobación regulatoria hacia una infraestructura real, las acciones tokenizadas podrían convertirse en una parte más visible del mercado de activos del mundo real. La gran pregunta será si estos centros pueden atraer liquidez significativa mientras cumplen con las protecciones tradicionales de los mercados de valores.
Por ahora, el próximo trimestre podría revelar quién está realmente preparado para construir bajo el nuevo marco, en lugar de solo quién está interesado en la tokenización.
¿Qué influirá más para la adopción: el acceso 24/7, la liquidación más rápida o una liquidez onchain más profunda?
$MUBARAK $NIL $FLOCK
{future}(FLOCKUSDT)
{future}(NILUSDT)
{future}(MUBARAKUSDT)
#tokenizedstockplatformscouldlaunchnextquarter
🏛️ Las acciones tokenizadas se acercan a la negociación onchain regulada
El puente entre las acciones tradicionales y los mercados blockchain podría volverse mucho más concreto el próximo trimestre.
Un alto funcionario del Grupo de Trabajo Cripto de la SEC dijo que las empresas interesadas podrían empezar a publicar avisos operativos para los Centros de Valores Tokenizados (TSVs) en el próximo trimestre. Los comentarios siguen a la nueva “Exención de Innovación” temporal de la SEC, que permite que los centros que cumplan los requisitos faciliten la negociación de acciones tokenizadas cotizadas en EE. UU. mediante “market makers” automatizados y pools de liquidez autorizados.
Importante: el marco no es un “todo vale”. Las acciones tokenizadas elegibles deben representar los valores subyacentes y conservar derechos como dividendos y voto. Además, las plataformas deben cumplir condiciones de transparencia, acceso, mantenimiento de registros y volumen de negociación.
Por qué importa:
Si las empresas empiezan a pasar de la aprobación regulatoria hacia una infraestructura real, las acciones tokenizadas podrían convertirse en una parte más visible del mercado de activos del mundo real. La gran pregunta será si estos centros pueden atraer liquidez significativa mientras cumplen con las protecciones tradicionales de los mercados de valores.
Por ahora, el próximo trimestre podría revelar quién está realmente preparado para construir bajo el nuevo marco, en lugar de solo quién está interesado en la tokenización.
¿Qué influirá más para la adopción: el acceso 24/7, la liquidación más rápida o una liquidez onchain más profunda?
$MUBARAK $NIL $FLOCK
🏛️ Las acciones tokenizadas se acercan a la negociación onchain regulada
El puente entre las acciones tradicionales y los mercados blockchain podría volverse mucho más concreto el próximo trimestre.
Un alto funcionario del Grupo de Trabajo Cripto de la SEC dijo que las empresas interesadas podrían empezar a publicar avisos operativos para los Centros de Valores Tokenizados (TSVs) en el próximo trimestre. Los comentarios siguen a la nueva “Exención de Innovación” temporal de la SEC, que permite que los centros que cumplan los requisitos faciliten la negociación de acciones tokenizadas cotizadas en EE. UU. mediante “market makers” automatizados y pools de liquidez autorizados.
Importante: el marco no es un “todo vale”. Las acciones tokenizadas elegibles deben representar los valores subyacentes y conservar derechos como dividendos y voto. Además, las plataformas deben cumplir condiciones de transparencia, acceso, mantenimiento de registros y volumen de negociación.
Por qué importa:
Si las empresas empiezan a pasar de la aprobación regulatoria hacia una infraestructura real, las acciones tokenizadas podrían convertirse en una parte más visible del mercado de activos del mundo real. La gran pregunta será si estos centros pueden atraer liquidez significativa mientras cumplen con las protecciones tradicionales de los mercados de valores.
Por ahora, el próximo trimestre podría revelar quién está realmente preparado para construir bajo el nuevo marco, en lugar de solo quién está interesado en la tokenización.
¿Qué influirá más para la adopción: el acceso 24/7, la liquidación más rápida o una liquidez onchain más profunda?
$MUBARAK $NIL $FLOCK
1
654
·
--
Alcista
Verificado
#strategyadds950bitcoin
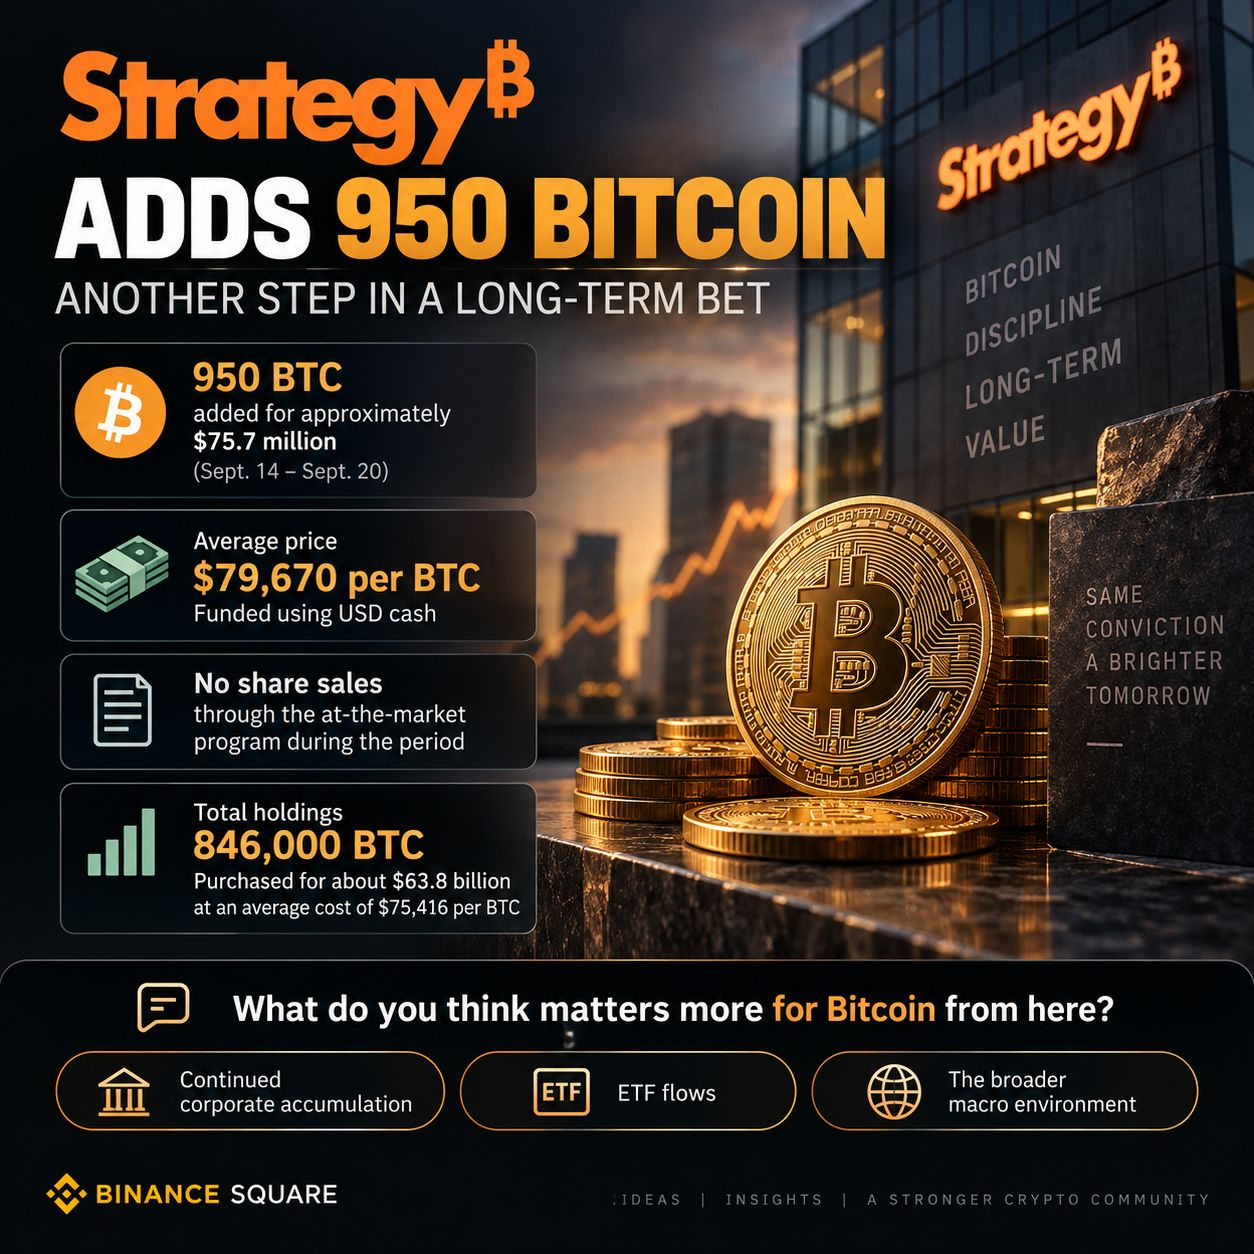
🟠 La estrategia vuelve a comprar Bitcoin — 950 BTC añadidos
Strategy ha regresado a la acumulación de Bitcoin, añadiendo 950 BTC por aproximadamente $75,7 millones entre el 14 de septiembre y el 20 de septiembre.
Según el último informe de la SEC de la empresa, la compra se realizó a un precio promedio de aproximadamente $79,670 por BTC y se financió con efectivo en USD. Strategy no vendió acciones mediante su programa de mercado durante el período.
La adquisición eleva las tenencias totales de Strategy a 846,000 BTC, comprados por alrededor de $63.8 mil millones a un costo promedio de aproximadamente $75,416 por Bitcoin.
Por qué es importante:
Strategy sigue siendo uno de los mayores tenedores corporativos de Bitcoin, por lo que los movimientos de su tesorería se observan de cerca como una señal de la convicción institucional. La empresa había pasado varias semanas sin añadir BTC, lo que hace que este regreso a la acumulación sea especialmente notable.
Al mismo tiempo, una sola compra corporativa no determina la dirección más amplia de Bitcoin. Las condiciones macro, las entradas/salidas de los ETF, la liquidez y la demanda general de los inversores seguirán desempeñando un papel importante.
¿Qué crees que importa más para Bitcoin a partir de aquí: la acumulación corporativa continua, los flujos de los ETF o el entorno macro más amplio?
$BTC $ETH $XRP
{future}(XRPUSDT)
{future}(ETHUSDT)
{future}(BTCUSDT)
#strategyadds950bitcoin
🟠 La estrategia vuelve a comprar Bitcoin — 950 BTC añadidos
Strategy ha regresado a la acumulación de Bitcoin, añadiendo 950 BTC por aproximadamente $75,7 millones entre el 14 de septiembre y el 20 de septiembre.
Según el último informe de la SEC de la empresa, la compra se realizó a un precio promedio de aproximadamente $79,670 por BTC y se financió con efectivo en USD. Strategy no vendió acciones mediante su programa de mercado durante el período.
La adquisición eleva las tenencias totales de Strategy a 846,000 BTC, comprados por alrededor de $63.8 mil millones a un costo promedio de aproximadamente $75,416 por Bitcoin.
Por qué es importante:
Strategy sigue siendo uno de los mayores tenedores corporativos de Bitcoin, por lo que los movimientos de su tesorería se observan de cerca como una señal de la convicción institucional. La empresa había pasado varias semanas sin añadir BTC, lo que hace que este regreso a la acumulación sea especialmente notable.
Al mismo tiempo, una sola compra corporativa no determina la dirección más amplia de Bitcoin. Las condiciones macro, las entradas/salidas de los ETF, la liquidez y la demanda general de los inversores seguirán desempeñando un papel importante.
¿Qué crees que importa más para Bitcoin a partir de aquí: la acumulación corporativa continua, los flujos de los ETF o el entorno macro más amplio?
$BTC $ETH $XRP
🟠 La estrategia vuelve a comprar Bitcoin — 950 BTC añadidos
Strategy ha regresado a la acumulación de Bitcoin, añadiendo 950 BTC por aproximadamente $75,7 millones entre el 14 de septiembre y el 20 de septiembre.
Según el último informe de la SEC de la empresa, la compra se realizó a un precio promedio de aproximadamente $79,670 por BTC y se financió con efectivo en USD. Strategy no vendió acciones mediante su programa de mercado durante el período.
La adquisición eleva las tenencias totales de Strategy a 846,000 BTC, comprados por alrededor de $63.8 mil millones a un costo promedio de aproximadamente $75,416 por Bitcoin.
Por qué es importante:
Strategy sigue siendo uno de los mayores tenedores corporativos de Bitcoin, por lo que los movimientos de su tesorería se observan de cerca como una señal de la convicción institucional. La empresa había pasado varias semanas sin añadir BTC, lo que hace que este regreso a la acumulación sea especialmente notable.
Al mismo tiempo, una sola compra corporativa no determina la dirección más amplia de Bitcoin. Las condiciones macro, las entradas/salidas de los ETF, la liquidez y la demanda general de los inversores seguirán desempeñando un papel importante.
¿Qué crees que importa más para Bitcoin a partir de aquí: la acumulación corporativa continua, los flujos de los ETF o el entorno macro más amplio?
$BTC $ETH $XRP
1.1k
·
--
#aistockswhatnext
🤖 Las acciones de IA son solo una parte del auge de la IA
Las acciones de IA han estado recibiendo la mayor atención últimamente.
NVIDIA, fabricantes de chips, empresas de la nube: ahí es donde está ocurriendo gran parte de la conversación.
Pero sigo volviendo a una pregunta diferente:
¿Qué pasa con todo lo que rodea a la IA si este gasto sigue creciendo?
Los últimos resultados de NVIDIA nos dan una idea de la magnitud. La empresa reportó 96.2 mil millones de dólares en ingresos trimestrales, mientras que su negocio de Centros de Datos generó 89 mil millones, un 117% más que el año anterior.
Y las GPU no operan de forma aislada.
🔹 Energía: los centros de datos de IA requieren cantidades enormes de electricidad.
🔹 Enfriamiento: más cómputo significa más calor, lo que crea demanda de infraestructura de refrigeración.
🔹 Redes: miles de chips necesitan comunicarse rápidamente, lo que aumenta la presión sobre las redes de alta velocidad.
🔹 Equipos de semiconductores: los chips más avanzados también requieren la maquinaria y la infraestructura usadas para fabricarlos.
Por eso creo que la historia de la IA es más grande que simplemente observar acciones de IA.
Hay todo un ecosistema que respalda la expansión: desde electricidad y refrigeración hasta redes y fabricación de semiconductores.
Por supuesto, hay otra cara de la historia. El gasto en infraestructura de IA se ha estado moviendo a un ritmo enorme y, si con el tiempo las empresas reducen su gasto, partes de ese ecosistema podrían sentir el impacto.
Así que la pregunta que estoy observando es:
¿El auge de la IA sigue expandiéndose por la cadena de infraestructura, o el gasto eventualmente empieza a enfriarse?
¿Qué parte del ecosistema de IA estás siguiendo?
#AIStocksWhatNext
No es asesoramiento financiero. Haz tu propia investigación antes de tomar decisiones de inversión.
#aistockswhatnext
🤖 Las acciones de IA son solo una parte del auge de la IA
Las acciones de IA han estado recibiendo la mayor atención últimamente.
NVIDIA, fabricantes de chips, empresas de la nube: ahí es donde está ocurriendo gran parte de la conversación.
Pero sigo volviendo a una pregunta diferente:
¿Qué pasa con todo lo que rodea a la IA si este gasto sigue creciendo?
Los últimos resultados de NVIDIA nos dan una idea de la magnitud. La empresa reportó 96.2 mil millones de dólares en ingresos trimestrales, mientras que su negocio de Centros de Datos generó 89 mil millones, un 117% más que el año anterior.
Y las GPU no operan de forma aislada.
🔹 Energía: los centros de datos de IA requieren cantidades enormes de electricidad.
🔹 Enfriamiento: más cómputo significa más calor, lo que crea demanda de infraestructura de refrigeración.
🔹 Redes: miles de chips necesitan comunicarse rápidamente, lo que aumenta la presión sobre las redes de alta velocidad.
🔹 Equipos de semiconductores: los chips más avanzados también requieren la maquinaria y la infraestructura usadas para fabricarlos.
Por eso creo que la historia de la IA es más grande que simplemente observar acciones de IA.
Hay todo un ecosistema que respalda la expansión: desde electricidad y refrigeración hasta redes y fabricación de semiconductores.
Por supuesto, hay otra cara de la historia. El gasto en infraestructura de IA se ha estado moviendo a un ritmo enorme y, si con el tiempo las empresas reducen su gasto, partes de ese ecosistema podrían sentir el impacto.
Así que la pregunta que estoy observando es:
¿El auge de la IA sigue expandiéndose por la cadena de infraestructura, o el gasto eventualmente empieza a enfriarse?
¿Qué parte del ecosistema de IA estás siguiendo?
#AIStocksWhatNext
No es asesoramiento financiero. Haz tu propia investigación antes de tomar decisiones de inversión.
🤖 Las acciones de IA son solo una parte del auge de la IA
Las acciones de IA han estado recibiendo la mayor atención últimamente.
NVIDIA, fabricantes de chips, empresas de la nube: ahí es donde está ocurriendo gran parte de la conversación.
Pero sigo volviendo a una pregunta diferente:
¿Qué pasa con todo lo que rodea a la IA si este gasto sigue creciendo?
Los últimos resultados de NVIDIA nos dan una idea de la magnitud. La empresa reportó 96.2 mil millones de dólares en ingresos trimestrales, mientras que su negocio de Centros de Datos generó 89 mil millones, un 117% más que el año anterior.
Y las GPU no operan de forma aislada.
🔹 Energía: los centros de datos de IA requieren cantidades enormes de electricidad.
🔹 Enfriamiento: más cómputo significa más calor, lo que crea demanda de infraestructura de refrigeración.
🔹 Redes: miles de chips necesitan comunicarse rápidamente, lo que aumenta la presión sobre las redes de alta velocidad.
🔹 Equipos de semiconductores: los chips más avanzados también requieren la maquinaria y la infraestructura usadas para fabricarlos.
Por eso creo que la historia de la IA es más grande que simplemente observar acciones de IA.
Hay todo un ecosistema que respalda la expansión: desde electricidad y refrigeración hasta redes y fabricación de semiconductores.
Por supuesto, hay otra cara de la historia. El gasto en infraestructura de IA se ha estado moviendo a un ritmo enorme y, si con el tiempo las empresas reducen su gasto, partes de ese ecosistema podrían sentir el impacto.
Así que la pregunta que estoy observando es:
¿El auge de la IA sigue expandiéndose por la cadena de infraestructura, o el gasto eventualmente empieza a enfriarse?
¿Qué parte del ecosistema de IA estás siguiendo?
#AIStocksWhatNext
No es asesoramiento financiero. Haz tu propia investigación antes de tomar decisiones de inversión.

98
·
--
Alcista
Verificado
#cardanoaddedtox402kitforadapayments
🤖 Cardano se está moviendo hacia la capa de pagos impulsados por IA
Cardano se ha integrado en el SDK x402, abriendo una nueva ruta para que aplicaciones y agentes de IA realicen pagos nativos de HTTP usando ADA y Cardano Native Tokens (CNTs).
x402 es un estándar de pagos abierto construido alrededor de la respuesta HTTP 402 “Payment Required” (Pago requerido). La idea es simple: en lugar de enviar a los usuarios por flujos de pago tradicionales, el software puede solicitar un servicio, recibir instrucciones de pago, liquidar on-chain y continuar automáticamente.
Para Cardano, esto es importante porque amplía el potencial de ADA más allá de las transferencias y DeFi hacia pagos de máquina a máquina, APIs pagadas, servicios de agentes de IA y comercio digital automatizado.
Aún existe una distinción importante entre integración y adopción. El facilitador de x402 de Cardano ha demostrado transacciones de extremo a extremo en preprod, mientras que su documentación indica que la operación en mainnet todavía no se ha probado a través de esa implementación.
Así que la historia más grande puede no ser la integración en sí, sino lo que los desarrolladores realmente construyen con ella.
¿Podrían los pagos impulsados por IA convertirse en una nueva utilidad significativa para Cardano, o el uso real tardará más en emerger?
#Cardano #x402 #Aİ #CryptoPayments
$MUBARAK $AKE $AGT
{future}(AGTUSDT)
{future}(AKEUSDT)
{future}(MUBARAKUSDT)
#cardanoaddedtox402kitforadapayments
🤖 Cardano se está moviendo hacia la capa de pagos impulsados por IA
Cardano se ha integrado en el SDK x402, abriendo una nueva ruta para que aplicaciones y agentes de IA realicen pagos nativos de HTTP usando ADA y Cardano Native Tokens (CNTs).
x402 es un estándar de pagos abierto construido alrededor de la respuesta HTTP 402 “Payment Required” (Pago requerido). La idea es simple: en lugar de enviar a los usuarios por flujos de pago tradicionales, el software puede solicitar un servicio, recibir instrucciones de pago, liquidar on-chain y continuar automáticamente.
Para Cardano, esto es importante porque amplía el potencial de ADA más allá de las transferencias y DeFi hacia pagos de máquina a máquina, APIs pagadas, servicios de agentes de IA y comercio digital automatizado.
Aún existe una distinción importante entre integración y adopción. El facilitador de x402 de Cardano ha demostrado transacciones de extremo a extremo en preprod, mientras que su documentación indica que la operación en mainnet todavía no se ha probado a través de esa implementación.
Así que la historia más grande puede no ser la integración en sí, sino lo que los desarrolladores realmente construyen con ella.
¿Podrían los pagos impulsados por IA convertirse en una nueva utilidad significativa para Cardano, o el uso real tardará más en emerger?
#Cardano #x402 #Aİ #CryptoPayments
$MUBARAK $AKE $AGT
🤖 Cardano se está moviendo hacia la capa de pagos impulsados por IA
Cardano se ha integrado en el SDK x402, abriendo una nueva ruta para que aplicaciones y agentes de IA realicen pagos nativos de HTTP usando ADA y Cardano Native Tokens (CNTs).
x402 es un estándar de pagos abierto construido alrededor de la respuesta HTTP 402 “Payment Required” (Pago requerido). La idea es simple: en lugar de enviar a los usuarios por flujos de pago tradicionales, el software puede solicitar un servicio, recibir instrucciones de pago, liquidar on-chain y continuar automáticamente.
Para Cardano, esto es importante porque amplía el potencial de ADA más allá de las transferencias y DeFi hacia pagos de máquina a máquina, APIs pagadas, servicios de agentes de IA y comercio digital automatizado.
Aún existe una distinción importante entre integración y adopción. El facilitador de x402 de Cardano ha demostrado transacciones de extremo a extremo en preprod, mientras que su documentación indica que la operación en mainnet todavía no se ha probado a través de esa implementación.
Así que la historia más grande puede no ser la integración en sí, sino lo que los desarrolladores realmente construyen con ella.
¿Podrían los pagos impulsados por IA convertirse en una nueva utilidad significativa para Cardano, o el uso real tardará más en emerger?
#Cardano #x402 #Aİ #CryptoPayments
$MUBARAK $AKE $AGT

1
544
·
--
Alcista
🚨 Los ETF de Bitcoin al contado agregan $999M — ¿Pueden continuar las entradas?
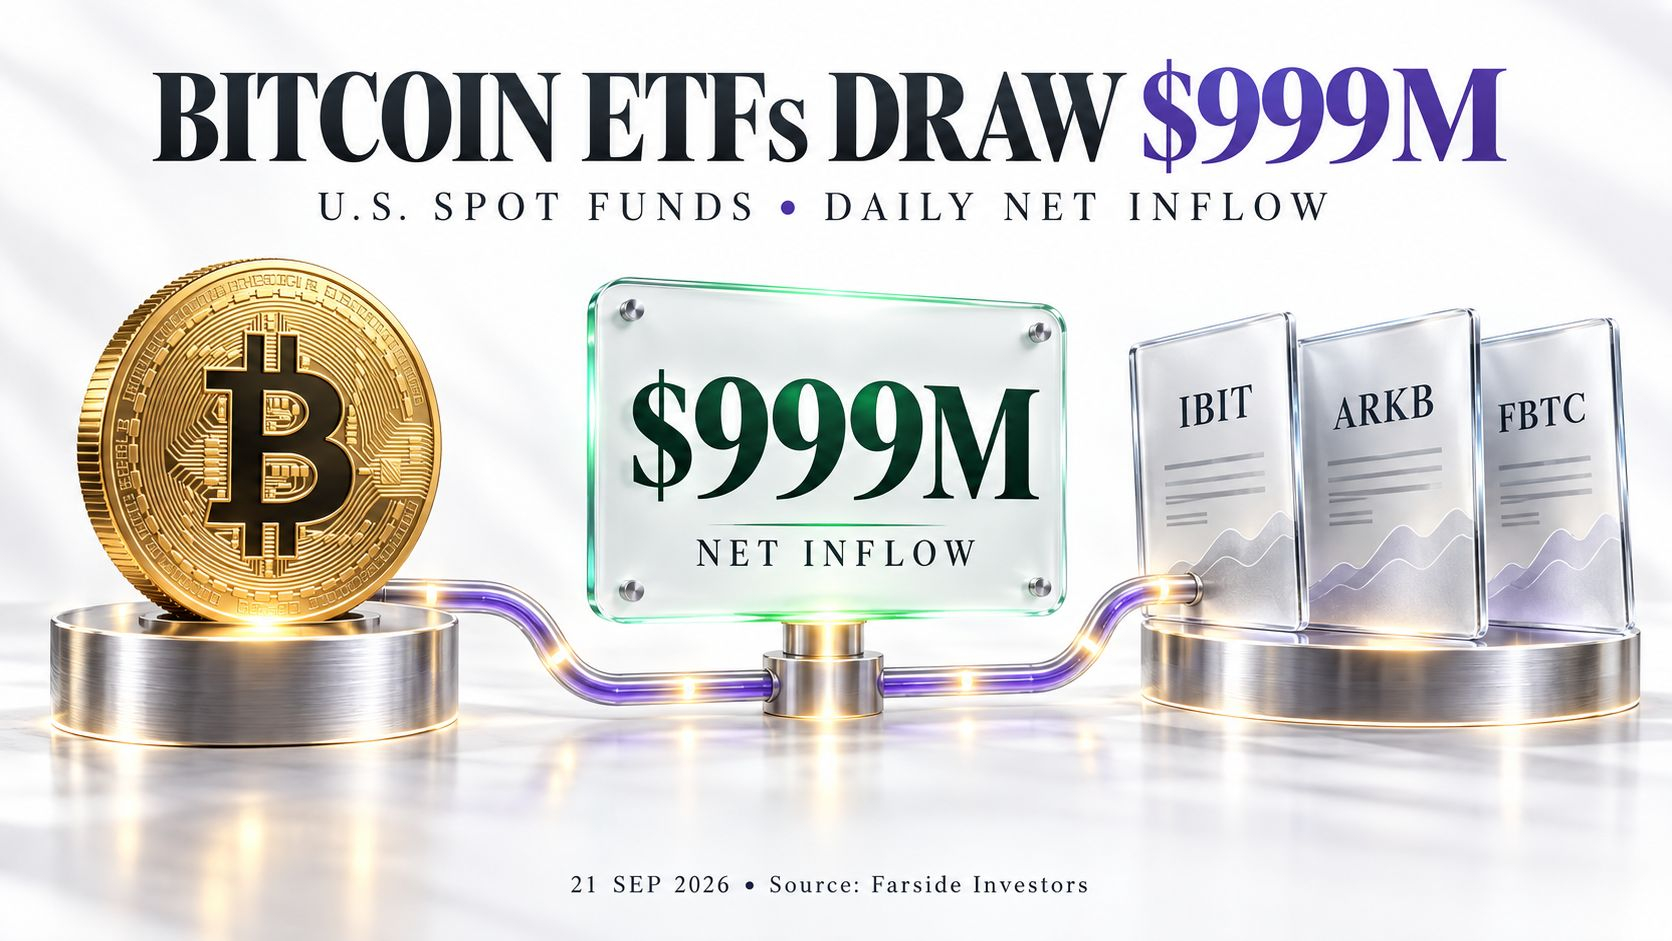
Casi $ 1 billón en entradas netas frescas vuelve a poner la demanda de Bitcoin en el centro de atención.
Los ETF de Bitcoin al contado en EE. UU. registraron $999 millones en entradas netas el 21 de septiembre de 2026, según Farside Investors.
Los mayores contribuyentes:
BlackRock’s IBIT: $381.4 millones
ARK/21Shares’ ARKB: $289.1 millones
Fidelity’s FBTC: $238.8 millones
Juntos, esos tres fondos aportaron aproximadamente el 91% del total diario.
Esto marcó la tercera sesión consecutiva de operaciones con resultados positivos, llevando las entradas netas combinadas del 17, 18 y 21 de septiembre a aproximadamente $1.59 billones.
Mi opinión: La parte más fuerte de este titular es la continuidad de los flujos positivos. Las suscripciones netas repetidas aportan más evidencia de una demanda sostenida que una sola sesión inusualmente intensa.
Pero la concentración importa. Con tres productos dominando el total, una participación más amplia fortalecería el panorama. Los flujos de los ETF tampoco pueden decirnos la identidad de cada comprador, el plazo de tenencia previsto ni las posiciones en otros lugares.
Las próximas señales útiles son si las entradas persisten, si más fondos contribuyen de forma significativa y cómo responde Bitcoin si las suscripciones se desaceleran. Una demanda sólida puede respaldar el mercado, pero el flujo de un solo día no establece un objetivo de precio.
¿Seguirá creciendo la demanda de ETF, o Bitcoin necesita otro catalizador?
#bitcoin #etf #BitcoinSpotETFs$999MNetInflow
$MUBARAK $BTC $AKE
{future}(AKEUSDT)
{future}(BTCUSDT)
{future}(MUBARAKUSDT)
🚨 Los ETF de Bitcoin al contado agregan $999M — ¿Pueden continuar las entradas?
Casi $ 1 billón en entradas netas frescas vuelve a poner la demanda de Bitcoin en el centro de atención.
Los ETF de Bitcoin al contado en EE. UU. registraron $999 millones en entradas netas el 21 de septiembre de 2026, según Farside Investors.
Los mayores contribuyentes:
BlackRock’s IBIT: $381.4 millones
ARK/21Shares’ ARKB: $289.1 millones
Fidelity’s FBTC: $238.8 millones
Juntos, esos tres fondos aportaron aproximadamente el 91% del total diario.
Esto marcó la tercera sesión consecutiva de operaciones con resultados positivos, llevando las entradas netas combinadas del 17, 18 y 21 de septiembre a aproximadamente $1.59 billones.
Mi opinión: La parte más fuerte de este titular es la continuidad de los flujos positivos. Las suscripciones netas repetidas aportan más evidencia de una demanda sostenida que una sola sesión inusualmente intensa.
Pero la concentración importa. Con tres productos dominando el total, una participación más amplia fortalecería el panorama. Los flujos de los ETF tampoco pueden decirnos la identidad de cada comprador, el plazo de tenencia previsto ni las posiciones en otros lugares.
Las próximas señales útiles son si las entradas persisten, si más fondos contribuyen de forma significativa y cómo responde Bitcoin si las suscripciones se desaceleran. Una demanda sólida puede respaldar el mercado, pero el flujo de un solo día no establece un objetivo de precio.
¿Seguirá creciendo la demanda de ETF, o Bitcoin necesita otro catalizador?
#bitcoin #etf #BitcoinSpotETFs$999MNetInflow
$MUBARAK $BTC $AKE
Casi $ 1 billón en entradas netas frescas vuelve a poner la demanda de Bitcoin en el centro de atención.
Los ETF de Bitcoin al contado en EE. UU. registraron $999 millones en entradas netas el 21 de septiembre de 2026, según Farside Investors.
Los mayores contribuyentes:
BlackRock’s IBIT: $381.4 millones
ARK/21Shares’ ARKB: $289.1 millones
Fidelity’s FBTC: $238.8 millones
Juntos, esos tres fondos aportaron aproximadamente el 91% del total diario.
Esto marcó la tercera sesión consecutiva de operaciones con resultados positivos, llevando las entradas netas combinadas del 17, 18 y 21 de septiembre a aproximadamente $1.59 billones.
Mi opinión: La parte más fuerte de este titular es la continuidad de los flujos positivos. Las suscripciones netas repetidas aportan más evidencia de una demanda sostenida que una sola sesión inusualmente intensa.
Pero la concentración importa. Con tres productos dominando el total, una participación más amplia fortalecería el panorama. Los flujos de los ETF tampoco pueden decirnos la identidad de cada comprador, el plazo de tenencia previsto ni las posiciones en otros lugares.
Las próximas señales útiles son si las entradas persisten, si más fondos contribuyen de forma significativa y cómo responde Bitcoin si las suscripciones se desaceleran. Una demanda sólida puede respaldar el mercado, pero el flujo de un solo día no establece un objetivo de precio.
¿Seguirá creciendo la demanda de ETF, o Bitcoin necesita otro catalizador?
#bitcoin #etf #BitcoinSpotETFs$999MNetInflow
$MUBARAK $BTC $AKE
1
64
·
--
Artículo
AMD supera los 1 billón de dólares — ¿Los resultados pueden seguir el ritmo?#AMDHits$1TrillionMarketCap
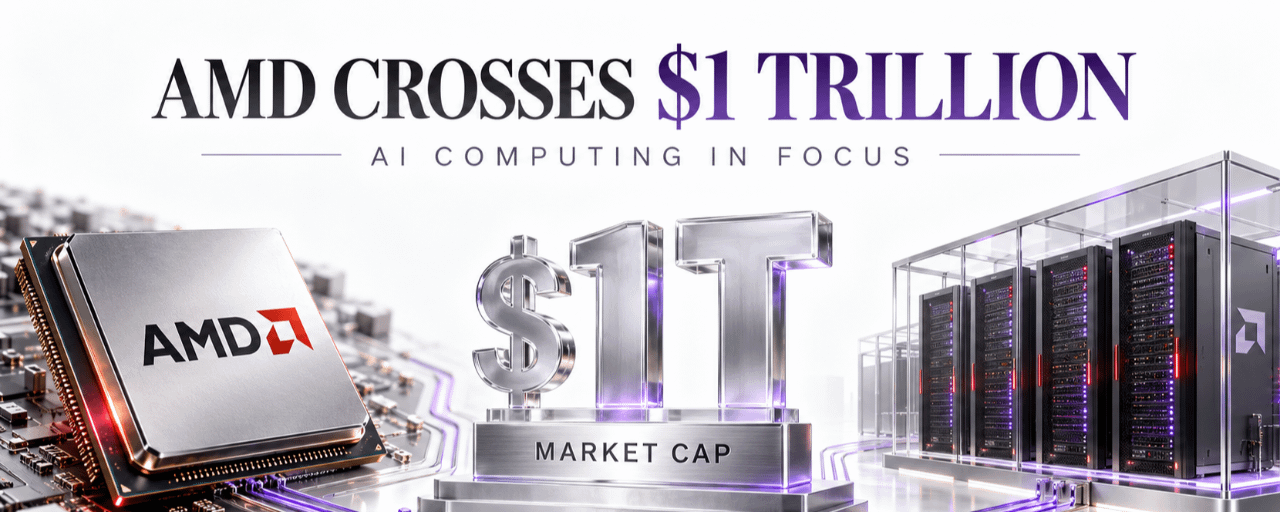
AMD supera los 1 billón de dólares — ¿Los resultados pueden seguir el ritmo?
AMD superó por primera vez los 1 billón de dólares en capitalización bursátil el 21 de septiembre de 2026. El informe intradía de Reuters mostró que las acciones subían un 9,6% hasta 613,31 dólares, mientras las cotizaciones de semiconductores avanzaban por un nuevo impulso del entusiasmo por la IA.
Los resultados operativos de la empresa ofrecen un contexto útil. En el segundo trimestre de 2026, AMD reportó 11.500 millones de dólares en ingresos, un 50% más interanual. Su negocio de centros de datos generó 6.700 millones de dólares, un 107% más, impulsado por la demanda de procesadores para servidores y aceleradores de IA.
AMD supera los 1 billón de dólares — ¿Los resultados pueden seguir el ritmo?
#AMDHits$1TrillionMarketCap
AMD supera los 1 billón de dólares — ¿Los resultados pueden seguir el ritmo?
AMD superó por primera vez los 1 billón de dólares en capitalización bursátil el 21 de septiembre de 2026. El informe intradía de Reuters mostró que las acciones subían un 9,6% hasta 613,31 dólares, mientras las cotizaciones de semiconductores avanzaban por un nuevo impulso del entusiasmo por la IA.
Los resultados operativos de la empresa ofrecen un contexto útil. En el segundo trimestre de 2026, AMD reportó 11.500 millones de dólares en ingresos, un 50% más interanual. Su negocio de centros de datos generó 6.700 millones de dólares, un 107% más, impulsado por la demanda de procesadores para servidores y aceleradores de IA.
AMD supera los 1 billón de dólares — ¿Los resultados pueden seguir el ritmo?
AMD superó por primera vez los 1 billón de dólares en capitalización bursátil el 21 de septiembre de 2026. El informe intradía de Reuters mostró que las acciones subían un 9,6% hasta 613,31 dólares, mientras las cotizaciones de semiconductores avanzaban por un nuevo impulso del entusiasmo por la IA.
Los resultados operativos de la empresa ofrecen un contexto útil. En el segundo trimestre de 2026, AMD reportó 11.500 millones de dólares en ingresos, un 50% más interanual. Su negocio de centros de datos generó 6.700 millones de dólares, un 107% más, impulsado por la demanda de procesadores para servidores y aceleradores de IA.
1
113
·
--
Alcista
#xrprises8%
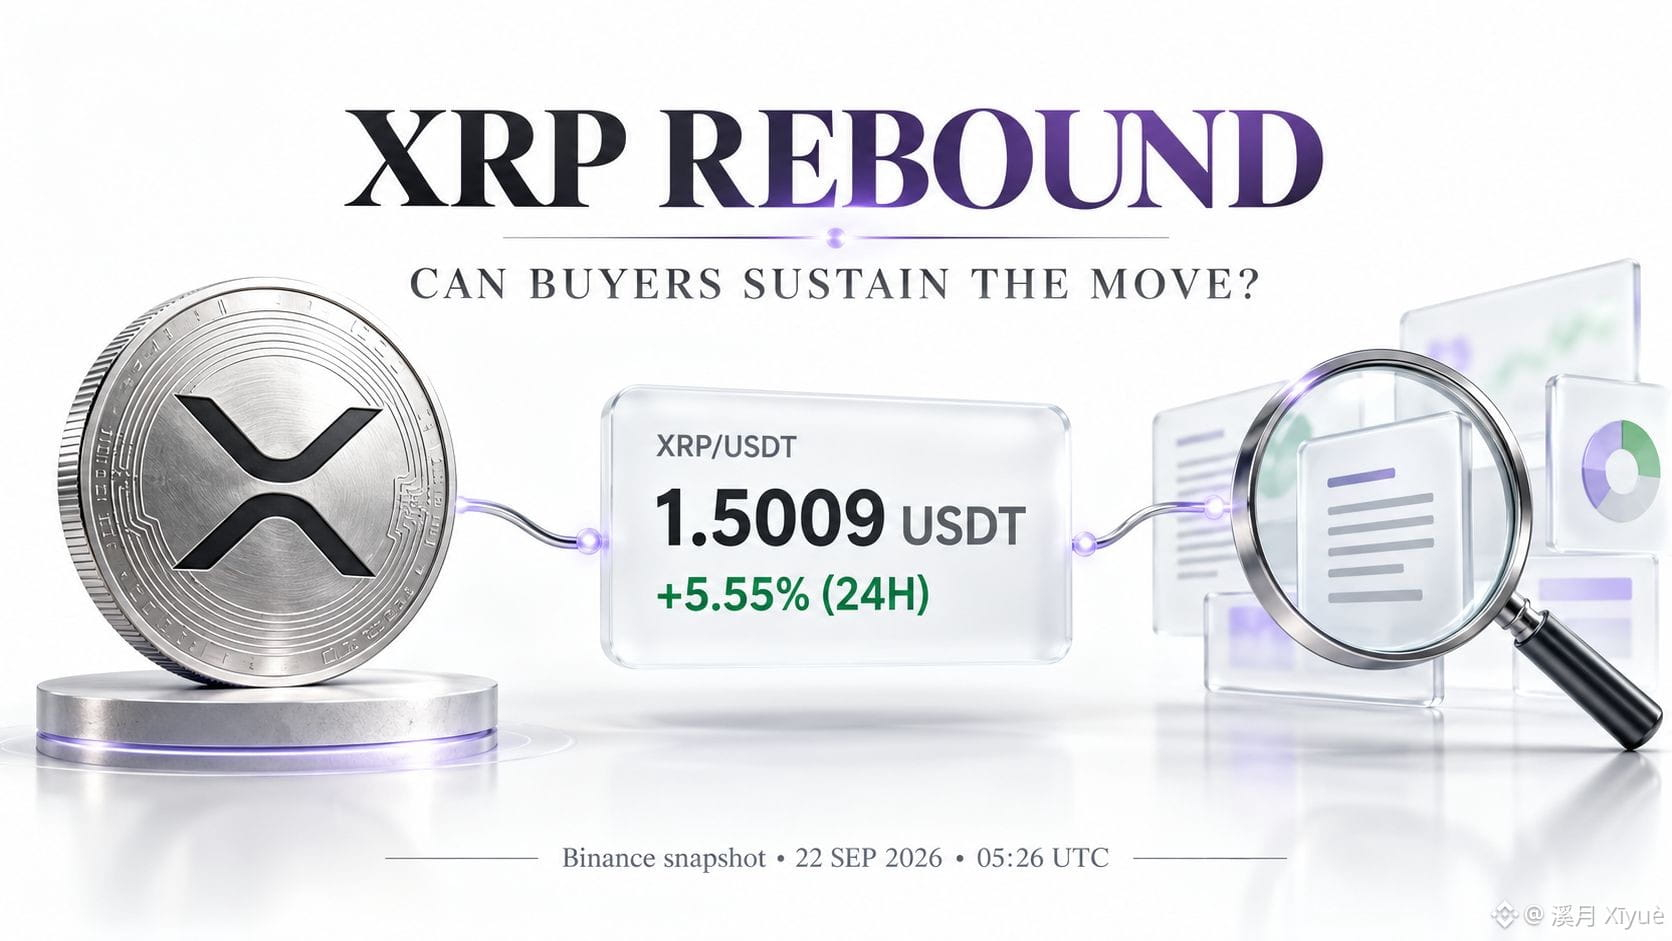
¿XRP cerca de 1,50 USDT — Los compradores podrán sostener el rebote?
La recuperación de XRP está atrayendo atención, y la instantánea más reciente de los exchanges le da algo de contexto.
A las 05:26 UTC del 22 de septiembre de 2026, Binance mostró XRP/USDT en 1,5009 USDT, con una subida del 5,55% en las 24 horas anteriores. La cifra de tendencia del 8% no coincide con esta instantánea en particular.
En esa misma ventana se registró un máximo de 1,5743, un mínimo de 1,4220 y aproximadamente 534,3 millones de USDT en volumen de operaciones en Binance.
Mi opinión: XRP sigue estando más alto durante el periodo medido, pero ha cedido parte del movimiento respecto a su máximo reciente. Eso hace que la capacidad del mercado para conservar las ganancias necesite una próxima prueba útil.
Una recuperación hacia 1,5743, respaldada por una actividad sostenida en spot, fortalecería el argumento de impulso. Los intentos de recuperación repetidos que atraen ventas rápidamente indicarían que los compradores aún enfrentan una resistencia significativa.
El dato de volumen también necesita contexto. Mide la actividad en un exchange y, sin un periodo de comparación, no puede establecer que el volumen esté acelerándose. Tampoco puede probar por sí solo la acumulación de ballenas o un short squeeze.
Yo observaría si el próximo retroceso se estabiliza y atrae una demanda renovada. Ese comportamiento daría una evidencia más sólida de durabilidad que el simple cambio de un porcentaje diario.
¿XRP consolida sus ganancias aquí o hace otro intento en el máximo reciente?
#XRPRises8% #xrp #CryptoMarkets
$AKE $XRP $MUBARAK
{future}(MUBARAKUSDT)
{future}(XRPUSDT)
{future}(AKEUSDT)
#xrprises8%
¿XRP cerca de 1,50 USDT — Los compradores podrán sostener el rebote?
La recuperación de XRP está atrayendo atención, y la instantánea más reciente de los exchanges le da algo de contexto.
A las 05:26 UTC del 22 de septiembre de 2026, Binance mostró XRP/USDT en 1,5009 USDT, con una subida del 5,55% en las 24 horas anteriores. La cifra de tendencia del 8% no coincide con esta instantánea en particular.
En esa misma ventana se registró un máximo de 1,5743, un mínimo de 1,4220 y aproximadamente 534,3 millones de USDT en volumen de operaciones en Binance.
Mi opinión: XRP sigue estando más alto durante el periodo medido, pero ha cedido parte del movimiento respecto a su máximo reciente. Eso hace que la capacidad del mercado para conservar las ganancias necesite una próxima prueba útil.
Una recuperación hacia 1,5743, respaldada por una actividad sostenida en spot, fortalecería el argumento de impulso. Los intentos de recuperación repetidos que atraen ventas rápidamente indicarían que los compradores aún enfrentan una resistencia significativa.
El dato de volumen también necesita contexto. Mide la actividad en un exchange y, sin un periodo de comparación, no puede establecer que el volumen esté acelerándose. Tampoco puede probar por sí solo la acumulación de ballenas o un short squeeze.
Yo observaría si el próximo retroceso se estabiliza y atrae una demanda renovada. Ese comportamiento daría una evidencia más sólida de durabilidad que el simple cambio de un porcentaje diario.
¿XRP consolida sus ganancias aquí o hace otro intento en el máximo reciente?
#XRPRises8% #xrp #CryptoMarkets
$AKE $XRP $MUBARAK
¿XRP cerca de 1,50 USDT — Los compradores podrán sostener el rebote?
La recuperación de XRP está atrayendo atención, y la instantánea más reciente de los exchanges le da algo de contexto.
A las 05:26 UTC del 22 de septiembre de 2026, Binance mostró XRP/USDT en 1,5009 USDT, con una subida del 5,55% en las 24 horas anteriores. La cifra de tendencia del 8% no coincide con esta instantánea en particular.
En esa misma ventana se registró un máximo de 1,5743, un mínimo de 1,4220 y aproximadamente 534,3 millones de USDT en volumen de operaciones en Binance.
Mi opinión: XRP sigue estando más alto durante el periodo medido, pero ha cedido parte del movimiento respecto a su máximo reciente. Eso hace que la capacidad del mercado para conservar las ganancias necesite una próxima prueba útil.
Una recuperación hacia 1,5743, respaldada por una actividad sostenida en spot, fortalecería el argumento de impulso. Los intentos de recuperación repetidos que atraen ventas rápidamente indicarían que los compradores aún enfrentan una resistencia significativa.
El dato de volumen también necesita contexto. Mide la actividad en un exchange y, sin un periodo de comparación, no puede establecer que el volumen esté acelerándose. Tampoco puede probar por sí solo la acumulación de ballenas o un short squeeze.
Yo observaría si el próximo retroceso se estabiliza y atrae una demanda renovada. Ese comportamiento daría una evidencia más sólida de durabilidad que el simple cambio de un porcentaje diario.
¿XRP consolida sus ganancias aquí o hace otro intento en el máximo reciente?
#XRPRises8% #xrp #CryptoMarkets
$AKE $XRP $MUBARAK
252
·
--
Alcista
#applegoogleseekstablecointokenizeddeposittalent
El reclutamiento de Web3 de Google y el papel de los pagos de Apple: qué se confirma
Las descripciones de puestos detrás de este titular revelan una diferencia importante.
La vacante de Google Cloud en Hong Kong para un Industry Principal Architect, Web3, enumera explícitamente entre sus calificaciones preferidas el conocimiento de pagos con stablecoins, depósitos tokenizados, tokenización de activos y custodia. El puesto atiende a clientes institucionales y de Web3 en toda Asia-Pacífico.
El anuncio del puesto de Apple como Apple Pay Financial Product Strategy Lead, fechado el 26 de agosto de 2026, se centra en Apple Card, Apple Cash y la estrategia de productos financieros. El listado actual que consulté no menciona stablecoins, depósitos tokenizados ni blockchain. Sus requisitos cripto afirmados siguen sin verificarse.
Mi opinión: los requisitos de Google sugieren demanda de especialistas capaces de conectar las finanzas institucionales con la infraestructura de blockchain. La vacante de Apple respalda una interpretación más amplia de la estrategia de pagos; una hoja de ruta específica de stablecoins requeriría más evidencia.
Para bancos y empresas, la adopción depende de una custodia segura, responsabilidades operativas claras e integración con los sistemas existentes. Las transferencias más rápidas tienen valor limitado si la conciliación, el cumplimiento o el reembolso siguen siendo difíciles.
Eso hace que las integraciones funcionales y los beneficios medibles para los clientes sean señales más útiles que los titulares de reclutamiento por sí solos. Estos listados tampoco confirman el lanzamiento de una nueva stablecoin emitida por la empresa ni su fecha.
¿Qué podría acelerar la adopción más: las integraciones de pagos para consumidores o la infraestructura institucional?
#AppleGoogleSeekStablecoinTokenizedDepositTalent #Stablecoins #Tokenization
$AKE $GOOGL.US $AAPL.US
{stock_us}(AAPL.US)
{stock_us}(GOOGL.US)
{future}(AKEUSDT)
#applegoogleseekstablecointokenizeddeposittalent
El reclutamiento de Web3 de Google y el papel de los pagos de Apple: qué se confirma
Las descripciones de puestos detrás de este titular revelan una diferencia importante.
La vacante de Google Cloud en Hong Kong para un Industry Principal Architect, Web3, enumera explícitamente entre sus calificaciones preferidas el conocimiento de pagos con stablecoins, depósitos tokenizados, tokenización de activos y custodia. El puesto atiende a clientes institucionales y de Web3 en toda Asia-Pacífico.
El anuncio del puesto de Apple como Apple Pay Financial Product Strategy Lead, fechado el 26 de agosto de 2026, se centra en Apple Card, Apple Cash y la estrategia de productos financieros. El listado actual que consulté no menciona stablecoins, depósitos tokenizados ni blockchain. Sus requisitos cripto afirmados siguen sin verificarse.
Mi opinión: los requisitos de Google sugieren demanda de especialistas capaces de conectar las finanzas institucionales con la infraestructura de blockchain. La vacante de Apple respalda una interpretación más amplia de la estrategia de pagos; una hoja de ruta específica de stablecoins requeriría más evidencia.
Para bancos y empresas, la adopción depende de una custodia segura, responsabilidades operativas claras e integración con los sistemas existentes. Las transferencias más rápidas tienen valor limitado si la conciliación, el cumplimiento o el reembolso siguen siendo difíciles.
Eso hace que las integraciones funcionales y los beneficios medibles para los clientes sean señales más útiles que los titulares de reclutamiento por sí solos. Estos listados tampoco confirman el lanzamiento de una nueva stablecoin emitida por la empresa ni su fecha.
¿Qué podría acelerar la adopción más: las integraciones de pagos para consumidores o la infraestructura institucional?
#AppleGoogleSeekStablecoinTokenizedDepositTalent #Stablecoins #Tokenization
$AKE $GOOGL.US $AAPL.US
El reclutamiento de Web3 de Google y el papel de los pagos de Apple: qué se confirma
Las descripciones de puestos detrás de este titular revelan una diferencia importante.
La vacante de Google Cloud en Hong Kong para un Industry Principal Architect, Web3, enumera explícitamente entre sus calificaciones preferidas el conocimiento de pagos con stablecoins, depósitos tokenizados, tokenización de activos y custodia. El puesto atiende a clientes institucionales y de Web3 en toda Asia-Pacífico.
El anuncio del puesto de Apple como Apple Pay Financial Product Strategy Lead, fechado el 26 de agosto de 2026, se centra en Apple Card, Apple Cash y la estrategia de productos financieros. El listado actual que consulté no menciona stablecoins, depósitos tokenizados ni blockchain. Sus requisitos cripto afirmados siguen sin verificarse.
Mi opinión: los requisitos de Google sugieren demanda de especialistas capaces de conectar las finanzas institucionales con la infraestructura de blockchain. La vacante de Apple respalda una interpretación más amplia de la estrategia de pagos; una hoja de ruta específica de stablecoins requeriría más evidencia.
Para bancos y empresas, la adopción depende de una custodia segura, responsabilidades operativas claras e integración con los sistemas existentes. Las transferencias más rápidas tienen valor limitado si la conciliación, el cumplimiento o el reembolso siguen siendo difíciles.
Eso hace que las integraciones funcionales y los beneficios medibles para los clientes sean señales más útiles que los titulares de reclutamiento por sí solos. Estos listados tampoco confirman el lanzamiento de una nueva stablecoin emitida por la empresa ni su fecha.
¿Qué podría acelerar la adopción más: las integraciones de pagos para consumidores o la infraestructura institucional?
#AppleGoogleSeekStablecoinTokenizedDepositTalent #Stablecoins #Tokenization
$AKE $GOOGL.US $AAPL.US
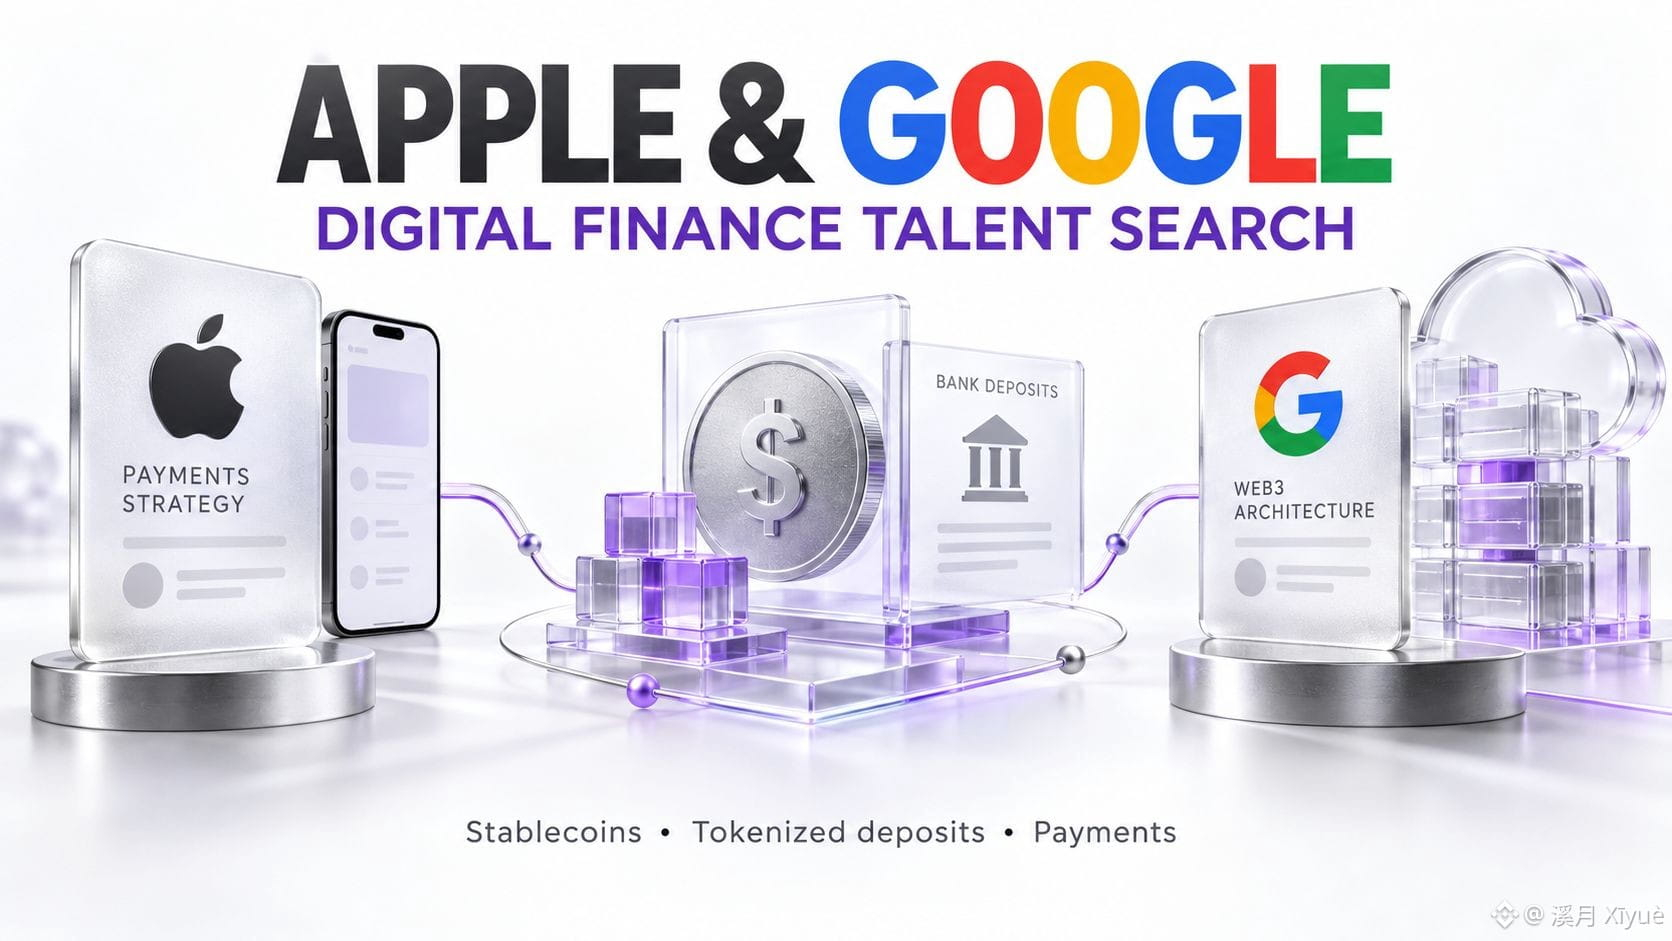
1
798
·
--
Alcista
#NvidiaToBuyAnother$1.5BSBEnergySharesPreIPO
Nvidia invierte otros 1.500 millones de dólares en SB Energy — con una condición de salida a bolsa
La expansión de la IA depende de tener la electricidad y los edificios listos junto con los chips.
El 21 de septiembre de 2026, SB Energy publicó una declaración SEC enmendada que indica que Nvidia se comprometió a comprar otros 1.500 millones de dólares en acciones sin derecho a voto al precio de la OPI. La compra está condicionada a la oferta y se espera que se cierre junto con la OPI, sujeto a condiciones habituales.
Por separado, Nvidia ya ha pagado por adelantado 1.500 millones de dólares bajo un contrato que se liquidará al completarse la OPI con acciones valoradas al 90% del precio de la oferta. En conjunto, los acuerdos suman 3.000 millones de dólares.
Mi opinión: La lógica estratégica está clara: las implementaciones de GPU necesitan terrenos, energía, refrigeración e instalaciones completadas. Invertir en el desarrollador de infraestructuras podría ayudar a Nvidia a alinear esos recursos con la demanda futura de chips.
Pero el acuerdo también vincula más capital de Nvidia al mismo ciclo de expansión de la IA. Los retrasos de construcción, las conexiones a la red, los costos de financiación y la demanda de los clientes importarán mucho después de que el titular de la inversión se desvanezca.
Yo vigilaría los términos finales de la OPI y los hitos de entrega del proyecto, especialmente si la capacidad anunciada se vuelve infraestructura utilizable a tiempo. Un compromiso de financiación respalda el desarrollo; la ejecución determina cuándo los clientes realmente pueden desplegar cómputo.
¿Podría la energía fiable volverse tan decisiva como el rendimiento de los chips en el crecimiento de la IA?
#NVIDIA #AIInfrastructure #DePINRevolution
$MUBARAK $AGT $AKE
{future}(AKEUSDT)
{future}(AGTUSDT)
{future}(MUBARAKUSDT)
#NvidiaToBuyAnother$1.5BSBEnergySharesPreIPO
Nvidia invierte otros 1.500 millones de dólares en SB Energy — con una condición de salida a bolsa
La expansión de la IA depende de tener la electricidad y los edificios listos junto con los chips.
El 21 de septiembre de 2026, SB Energy publicó una declaración SEC enmendada que indica que Nvidia se comprometió a comprar otros 1.500 millones de dólares en acciones sin derecho a voto al precio de la OPI. La compra está condicionada a la oferta y se espera que se cierre junto con la OPI, sujeto a condiciones habituales.
Por separado, Nvidia ya ha pagado por adelantado 1.500 millones de dólares bajo un contrato que se liquidará al completarse la OPI con acciones valoradas al 90% del precio de la oferta. En conjunto, los acuerdos suman 3.000 millones de dólares.
Mi opinión: La lógica estratégica está clara: las implementaciones de GPU necesitan terrenos, energía, refrigeración e instalaciones completadas. Invertir en el desarrollador de infraestructuras podría ayudar a Nvidia a alinear esos recursos con la demanda futura de chips.
Pero el acuerdo también vincula más capital de Nvidia al mismo ciclo de expansión de la IA. Los retrasos de construcción, las conexiones a la red, los costos de financiación y la demanda de los clientes importarán mucho después de que el titular de la inversión se desvanezca.
Yo vigilaría los términos finales de la OPI y los hitos de entrega del proyecto, especialmente si la capacidad anunciada se vuelve infraestructura utilizable a tiempo. Un compromiso de financiación respalda el desarrollo; la ejecución determina cuándo los clientes realmente pueden desplegar cómputo.
¿Podría la energía fiable volverse tan decisiva como el rendimiento de los chips en el crecimiento de la IA?
#NVIDIA #AIInfrastructure #DePINRevolution
$MUBARAK $AGT $AKE
Nvidia invierte otros 1.500 millones de dólares en SB Energy — con una condición de salida a bolsa
La expansión de la IA depende de tener la electricidad y los edificios listos junto con los chips.
El 21 de septiembre de 2026, SB Energy publicó una declaración SEC enmendada que indica que Nvidia se comprometió a comprar otros 1.500 millones de dólares en acciones sin derecho a voto al precio de la OPI. La compra está condicionada a la oferta y se espera que se cierre junto con la OPI, sujeto a condiciones habituales.
Por separado, Nvidia ya ha pagado por adelantado 1.500 millones de dólares bajo un contrato que se liquidará al completarse la OPI con acciones valoradas al 90% del precio de la oferta. En conjunto, los acuerdos suman 3.000 millones de dólares.
Mi opinión: La lógica estratégica está clara: las implementaciones de GPU necesitan terrenos, energía, refrigeración e instalaciones completadas. Invertir en el desarrollador de infraestructuras podría ayudar a Nvidia a alinear esos recursos con la demanda futura de chips.
Pero el acuerdo también vincula más capital de Nvidia al mismo ciclo de expansión de la IA. Los retrasos de construcción, las conexiones a la red, los costos de financiación y la demanda de los clientes importarán mucho después de que el titular de la inversión se desvanezca.
Yo vigilaría los términos finales de la OPI y los hitos de entrega del proyecto, especialmente si la capacidad anunciada se vuelve infraestructura utilizable a tiempo. Un compromiso de financiación respalda el desarrollo; la ejecución determina cuándo los clientes realmente pueden desplegar cómputo.
¿Podría la energía fiable volverse tan decisiva como el rendimiento de los chips en el crecimiento de la IA?
#NVIDIA #AIInfrastructure #DePINRevolution
$MUBARAK $AGT $AKE

292
·
--
Alcista
Verificado
#agoragetspreliminaryoccapprovalfortrustbank
Agora obtiene aprobación preliminar de la OCC — El plan bancario de EE. UU. de AUSD avanza
Agora ha asegurado una aprobación condicional preliminar para establecer Agora National Trust Bank en Nueva York. La decisión de la OCC está fechada el 18 de septiembre de 2026; Agora anunció el hito el 21 de septiembre.
El banco propuesto serviría a instituciones y empresas mediante la emisión de stablecoins, la custodia de activos digitales y servicios de pagos relacionados. Agora también planea trasladar la emisión de AUSD desde su entidad en Bermudas al banco después de su establecimiento.
Aún se requiere la aprobación final. El permiso para iniciar operaciones depende de cumplir los requisitos previos de apertura de la OCC.
Mi opinión: Integrar la emisión, la custodia y los pagos en una sola institución supervisada federalmente podría aclarar responsabilidades operativas para los clientes corporativos. Esto importa cuando un equipo de tesorería evalúa quién gestiona las reservas, procesa los reembolsos y se encarga de la liquidación.
La prueba comercial será si Agora logra traducir esa estructura en un servicio confiable y negocios recurrentes. El avance regulatorio fortalece el marco; la gestión de reservas, la fiabilidad de los reembolsos y los costos de los pagos ayudarán a determinar qué tan útil se vuelve el producto.
Para el mercado de stablecoins, este es un paso concreto hacia una infraestructura más supervisada federalmente. La adopción sostenida dependerá de lo que Agora entregue una vez que se cumplan los requisitos restantes.
¿Podría esto ayudar a que AUSD obtenga un papel más importante en los pagos institucionales?
#AgoraGetsPreliminaryOCCApprovalForTrustBank #Stablecoins #aUSDT
$MUBARAK $AGT $AKE
{future}(AKEUSDT)
{future}(AGTUSDT)
{future}(MUBARAKUSDT)
#agoragetspreliminaryoccapprovalfortrustbank
Agora obtiene aprobación preliminar de la OCC — El plan bancario de EE. UU. de AUSD avanza
Agora ha asegurado una aprobación condicional preliminar para establecer Agora National Trust Bank en Nueva York. La decisión de la OCC está fechada el 18 de septiembre de 2026; Agora anunció el hito el 21 de septiembre.
El banco propuesto serviría a instituciones y empresas mediante la emisión de stablecoins, la custodia de activos digitales y servicios de pagos relacionados. Agora también planea trasladar la emisión de AUSD desde su entidad en Bermudas al banco después de su establecimiento.
Aún se requiere la aprobación final. El permiso para iniciar operaciones depende de cumplir los requisitos previos de apertura de la OCC.
Mi opinión: Integrar la emisión, la custodia y los pagos en una sola institución supervisada federalmente podría aclarar responsabilidades operativas para los clientes corporativos. Esto importa cuando un equipo de tesorería evalúa quién gestiona las reservas, procesa los reembolsos y se encarga de la liquidación.
La prueba comercial será si Agora logra traducir esa estructura en un servicio confiable y negocios recurrentes. El avance regulatorio fortalece el marco; la gestión de reservas, la fiabilidad de los reembolsos y los costos de los pagos ayudarán a determinar qué tan útil se vuelve el producto.
Para el mercado de stablecoins, este es un paso concreto hacia una infraestructura más supervisada federalmente. La adopción sostenida dependerá de lo que Agora entregue una vez que se cumplan los requisitos restantes.
¿Podría esto ayudar a que AUSD obtenga un papel más importante en los pagos institucionales?
#AgoraGetsPreliminaryOCCApprovalForTrustBank #Stablecoins #aUSDT
$MUBARAK $AGT $AKE
Agora obtiene aprobación preliminar de la OCC — El plan bancario de EE. UU. de AUSD avanza
Agora ha asegurado una aprobación condicional preliminar para establecer Agora National Trust Bank en Nueva York. La decisión de la OCC está fechada el 18 de septiembre de 2026; Agora anunció el hito el 21 de septiembre.
El banco propuesto serviría a instituciones y empresas mediante la emisión de stablecoins, la custodia de activos digitales y servicios de pagos relacionados. Agora también planea trasladar la emisión de AUSD desde su entidad en Bermudas al banco después de su establecimiento.
Aún se requiere la aprobación final. El permiso para iniciar operaciones depende de cumplir los requisitos previos de apertura de la OCC.
Mi opinión: Integrar la emisión, la custodia y los pagos en una sola institución supervisada federalmente podría aclarar responsabilidades operativas para los clientes corporativos. Esto importa cuando un equipo de tesorería evalúa quién gestiona las reservas, procesa los reembolsos y se encarga de la liquidación.
La prueba comercial será si Agora logra traducir esa estructura en un servicio confiable y negocios recurrentes. El avance regulatorio fortalece el marco; la gestión de reservas, la fiabilidad de los reembolsos y los costos de los pagos ayudarán a determinar qué tan útil se vuelve el producto.
Para el mercado de stablecoins, este es un paso concreto hacia una infraestructura más supervisada federalmente. La adopción sostenida dependerá de lo que Agora entregue una vez que se cumplan los requisitos restantes.
¿Podría esto ayudar a que AUSD obtenga un papel más importante en los pagos institucionales?
#AgoraGetsPreliminaryOCCApprovalForTrustBank #Stablecoins #aUSDT
$MUBARAK $AGT $AKE
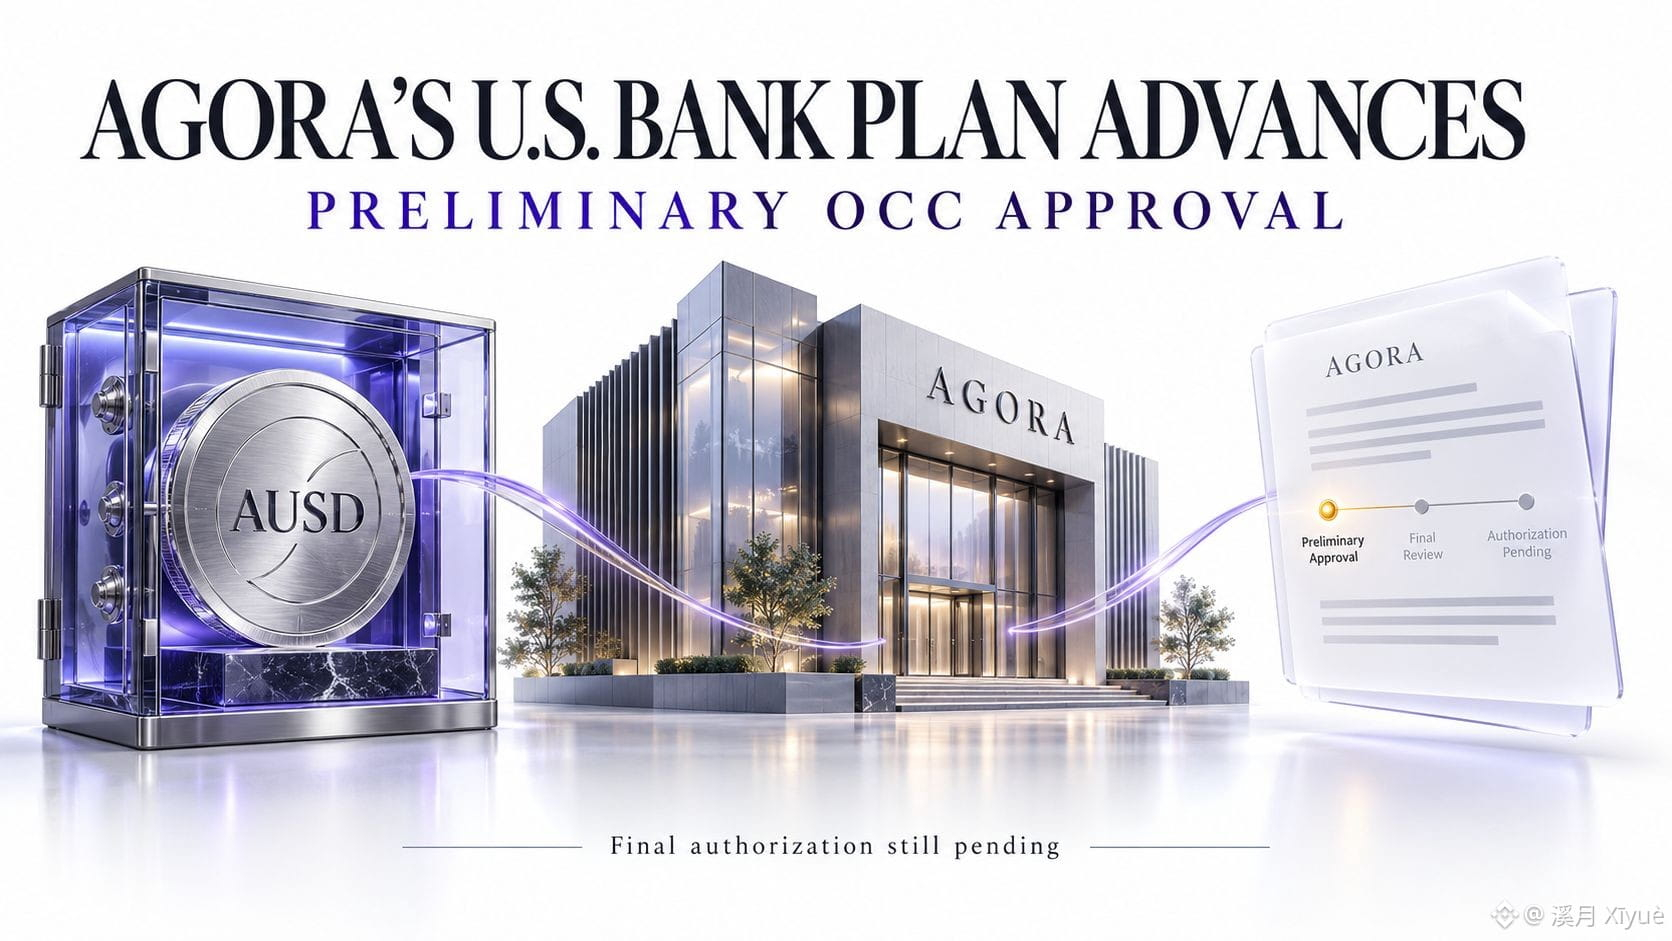
944
·
--
Alcista
#nearrisesnearly80%inaweek
La gran semana de NEAR pone la demanda sostenida en el foco
NEAR ha atraído la atención con un fuerte rally semanal. La próxima prueba es si los compradores pueden mantener esas ganancias a medida que se desvanece la emoción inicial.
El 21 de septiembre, Binance News informó de un aumento semanal cercano al 80%, junto con $29.3 mil millones en volumen acumulado de NEAR Intents y depósitos confidenciales que superan los $70 millones en near.com.
Resumen de precio: la página de CoinGecko consultada a las 15:36 UTC del 21 de septiembre mostró NEAR cerca de $4.02, con un alza del 71.1% en siete días. Los rendimientos semanales varían según el momento de medición y el proveedor.
Mi opinión: las cifras de actividad le dan a los inversores algo concreto que analizar. El volumen acumulado mide las transacciones procesadas a lo largo del tiempo; para evaluar su valor hay que observar el uso recurrente, las comisiones generadas y cómo esa actividad crea demanda para NEAR.
Después de un avance tan rápido, observaría cómo se comporta el precio durante las correcciones. Si los compradores absorben la presión de venta mientras la actividad de negociación se mantiene saludable, eso fortalecería el argumento de un movimiento duradero. Los rebotes débiles y la participación que se reduce indicarían que el impulso se está enfriando.
La pregunta de más largo plazo es si los usuarios siguen eligiendo estos servicios cuando se apagan los incentivos promocionales y la atención del mercado. Esa evidencia tarda más en desarrollarse que una subida de precio semanal.
¿Qué te daría más confianza: un uso más fuerte, un volumen sostenido o una revalidación (retest) exitosa?
#NEARRisesNearly80InAWeek #Near #nearprotocol
$XRP $NEAR
{future}(NEARUSDT)
{future}(XRPUSDT)
#nearrisesnearly80%inaweek
La gran semana de NEAR pone la demanda sostenida en el foco
NEAR ha atraído la atención con un fuerte rally semanal. La próxima prueba es si los compradores pueden mantener esas ganancias a medida que se desvanece la emoción inicial.
El 21 de septiembre, Binance News informó de un aumento semanal cercano al 80%, junto con $29.3 mil millones en volumen acumulado de NEAR Intents y depósitos confidenciales que superan los $70 millones en near.com.
Resumen de precio: la página de CoinGecko consultada a las 15:36 UTC del 21 de septiembre mostró NEAR cerca de $4.02, con un alza del 71.1% en siete días. Los rendimientos semanales varían según el momento de medición y el proveedor.
Mi opinión: las cifras de actividad le dan a los inversores algo concreto que analizar. El volumen acumulado mide las transacciones procesadas a lo largo del tiempo; para evaluar su valor hay que observar el uso recurrente, las comisiones generadas y cómo esa actividad crea demanda para NEAR.
Después de un avance tan rápido, observaría cómo se comporta el precio durante las correcciones. Si los compradores absorben la presión de venta mientras la actividad de negociación se mantiene saludable, eso fortalecería el argumento de un movimiento duradero. Los rebotes débiles y la participación que se reduce indicarían que el impulso se está enfriando.
La pregunta de más largo plazo es si los usuarios siguen eligiendo estos servicios cuando se apagan los incentivos promocionales y la atención del mercado. Esa evidencia tarda más en desarrollarse que una subida de precio semanal.
¿Qué te daría más confianza: un uso más fuerte, un volumen sostenido o una revalidación (retest) exitosa?
#NEARRisesNearly80InAWeek #Near #nearprotocol
$XRP $NEAR
La gran semana de NEAR pone la demanda sostenida en el foco
NEAR ha atraído la atención con un fuerte rally semanal. La próxima prueba es si los compradores pueden mantener esas ganancias a medida que se desvanece la emoción inicial.
El 21 de septiembre, Binance News informó de un aumento semanal cercano al 80%, junto con $29.3 mil millones en volumen acumulado de NEAR Intents y depósitos confidenciales que superan los $70 millones en near.com.
Resumen de precio: la página de CoinGecko consultada a las 15:36 UTC del 21 de septiembre mostró NEAR cerca de $4.02, con un alza del 71.1% en siete días. Los rendimientos semanales varían según el momento de medición y el proveedor.
Mi opinión: las cifras de actividad le dan a los inversores algo concreto que analizar. El volumen acumulado mide las transacciones procesadas a lo largo del tiempo; para evaluar su valor hay que observar el uso recurrente, las comisiones generadas y cómo esa actividad crea demanda para NEAR.
Después de un avance tan rápido, observaría cómo se comporta el precio durante las correcciones. Si los compradores absorben la presión de venta mientras la actividad de negociación se mantiene saludable, eso fortalecería el argumento de un movimiento duradero. Los rebotes débiles y la participación que se reduce indicarían que el impulso se está enfriando.
La pregunta de más largo plazo es si los usuarios siguen eligiendo estos servicios cuando se apagan los incentivos promocionales y la atención del mercado. Esa evidencia tarda más en desarrollarse que una subida de precio semanal.
¿Qué te daría más confianza: un uso más fuerte, un volumen sostenido o una revalidación (retest) exitosa?
#NEARRisesNearly80InAWeek #Near #nearprotocol
$XRP $NEAR

198
·
--
Alcista
#zetachainvotestomigratezetatosolana
ZetaChain aprueba un plan para mover ZETA a Solana
El próximo capítulo de ZetaChain podría centrarse en aplicaciones privadas de IA, con Solana proporcionando la red subyacente.
El 20 de septiembre, la Propuesta 68 se aprobó con un 99,4% de apoyo, según The Block. La dirección aprobada migraría ZETA a Solana y, eventualmente, cerraría la propia capa 1 de ZetaChain.
La migración aún está pendiente. Se debe presentar una segunda propuesta para establecer el snapshot, los tiempos de apagado y el proceso de reclamación. La red continúa funcionando mientras se preparan esos acuerdos.
El plan del equipo especifica una conversión 1:1 en tokens nativos de Solana SPL, conservando el ticker ZETA, el suministro total y los calendarios de vesting. ZETA en Ethereum y BNB Chain queda fuera del alcance de esta propuesta. El desarrollo se enfocaría en Anuma, su aplicación privada de IA, y la infraestructura relacionada.
Mi opinión: este cambio altera la forma en que los inversores deberían evaluar ZETA. El caso de inversión depende cada vez más de que las personas usen sus servicios de IA y de cómo esa actividad genere una demanda sostenida de tokens. Mover la infraestructura podría liberar recursos de desarrollo, pero la adopción comercial todavía necesita demostrarse.
Para los titulares, los puntos de control prácticos son el soporte confirmado en exchanges, el tratamiento de posiciones apostadas y las instrucciones de migración claras. Una conversión 1:1 preserva las cantidades de tokens; el valor de mercado aún puede cambiar durante la transición.
¿Este cambio puede convertir un ecosistema más amplio en una demanda duradera de ZETA?
#ZetaChainVotesToMigrateZETAToSolana #zeta #solana
$ZETA $SOL
{future}(SOLUSDT)
{future}(ZETAUSDT)
#zetachainvotestomigratezetatosolana
ZetaChain aprueba un plan para mover ZETA a Solana
El próximo capítulo de ZetaChain podría centrarse en aplicaciones privadas de IA, con Solana proporcionando la red subyacente.
El 20 de septiembre, la Propuesta 68 se aprobó con un 99,4% de apoyo, según The Block. La dirección aprobada migraría ZETA a Solana y, eventualmente, cerraría la propia capa 1 de ZetaChain.
La migración aún está pendiente. Se debe presentar una segunda propuesta para establecer el snapshot, los tiempos de apagado y el proceso de reclamación. La red continúa funcionando mientras se preparan esos acuerdos.
El plan del equipo especifica una conversión 1:1 en tokens nativos de Solana SPL, conservando el ticker ZETA, el suministro total y los calendarios de vesting. ZETA en Ethereum y BNB Chain queda fuera del alcance de esta propuesta. El desarrollo se enfocaría en Anuma, su aplicación privada de IA, y la infraestructura relacionada.
Mi opinión: este cambio altera la forma en que los inversores deberían evaluar ZETA. El caso de inversión depende cada vez más de que las personas usen sus servicios de IA y de cómo esa actividad genere una demanda sostenida de tokens. Mover la infraestructura podría liberar recursos de desarrollo, pero la adopción comercial todavía necesita demostrarse.
Para los titulares, los puntos de control prácticos son el soporte confirmado en exchanges, el tratamiento de posiciones apostadas y las instrucciones de migración claras. Una conversión 1:1 preserva las cantidades de tokens; el valor de mercado aún puede cambiar durante la transición.
¿Este cambio puede convertir un ecosistema más amplio en una demanda duradera de ZETA?
#ZetaChainVotesToMigrateZETAToSolana #zeta #solana
$ZETA $SOL
ZetaChain aprueba un plan para mover ZETA a Solana
El próximo capítulo de ZetaChain podría centrarse en aplicaciones privadas de IA, con Solana proporcionando la red subyacente.
El 20 de septiembre, la Propuesta 68 se aprobó con un 99,4% de apoyo, según The Block. La dirección aprobada migraría ZETA a Solana y, eventualmente, cerraría la propia capa 1 de ZetaChain.
La migración aún está pendiente. Se debe presentar una segunda propuesta para establecer el snapshot, los tiempos de apagado y el proceso de reclamación. La red continúa funcionando mientras se preparan esos acuerdos.
El plan del equipo especifica una conversión 1:1 en tokens nativos de Solana SPL, conservando el ticker ZETA, el suministro total y los calendarios de vesting. ZETA en Ethereum y BNB Chain queda fuera del alcance de esta propuesta. El desarrollo se enfocaría en Anuma, su aplicación privada de IA, y la infraestructura relacionada.
Mi opinión: este cambio altera la forma en que los inversores deberían evaluar ZETA. El caso de inversión depende cada vez más de que las personas usen sus servicios de IA y de cómo esa actividad genere una demanda sostenida de tokens. Mover la infraestructura podría liberar recursos de desarrollo, pero la adopción comercial todavía necesita demostrarse.
Para los titulares, los puntos de control prácticos son el soporte confirmado en exchanges, el tratamiento de posiciones apostadas y las instrucciones de migración claras. Una conversión 1:1 preserva las cantidades de tokens; el valor de mercado aún puede cambiar durante la transición.
¿Este cambio puede convertir un ecosistema más amplio en una demanda duradera de ZETA?
#ZetaChainVotesToMigrateZETAToSolana #zeta #solana
$ZETA $SOL
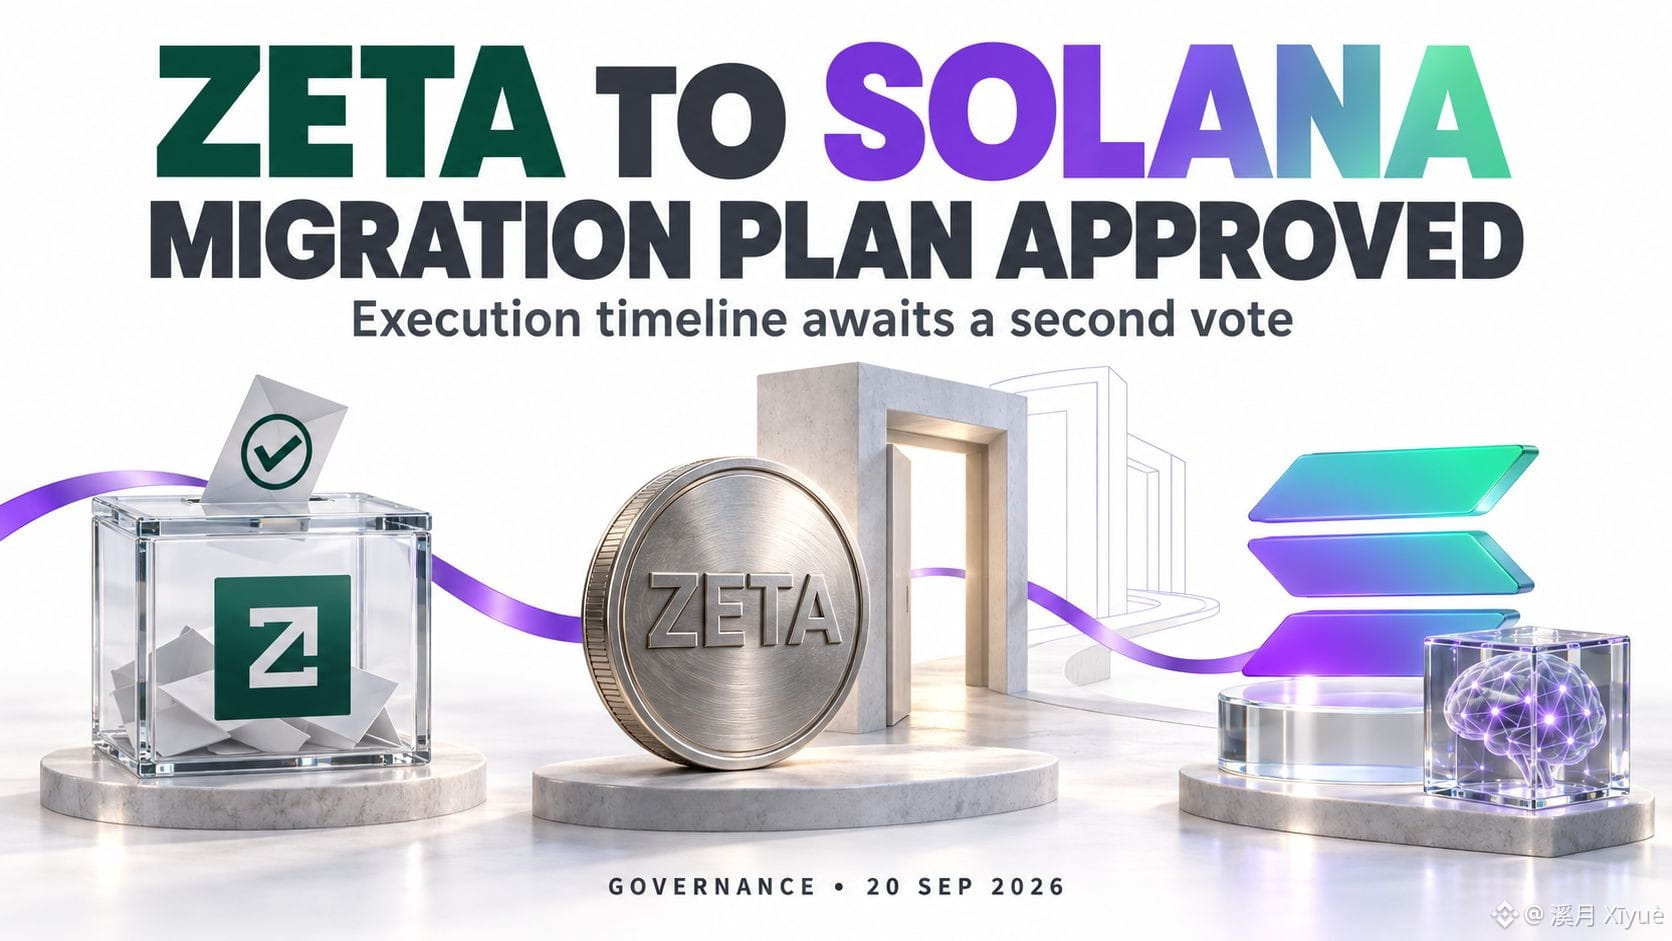
205
Inicia sesión para explorar más contenidos
Únete a usuarios globales de criptomonedas en Binance Square
⚡️ Obtén información útil y actualizada sobre criptos.
💬 Avalado por el mayor exchange de criptomonedas en el mundo.
👍 Descubre perspectivas reales de creadores verificados.
Email/número de teléfono
Temas populares
AIStocksWhatNext
601,867 vistas
4,529 están debatiendo
Comparte y gana recompensas de tráfico en nuestra campaña de hashtag en tendencia
✨Tema: ¿Qué otras oportunidades de inversión siguen vigentes mientras las acciones de IA continúan subiendo?
👉Cómo unirte:
Publica una publicación breve o un artículo con el hashtag #AIStocksWhatNext
Comparte si eres alcista o bajista, y publica tus participaciones en acciones de IA o tu operación — usar el widget de operaciones puede mejorar tu elegibilidad.
También puedes fortalecer tu publicación compartiendo datos o gráficos, y evitando imágenes generadas por IA.
✍️Crea contenido basado en los ángulos siguientes:
- Nvidia dice que las ventas de chips se duplicarán el próximo año, y las principales empresas de IA siguen registrando ingresos récord; el gasto en cómputo que hay detrás es igualmente asombroso. ¿La demanda de IA realmente está despegando? ¿Y cuánto tiempo puede durar? Las acciones de IA suben en general. ¿Se trata de una ruptura real o solo de un rebote a corto plazo?
- Líderes de la industria piden frenar el desarrollo de la IA, mientras Trump planea construir una “AI Force”, afirmando que la IA podría representar el 25% del PIB de EE. UU. en el futuro. ¿De qué lado estás? ¿El respaldo a nivel estatal será una victoria a largo plazo para las acciones de IA?
- ¿Estás comprando acciones de IA? Comparte tu operación/tenencias relacionadas con IA con nuestro widget de compartición de operaciones.
⏰Periodo de la campaña:
- 2026-09-22 7:00 - 2026-09-24 4:00 UTC
🎁Recompensa:
- Las publicaciones que cumplan con las pautas anteriores y contengan más de 100 palabras serán revisadas y podrían recibir un impulso aleatorio de tráfico de 500 a 3,000 vistas. Recibirás una notificación de tu secretario/a de feed si tu publicación es seleccionada.
- Obtén la oportunidad de que tu artículo se destaque en Binance Square Official
¿Necesitas ideas para tu publicación? Visita la página del tema #AIStocksWhatNext o la Square Guide on How to Post for Better Reach.
Binance Square Official
·464 me gusta
·1.2M vistas
21SharesLaunchesEuropesFirstZcashETP
5,220 vistas
228 están debatiendo
CardanoJoinsX402PaymentStandard
3,860 vistas
191 están debatiendo