

#cryptomarkets
cryptomarkets
7.6M views
22,828 Discussing
Hot
Latest

CRYPTO MARKET CHECK: SEVEN ASSETS, ONE IMPORTANT QUESTION — IS THE WEAKNESS BROADENING?
Monday’s market snapshot shows approximately $2.75 trillion in total crypto market capitalization. The Fear & Greed Index reads 44, classified as Fear.
The seven-asset watchlist
Asset Price (USD) Displayed 24-hour change
$BTC $80,147.20 −0.30%
$ETH $2,324.55 −0.40%
$BNB $736.65 −0.20%
$XRP $1.28 −0.90%
$SOL $101.02 +0.30%
$ADA $0.2030 −0.50%
$DOT $1.02 −0.50%
Data timestamp: CoinGecko pages accessed approximately 5:05 AM EDT (09:05 UTC) on October 26. Individual pages refresh at slightly different moments, so this is a mixed-time snapshot rather than a synchronized market tick. Prices and percentage changes can change before publication.
Three signals worth monitoring
1. Bitcoin structure
A move around $80,000 deserves attention, but a round number is not proof of support or resistance. Watch whether price structure confirms a sustained move.
2. Market breadth
BTC dominance is approximately 58.6%. If Bitcoin stabilizes, does strength extend to ETH and other large assets, or remain concentrated?
3. Volume and participation
A price bounce is more informative when supported by broader market participation. Compare spot volume and the performance of multiple assets rather than relying on one green candle.
Wealth Engine takeaway
Fear is a sentiment measure, not a standalone trading signal.
A disciplined analysis separates observed data from interpretation. It also recognizes that a recovery can fail and that apparent weakness can stabilize.
Question: Which signal matters most in your market framework: BTC price structure, ETH relative strength, or broader altcoin participation?
#Bitcoin #Ethereum #CryptoMarkets #MarketStructure #WealthEngine
{spot}(SOLUSDT)
{spot}(ADAUSDT)
{spot}(DOTUSDT)
CRYPTO MARKET CHECK: SEVEN ASSETS, ONE IMPORTANT QUESTION — IS THE WEAKNESS BROADENING?
Monday’s market snapshot shows approximately $2.75 trillion in total crypto market capitalization. The Fear & Greed Index reads 44, classified as Fear.
The seven-asset watchlist
Asset Price (USD) Displayed 24-hour change
$BTC $80,147.20 −0.30%
$ETH $2,324.55 −0.40%
$BNB $736.65 −0.20%
$XRP $1.28 −0.90%
$SOL $101.02 +0.30%
$ADA $0.2030 −0.50%
$DOT $1.02 −0.50%
Data timestamp: CoinGecko pages accessed approximately 5:05 AM EDT (09:05 UTC) on October 26. Individual pages refresh at slightly different moments, so this is a mixed-time snapshot rather than a synchronized market tick. Prices and percentage changes can change before publication.
Three signals worth monitoring
1. Bitcoin structure
A move around $80,000 deserves attention, but a round number is not proof of support or resistance. Watch whether price structure confirms a sustained move.
2. Market breadth
BTC dominance is approximately 58.6%. If Bitcoin stabilizes, does strength extend to ETH and other large assets, or remain concentrated?
3. Volume and participation
A price bounce is more informative when supported by broader market participation. Compare spot volume and the performance of multiple assets rather than relying on one green candle.
Wealth Engine takeaway
Fear is a sentiment measure, not a standalone trading signal.
A disciplined analysis separates observed data from interpretation. It also recognizes that a recovery can fail and that apparent weakness can stabilize.
Question: Which signal matters most in your market framework: BTC price structure, ETH relative strength, or broader altcoin participation?
#Bitcoin #Ethereum #CryptoMarkets #MarketStructure #WealthEngine
1
169

·
--
🔥 Crypto Plunge SOL Under $100 XRP Under $1.30 ETH Under $2,350 BTC Under $80,000 as $200M Longs Liquidated in 60 Minutes.
The crypto market just suffered a violent flash crash across every major asset.
Bitcoin fell below $80,000 while Ethereum dropped under $2,350.
Solana plunged under $100 and XRP slipped below $1.30. Over $200 million in long positions were liquidated in just 60 minutes as the selloff accelerated. Are you buying the dip or waiting for more downside?
❓ What's your take — is this the start of a bigger move or just noise? Drop it below.
$BTC
$ETH
#CryptoMarkets #DigitalAssets #BlockchainAdoption
·
--
🔥 Why Is the Crypto Market Down 5.40% Today, October 23, 2026? BTC, ETH, and XRP Fall as Tech-Led Risk Aversion Spreads.
Crypto markets fell 5.40% on October 23, 2026.
Bitcoin, Ethereum, and XRP all traded lower as tech-led risk aversion swept through financial markets.
The broad decline dragged major digital assets down alongside traditional tech stocks. The selloff was highlighted in a report by Arnne Carragie, underscoring how quickly risk sentiment can shift across crypto and equities alike. Are you adding to your positions or sitting on the sidelines until the market stabilizes?
❓ What's your take — is this the start of a bigger move or just noise? Drop it below.
$BTC
$ETH
#CryptoMarkets #DigitalAssets #BlockchainAdoption
23

·
--
🔥 CRYPTO MARKET WATCH — OCTOBER 2026
Three assets worth watching:
₿ BTC — ETF flows and macroeconomic conditions
Ξ ETH — Network developments and institutional demand
◎ SOL — Network performance and ecosystem growth
📈 BULLISH OUTLOOK:
Stronger demand and improving market conditions could support a recovery.
📉 BEARISH OUTLOOK:
Rising bond yields and weaker investor demand could increase volatility.
⚠️ Remember: A bullish setup is not a guaranteed rally.
Which asset do you think will show the strongest performance next?
#BTC #ETH #SOL #CryptoMarkets #BinanceSquare
1
96

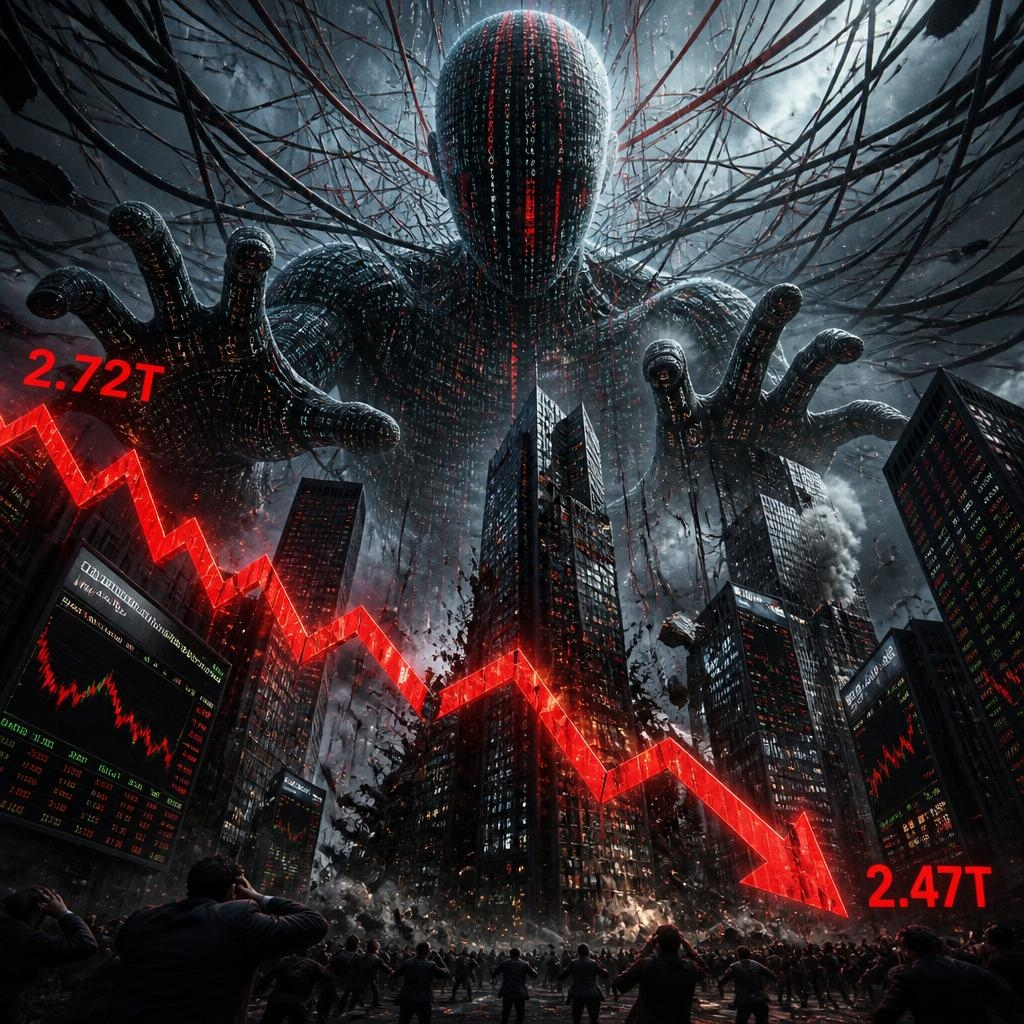
📊 The crypto market fell 3.04% over the last 24 hours to $2.72 trillion. The main reason was a massive sell-off amid macroeconomic concerns, particularly doubts about funding for AI companies.
Artificial intelligence is failing to live up to expectations. It helps solve many problems, but the more freedom it is given to act, the more it harms processes, systems, and—most importantly—people.
If the market holds support at
$2.72 trillion, consolidation is possible. If not, it could fall further to $2.47 trillion.
#CryptoNewss #CryptoMarkets
6
148

·
--
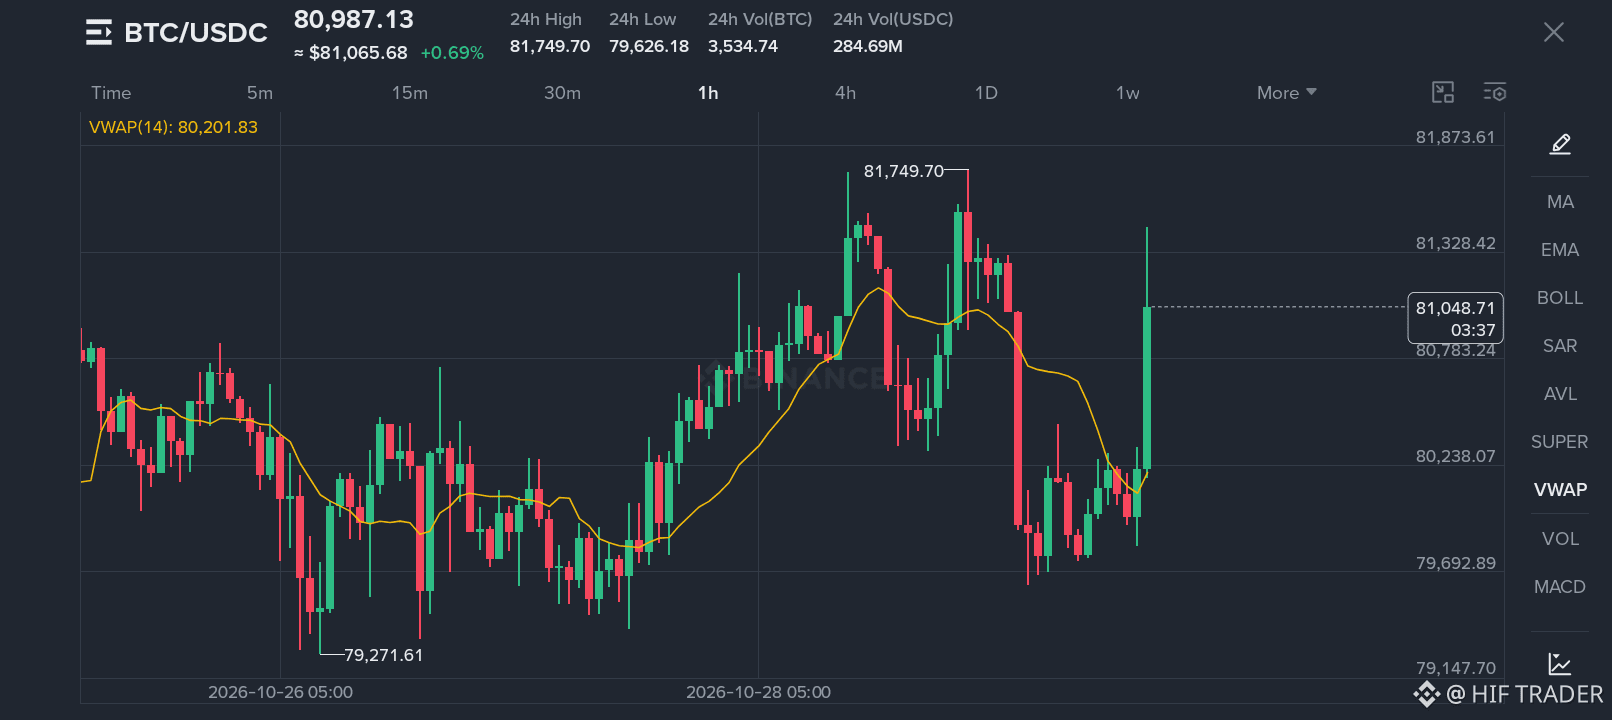
📊 $BTC Market Analysis
$BTC is trading around $81,049. The 1H chart shows a strong recovery candle, but volatility remains high.
* Support: $80,200–$80,000
* Resistance: $81,300–$81,750
* Trend: Short-term recovery, but a confirmed breakout is not yet visible.
Watch whether BTC can hold above key levels. 👀
#BTC #Btcusdc #CryptoMarkets #Hifi
Educational content only. Not financial advice.
{future}(BTCUSDT)
📊 $BTC Market Analysis
$BTC is trading around $81,049. The 1H chart shows a strong recovery candle, but volatility remains high.
* Support: $80,200–$80,000
* Resistance: $81,300–$81,750
* Trend: Short-term recovery, but a confirmed breakout is not yet visible.
Watch whether BTC can hold above key levels. 👀
#BTC #Btcusdc #CryptoMarkets #Hifi
Educational content only. Not financial advice.
1
113
·
--
🔥 Shares of Google’s parent company just had their worst day ever. Here’s what it means.
Google’s parent company just lived through its worst trading day ever. CNN reporter John Towfighi covered the historic selloff, with the story picked up by ABC17News.com two hours ago.
The piece breaks down what the record decline means for the firm and why investors are watching closely. Could a stock drop this severe shake confidence across tech and crypto markets too?
❓ What's your take — is this the start of a bigger move or just noise? Drop it below.
$BTC
$ETH
#CryptoMarkets #DigitalAssets #BlockchainAdoption
80

·
--
🚨 BNB dropped 7% amid Binance hack fears, dragging the broader market down 3.3%. Suspicious multibillion-dollar transfers from linked wallets triggered risk-off sentiment, wiping out recent gains. Smart money is shifting to safer assets as confidence wavers.
What’s your play—hold or cut exposure? #CryptoMarkets
$BNB #TradingSignal #CryptoAnalysis
What’s your play—hold or cut exposure? #CryptoMarkets
$BNB #TradingSignal #CryptoAnalysis


·
--
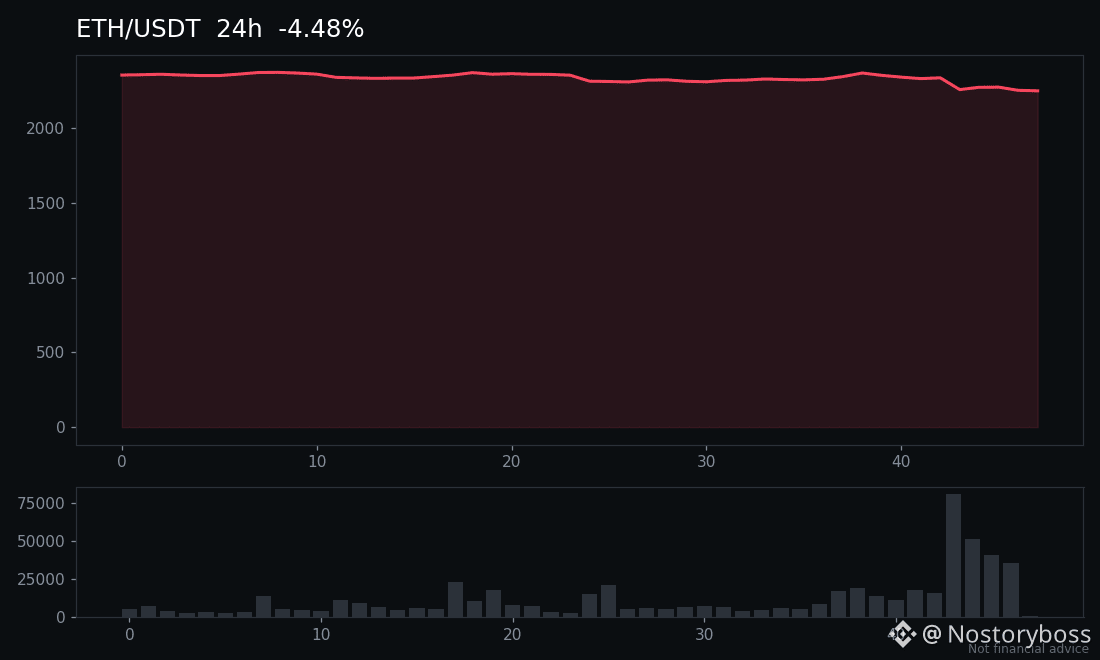
$ETH has slipped 4.7% to around $2,250, and the move has the feel of profit-taking meeting thin conviction rather than outright panic. Sellers are in control for now, but the pullback is orderly, with no sign of the kind of capitulation that usually marks a local bottom.
Traders are now watching whether buyers step in near recent support and whether volume stays elevated on further dips. A steadier tape there would suggest this is a reset, not a reversal of trend.
#BinanceSquare #Ethereum #CryptoMarkets
Not financial advice.
Traders are now watching whether buyers step in near recent support and whether volume stays elevated on further dips. A steadier tape there would suggest this is a reset, not a reversal of trend.
#BinanceSquare #Ethereum #CryptoMarkets
Not financial advice.
93

·
--
📊 FedWatch is flashing a hawkish signal.
Markets are currently pricing a strong chance that the Fed keeps rates elevated—or even tightens further—at the next FOMC meeting. FedWatch probabilities are market-implied estimates from Fed Funds futures, not a guarantee of the Fed’s decision. According to CME FedWatch, these odds can shift quickly as inflation, jobs, and growth data land. (cmegroup.com)
Why crypto traders are watching:
Higher-for-longer rate expectations can strengthen the dollar and pressure liquidity-sensitive assets.
A softer inflation or labor-data surprise could reverse those expectations quickly, supporting broader risk appetite.
The key is not just the decision—it’s whether the Fed sounds more restrictive or more flexible about the path ahead.
Crypto angle:
BTC and altcoins often react most sharply when rate expectations change, not simply when the Fed announces what markets already expected. Watch the FedWatch probability shifts, Treasury yields, and BTC volatility into the meeting.
Caption:
“Don’t just watch the Fed decision—watch what the market has already priced in. 👀📈 #FedWatch #Bitcoin #CryptoMarkets
The above is market analysis and does not constitute investment advice.$BTC
1
104

The Quiet Institutional Moves That Just Shifted the Narrative.US spot Bitcoin ETFs flipped October back into positive territory with $137 million inflows on Wednesday, bringing the three-day total to roughly $424 million after last week’s heavy outflows. At the same time, NYSE parent ICE partnered with Trade.xyz to launch regulated perpetual futures on Hyperliquid infrastructure, sending HYPE up over 3%.
The contrast is sharp: while Bitcoin sees fresh institutional demand and Hyperliquid gains TradFi validation, Ethereum continues its weakest October since 2018 with $1.35 billion in ETF outflows and large dormant-wallet transfers to exchanges. The market is clearly differentiating between assets right now.
$BTC $HYPE $ETH
#CoinVahini #BitcoinETFs #Hyperliquid #CryptoMarkets
The Quiet Institutional Moves That Just Shifted the Narrative.
US spot Bitcoin ETFs flipped October back into positive territory with $137 million inflows on Wednesday, bringing the three-day total to roughly $424 million after last week’s heavy outflows. At the same time, NYSE parent ICE partnered with Trade.xyz to launch regulated perpetual futures on Hyperliquid infrastructure, sending HYPE up over 3%.
The contrast is sharp: while Bitcoin sees fresh institutional demand and Hyperliquid gains TradFi validation, Ethereum continues its weakest October since 2018 with $1.35 billion in ETF outflows and large dormant-wallet transfers to exchanges. The market is clearly differentiating between assets right now.
$BTC $HYPE $ETH
#CoinVahini #BitcoinETFs #Hyperliquid #CryptoMarkets
8
·
--
Verified
🔥 Dubai Royal-Backed Standard Asset Company Unveils $1.5B Bitcoin and UAE Real Estate Strategy.
Dubai royalty is backing a $1.5 billion push into Bitcoin and UAE real estate.
Standard Asset Company unveiled the strategy on October 29, 2026.
The plan allocates capital across Bitcoin and real estate assets in the United Arab Emirates. The initiative highlights growing institutional interest in combining digital assets with traditional property markets in the region. Would you combine Bitcoin and real estate in one investment strategy?
❓ What's your take — is this the start of a bigger move or just noise? Drop it below.
$BTC
$ETH
#CryptoMarkets #DigitalAssets #BlockchainAdoption
14

·
--
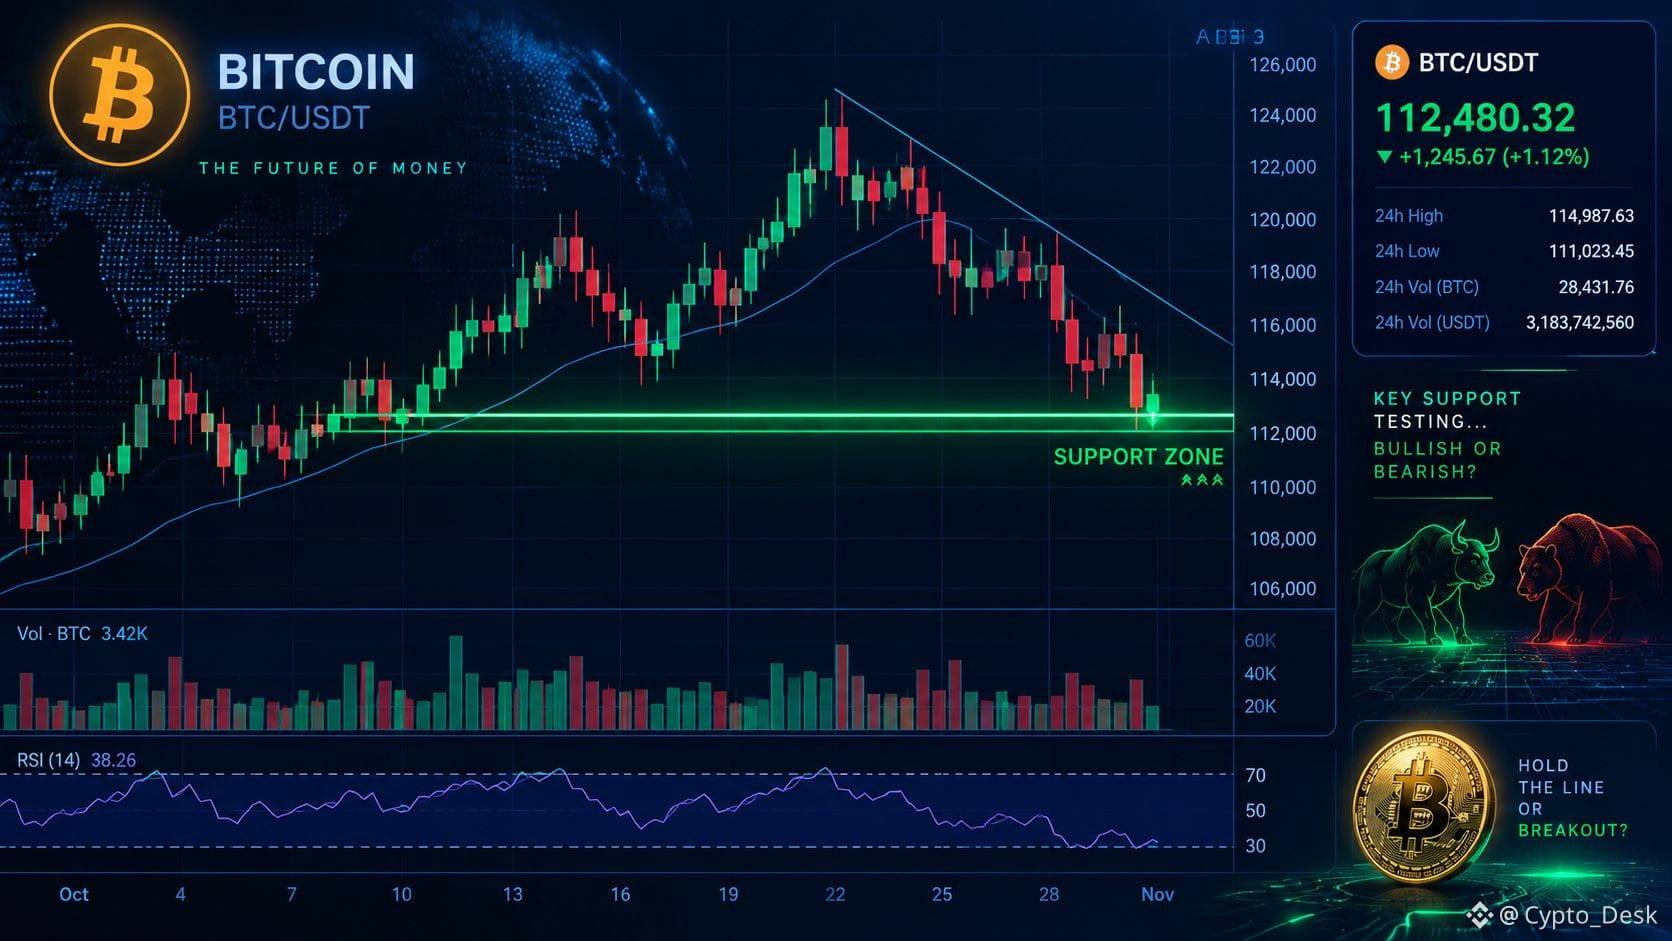
$BTC is currently testing the critical $79,000 - $80,000 support zone! As the market reacts to macro shifts, smart traders are closely watching volume and key levels before making their next move. Are we bouncing back or heading lower? Drop your thoughts below! 👇
#bitcoin #BTC #CryptoMarkets #BinanceSquare
#bitcoin #BTC #CryptoMarkets #BinanceSquare
1
89

·
--
🚨 CRYPTO MARKET UPDATE — OCTOBER 29, 2026 📊
Bitcoin is facing pressure near the $80,000 level, while Ethereum is trading around $2,300.
📉 What should traders watch today?
🔹 Bitcoin price action
🔹 Ethereum's next move
🔹 Altcoin market sentiment
🔹 Trading volume and volatility
💡 Remember: A market dip is not automatically a buying opportunity. Research first, manage risk, and avoid emotional decisions.
👇 What are you watching today — $BTC, $ETH, or $BNB?
#bitcoin #ETH🔥🔥🔥🔥🔥🔥 #CryptoMarketTrends
{spot}(ETHUSDT)
{spot}(BTCUSDT)
#BinanceSquareTalks #CryptoMarkets
🚨 CRYPTO MARKET UPDATE — OCTOBER 29, 2026 📊
Bitcoin is facing pressure near the $80,000 level, while Ethereum is trading around $2,300.
📉 What should traders watch today?
🔹 Bitcoin price action
🔹 Ethereum's next move
🔹 Altcoin market sentiment
🔹 Trading volume and volatility
💡 Remember: A market dip is not automatically a buying opportunity. Research first, manage risk, and avoid emotional decisions.
👇 What are you watching today — $BTC, $ETH, or $BNB?
#bitcoin #ETH🔥🔥🔥🔥🔥🔥 #CryptoMarketTrends
#BinanceSquareTalks #CryptoMarkets

91

·
--
$XRP | SHORT SETUP
XRP's short-term structure has weakened after price slipped below the previously identified $1.3138 support area. The latest reported four-hour close near $1.2888 adds to the downside concern.
Here is the trade I would watch:
- Direction: SHORT
- Entry: $1.285–$1.290 after a failed reclaim
- Stop-loss: $1.310
- Target 1: $1.271
- Target 2: $1.250
The key condition: XRP must remain below the broken support area. A quick recovery would make the entry less attractive.
I am not calling for a collapse. I am trading the possibility of continued weakness while the chart remains below resistance.
No entry if price has already dropped too far from the trigger.
#Xrp🔥🔥 #RippleUpdate #ShortSetup #CryptoMarkets
1
122

·
--
$XRP Price Prediction: Can XRP Reach A New All Time High? XRP is one of the most closely watched digital assets in the cryptocurrency market. Its future price will depend on Bitcoin's movement, market demand, investor interest, and overall crypto market conditions. If the market turns Bullish and demand For XRP increases, its price could move toward higher levels. If market conditions weaken, XRP could also see a price decline. The big question: can $XRP break its previous all-time high and set a new record in the next bull run? What's your XRP price target for the next bull run? Share your prediction in the comments! #XRP #Ripple #Price-Prediction #CryptoMarkets
{spot}(XRPUSDT)
$XRP Price Prediction: Can XRP Reach A New All Time High? XRP is one of the most closely watched digital assets in the cryptocurrency market. Its future price will depend on Bitcoin's movement, market demand, investor interest, and overall crypto market conditions. If the market turns Bullish and demand For XRP increases, its price could move toward higher levels. If market conditions weaken, XRP could also see a price decline. The big question: can $XRP break its previous all-time high and set a new record in the next bull run? What's your XRP price target for the next bull run? Share your prediction in the comments! #XRP #Ripple #Price-Prediction #CryptoMarkets

134

{spot}(BTCUSDT)
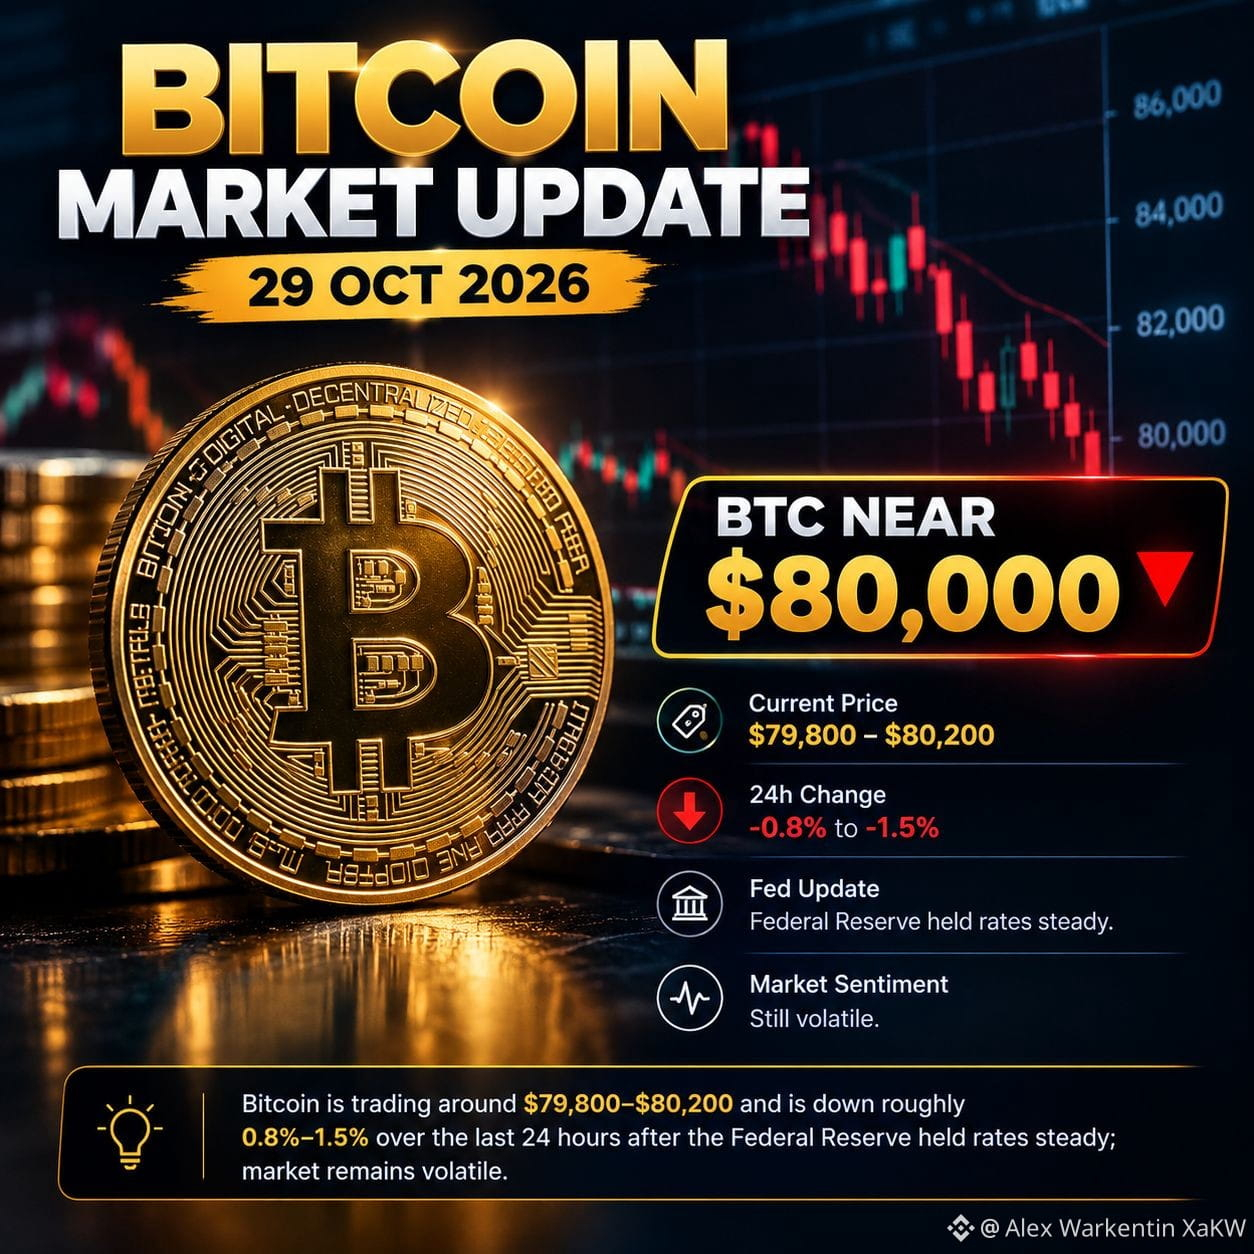
$BTC Bitcoin Latest Analysis — 29 October 2026
Latest market update · BTC/USD
Bitcoin (BTC)
$80,000
Approximate price; down around 0.8%–1.5% over 24 hours.
Market Analysis: Bitcoin is trading near $80,000 as selling pressure continues following the Federal Reserve’s decision to keep interest rates unchanged.
Support: $79,500, then $77,500.
Resistance: $81,400–$82,500.
Bullish scenario: A sustained break above $82,500 could support a recovery.
Bearish scenario: Losing $79,500 could expose Bitcoin to further downside.
Outlook: Short-term sentiment remains cautious. Watch support levels and trading volume before making any decision.
Educational analysis only — not financial advice.
#Bitcoin #BTC #CryptoNews #BitcoinAnalysis #CryptoMarkets #AlphabetSharesSlide10%InLateTrading #FedWatch #EarningsSeason
60
·
--
🔥 Caterpillar: Q3 Earnings Snapshot.
Caterpillar just reported $3.29 billion in third-quarter profit. Caterpillar Inc.
(CAT) announced its third-quarter earnings on Thursday. The Irving, Texas-based company posted a profit of $3.29 billion.
The update came via an Associated Press earnings snapshot. Will traditional earnings reports like this still influence risk appetite in digital asset markets?
❓ What's your take — is this the start of a bigger move or just noise? Drop it below.
$BTC
$ETH
#CryptoMarkets #DigitalAssets #BlockchainAdoption
73

·
--
Is Wall Street buying Bitcoin while quietly walking away from Ethereum?
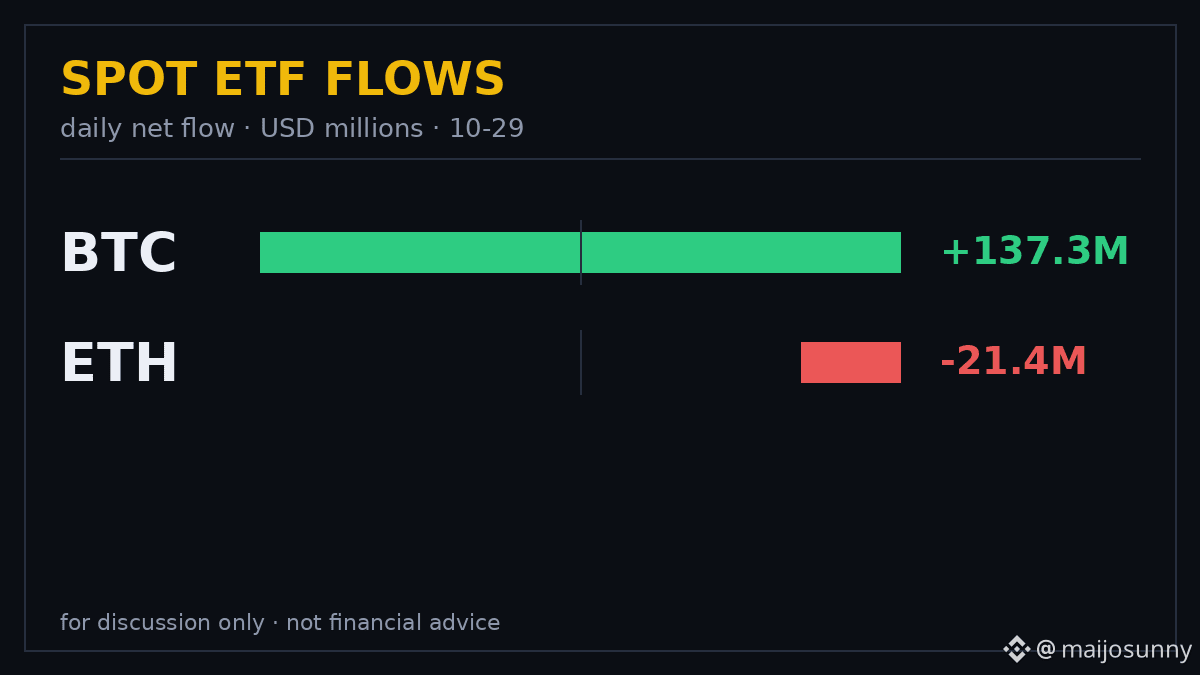
US spot Bitcoin ETFs took in $137.3M on Oct 28 (Farside), the third straight day of inflows. Three days add up to about $424M, enough to flip October back to a net inflow of $111M. Almost all of Wednesday's money went to one fund: BlackRock's IBIT took $136M of the $137.3M total.
Ether funds went the other way. $ETH ETFs lost $21.4M on Oct 28, and October outflows for Ether funds now stand near $1.35B (SoSoValue data via reports).
📊 The split in one view
BTC ETF Oct 28: +$137.3M
ETH ETF Oct 28: -$21.4M
$BTC price: $80,186, down 1.69% in 24h
ETH price: $2,320.67, down 2.29% in 24h
Why it matters: ETF flows are the cleanest read on institutional appetite right now, and the two assets are telling opposite stories. Bitcoin funds have clawed back a month that looked deeply negative two weeks ago, while Ether funds keep bleeding even as the broader market sits in neutral territory (Fear and Greed at 51). When one asset's funds attract money and the other's lose it for weeks, that is rotation, not noise.
But inflows alone do not guarantee higher prices. Bitcoin fell 1.69% on the very day ETFs bought $137.3M of it, with the Fed holding rates the same day. One day of buying does not erase the macro overhang, and one fund taking 99% of the day's inflow is concentration, not broad demand.
My take: watch whether the Bitcoin inflow streak stretches to a fourth day and whether Ether outflows narrow. If both hold, the rotation story gets real. If Bitcoin inflows fade while Ether keeps leaking, this week was just a breather.
What to watch:
- Next daily ETF prints: does the BTC streak reach day four?
- ETH flows: does the $1.35B October bleed slow or accelerate?
- BTC holding $80,000, the level it has defended all week.
Is this rotation, or just a one-week bounce in Bitcoin funds? 👇
Not financial advice. DYOR.
#BitcoinETF #CryptoMarkets
32

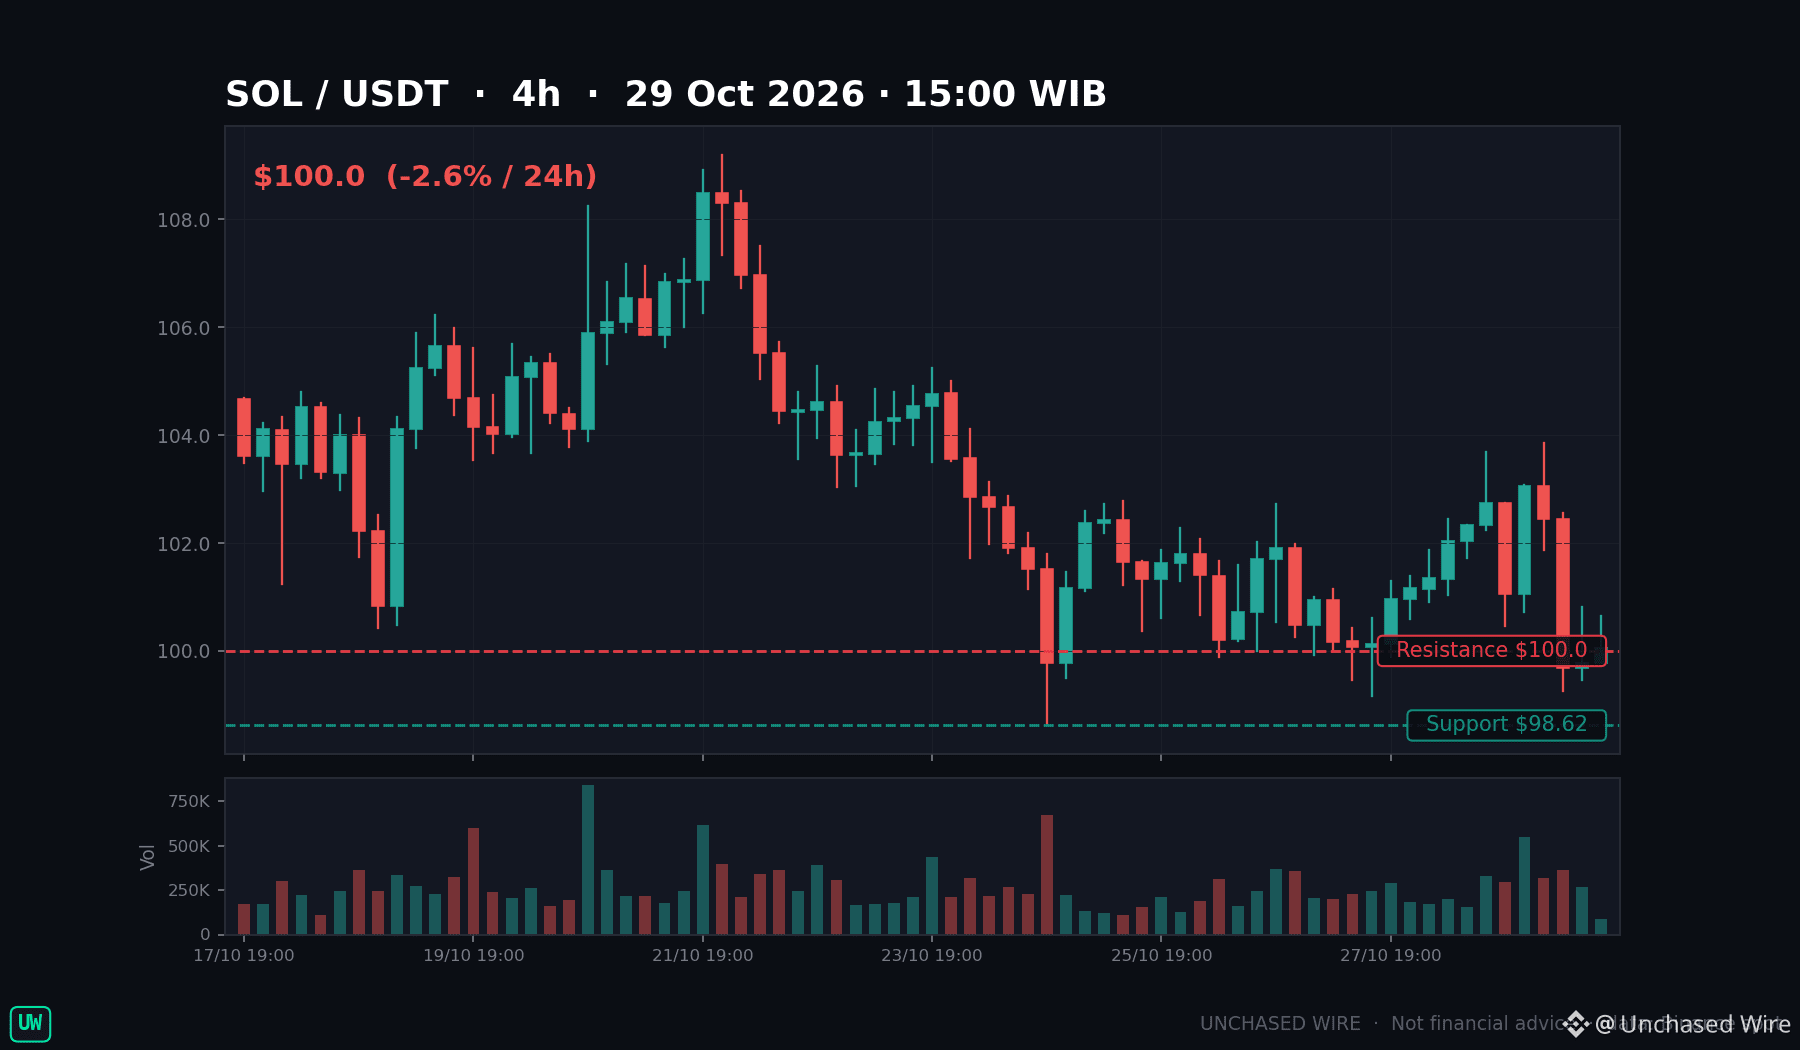
Scorecard first: two days ago I counted $SOL holding $100 on 70 of 71 four-hour closes. This morning that record broke — the 07:00 and 11:00 WIB closes printed $99.69 and $99.77, the first closes under $100 since October 24.
I'm not calling it a collapse. Two closes break a record, not a floor — the next defended low is $98.62, and a close back above $100 reclaims it, as the October 24 dip did. The limit on my own excitement is the sample: two candles are a signal, not a verdict.
What keeps me from shrugging it off is the flow behind it. US spot Solana funds saw a third straight session of outflows on October 28, about $5.7 million that day. Outflows don't set prices, but they explain why no bounce back above $100 has arrived yet.
So $SOL has one job now: reclaim $100, or test $98.62 next. Are you reading this break as noise until the flows turn, or as the tape telling you first?
Not financial advice. Do your own research.
$SOL #Solana #CryptoTrading #ETF #CryptoMarkets
27
Log in to explore more content
Join global crypto users on Binance Square
⚡️ Get latest and useful information about crypto.
💬 Trusted by the world’s largest crypto exchange.
👍 Discover real insights from verified creators.
Email / Phone number
Trending Topics
1
#FedWatch
16.3M views
39,514 Discussing
2
#EarningsSeason
6.5M views
32,230 Discussing
3
#USMidtermElections
51,501 views
668 Discussing
4
#BitcoinDropsBelow$80K
34,781 views
132 Discussing
5
#BoEOpensConsultationOnTokenizedCollateralForClearing
847 views
34 Discussing
6
#BrazilCryptoExchangesMustApplyForLicensesByFriday
37,012 views
539 Discussing
7
#ICEPartnersWithTradeXYZToBringPerpetualContractsToUS
800 views
21 Discussing
8
#SolidusLabsReportsSuspected$170MSpoofingOnHyperliquidOilContracts
1,868 views
30 Discussing
9
#StanDruckenmillerBecomesInvestorInTradeXYZ
28,568 views
465 Discussing
10
#RussiaProposedNonCustodialWalletLimitsExcludeIntlSettlements
2,557 views
42 Discussing