
#xrp
xrp
1.7G views
5.9M Discussing
Hot
Latest


·
--
Bullish
Before You Give Up on $XRP , Look at This Long-Term Chart
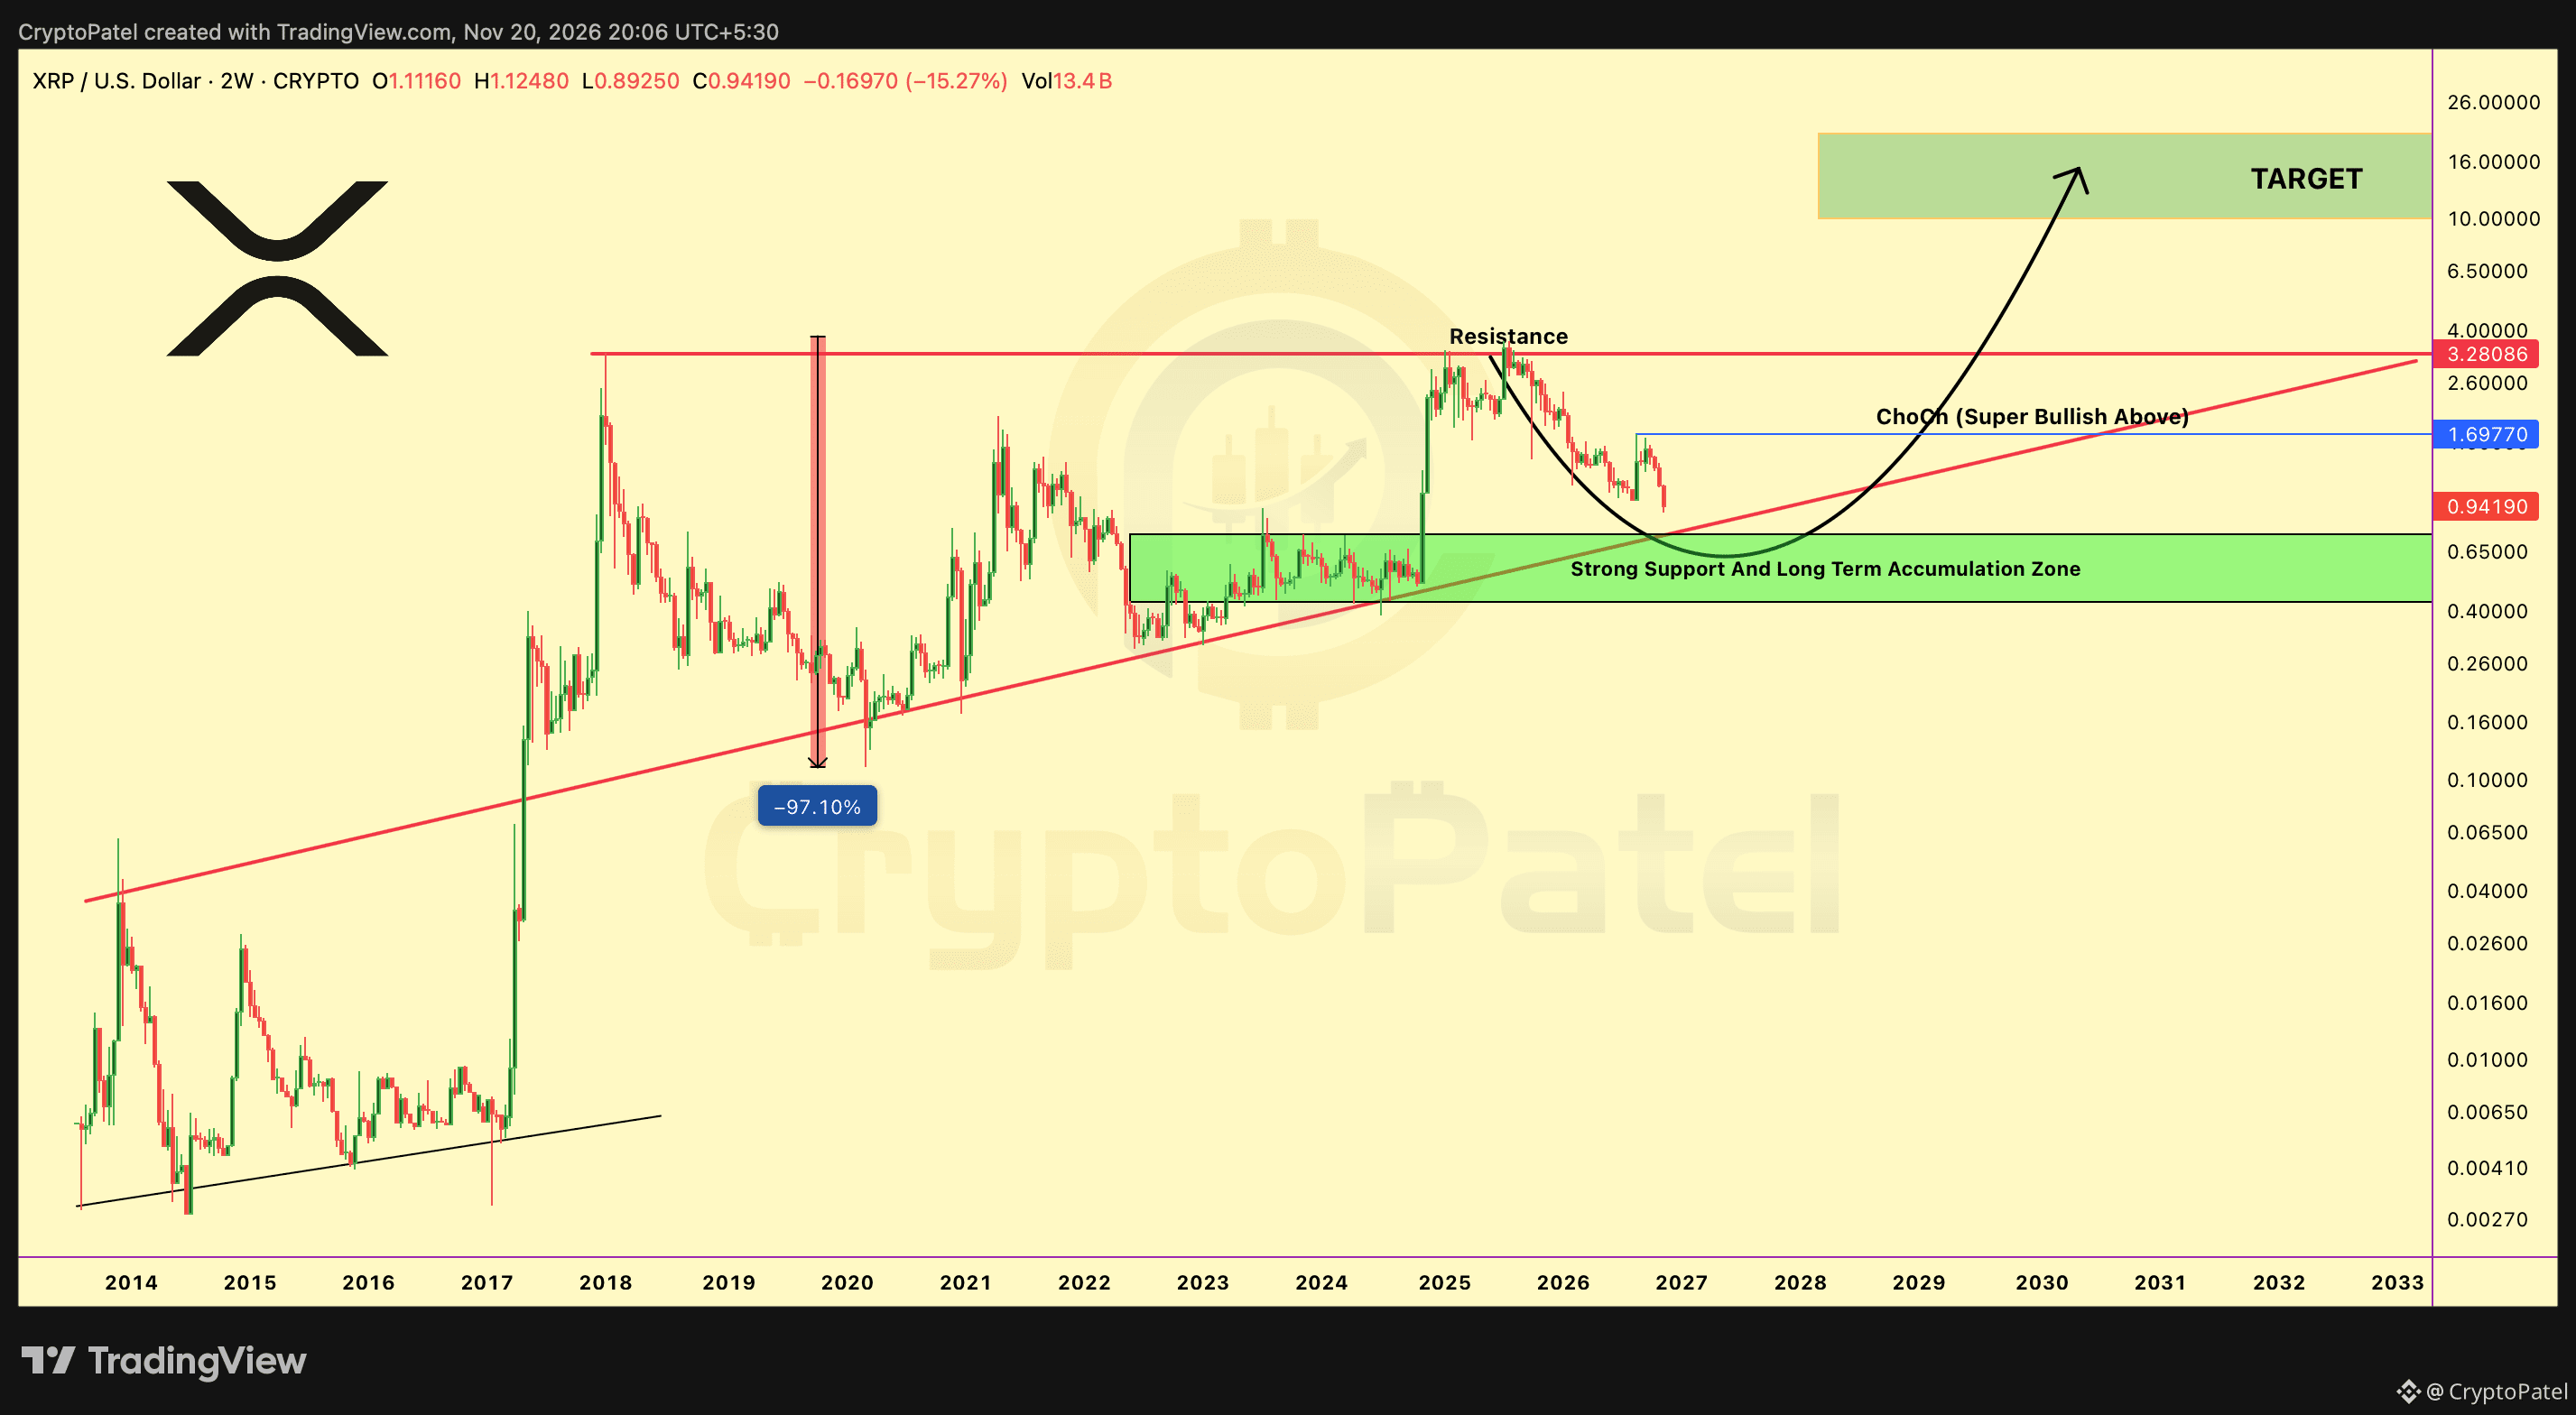
Most traders are watching the current correction. I'm watching #XRP's long-term ascending support.
My 2W Macro Roadmap:
🔹 $0.75–$0.45: Major HTF accumulation zone.
🔹 $1.70: HTF Close Above = Super Bullish (ChoCh)
🔹 $3.28: Critical macro resistance.
🔹 $10–$16: Long-term expansion targets.
XRP/USDT has spent years building this structure. A successful defence of the ascending TL and accumulation zone could set the stage for another major expansion.
The real opportunity may come when conviction is lowest, not when euphoria is highest.
Watch the HTF structure. Let price confirm the thesis.
#XRP
{future}(XRPUSDT)
Before You Give Up on $XRP , Look at This Long-Term Chart
Most traders are watching the current correction. I'm watching #XRP's long-term ascending support.
My 2W Macro Roadmap:
🔹 $0.75–$0.45: Major HTF accumulation zone.
🔹 $1.70: HTF Close Above = Super Bullish (ChoCh)
🔹 $3.28: Critical macro resistance.
🔹 $10–$16: Long-term expansion targets.
XRP/USDT has spent years building this structure. A successful defence of the ascending TL and accumulation zone could set the stage for another major expansion.
The real opportunity may come when conviction is lowest, not when euphoria is highest.
Watch the HTF structure. Let price confirm the thesis.
#XRP
Most traders are watching the current correction. I'm watching #XRP's long-term ascending support.
My 2W Macro Roadmap:
🔹 $0.75–$0.45: Major HTF accumulation zone.
🔹 $1.70: HTF Close Above = Super Bullish (ChoCh)
🔹 $3.28: Critical macro resistance.
🔹 $10–$16: Long-term expansion targets.
XRP/USDT has spent years building this structure. A successful defence of the ascending TL and accumulation zone could set the stage for another major expansion.
The real opportunity may come when conviction is lowest, not when euphoria is highest.
Watch the HTF structure. Let price confirm the thesis.
#XRP
2
2.4k

·
--
$XRP 🚨 XRP Supply Shock on Binance—So Why Is Price Still Under $1.00? 📉🤔
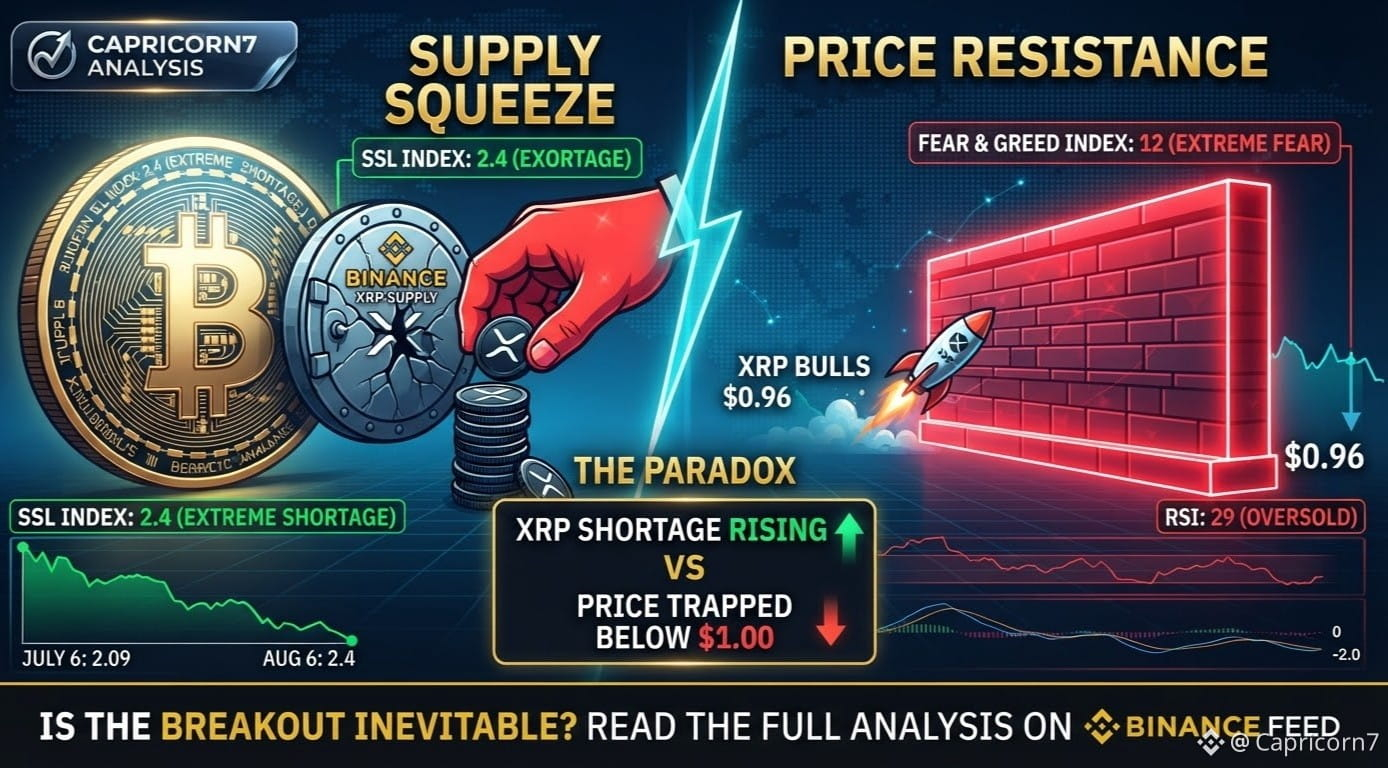
Ripple (XRP) is locked in a fierce tug-of-war between 0.90 and 1.00, currently hovering near 0.91. While buyers aggressively defend the 0.90 floor, bulls haven't been able to smash through that psychological $1.00 ceiling just yet.
Here is the paradox unfolding on-chain and on the charts:
🔥 The Binance Supply Squeeze:
The Binance Supply Shortage Index (SSL) just surged to 2.4 (up from 2.09 in July). Any reading above +2.00 signals a severe tightening of available XRP on the exchange.
For context: back on Sept 27, when XRP traded above 1.50, the index sat at -1.5 (high supply)—right before a ~40% correction.
🧊 Why Haven’t We Pumped Yet?
Extreme Fear: A supply crunch needs fresh demand to spark a rally. With the Crypto Fear & Greed Index sitting at a freezing 12 (Extreme Fear), broader market appetite remains muted.
Bearish Technicals: XRP is trading well below its key moving averages—the 50-day (1.19), 100-day (1.24), and 200-day (1.33) EMAs.
Oversold Momentum: The RSI has dipped into oversold territory at 29, while the MACD remains negative, signaling stretched downward momentum rather than a confirmed reversal.
🎯 Key Levels to Watch:
Support: 0.90 (Buyers' stronghold)
Immediate Hurdle: 1.00 (Psychological barrier)
Major Resistance Zone: $1.12 (SuperTrend) ➡️ 1.19–1.22 (50-day EMA & trendline) ➡️ 1.24–1.33 (Heavy supply zone)
💬 What’s your play right now? Are you accumulating during Extreme Fear before the supply squeeze catches up, or waiting for a clean break above $1.00? Drop your thoughts below! 👇
{spot}(XRPUSDT)
#XRP #Ripple #CryptoNewsCommunity #Binance #TechnicalAnalysis
$XRP 🚨 XRP Supply Shock on Binance—So Why Is Price Still Under $1.00? 📉🤔
Ripple (XRP) is locked in a fierce tug-of-war between 0.90 and 1.00, currently hovering near 0.91. While buyers aggressively defend the 0.90 floor, bulls haven't been able to smash through that psychological $1.00 ceiling just yet.
Here is the paradox unfolding on-chain and on the charts:
🔥 The Binance Supply Squeeze:
The Binance Supply Shortage Index (SSL) just surged to 2.4 (up from 2.09 in July). Any reading above +2.00 signals a severe tightening of available XRP on the exchange.
For context: back on Sept 27, when XRP traded above 1.50, the index sat at -1.5 (high supply)—right before a ~40% correction.
🧊 Why Haven’t We Pumped Yet?
Extreme Fear: A supply crunch needs fresh demand to spark a rally. With the Crypto Fear & Greed Index sitting at a freezing 12 (Extreme Fear), broader market appetite remains muted.
Bearish Technicals: XRP is trading well below its key moving averages—the 50-day (1.19), 100-day (1.24), and 200-day (1.33) EMAs.
Oversold Momentum: The RSI has dipped into oversold territory at 29, while the MACD remains negative, signaling stretched downward momentum rather than a confirmed reversal.
🎯 Key Levels to Watch:
Support: 0.90 (Buyers' stronghold)
Immediate Hurdle: 1.00 (Psychological barrier)
Major Resistance Zone: $1.12 (SuperTrend) ➡️ 1.19–1.22 (50-day EMA & trendline) ➡️ 1.24–1.33 (Heavy supply zone)
💬 What’s your play right now? Are you accumulating during Extreme Fear before the supply squeeze catches up, or waiting for a clean break above $1.00? Drop your thoughts below! 👇
#XRP #Ripple #CryptoNewsCommunity #Binance #TechnicalAnalysis
Ripple (XRP) is locked in a fierce tug-of-war between 0.90 and 1.00, currently hovering near 0.91. While buyers aggressively defend the 0.90 floor, bulls haven't been able to smash through that psychological $1.00 ceiling just yet.
Here is the paradox unfolding on-chain and on the charts:
🔥 The Binance Supply Squeeze:
The Binance Supply Shortage Index (SSL) just surged to 2.4 (up from 2.09 in July). Any reading above +2.00 signals a severe tightening of available XRP on the exchange.
For context: back on Sept 27, when XRP traded above 1.50, the index sat at -1.5 (high supply)—right before a ~40% correction.
🧊 Why Haven’t We Pumped Yet?
Extreme Fear: A supply crunch needs fresh demand to spark a rally. With the Crypto Fear & Greed Index sitting at a freezing 12 (Extreme Fear), broader market appetite remains muted.
Bearish Technicals: XRP is trading well below its key moving averages—the 50-day (1.19), 100-day (1.24), and 200-day (1.33) EMAs.
Oversold Momentum: The RSI has dipped into oversold territory at 29, while the MACD remains negative, signaling stretched downward momentum rather than a confirmed reversal.
🎯 Key Levels to Watch:
Support: 0.90 (Buyers' stronghold)
Immediate Hurdle: 1.00 (Psychological barrier)
Major Resistance Zone: $1.12 (SuperTrend) ➡️ 1.19–1.22 (50-day EMA & trendline) ➡️ 1.24–1.33 (Heavy supply zone)
💬 What’s your play right now? Are you accumulating during Extreme Fear before the supply squeeze catches up, or waiting for a clean break above $1.00? Drop your thoughts below! 👇
#XRP #Ripple #CryptoNewsCommunity #Binance #TechnicalAnalysis
1
2
729

·
--
Verified
🏦 $XRP : RIPPLE JUST EXPANDED ITS PARTNERSHIP WITH BANKING GIANT BNY!
Ripple's institutional expansion is bringing fresh attention to the XRP Ledger:
- BNY collaboration: Ripple and BNY expanded their work on digital-asset custody and tokenized trade finance.
- XRP support: BNY's custody platform now supports XRP and RLUSD.
- 4.6B+ transactions: XRPL has processed more than 4.6 billion transactions since launch.
- ETF demand: Recent reports show mixed flows, so institutional interest does not guarantee price growth.
Can banking adoption translate into more activity on XRPL?
$XRP
{future}(XRPUSDT)
.
.
.
#xrp #Ripple #Crypto
Not financial advice. DYOR.
🏦 $XRP : RIPPLE JUST EXPANDED ITS PARTNERSHIP WITH BANKING GIANT BNY!
Ripple's institutional expansion is bringing fresh attention to the XRP Ledger:
- BNY collaboration: Ripple and BNY expanded their work on digital-asset custody and tokenized trade finance.
- XRP support: BNY's custody platform now supports XRP and RLUSD.
- 4.6B+ transactions: XRPL has processed more than 4.6 billion transactions since launch.
- ETF demand: Recent reports show mixed flows, so institutional interest does not guarantee price growth.
Can banking adoption translate into more activity on XRPL?
$XRP
.
.
.
#xrp #Ripple #Crypto
Not financial advice. DYOR.
Ripple's institutional expansion is bringing fresh attention to the XRP Ledger:
- BNY collaboration: Ripple and BNY expanded their work on digital-asset custody and tokenized trade finance.
- XRP support: BNY's custody platform now supports XRP and RLUSD.
- 4.6B+ transactions: XRPL has processed more than 4.6 billion transactions since launch.
- ETF demand: Recent reports show mixed flows, so institutional interest does not guarantee price growth.
Can banking adoption translate into more activity on XRPL?
$XRP
.
.
.
#xrp #Ripple #Crypto
Not financial advice. DYOR.
1
2
1.4k

·
--
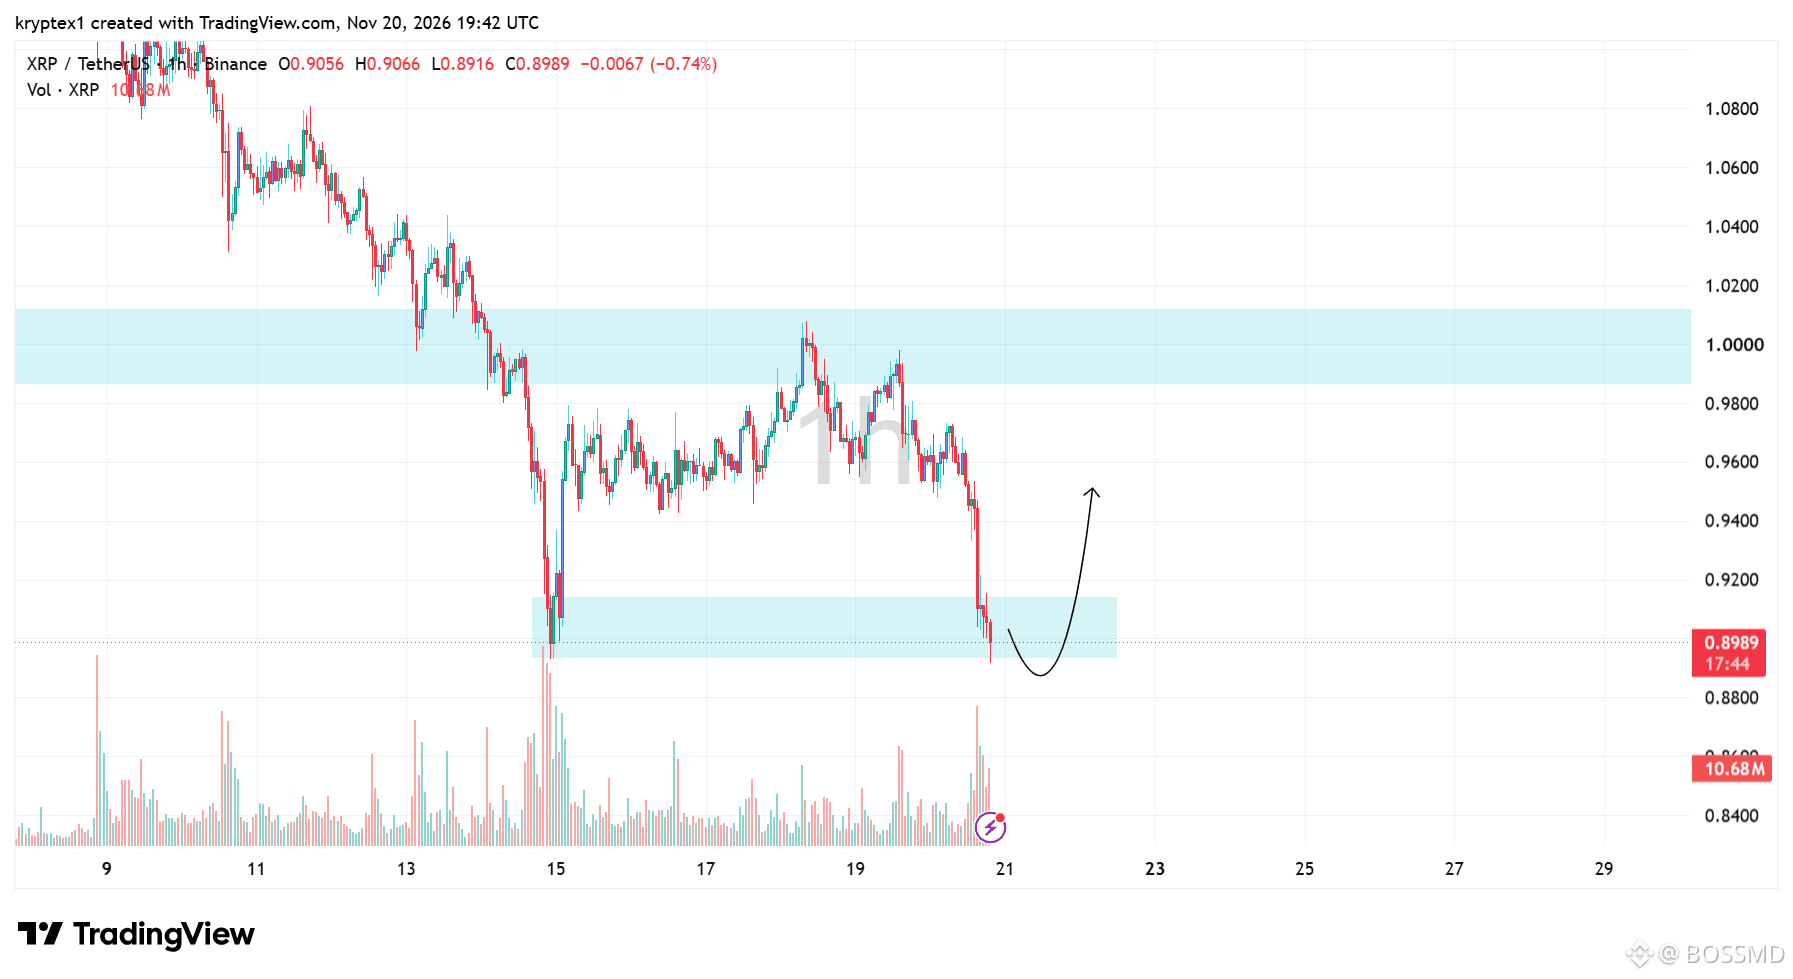
$XRP is testing a critical support zone around $0.89–$0.91 after another strong selling move.
Bears are currently in control, but this area could attract buyers and trigger a short-term relief bounce.
I’m watching for a possible reaction from this support, with $0.95 as the next upside target if buyers step in.
A breakdown below this zone could open the door to further downside. #XRP
$XRP is testing a critical support zone around $0.89–$0.91 after another strong selling move.
Bears are currently in control, but this area could attract buyers and trigger a short-term relief bounce.
I’m watching for a possible reaction from this support, with $0.95 as the next upside target if buyers step in.
A breakdown below this zone could open the door to further downside. #XRP
Bears are currently in control, but this area could attract buyers and trigger a short-term relief bounce.
I’m watching for a possible reaction from this support, with $0.95 as the next upside target if buyers step in.
A breakdown below this zone could open the door to further downside. #XRP
3
3.1k

$XRP Could Be Approaching a Major Move! 🚀
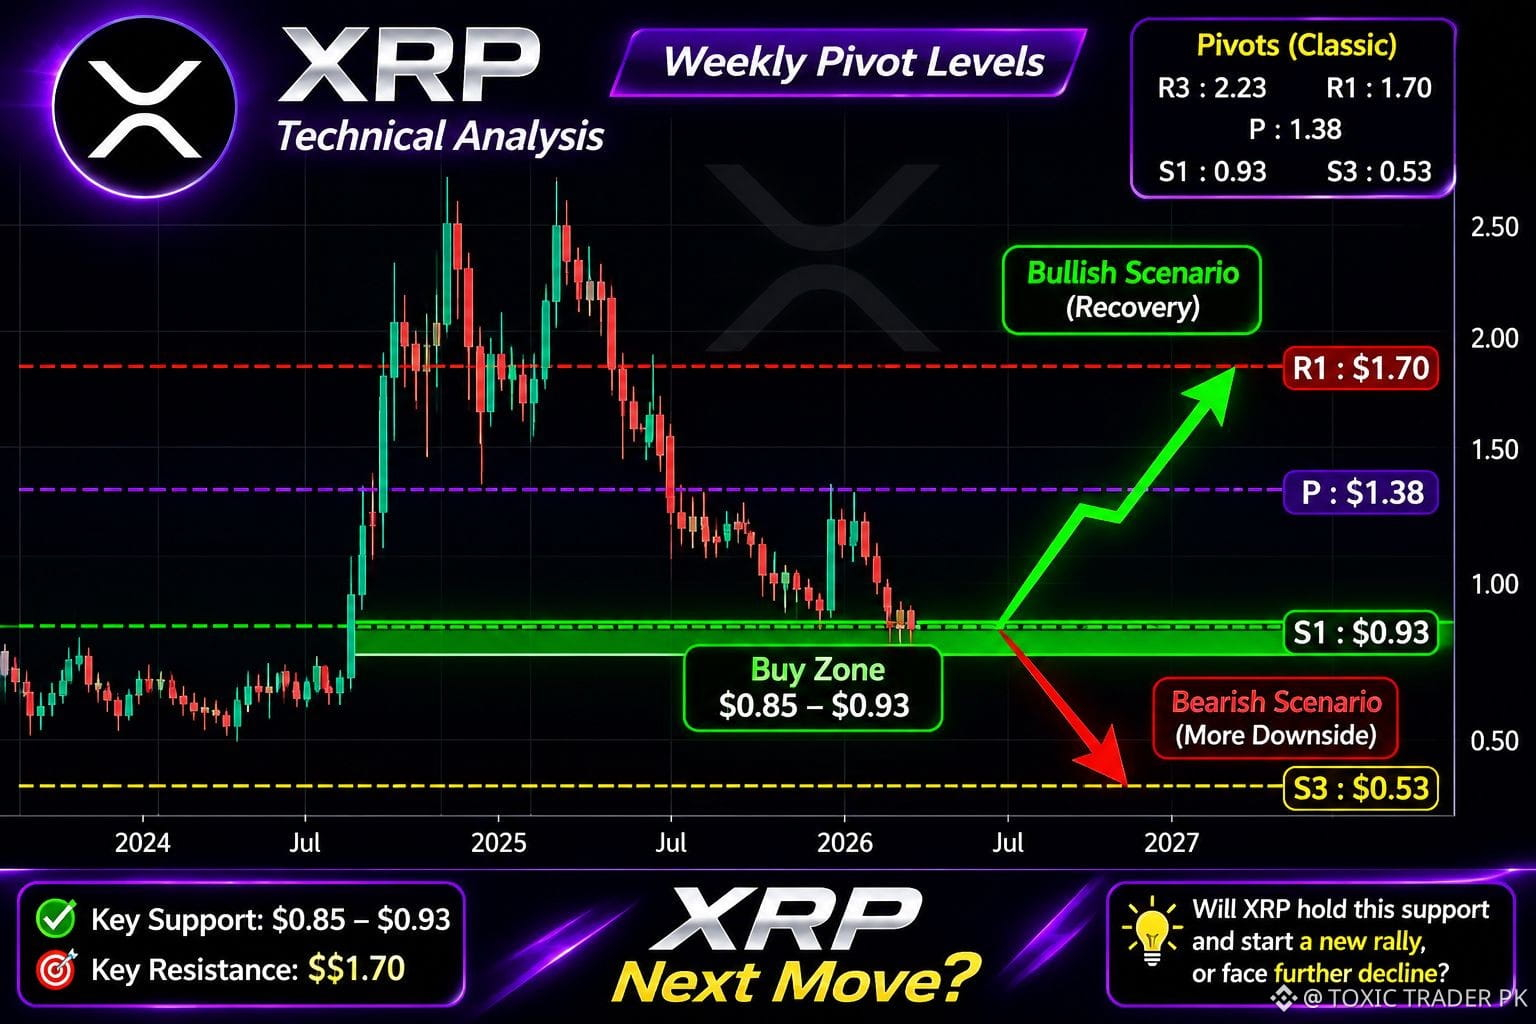
$XRP is currently trading near a key buying zone around $0.90–$0.95.
If buyers defend this level, a recovery toward $1.50, followed by $1.70, could be on the table.
Holding this support could set the stage for a strong comeback. However, a breakdown below this zone may open the door to further downside.
I'm keeping a close eye on this level. Stay patient and wait for confirmation before making a move!
#xrp #Ripple #crypto #trading
$XRP Could Be Approaching a Major Move! 🚀
$XRP is currently trading near a key buying zone around $0.90–$0.95.
If buyers defend this level, a recovery toward $1.50, followed by $1.70, could be on the table.
Holding this support could set the stage for a strong comeback. However, a breakdown below this zone may open the door to further downside.
I'm keeping a close eye on this level. Stay patient and wait for confirmation before making a move!
#xrp #Ripple #crypto #trading
$XRP is currently trading near a key buying zone around $0.90–$0.95.
If buyers defend this level, a recovery toward $1.50, followed by $1.70, could be on the table.
Holding this support could set the stage for a strong comeback. However, a breakdown below this zone may open the door to further downside.
I'm keeping a close eye on this level. Stay patient and wait for confirmation before making a move!
#xrp #Ripple #crypto #trading
2
727

Article
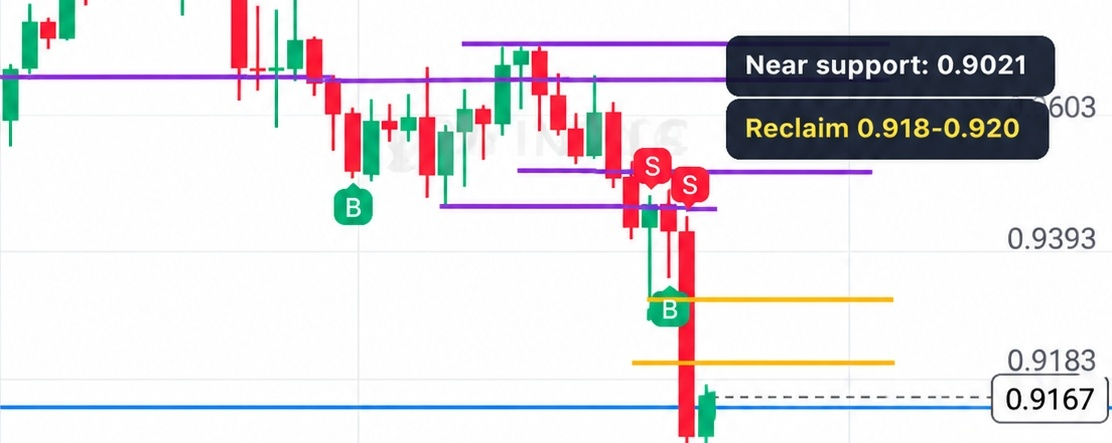
XRP/USDT: Is This a Temporary Bounce or More Downside Ahead? 📉I am watching XRP/USDT on the 1-hour timeframe, and the latest price action shows strong selling pressure.
At the time of my analysis, XRP was trading around $0.9168, with a 24-hour decline of approximately 5.93%.
🔍 What I Observed on the Chart
1. Strong Selling Pressure
A large bearish candle pushed the price below several previously marked support areas. This indicates that sellers are currently showing strength.
2. Important Support
The price recently reached approximately $0.9021 before showing a small recovery.
This level is important to watch, but one touch does not confirm strong support.
3. Volume Activity
Selling volume increased during the sharp downward move. This makes the recent breakdown worth watching closely.
4. Possible Recovery Scenario
If XRP holds above the recent low and starts forming higher highs with increasing buying volume, a recovery may develop.
However, if the price breaks below $0.9021, further downside remains possible.
📊 Key Price Areas
$0.9021 — Recent low
$0.918–$0.920 — Nearby recovery area
$0.939–$0.945 — Potential resistance
$0.960–$0.980 — Higher resistance zone
🎯 My Trading Approach
I am not rushing into a Long or Short position.
I want to see confirmation through candle closes, volume, and a possible retest before making any decision.
For me, patience and risk management are more important than entering every market move.
💬 What Is Your View?
Will XRP recover from the $0.9021 area, or could sellers push the price lower?
Share your technical analysis in the comments!
#XRP #XRPUSDT🚨 #BinanceSquare #cryptotrading #TechnicalAnalysis
XRP/USDT: Is This a Temporary Bounce or More Downside Ahead? 📉
I am watching XRP/USDT on the 1-hour timeframe, and the latest price action shows strong selling pressure.
At the time of my analysis, XRP was trading around $0.9168, with a 24-hour decline of approximately 5.93%.
🔍 What I Observed on the Chart
1. Strong Selling Pressure
A large bearish candle pushed the price below several previously marked support areas. This indicates that sellers are currently showing strength.
2. Important Support
The price recently reached approximately $0.9021 before showing a small recovery.
This level is important to watch, but one touch does not confirm strong support.
3. Volume Activity
Selling volume increased during the sharp downward move. This makes the recent breakdown worth watching closely.
4. Possible Recovery Scenario
If XRP holds above the recent low and starts forming higher highs with increasing buying volume, a recovery may develop.
However, if the price breaks below $0.9021, further downside remains possible.
📊 Key Price Areas
$0.9021 — Recent low
$0.918–$0.920 — Nearby recovery area
$0.939–$0.945 — Potential resistance
$0.960–$0.980 — Higher resistance zone
🎯 My Trading Approach
I am not rushing into a Long or Short position.
I want to see confirmation through candle closes, volume, and a possible retest before making any decision.
For me, patience and risk management are more important than entering every market move.
💬 What Is Your View?
Will XRP recover from the $0.9021 area, or could sellers push the price lower?
Share your technical analysis in the comments!
#XRP #XRPUSDT🚨 #BinanceSquare #cryptotrading #TechnicalAnalysis
At the time of my analysis, XRP was trading around $0.9168, with a 24-hour decline of approximately 5.93%.
🔍 What I Observed on the Chart
1. Strong Selling Pressure
A large bearish candle pushed the price below several previously marked support areas. This indicates that sellers are currently showing strength.
2. Important Support
The price recently reached approximately $0.9021 before showing a small recovery.
This level is important to watch, but one touch does not confirm strong support.
3. Volume Activity
Selling volume increased during the sharp downward move. This makes the recent breakdown worth watching closely.
4. Possible Recovery Scenario
If XRP holds above the recent low and starts forming higher highs with increasing buying volume, a recovery may develop.
However, if the price breaks below $0.9021, further downside remains possible.
📊 Key Price Areas
$0.9021 — Recent low
$0.918–$0.920 — Nearby recovery area
$0.939–$0.945 — Potential resistance
$0.960–$0.980 — Higher resistance zone
🎯 My Trading Approach
I am not rushing into a Long or Short position.
I want to see confirmation through candle closes, volume, and a possible retest before making any decision.
For me, patience and risk management are more important than entering every market move.
💬 What Is Your View?
Will XRP recover from the $0.9021 area, or could sellers push the price lower?
Share your technical analysis in the comments!
#XRP #XRPUSDT🚨 #BinanceSquare #cryptotrading #TechnicalAnalysis
344

·
--
Bearish
$XRP HOLDERS
🤔 DON'T FOCUS ONLY ON THE PRICE‼️
😲 The biggest mistake in crypto is making decisions based on emotions instead of understanding the market.
✴️ Before making any move on $XRP, keep these 4 important signals in mind:
🐋 Whale Activity: Monitor large transactions, but remember that transfers don't always mean buying or selling.
📊 Trading Volume: Increasing volume can support a price move, but direction matters.
🛡️ Key Support: Watch whether buyers are defending important price levels.
🚀 Breakout Confirmation: Don't trust every green candle. Wait for a strong close above resistance with supporting volume.
$XRP
{spot}(XRPUSDT)
⚠️ Remember: A sudden pump doesn't guarantee a long-term rally, and a temporary dip doesn't automatically mean the project is finished.
🧠 Smart investors focus on risk management, research, and patience not FOMO.
What do you think? Is $XRP preparing for a stronger recovery, or does the market need more confirmation?
#XRP #Ripple #CryptoEducation #BinanceSquare
$XRP HOLDERS
🤔 DON'T FOCUS ONLY ON THE PRICE‼️
😲 The biggest mistake in crypto is making decisions based on emotions instead of understanding the market.
✴️ Before making any move on $XRP , keep these 4 important signals in mind:
🐋 Whale Activity: Monitor large transactions, but remember that transfers don't always mean buying or selling.
📊 Trading Volume: Increasing volume can support a price move, but direction matters.
🛡️ Key Support: Watch whether buyers are defending important price levels.
🚀 Breakout Confirmation: Don't trust every green candle. Wait for a strong close above resistance with supporting volume.
$XRP
⚠️ Remember: A sudden pump doesn't guarantee a long-term rally, and a temporary dip doesn't automatically mean the project is finished.
🧠 Smart investors focus on risk management, research, and patience not FOMO.
What do you think? Is $XRP preparing for a stronger recovery, or does the market need more confirmation?
#XRP #Ripple #CryptoEducation #BinanceSquare
🤔 DON'T FOCUS ONLY ON THE PRICE‼️
😲 The biggest mistake in crypto is making decisions based on emotions instead of understanding the market.
✴️ Before making any move on $XRP , keep these 4 important signals in mind:
🐋 Whale Activity: Monitor large transactions, but remember that transfers don't always mean buying or selling.
📊 Trading Volume: Increasing volume can support a price move, but direction matters.
🛡️ Key Support: Watch whether buyers are defending important price levels.
🚀 Breakout Confirmation: Don't trust every green candle. Wait for a strong close above resistance with supporting volume.
$XRP
⚠️ Remember: A sudden pump doesn't guarantee a long-term rally, and a temporary dip doesn't automatically mean the project is finished.
🧠 Smart investors focus on risk management, research, and patience not FOMO.
What do you think? Is $XRP preparing for a stronger recovery, or does the market need more confirmation?
#XRP #Ripple #CryptoEducation #BinanceSquare
1
378

·
--
I’m happy to see $XRP dropping; there probably won't be another chance to see the 133 mark again. XRP is now in the home stretch of the race, and I believe I’ll get rich—so much so that I’ll start a charity fund named "XRP."
#xrp
I’m happy to see $XRP dropping; there probably won't be another chance to see the 133 mark again. XRP is now in the home stretch of the race, and I believe I’ll get rich—so much so that I’ll start a charity fund named "XRP."
#xrp
#xrp
3
469

·
--
💮 $XRP : XRP LEDGER PASSES A MAJOR INSTITUTIONAL INFRASTRUCTURE REVIEW!
A fresh development is putting XRPL's institutional readiness in focus:
- November 18: The XRP Ledger Foundation announced an assessment against all 10 Global Layer One (GL1) infrastructure principles.
- Independent review: CertiK reviewed the ledger's architecture and resilience evidence.
- Key areas: Governance, settlement, cybersecurity, operational resilience and data privacy.
- Important distinction: This is an independently reviewed self-attestation, not official certification or regulatory approval.
- Next step: The foundation plans to refresh its assessment as standards and the network evolve.
Could stronger infrastructure evidence increase institutional confidence in XRPL?
$XRP
{future}(XRPUSDT)
.
.
.
#XRP #XRPL #Ripple
Not financial advice. DYOR.
💮 $XRP : XRP LEDGER PASSES A MAJOR INSTITUTIONAL INFRASTRUCTURE REVIEW!
A fresh development is putting XRPL's institutional readiness in focus:
- November 18: The XRP Ledger Foundation announced an assessment against all 10 Global Layer One (GL1) infrastructure principles.
- Independent review: CertiK reviewed the ledger's architecture and resilience evidence.
- Key areas: Governance, settlement, cybersecurity, operational resilience and data privacy.
- Important distinction: This is an independently reviewed self-attestation, not official certification or regulatory approval.
- Next step: The foundation plans to refresh its assessment as standards and the network evolve.
Could stronger infrastructure evidence increase institutional confidence in XRPL?
$XRP
.
.
.
#XRP #XRPL #Ripple
Not financial advice. DYOR.
A fresh development is putting XRPL's institutional readiness in focus:
- November 18: The XRP Ledger Foundation announced an assessment against all 10 Global Layer One (GL1) infrastructure principles.
- Independent review: CertiK reviewed the ledger's architecture and resilience evidence.
- Key areas: Governance, settlement, cybersecurity, operational resilience and data privacy.
- Important distinction: This is an independently reviewed self-attestation, not official certification or regulatory approval.
- Next step: The foundation plans to refresh its assessment as standards and the network evolve.
Could stronger infrastructure evidence increase institutional confidence in XRPL?
$XRP
.
.
.
#XRP #XRPL #Ripple
Not financial advice. DYOR.
297

·
--
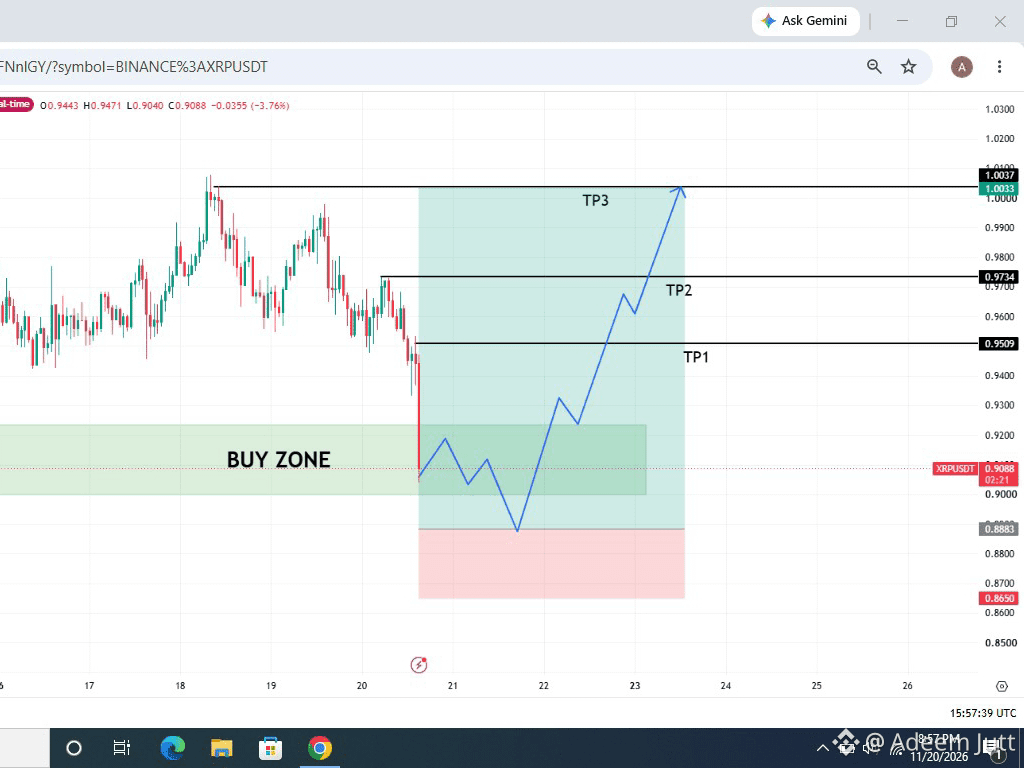
Stop scrolling! 🛑 $XRP is giving us a golden entry right now. Don’t miss this bounce! 👀👇
🟢 BUY ZONE: $0.8900 - $0.9200
🎯 TP1: $0.9508
🎯 TP2: $0.9734
🎯 TP3: $1.0037
🛑 STOP LOSS: $0.8655
Risk/Reward looks solid here. Let’s see if the bulls step in! 🐂🔥
{spot}(XRPUSDT)
#xrp #Ripple #XRPL #TradeSignal
Stop scrolling! 🛑 $XRP is giving us a golden entry right now. Don’t miss this bounce! 👀👇
🟢 BUY ZONE: $0.8900 - $0.9200
🎯 TP1: $0.9508
🎯 TP2: $0.9734
🎯 TP3: $1.0037
🛑 STOP LOSS: $0.8655
Risk/Reward looks solid here. Let’s see if the bulls step in! 🐂🔥
#xrp #Ripple #XRPL #TradeSignal
🟢 BUY ZONE: $0.8900 - $0.9200
🎯 TP1: $0.9508
🎯 TP2: $0.9734
🎯 TP3: $1.0037
🛑 STOP LOSS: $0.8655
Risk/Reward looks solid here. Let’s see if the bulls step in! 🐂🔥
#xrp #Ripple #XRPL #TradeSignal
2
1
231

·
--
Bullish
🚀 $XRP Is at a Level Worth Watching!
$XRP is approaching an important price zone where the next move could define its short-term direction.
If buyers step in and maintain control, we could see a recovery toward $1.20, with $1.50 becoming the next potential target.
But if selling pressure increases and support fails, another dip cannot be ruled out.
I'm watching price action closely. No rush, no emotional decisions — let the market confirm the direction first. 📊
$XRP
#XRP #Ripple #Crypto #Altcoins #Trading
🚀 $XRP Is at a Level Worth Watching!
$XRP is approaching an important price zone where the next move could define its short-term direction.
If buyers step in and maintain control, we could see a recovery toward $1.20, with $1.50 becoming the next potential target.
But if selling pressure increases and support fails, another dip cannot be ruled out.
I'm watching price action closely. No rush, no emotional decisions — let the market confirm the direction first. 📊
$XRP
#XRP #Ripple #Crypto #Altcoins #Trading
$XRP is approaching an important price zone where the next move could define its short-term direction.
If buyers step in and maintain control, we could see a recovery toward $1.20, with $1.50 becoming the next potential target.
But if selling pressure increases and support fails, another dip cannot be ruled out.
I'm watching price action closely. No rush, no emotional decisions — let the market confirm the direction first. 📊
$XRP
#XRP #Ripple #Crypto #Altcoins #Trading
315

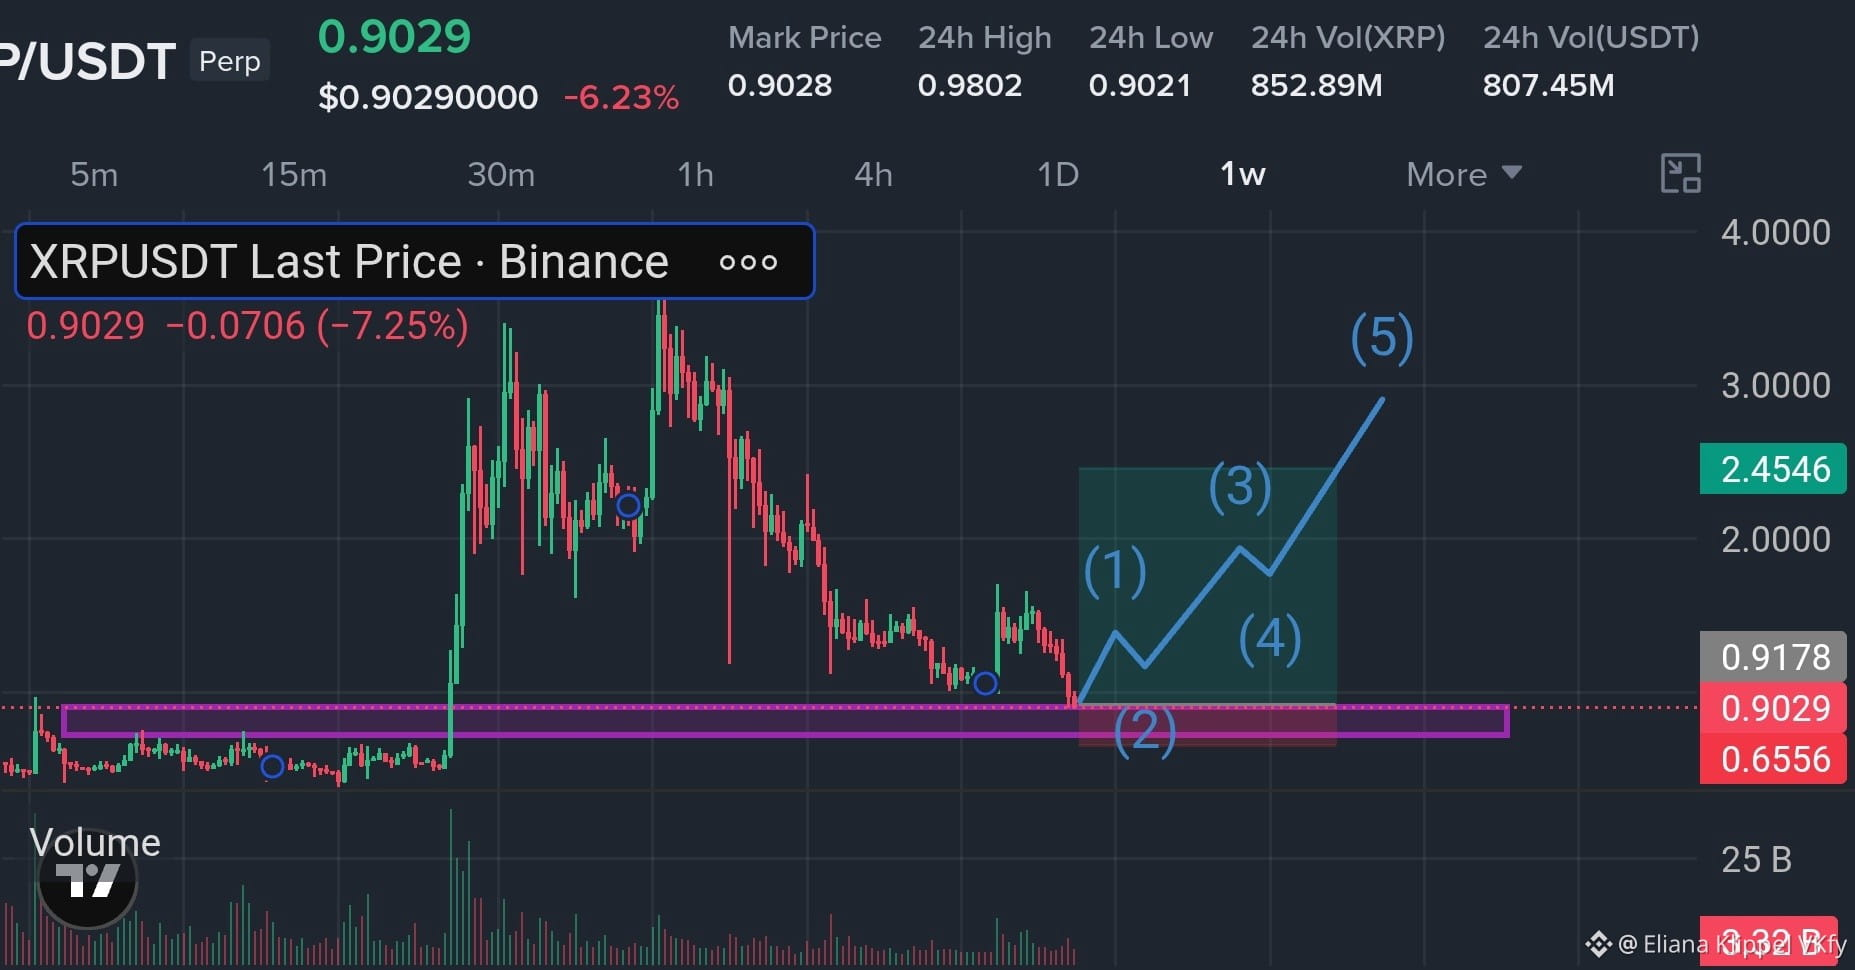
$XRP Alert 🚨
$XRP is near $0.91 after a sharp drop. RSI is oversold, but MACD and moving averages still look bearish.
The $0.8930 zone is now crucial. A strong bounce with volume could improve sentiment, while continued weakness may keep sellers in control.
Oversold doesn’t always mean bottom — watch volume and price reaction.
#XRP #crypto #Ripple #BinanceSquare
$XRP Alert 🚨
$XRP is near $0.91 after a sharp drop. RSI is oversold, but MACD and moving averages still look bearish.
The $0.8930 zone is now crucial. A strong bounce with volume could improve sentiment, while continued weakness may keep sellers in control.
Oversold doesn’t always mean bottom — watch volume and price reaction.
#XRP #crypto #Ripple #BinanceSquare
$XRP is near $0.91 after a sharp drop. RSI is oversold, but MACD and moving averages still look bearish.
The $0.8930 zone is now crucial. A strong bounce with volume could improve sentiment, while continued weakness may keep sellers in control.
Oversold doesn’t always mean bottom — watch volume and price reaction.
#XRP #crypto #Ripple #BinanceSquare
438

·
--
$XRP just slipped under my alert at $0.9132, and I caught the move before the chart got ugly. 😬
Down 5.10% today, with $152.76M traded. The 4h RSI is 35, but price is still below both the 20d and 50d averages. That isn’t a clean reversal yet.
At $0.90, I’d watch, not chase. Shorts are paying at -0.004%, so the crowd is leaning hard one way. Even $BNB looks steadier by comparison. 📉
Small bounce. Bigger question.
#XRP #CryptoNews #Web3
$XRP just slipped under my alert at $0.9132, and I caught the move before the chart got ugly. 😬
Down 5.10% today, with $152.76M traded. The 4h RSI is 35, but price is still below both the 20d and 50d averages. That isn’t a clean reversal yet.
At $0.90, I’d watch, not chase. Shorts are paying at -0.004%, so the crowd is leaning hard one way. Even $BNB looks steadier by comparison. 📉
Small bounce. Bigger question.
#XRP #CryptoNews #Web3
Down 5.10% today, with $152.76M traded. The 4h RSI is 35, but price is still below both the 20d and 50d averages. That isn’t a clean reversal yet.
At $0.90, I’d watch, not chase. Shorts are paying at -0.004%, so the crowd is leaning hard one way. Even $BNB looks steadier by comparison. 📉
Small bounce. Bigger question.
#XRP #CryptoNews #Web3
149

$XRP Coin Price Forecast ⚡💥☠️🚀🔥
If you invest $ 1,000.00 in XRP today and hold until Dec 29, 2026, our prediction suggests you could see a potential profit of $ 538.46, reflecting a 53.85% ROI over the next 43 days.
XRP has shown very strong potential lately, and this could be a good opportunity to dig right in and invest.
Price Prediction 2026
According to the technical analysis of prices expected in 2026, the minimum cost of will be $1.07. The maximum level that the XRP price can reach is $4.19. The average trading price is expected around $2.89.
Price Prediction 2027
After the analysis of the prices of in previous years, it is assumed that in 2027, the minimum price of will be around $3.03. The maximum expected XRP price may be around $4.33. On average, the trading price might be $4.24 in 2026.
Price Prediction 2028
Based on the technical analysis by cryptocurrency experts regarding the prices of , in 2028, XRP is expected to have the following minimum and maximum prices: about $6.92 and $8.59, respectively. The average expected trading cost is $7.17.
Price Prediction 2029
The experts in the field of cryptocurrency have analyzed the prices of and their fluctuations during the previous years. It is assumed that in 2029, the minimum XRP price might drop to $10.23, while its maximum can reach $12.26. On average, the trading cost will be around $10.52.
Please🙏 Follow Me ❤
#xrp
$XRP Coin Price Forecast ⚡💥☠️🚀🔥
If you invest $ 1,000.00 in XRP today and hold until Dec 29, 2026, our prediction suggests you could see a potential profit of $ 538.46, reflecting a 53.85% ROI over the next 43 days.
XRP has shown very strong potential lately, and this could be a good opportunity to dig right in and invest.
Price Prediction 2026
According to the technical analysis of prices expected in 2026, the minimum cost of will be $1.07. The maximum level that the XRP price can reach is $4.19. The average trading price is expected around $2.89.
Price Prediction 2027
After the analysis of the prices of in previous years, it is assumed that in 2027, the minimum price of will be around $3.03. The maximum expected XRP price may be around $4.33. On average, the trading price might be $4.24 in 2026.
Price Prediction 2028
Based on the technical analysis by cryptocurrency experts regarding the prices of , in 2028, XRP is expected to have the following minimum and maximum prices: about $6.92 and $8.59, respectively. The average expected trading cost is $7.17.
Price Prediction 2029
The experts in the field of cryptocurrency have analyzed the prices of and their fluctuations during the previous years. It is assumed that in 2029, the minimum XRP price might drop to $10.23, while its maximum can reach $12.26. On average, the trading cost will be around $10.52.
Please🙏 Follow Me ❤
#xrp
If you invest $ 1,000.00 in XRP today and hold until Dec 29, 2026, our prediction suggests you could see a potential profit of $ 538.46, reflecting a 53.85% ROI over the next 43 days.
XRP has shown very strong potential lately, and this could be a good opportunity to dig right in and invest.
Price Prediction 2026
According to the technical analysis of prices expected in 2026, the minimum cost of will be $1.07. The maximum level that the XRP price can reach is $4.19. The average trading price is expected around $2.89.
Price Prediction 2027
After the analysis of the prices of in previous years, it is assumed that in 2027, the minimum price of will be around $3.03. The maximum expected XRP price may be around $4.33. On average, the trading price might be $4.24 in 2026.
Price Prediction 2028
Based on the technical analysis by cryptocurrency experts regarding the prices of , in 2028, XRP is expected to have the following minimum and maximum prices: about $6.92 and $8.59, respectively. The average expected trading cost is $7.17.
Price Prediction 2029
The experts in the field of cryptocurrency have analyzed the prices of and their fluctuations during the previous years. It is assumed that in 2029, the minimum XRP price might drop to $10.23, while its maximum can reach $12.26. On average, the trading cost will be around $10.52.
Please🙏 Follow Me ❤
#xrp
Calskim-54:
Jajaja, hay alguien que crea esta mentira?
1
4
2.9k

·
--
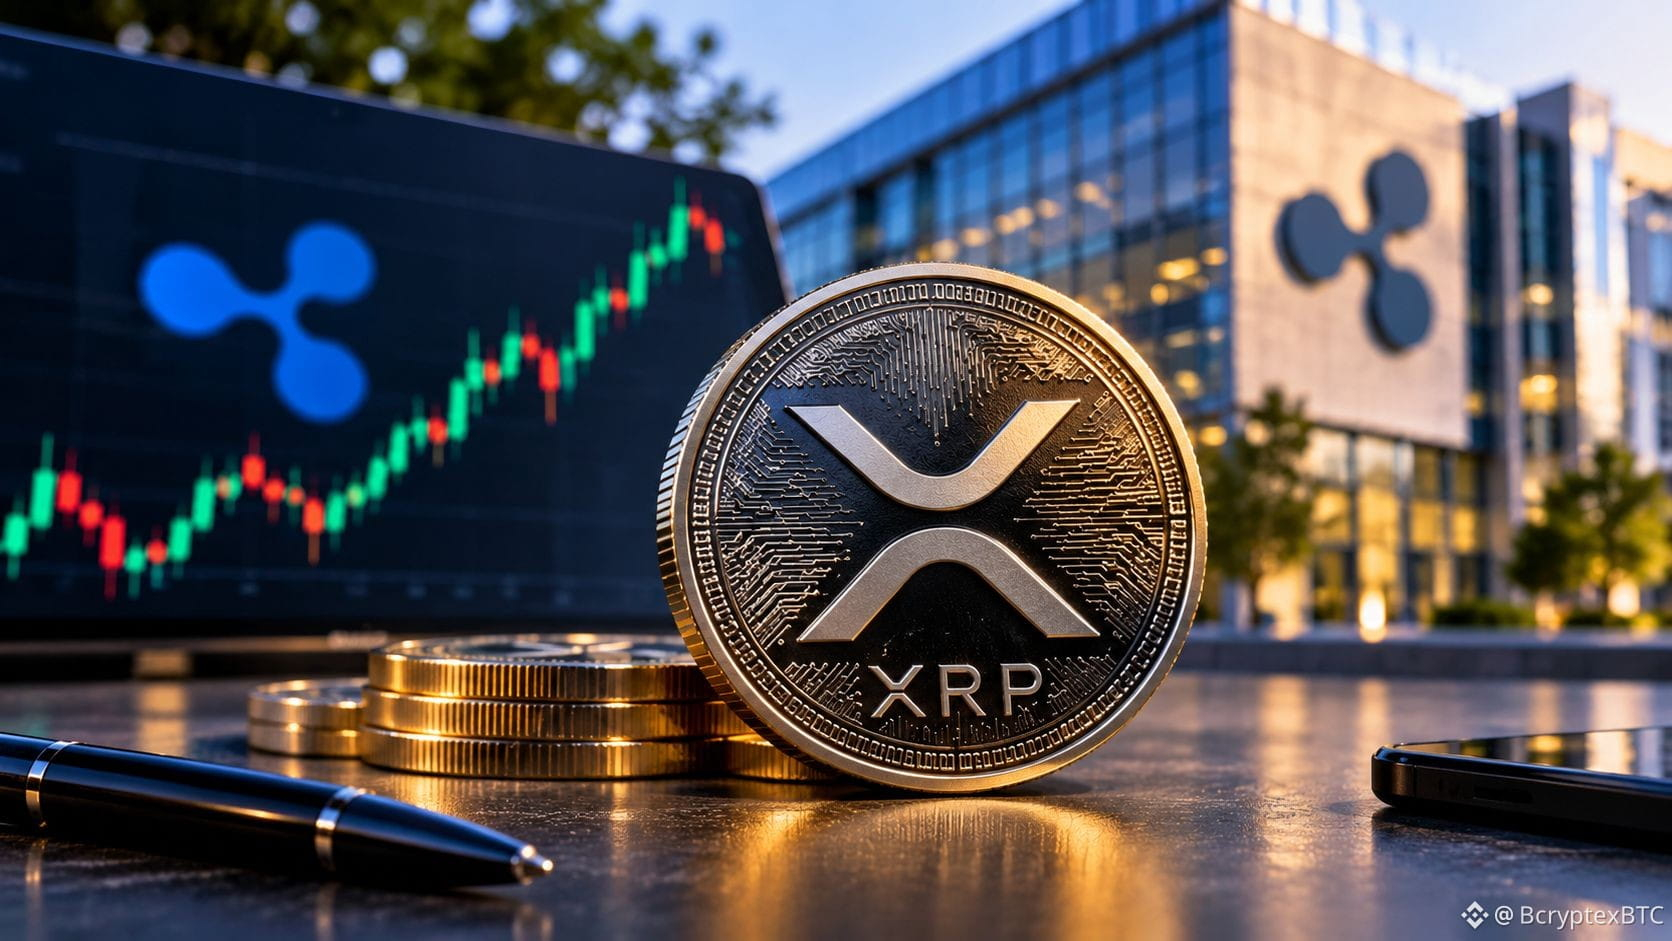
$XRP at $100: Adoption Alone Isn't Enough.
At $100, XRP's 63B circulating supply would imply a $6.3T market cap.
But higher transaction volume doesn't automatically mean stronger demand for the token.
The real test is whether institutional adoption creates sustained liquidity needs and long-term demand for $XRP .
My take: $100 isn't mathematically impossible, but utility must translate into lasting economic value.
Can real-world adoption justify such a massive valuation?
#XRP #Ripple #Crypto
$XRP at $100: Adoption Alone Isn't Enough.
At $100, XRP's 63B circulating supply would imply a $6.3T market cap.
But higher transaction volume doesn't automatically mean stronger demand for the token.
The real test is whether institutional adoption creates sustained liquidity needs and long-term demand for $XRP .
My take: $100 isn't mathematically impossible, but utility must translate into lasting economic value.
Can real-world adoption justify such a massive valuation?
#XRP #Ripple #Crypto
At $100, XRP's 63B circulating supply would imply a $6.3T market cap.
But higher transaction volume doesn't automatically mean stronger demand for the token.
The real test is whether institutional adoption creates sustained liquidity needs and long-term demand for $XRP .
My take: $100 isn't mathematically impossible, but utility must translate into lasting economic value.
Can real-world adoption justify such a massive valuation?
#XRP #Ripple #Crypto
1
318

·
--
Bullish
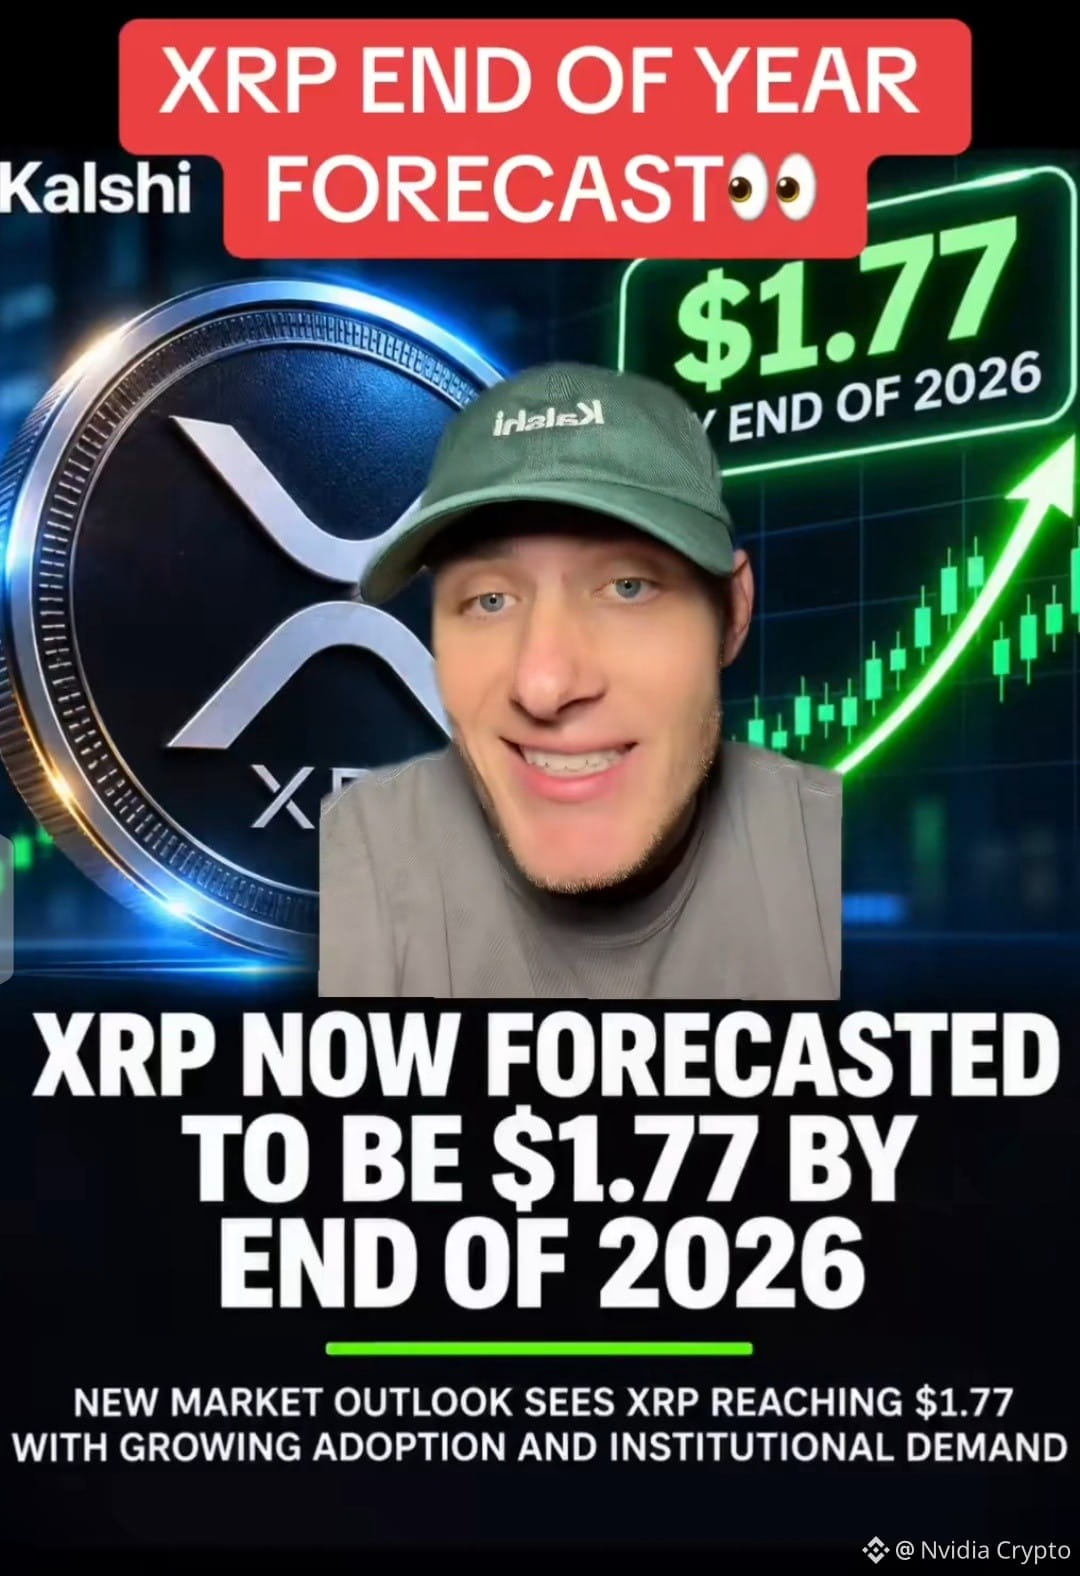
🚨 $XRP WILL EXPLODE BEFORE 2027? 🚀
💰 Current price: $0.96 🎯 Kalshi forecast: $1.77 📈 Potential upside: +84.4%
Just 41 days left in 2026!
Could Bitcoin's recovery, institutional demand, and fresh momentum trigger an explosive XRP comeback?
🔥 $1.77 OR BELOW $1.00?
What’s your prediction, $XRP Army?
#XRP #Ripple #Crypto #BinanceSquare
TRADE HERE🔥🔥
{future}(XRPUSDT)
🚨 $XRP WILL EXPLODE BEFORE 2027? 🚀
💰 Current price: $0.96 🎯 Kalshi forecast: $1.77 📈 Potential upside: +84.4%
Just 41 days left in 2026!
Could Bitcoin's recovery, institutional demand, and fresh momentum trigger an explosive XRP comeback?
🔥 $1.77 OR BELOW $1.00?
What’s your prediction, $XRP Army?
#XRP #Ripple #Crypto #BinanceSquare
TRADE HERE🔥🔥
💰 Current price: $0.96 🎯 Kalshi forecast: $1.77 📈 Potential upside: +84.4%
Just 41 days left in 2026!
Could Bitcoin's recovery, institutional demand, and fresh momentum trigger an explosive XRP comeback?
🔥 $1.77 OR BELOW $1.00?
What’s your prediction, $XRP Army?
#XRP #Ripple #Crypto #BinanceSquare
TRADE HERE🔥🔥
Tiffany Barbier U1r7:
XRP will never surpass $10.
1
2
746

·
--
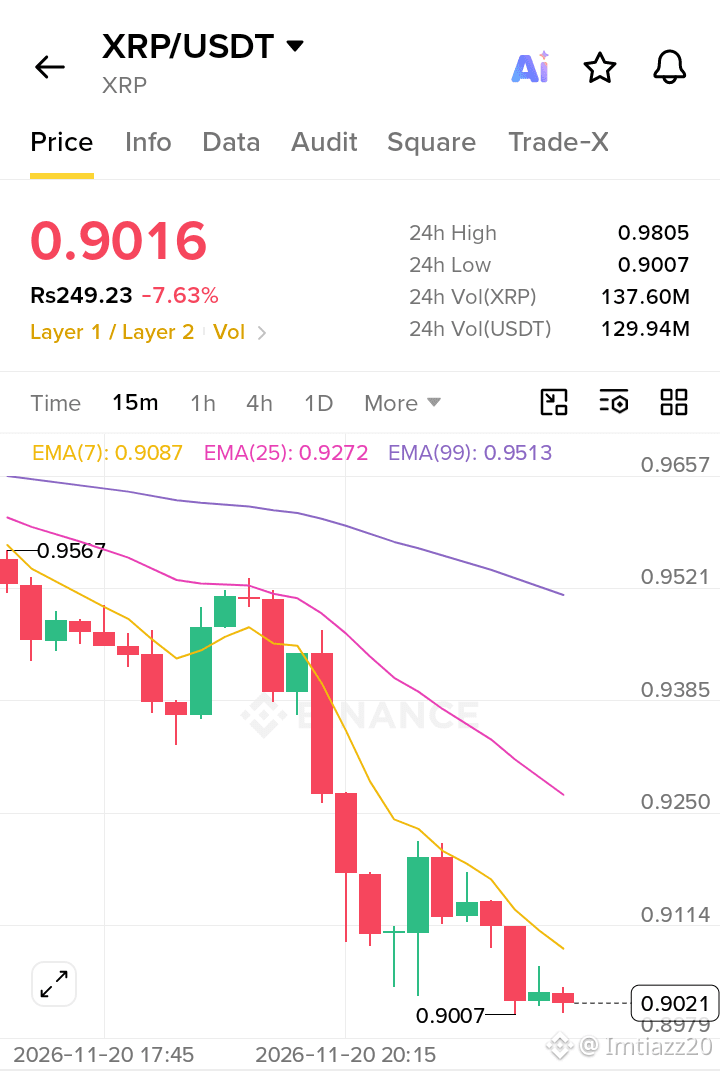
$XRP : THE SELL-OFF IS GETTING EXTREME — BUT ARE BUYERS READY TO STEP IN?
XRP is trading near $0.90, down around 5.4% in 24 hours.
Here's what traders need to watch:
RSI: Around 25 — deeply oversold.
Key support: $0.89–$0.90.
Resistance: $0.98–$1.00.
Bullish development: Binance XRP supply shortage index hit a 5-month high of 2.4.
Bearish pressure: US spot XRP ETFs recorded 15 consecutive trading days without inflows.
A bounce is possible, but confirmation matters. Reclaiming $1.00 could change the momentum. Losing $0.89 could invite more downside.
#xrp
{spot}(XRPUSDT)
$XRP : THE SELL-OFF IS GETTING EXTREME — BUT ARE BUYERS READY TO STEP IN?
XRP is trading near $0.90, down around 5.4% in 24 hours.
Here's what traders need to watch:
RSI: Around 25 — deeply oversold.
Key support: $0.89–$0.90.
Resistance: $0.98–$1.00.
Bullish development: Binance XRP supply shortage index hit a 5-month high of 2.4.
Bearish pressure: US spot XRP ETFs recorded 15 consecutive trading days without inflows.
A bounce is possible, but confirmation matters. Reclaiming $1.00 could change the momentum. Losing $0.89 could invite more downside.
#xrp
XRP is trading near $0.90, down around 5.4% in 24 hours.
Here's what traders need to watch:
RSI: Around 25 — deeply oversold.
Key support: $0.89–$0.90.
Resistance: $0.98–$1.00.
Bullish development: Binance XRP supply shortage index hit a 5-month high of 2.4.
Bearish pressure: US spot XRP ETFs recorded 15 consecutive trading days without inflows.
A bounce is possible, but confirmation matters. Reclaiming $1.00 could change the momentum. Losing $0.89 could invite more downside.
#xrp
2
302

·
--
Bullish
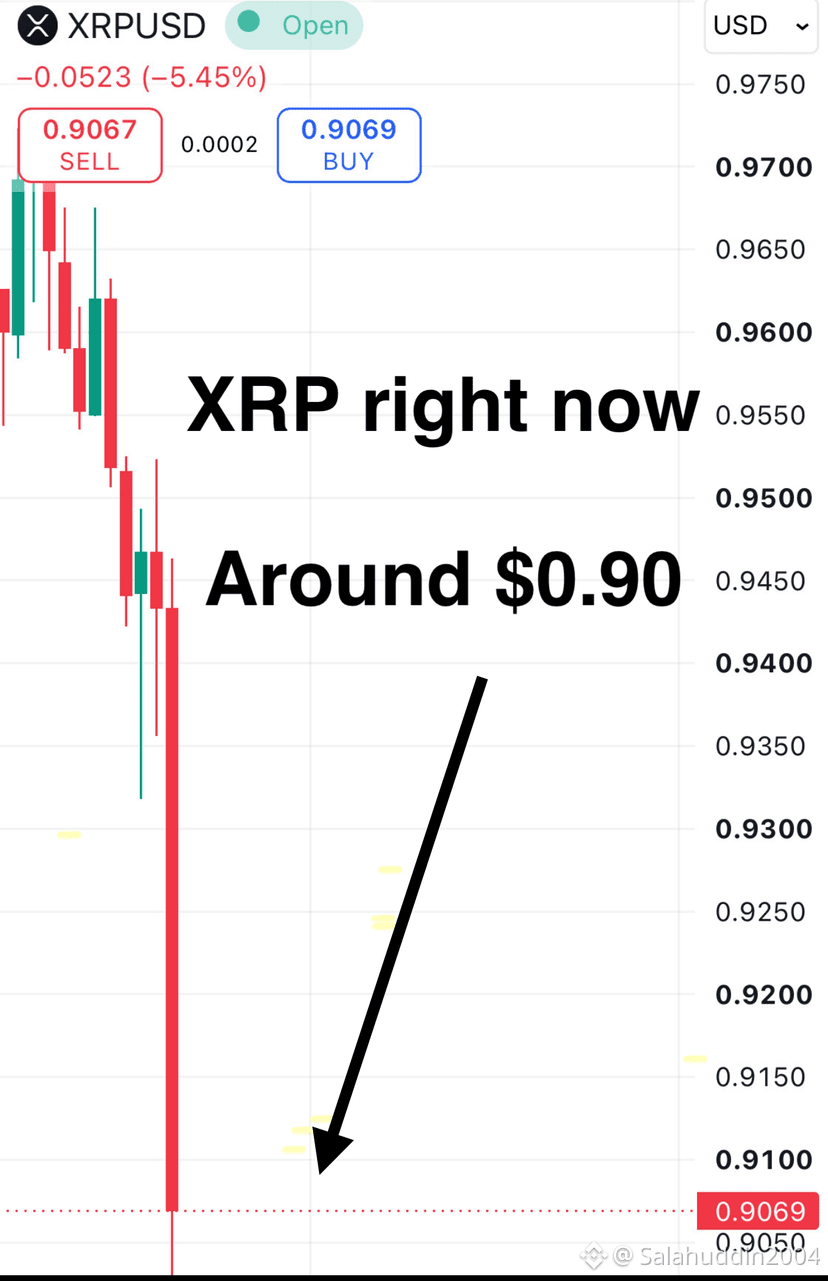
$XRP
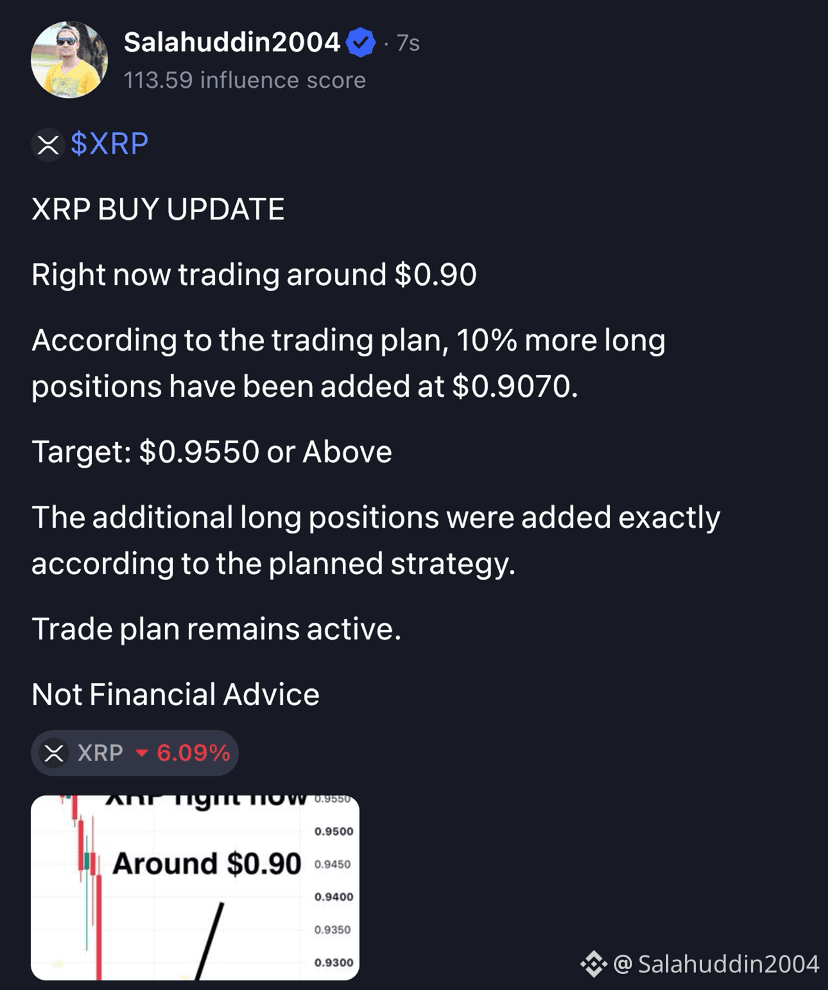
XRP BUY UPDATE
Right now trading around $0.90
According to the trading plan, 10% more long positions have been added at $0.9070.
Target: $0.9550 or Above
The additional long positions were added exactly according to the planned strategy.
Trade plan remains active.
Not Financial Advice
#xrp
$XRP
XRP BUY UPDATE
Right now trading around $0.90
According to the trading plan, 10% more long positions have been added at $0.9070.
Target: $0.9550 or Above
The additional long positions were added exactly according to the planned strategy.
Trade plan remains active.
Not Financial Advice
#xrp
XRP BUY UPDATE
Right now trading around $0.90
According to the trading plan, 10% more long positions have been added at $0.9070.
Target: $0.9550 or Above
The additional long positions were added exactly according to the planned strategy.
Trade plan remains active.
Not Financial Advice
#xrp
1
397

·
--
Bearish
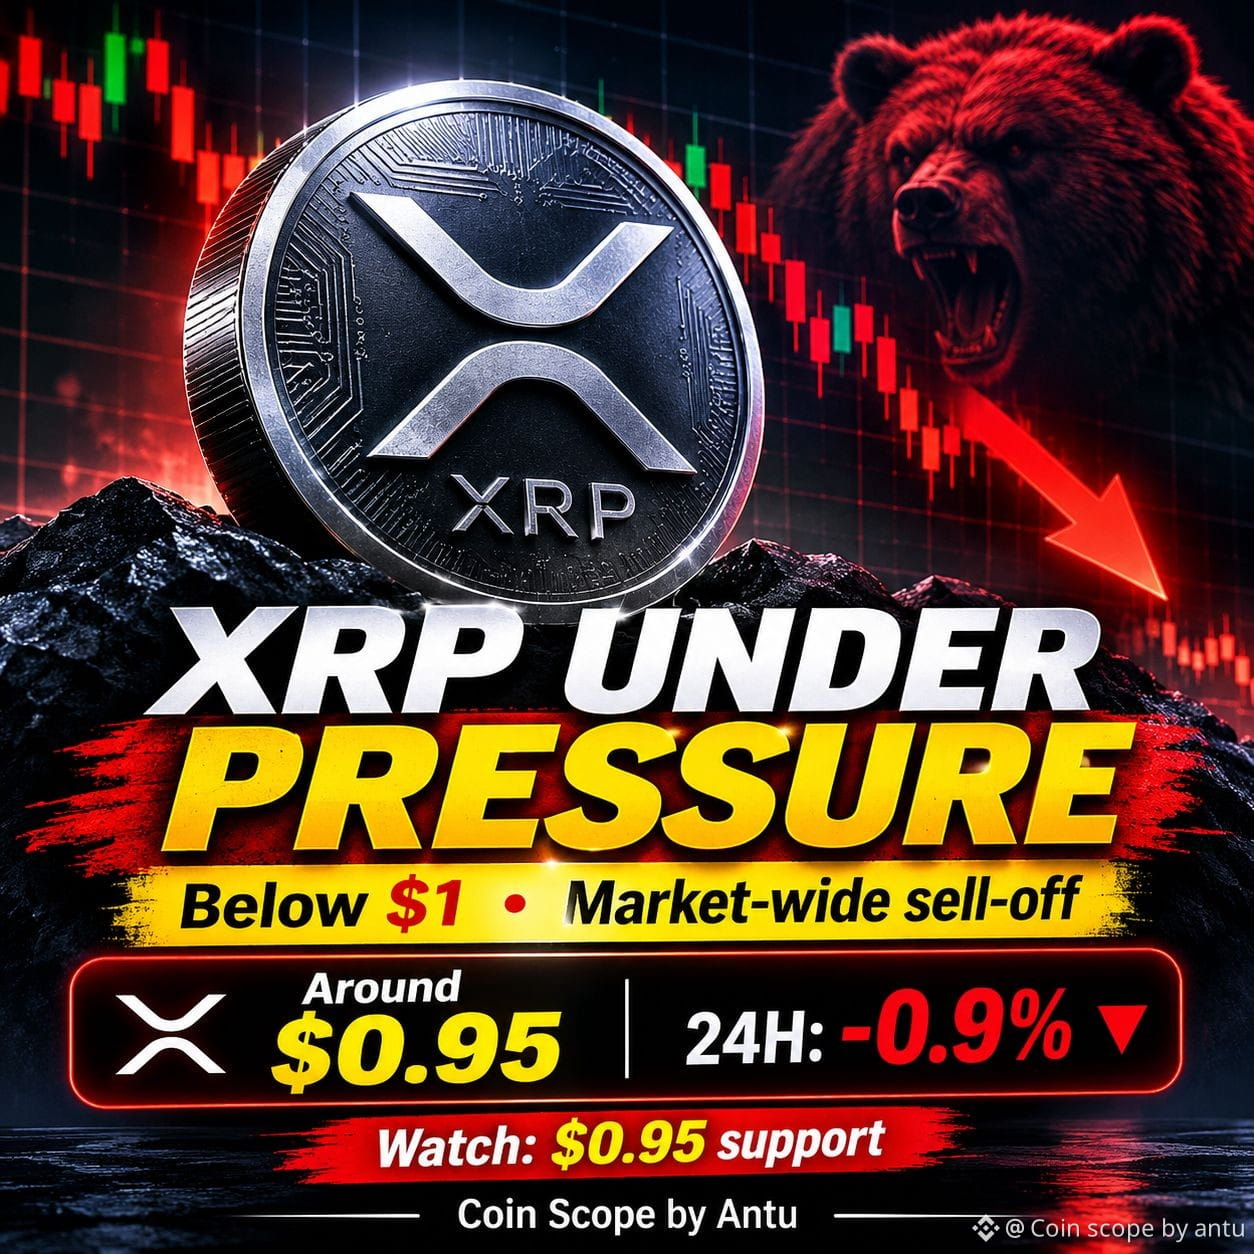
🚨$XRP UNDER PRESSURE! Can Buyers Defend the $0.95 Level? 📉
XRP is facing another challenging moment as the broader crypto market continues to struggle.
🔥 What's happening?
-$XRP is trading around $0.95.
- The price remains below the important $1 level.
- Recent ETF outflows are adding pressure.
- Overall market weakness is affecting investor confidence.
👀 What should traders watch?
$0.95 is an important level to watch. A recovery could bring buyers back, while further weakness may increase selling pressure.
Is this a buying opportunity or another warning sign?
💬 Share your thoughts below!
Follow Coin Scope by Antu for more crypto news and market updates.
#xrp #CryptoNews #BinanceSquare #CryptoMarket #trading
{spot}(XRPUSDT)
🚨$XRP UNDER PRESSURE! Can Buyers Defend the $0.95 Level? 📉
XRP is facing another challenging moment as the broader crypto market continues to struggle.
🔥 What's happening?
-$XRP is trading around $0.95.
- The price remains below the important $1 level.
- Recent ETF outflows are adding pressure.
- Overall market weakness is affecting investor confidence.
👀 What should traders watch?
$0.95 is an important level to watch. A recovery could bring buyers back, while further weakness may increase selling pressure.
Is this a buying opportunity or another warning sign?
💬 Share your thoughts below!
Follow Coin Scope by Antu for more crypto news and market updates.
#xrp #CryptoNews #BinanceSquare #CryptoMarket #trading
XRP is facing another challenging moment as the broader crypto market continues to struggle.
🔥 What's happening?
-$XRP is trading around $0.95.
- The price remains below the important $1 level.
- Recent ETF outflows are adding pressure.
- Overall market weakness is affecting investor confidence.
👀 What should traders watch?
$0.95 is an important level to watch. A recovery could bring buyers back, while further weakness may increase selling pressure.
Is this a buying opportunity or another warning sign?
💬 Share your thoughts below!
Follow Coin Scope by Antu for more crypto news and market updates.
#xrp #CryptoNews #BinanceSquare #CryptoMarket #trading
1
274

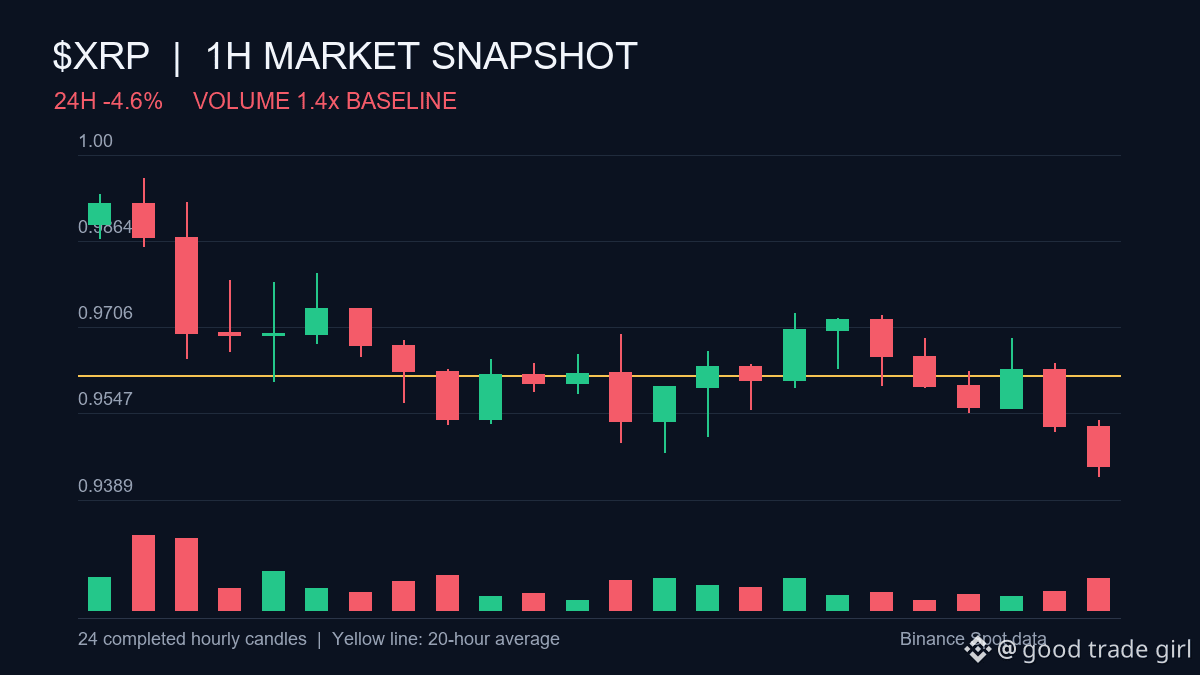
$XRP is -4.6% over 24h; the last closed hour moved -0.8%.
Hourly volume was 1.4x its prior 20-hour average. Price is below the 20-hour average at $0.9617.
Single-window read; no trend claim.
Would you watch price first, or wait to see whether volume holds?
#XRP #LargeCaps #MarketWatch
$XRP is -4.6% over 24h; the last closed hour moved -0.8%.
Hourly volume was 1.4x its prior 20-hour average. Price is below the 20-hour average at $0.9617.
Single-window read; no trend claim.
Would you watch price first, or wait to see whether volume holds?
#XRP #LargeCaps #MarketWatch
Hourly volume was 1.4x its prior 20-hour average. Price is below the 20-hour average at $0.9617.
Single-window read; no trend claim.
Would you watch price first, or wait to see whether volume holds?
#XRP #LargeCaps #MarketWatch
1
182
Log in to explore more content
Join global crypto users on Binance Square
⚡️ Get latest and useful information about crypto.
💬 Trusted by the world’s largest crypto exchange.
👍 Discover real insights from verified creators.
Email / Phone number
Trending Topics
1
#CanBTCReboundAfterFallingBelow60K?
111,991 views
501 Discussing
2
#GlobalStocksFaceLongestLosingStreakSince2023
48,293 views
494 Discussing
3
#AnthropicPlungesTowardIPOPriceonDay2
16,643 views
198 Discussing
4
#GaoTengBitcoinETFListsOnHKEX
36,530 views
386 Discussing
5
#TradFiForBeginners
1M views
5,816 Discussing
6
#NvidiaBoardReportedlySplitOverHuang’sReturn
397,953 views
2,580 Discussing
7
#TetherBurns8BillionUSDTInPast20Days
42,864 views
158 Discussing
8
#BitcoinWalletSignatureFlawExploitableWithinSeconds
12,076 views
75 Discussing
9
#CanGTA6'sLaunchLiftTTWOShares?
334,345 views
1,807 Discussing
10
#HongKongProposesSFCLicensingForFourVirtualAssetServices
2,133 views
36 Discussing