

#orderbook
orderbook
58,540 views
431 Discussing
Hot
Latest

·
--
The order book is where traders place bids and asks for $BTC. Bids are what buyers are willing to pay, while asks are what sellers are willing to accept. The difference between the best bid and ask is the spread. For example, if the best bid is sitting at 35000 and the best ask is at 35050, the spread is 50. Market depth refers to the total amount of bids and asks at each level. A deep market has many bids and asks, making it more stable. In a shallow market, there are fewer bids and asks, making it more volatile. Understanding order book mechanics is key to navigating markets like $ETH and $LTC. Trading with knowledge of bids, asks, and spread can help traders make informed decisions. #tradingbasics #orderbook #marketdepth
The order book is where traders place bids and asks for $BTC . Bids are what buyers are willing to pay, while asks are what sellers are willing to accept. The difference between the best bid and ask is the spread. For example, if the best bid is sitting at 35000 and the best ask is at 35050, the spread is 50. Market depth refers to the total amount of bids and asks at each level. A deep market has many bids and asks, making it more stable. In a shallow market, there are fewer bids and asks, making it more volatile. Understanding order book mechanics is key to navigating markets like $ETH and $LTC . Trading with knowledge of bids, asks, and spread can help traders make informed decisions. #tradingbasics #orderbook #marketdepth
75

Demystifying Market Depth: How to Read Order Books and Manage Execution RiskWhen entering the cryptocurrency market, beginner traders often devote most of their time to analyzing candlestick charts and momentum indicators. While historical price patterns offer valuable insights into market sentiment, they only tell half the story. The price displayed on a standard chart represents the last completed trade—a historical footprint. It does not explicitly reveal where future buying or selling interest lies.
To understand true market supply and demand, intermediate traders must look beneath the surface of raw price charts and master the concept of market depth. Understanding market depth allows market participants to evaluate liquidity, anticipate short-term price resistance, accurately project execution costs, and mitigate hidden risks such as slippage.
---
### 1. The Core Architecture of Market Depth
At its core, market depth measures an exchange's ability to absorb large trade orders without causing significant price movements. Market depth is sustained by the order book—a continuously updating electronic ledger that matches buyers and sellers.
An order book consists of two main sides:
* **Bids (Buy Orders):** The list of active limit orders from buyers who wish to purchase an asset at a specified price or lower. Bids are arranged in descending order, with the highest buy offer sitting at the top of the bid column.
* **Asks or Offers (Sell Orders):** The list of active limit orders from sellers offering to sell an asset at a specified price or higher. Asks are arranged in ascending order, with the lowest sell offer sitting at the top of the ask column.
The difference between the highest bid price and the lowest ask price is known as the **bid-ask spread**.
In high-liquidity assets like Bitcoin or Ethereum on major exchanges, the bid-ask spread is typically negligible—often fractions of a cent or a fraction of a percent. This narrow spread indicates a highly efficient market with abundant active participants. Conversely, low-cap altcoins or assets listed on illiquid exchanges often exhibit wide spreads. A wide spread signifies lower liquidity, forcing traders to pay a premium when buying or accept a discount when selling.
---
### 2. Reading the Depth Chart: Visualizing Supply and Demand
Most modern exchange interfaces provide a visual representation of market depth alongside the order book text columns. This graph, commonly referred to as the **Depth Chart**, plots cumulative order volume on the vertical axis against asset price on the horizontal axis.
The depth chart is divided into two colored slopes:
* **Green Slope (Bids):** Represents the cumulative volume of buy orders sitting below the current market price.
* **Red Slope (Asks):** Represents the cumulative volume of sell orders sitting above the current market price.
#### Buy Walls and Sell Walls
When examining a depth chart, traders often notice steep vertical spikes along either side of the curve. These visual barriers are known as "walls."
* **Buy Wall:** A massive accumulation of limit buy orders concentrated at a specific price level. A substantial buy wall indicates strong support, as market sellers must consume all the volume in that wall before the price can decline further.
* **Sell Wall:** A massive accumulation of limit sell orders concentrated at a specific price level. A sell wall acts as heavy resistance, requiring buyers to absorb significant volume before the price can push higher.
While walls can represent genuine institutional interest or psychological price levels (such as round numbers like $50,000 or $100), traders must approach them with caution, as order books are dynamic and subject to strategic manipulation.
---
### 3. Practical Application: Calculating Slippage and Real Execution Costs
One of the most practical applications of market depth analysis is calculating **slippage**—the difference between the expected price of a trade and the price at which the trade is actually executed.
Slippage typically occurs when using market orders during periods of low market depth or high price volatility. A market order prioritizes execution speed over price, filling immediately against the best available limit orders in the order book.
#### A Walkthrough Calculation of Slippage
Imagine a trader wants to execute a market buy order for 5 units of an asset. The asset's last traded price is $1,000, leading the trader to assume the trade will cost roughly $5,000.
However, looking at the current ask side of the order book reveals thin liquidity:
* **Level 1 Ask:** 1 unit available at $1,001
* **Level 2 Ask:** 2 units available at $1,005
* **Level 3 Ask:** 2 units available at $1,010
When the trader submits a market buy order for 5 units, the exchange matches the order sequentially down the order book:
1. The first 1 unit fills at **$1,001** (Total: $1,001)
2. The next 2 units fill at **$1,005** (Total: $2,010)
3. The final 2 units fill at **$1,010** (Total: $2,020)
**Total Capital Spent:** $1,001 + $2,010 + $2,020 = **$5,031**
**Average Execution Price per Unit:** $5,031 / 5 = **$1,006.20**
Because the order book lacked sufficient depth at the top ask price, the trader experienced an average execution price $6.20 higher per unit than the lowest available ask. On large institutional orders or low-liquidity pairs, slippage can easily reach several percentage points, drastically impairing trade profitability.
---
### 4. Market Depth Distortions, Manipulation, and Risks
While market depth provides valuable insights, relying solely on static order book data introduces significant risks. Order books are fluid environments where orders can be placed, modified, or canceled within milliseconds.
#### Phantom Liquidity and Spoofing
Not all visible order book liquidity represents a genuine intention to trade. **Spoofing** occurs when a trader places large limit orders (buy or sell walls) with no intention of letting them fill. The goal is to create a false impression of market demand or supply, tricking other market participants into buying or selling ahead of the wall. Once price approaches the fake order, the spoofer cancels it instantly.
#### Iceberg Orders
Institutional traders executing multi-million dollar positions rarely submit a single, massive limit order, as doing so would alert the market and push prices away from their entry point. Instead, they use **iceberg orders**. An iceberg order splits a large order into small, visible tranches. As soon as one visible tranche fills, another is automatically posted. Consequently, an apparently thin order book may conceal substantial underlying liquidity.
#### Liquidation Cascades and Thin Liquidity
During market-wide volatility, depth can deteriorate rapidly. In leveraged derivatives markets, falling prices trigger automated market liquidations. These forced market sell orders sweep through bid depth rapidly. If buying interest is thin, price slippage accelerates, triggering further liquidations lower down the book. This creates a severe cascade effect where price decouples temporarily from fundamental valuation.
---
### 5. Execution Strategies for Intermediate Traders
To navigate market depth effectively and minimize execution costs, traders can adopt several tactical approaches:
1. **Use Limit Orders to Control Price:** By utilizing limit orders rather than market orders, you ensure your trade executes only at your specified price or better, completely eliminating negative slippage (though introducing the risk of non-execution).
2. **Split Large Orders (Scaling In/Out):** If trading size relative to the asset's average depth, break the total trade into smaller tranches spread across time or price levels.
3. **Utilize Algorithmic Orders:** Algorithmic tools like Time-Weighted Average Price (TWAP) allow traders to distribute orders automatically over a set period, minimizing order book footprint and reducing market impact.
4. **Monitor Cross-Venue Liquidity:** Cryptocurrency markets are fragmented across multiple global exchanges. Liquidity that appears thin on one venue may be significantly deeper on another.
---
### Summary
Market depth serves as the vital link between raw trade data and price action. By learning to interpret order books, spot real versus prospective liquidity, and calculate potential slippage, intermediate traders transition from simply reacting to price movements to understanding the underlying mechanics that drive them. Always remember that order books are dynamic tools; pairing depth analysis with disciplined risk management remains essential for long-term trading consistency.
#CryptoEducation #OrderBook #TradingStrategy
Demystifying Market Depth: How to Read Order Books and Manage Execution Risk
When entering the cryptocurrency market, beginner traders often devote most of their time to analyzing candlestick charts and momentum indicators. While historical price patterns offer valuable insights into market sentiment, they only tell half the story. The price displayed on a standard chart represents the last completed trade—a historical footprint. It does not explicitly reveal where future buying or selling interest lies.
To understand true market supply and demand, intermediate traders must look beneath the surface of raw price charts and master the concept of market depth. Understanding market depth allows market participants to evaluate liquidity, anticipate short-term price resistance, accurately project execution costs, and mitigate hidden risks such as slippage.
---
### 1. The Core Architecture of Market Depth
At its core, market depth measures an exchange's ability to absorb large trade orders without causing significant price movements. Market depth is sustained by the order book—a continuously updating electronic ledger that matches buyers and sellers.
An order book consists of two main sides:
* **Bids (Buy Orders):** The list of active limit orders from buyers who wish to purchase an asset at a specified price or lower. Bids are arranged in descending order, with the highest buy offer sitting at the top of the bid column.
* **Asks or Offers (Sell Orders):** The list of active limit orders from sellers offering to sell an asset at a specified price or higher. Asks are arranged in ascending order, with the lowest sell offer sitting at the top of the ask column.
The difference between the highest bid price and the lowest ask price is known as the **bid-ask spread**.
In high-liquidity assets like Bitcoin or Ethereum on major exchanges, the bid-ask spread is typically negligible—often fractions of a cent or a fraction of a percent. This narrow spread indicates a highly efficient market with abundant active participants. Conversely, low-cap altcoins or assets listed on illiquid exchanges often exhibit wide spreads. A wide spread signifies lower liquidity, forcing traders to pay a premium when buying or accept a discount when selling.
---
### 2. Reading the Depth Chart: Visualizing Supply and Demand
Most modern exchange interfaces provide a visual representation of market depth alongside the order book text columns. This graph, commonly referred to as the **Depth Chart**, plots cumulative order volume on the vertical axis against asset price on the horizontal axis.
The depth chart is divided into two colored slopes:
* **Green Slope (Bids):** Represents the cumulative volume of buy orders sitting below the current market price.
* **Red Slope (Asks):** Represents the cumulative volume of sell orders sitting above the current market price.
#### Buy Walls and Sell Walls
When examining a depth chart, traders often notice steep vertical spikes along either side of the curve. These visual barriers are known as "walls."
* **Buy Wall:** A massive accumulation of limit buy orders concentrated at a specific price level. A substantial buy wall indicates strong support, as market sellers must consume all the volume in that wall before the price can decline further.
* **Sell Wall:** A massive accumulation of limit sell orders concentrated at a specific price level. A sell wall acts as heavy resistance, requiring buyers to absorb significant volume before the price can push higher.
While walls can represent genuine institutional interest or psychological price levels (such as round numbers like $50,000 or $100), traders must approach them with caution, as order books are dynamic and subject to strategic manipulation.
---
### 3. Practical Application: Calculating Slippage and Real Execution Costs
One of the most practical applications of market depth analysis is calculating **slippage**—the difference between the expected price of a trade and the price at which the trade is actually executed.
Slippage typically occurs when using market orders during periods of low market depth or high price volatility. A market order prioritizes execution speed over price, filling immediately against the best available limit orders in the order book.
#### A Walkthrough Calculation of Slippage
Imagine a trader wants to execute a market buy order for 5 units of an asset. The asset's last traded price is $1,000, leading the trader to assume the trade will cost roughly $5,000.
However, looking at the current ask side of the order book reveals thin liquidity:
* **Level 1 Ask:** 1 unit available at $1,001
* **Level 2 Ask:** 2 units available at $1,005
* **Level 3 Ask:** 2 units available at $1,010
When the trader submits a market buy order for 5 units, the exchange matches the order sequentially down the order book:
1. The first 1 unit fills at **$1,001** (Total: $1,001)
2. The next 2 units fill at **$1,005** (Total: $2,010)
3. The final 2 units fill at **$1,010** (Total: $2,020)
**Total Capital Spent:** $1,001 + $2,010 + $2,020 = **$5,031**
**Average Execution Price per Unit:** $5,031 / 5 = **$1,006.20**
Because the order book lacked sufficient depth at the top ask price, the trader experienced an average execution price $6.20 higher per unit than the lowest available ask. On large institutional orders or low-liquidity pairs, slippage can easily reach several percentage points, drastically impairing trade profitability.
---
### 4. Market Depth Distortions, Manipulation, and Risks
While market depth provides valuable insights, relying solely on static order book data introduces significant risks. Order books are fluid environments where orders can be placed, modified, or canceled within milliseconds.
#### Phantom Liquidity and Spoofing
Not all visible order book liquidity represents a genuine intention to trade. **Spoofing** occurs when a trader places large limit orders (buy or sell walls) with no intention of letting them fill. The goal is to create a false impression of market demand or supply, tricking other market participants into buying or selling ahead of the wall. Once price approaches the fake order, the spoofer cancels it instantly.
#### Iceberg Orders
Institutional traders executing multi-million dollar positions rarely submit a single, massive limit order, as doing so would alert the market and push prices away from their entry point. Instead, they use **iceberg orders**. An iceberg order splits a large order into small, visible tranches. As soon as one visible tranche fills, another is automatically posted. Consequently, an apparently thin order book may conceal substantial underlying liquidity.
#### Liquidation Cascades and Thin Liquidity
During market-wide volatility, depth can deteriorate rapidly. In leveraged derivatives markets, falling prices trigger automated market liquidations. These forced market sell orders sweep through bid depth rapidly. If buying interest is thin, price slippage accelerates, triggering further liquidations lower down the book. This creates a severe cascade effect where price decouples temporarily from fundamental valuation.
---
### 5. Execution Strategies for Intermediate Traders
To navigate market depth effectively and minimize execution costs, traders can adopt several tactical approaches:
1. **Use Limit Orders to Control Price:** By utilizing limit orders rather than market orders, you ensure your trade executes only at your specified price or better, completely eliminating negative slippage (though introducing the risk of non-execution).
2. **Split Large Orders (Scaling In/Out):** If trading size relative to the asset's average depth, break the total trade into smaller tranches spread across time or price levels.
3. **Utilize Algorithmic Orders:** Algorithmic tools like Time-Weighted Average Price (TWAP) allow traders to distribute orders automatically over a set period, minimizing order book footprint and reducing market impact.
4. **Monitor Cross-Venue Liquidity:** Cryptocurrency markets are fragmented across multiple global exchanges. Liquidity that appears thin on one venue may be significantly deeper on another.
---
### Summary
Market depth serves as the vital link between raw trade data and price action. By learning to interpret order books, spot real versus prospective liquidity, and calculate potential slippage, intermediate traders transition from simply reacting to price movements to understanding the underlying mechanics that drive them. Always remember that order books are dynamic tools; pairing depth analysis with disciplined risk management remains essential for long-term trading consistency.
#CryptoEducation #OrderBook #TradingStrategy
120

BINANCE CRYPTO LEARNING SERIES — PART 112
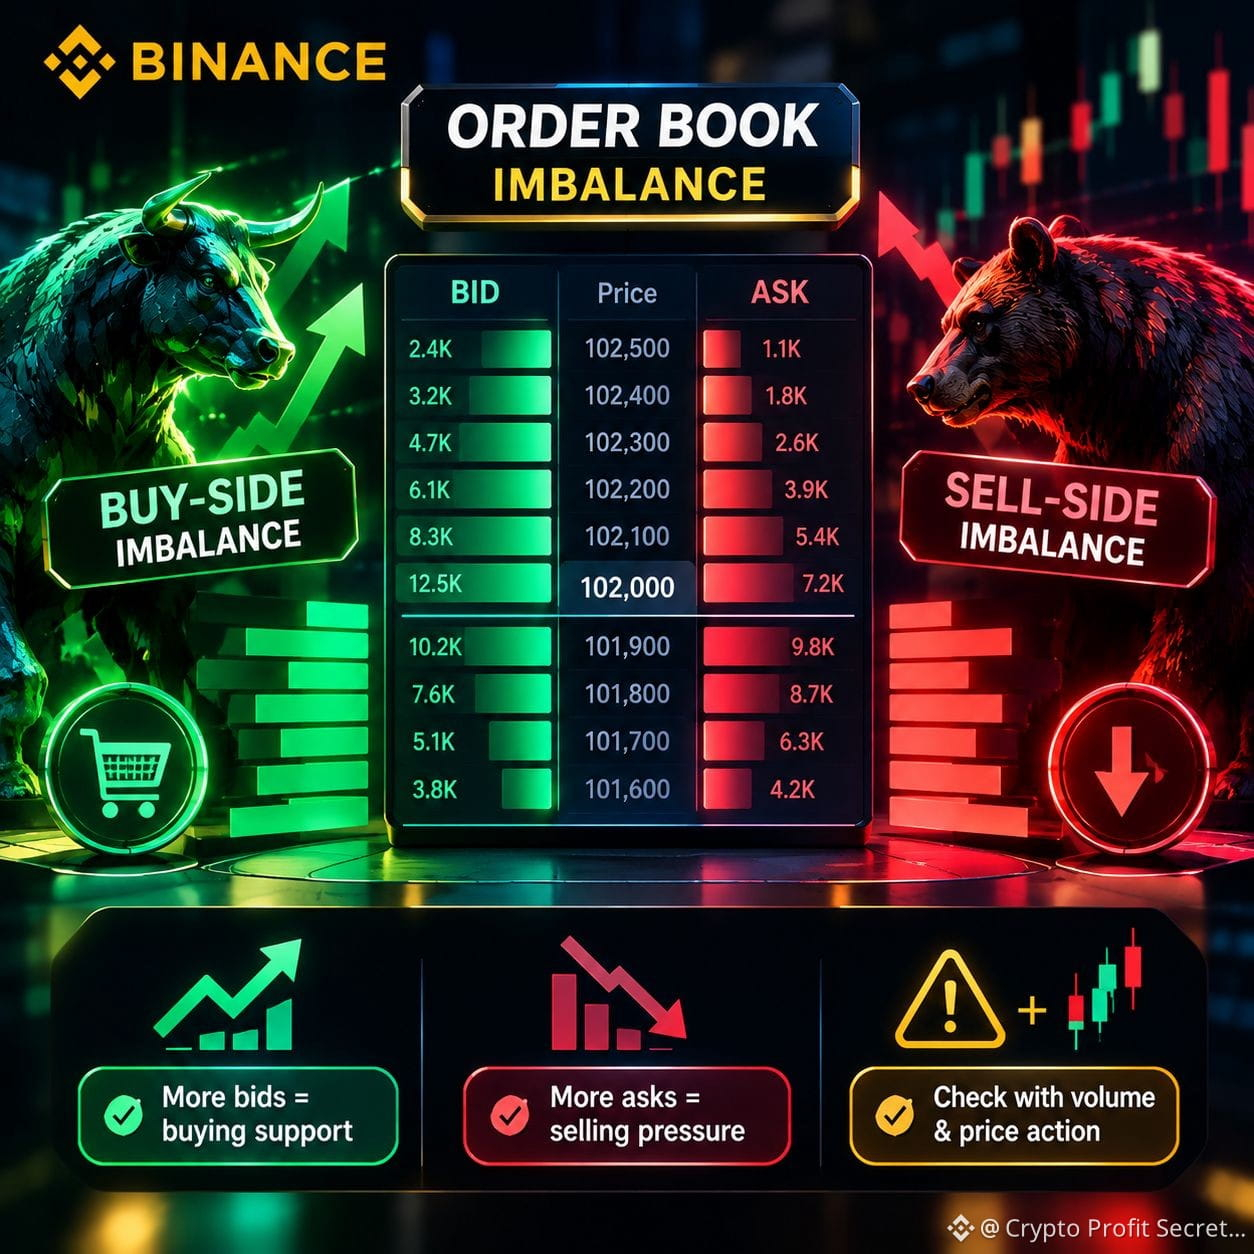
🔥 Order Book Imbalance: Are Buyers or Sellers Stronger?
The Order Book shows which side has more orders at the current price: buyers or sellers.
🟢 More Bids: A clue to buying support.
🔴 More Asks: A clue to selling pressure.
⚠️ Remember: Orders can also be canceled. The Order Book alone cannot confirm price direction.
🧠 Golden Rule: Check the Order Book alongside Volume and Price Action.
#BinanceSquare #OrderBook #cryptotrading #tradingeducation #BTC $BTC
{spot}(BTCUSDT)
BINANCE CRYPTO LEARNING SERIES — PART 112
🔥 Order Book Imbalance: Are Buyers or Sellers Stronger?
The Order Book shows which side has more orders at the current price: buyers or sellers.
🟢 More Bids: A clue to buying support.
🔴 More Asks: A clue to selling pressure.
⚠️ Remember: Orders can also be canceled. The Order Book alone cannot confirm price direction.
🧠 Golden Rule: Check the Order Book alongside Volume and Price Action.
#BinanceSquare #OrderBook #cryptotrading #tradingeducation #BTC $BTC
2
56
·
--
USDT/VES: Binance Concentrates Depth While Other Platforms Set the AskLive P2P Radar Snapshot: 10/24/2026, 2:00:10 a.m.
USDT/VES reference Bs. 1019.21
Buy USDT Bs. 1019.21
Sell USDT Bs. 977.80
BCV Bs. 887.30
Premium vs. BCV 14.87%
P2P spread 4.23%
Offers observed 182
Verify current data on Radar P2P
October 24, 2026, 06:00 (snapshot time). The USDT/VES P2P market does not have a single price: it has an aggregated reference, a bid, an ask, and a different spread for each bank. This is the day's snapshot, with measurable figures and a caveat: comparing platforms and banks changes the number you see on screen.
USDT/VES: Binance Concentrates Depth While Other Platforms Set the Ask
Live P2P Radar Snapshot: 10/24/2026, 2:00:10 a.m.
USDT/VES reference Bs. 1019.21
Buy USDT Bs. 1019.21
Sell USDT Bs. 977.80
BCV Bs. 887.30
Premium vs. BCV 14.87%
P2P spread 4.23%
Offers observed 182
Verify current data on Radar P2P
October 24, 2026, 06:00 (snapshot time). The USDT/VES P2P market does not have a single price: it has an aggregated reference, a bid, an ask, and a different spread for each bank. This is the day's snapshot, with measurable figures and a caveat: comparing platforms and banks changes the number you see on screen.
4

·
--
If you trade on Binance, you’ll always see a table of moving red and green numbers next to the chart. This table isn’t complicated—it’s the key to your next move:
• Green section (buy orders): Shows the prices people are willing to buy at. If you see a very large number at a certain price, that price represents a strong “support wall” that can help protect the coin from easily falling below it.
• Red section (sell orders): Shows the prices people want to sell at. A large concentration of orders at a certain price means there’s a “resistance wall,” which may make it difficult for the coin to break through and rise above that price right away.
💡 In short: Before buying any coin in the spot market, take a quick look at this table. If you see a huge red wall close to the current price, wait a little and don’t rush to buy. The price may drop, so you can pick it up at a better price from the green section!
Do you watch these numbers before buying and selling, or do you buy right away? Share your thoughts in the comments 👇
Binance Academy #crypto Trading ##OrderBook #InvestSmartCrypto
{spot}(BTCUSDT)
{spot}(BNBUSDT)
{spot}(SOLUSDT)
If you trade on Binance, you’ll always see a table of moving red and green numbers next to the chart. This table isn’t complicated—it’s the key to your next move:
• Green section (buy orders): Shows the prices people are willing to buy at. If you see a very large number at a certain price, that price represents a strong “support wall” that can help protect the coin from easily falling below it.
• Red section (sell orders): Shows the prices people want to sell at. A large concentration of orders at a certain price means there’s a “resistance wall,” which may make it difficult for the coin to break through and rise above that price right away.
💡 In short: Before buying any coin in the spot market, take a quick look at this table. If you see a huge red wall close to the current price, wait a little and don’t rush to buy. The price may drop, so you can pick it up at a better price from the green section!
Do you watch these numbers before buying and selling, or do you buy right away? Share your thoughts in the comments 👇
Binance Academy #crypto Trading ##OrderBook #InvestSmartCrypto
2
126

Why do market participants frequently assume that headline 24-hour volume guarantees uniform execution costs across different digital assets?
Market microstructure reveals that high turnover does not automatically translate to equivalent order-book depth. For instance, Bitcoin currently changes hands at $81,942.44 with a 24-hour quote volume exceeding $1.16 billion, anchoring dense resting liquidity across multiple price tiers that dampens slippage for large blocks. In contrast, Solana trades at $104.15 with a 24-hour quote volume of $209 million, where thinner spacing between resting orders can induce sharper price displacement on equivalent order sizes.
Inspecting intermediate book depth alongside aggregate volume metrics offers a clearer view of potential execution friction.
#MarketLiquidity #OrderBook
32

·
--
Bullish
🧠 CRYTPO 101: Who is Buying the Dips and How Do Prices Actually Move? 📈📉
Ever looked at a massive green hourly candle and wondered: Who are these buyers, where do they come from, and what actually forces the price to snap back up? Understanding the human psychology and mechanics behind the chart is the ultimate key to trading like a professional.
👥 1. The Faces Behind the Order Book:
The market isn't just an automated computer script; it is driven by two distinct groups of real-world participants connected instantly via the exchange:
• Retail Traders: Everyday participants like us, managing positions across the globe, executing spot buys from their mobile apps.
• The Whales & Institutions: Large-scale funds and high-net-worth entities holding massive capital reserves. When a fundamentally strong asset hits a heavy discount zone, these whales step in with massive buy orders, creating institutional-grade support blocks.
🔄 2. The Law of Order Flows (Supply vs. Demand):
Every single price tick on your chart is a direct result of an auction tug-of-war.
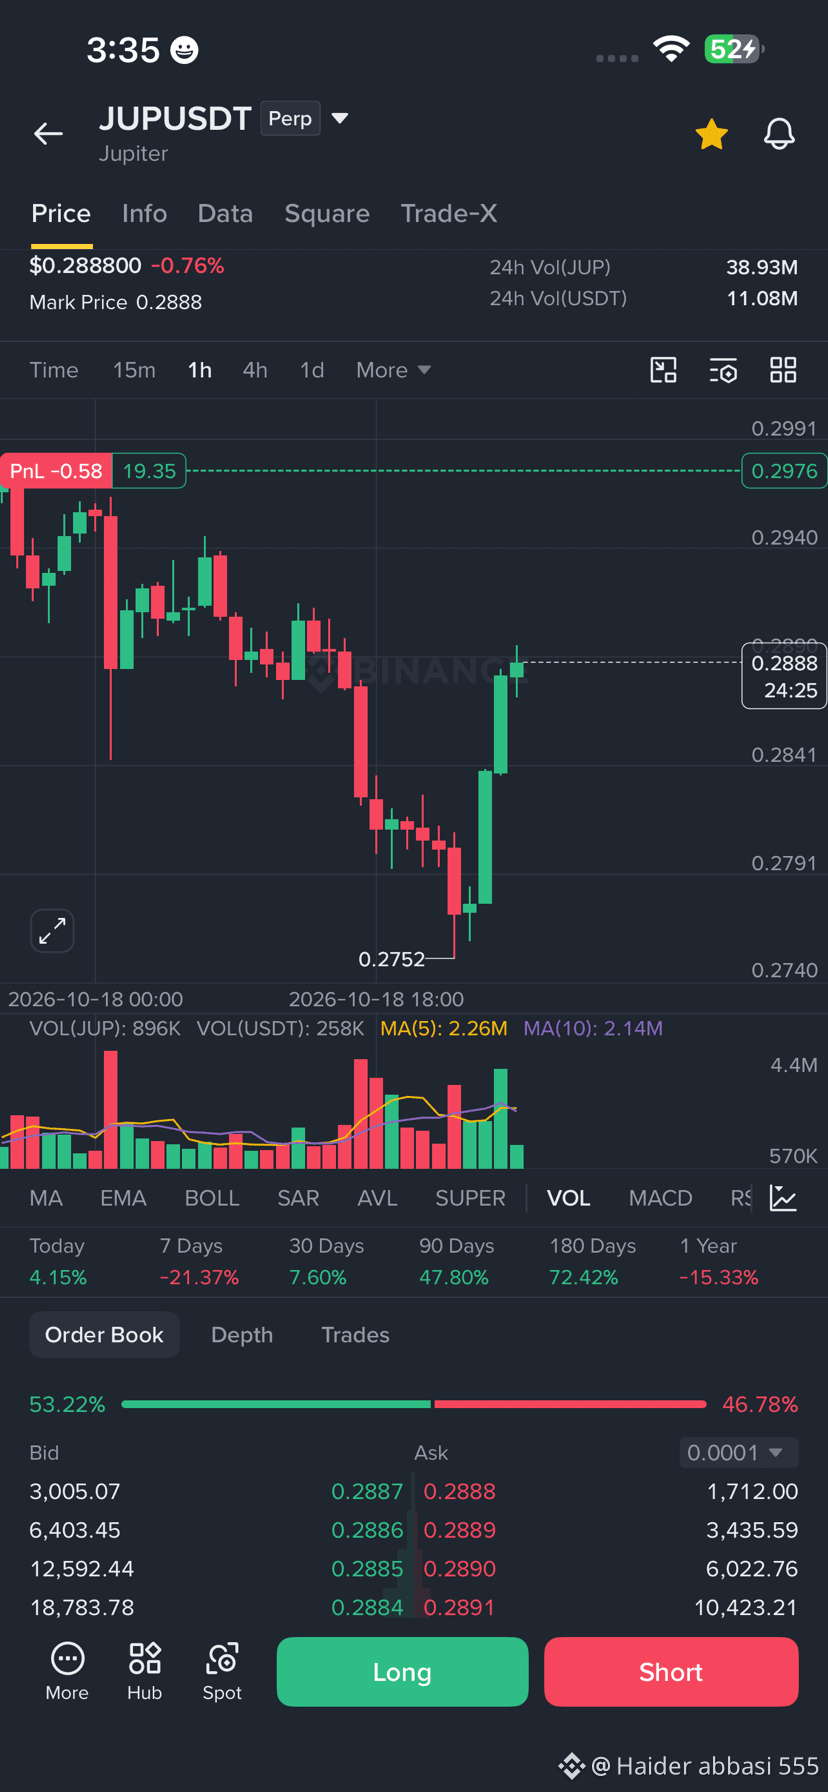
• How Prices Surge (Demand-Driven): When an asset hits a recognized macro bottom (like $JUP just did at $0.2752), selling momentum dries up. Suddenly, thousands of global buyers want the same limited tokens. To secure their entries, buyers willingly outbid each other, paying higher and higher prices. This aggressive buying pressure forces the price up, printing those beautiful, solid green candles.
• How Prices Drop (Supply-Driven): Conversely, when panic hits the retail sector, everyone rushes to exit at the same time. With a flood of sellers and a scarcity of active buyers, sellers are forced to lower their asking prices continuously just to get filled. This cascade is what causes sharp corrections.
🎯 The Bottom Line for Spot Holders:
The recent 1-Hour bullish reversal candle with high volume confirms that smart money looked at the discounted rates, stepped in aggressively, and absorbed the panic supply.
#cryptoeducation #MarketMechanics #orderbook #SupplyAndDemand $JUP
96

What I saw in the BTC/USDT order book just now was bizarre, lol. How can someone place a buy order paying $30 more than the token’s original price? Lol, either they want to take on more risk of loss or someone told them to, because it makes no sense to inflate the price like that and buy fewer units of the cryptocurrency in question. 🤣🤣
#Binance #Bitcoin #orderbook #trading #BinanceSquareTalks
#Binance #Bitcoin #orderbook #trading #BinanceSquareTalks
1
170

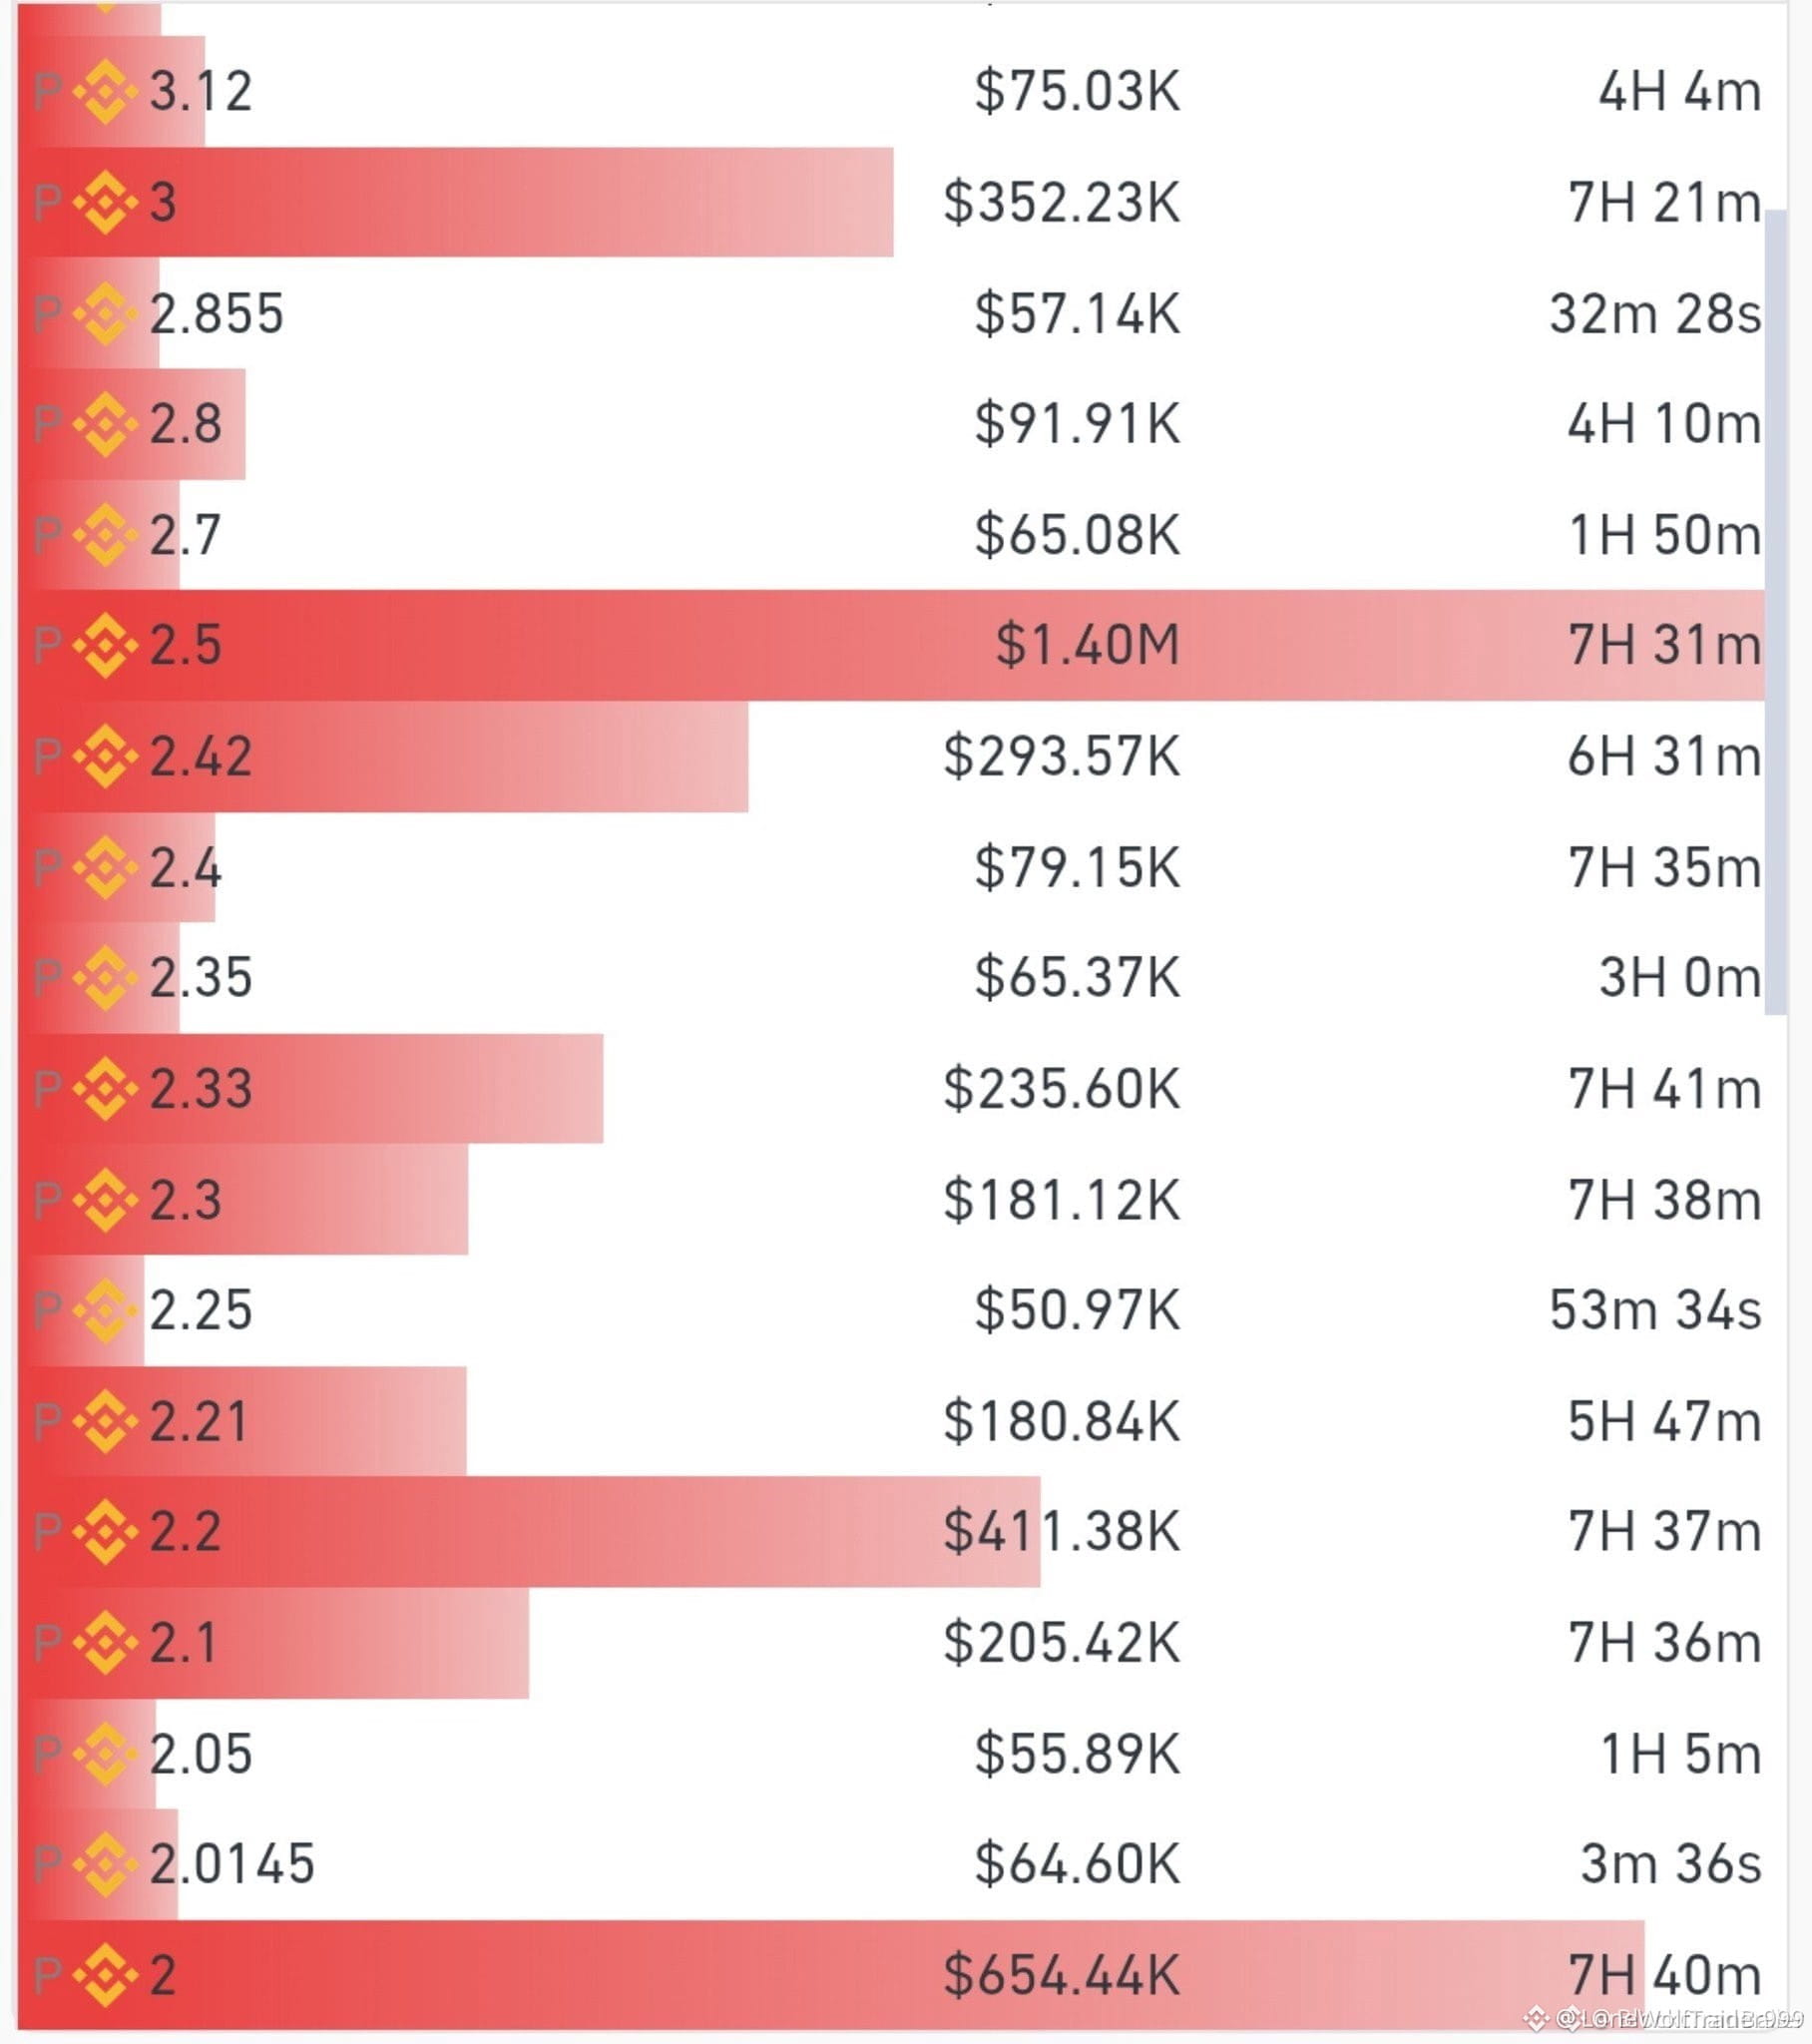
🚨 MASSIVE $BTW SELL WALL SPOTTED AS BEARS DIG IN THEIR HEELS! 💣
A formidable supply block just materialized on the order book for $BTW , drawing a battle line right in front of eager buyers. 🔍 Sellers are flashing heavy size to cap the upside, but high-density walls often serve as magnet liquidity before an aggressive absorption phase kicks off.
Watch the tape closely as spot volume presses directly into this resistance cluster. ⚡ If bidders aggressively chew through this stacked ask depth instead of retreating, the resulting squeeze could catch overconfident sellers completely off-guard. 🤔 Do you see this wall holding firm, or are buyers about to tear straight through it? 👇
⚠️ Not financial advice. Always manage your risk. 🛡️
🏷️ #BTW #OrderBook #CryptoTrading #Altcoins
🎯 🦈
12

·
--
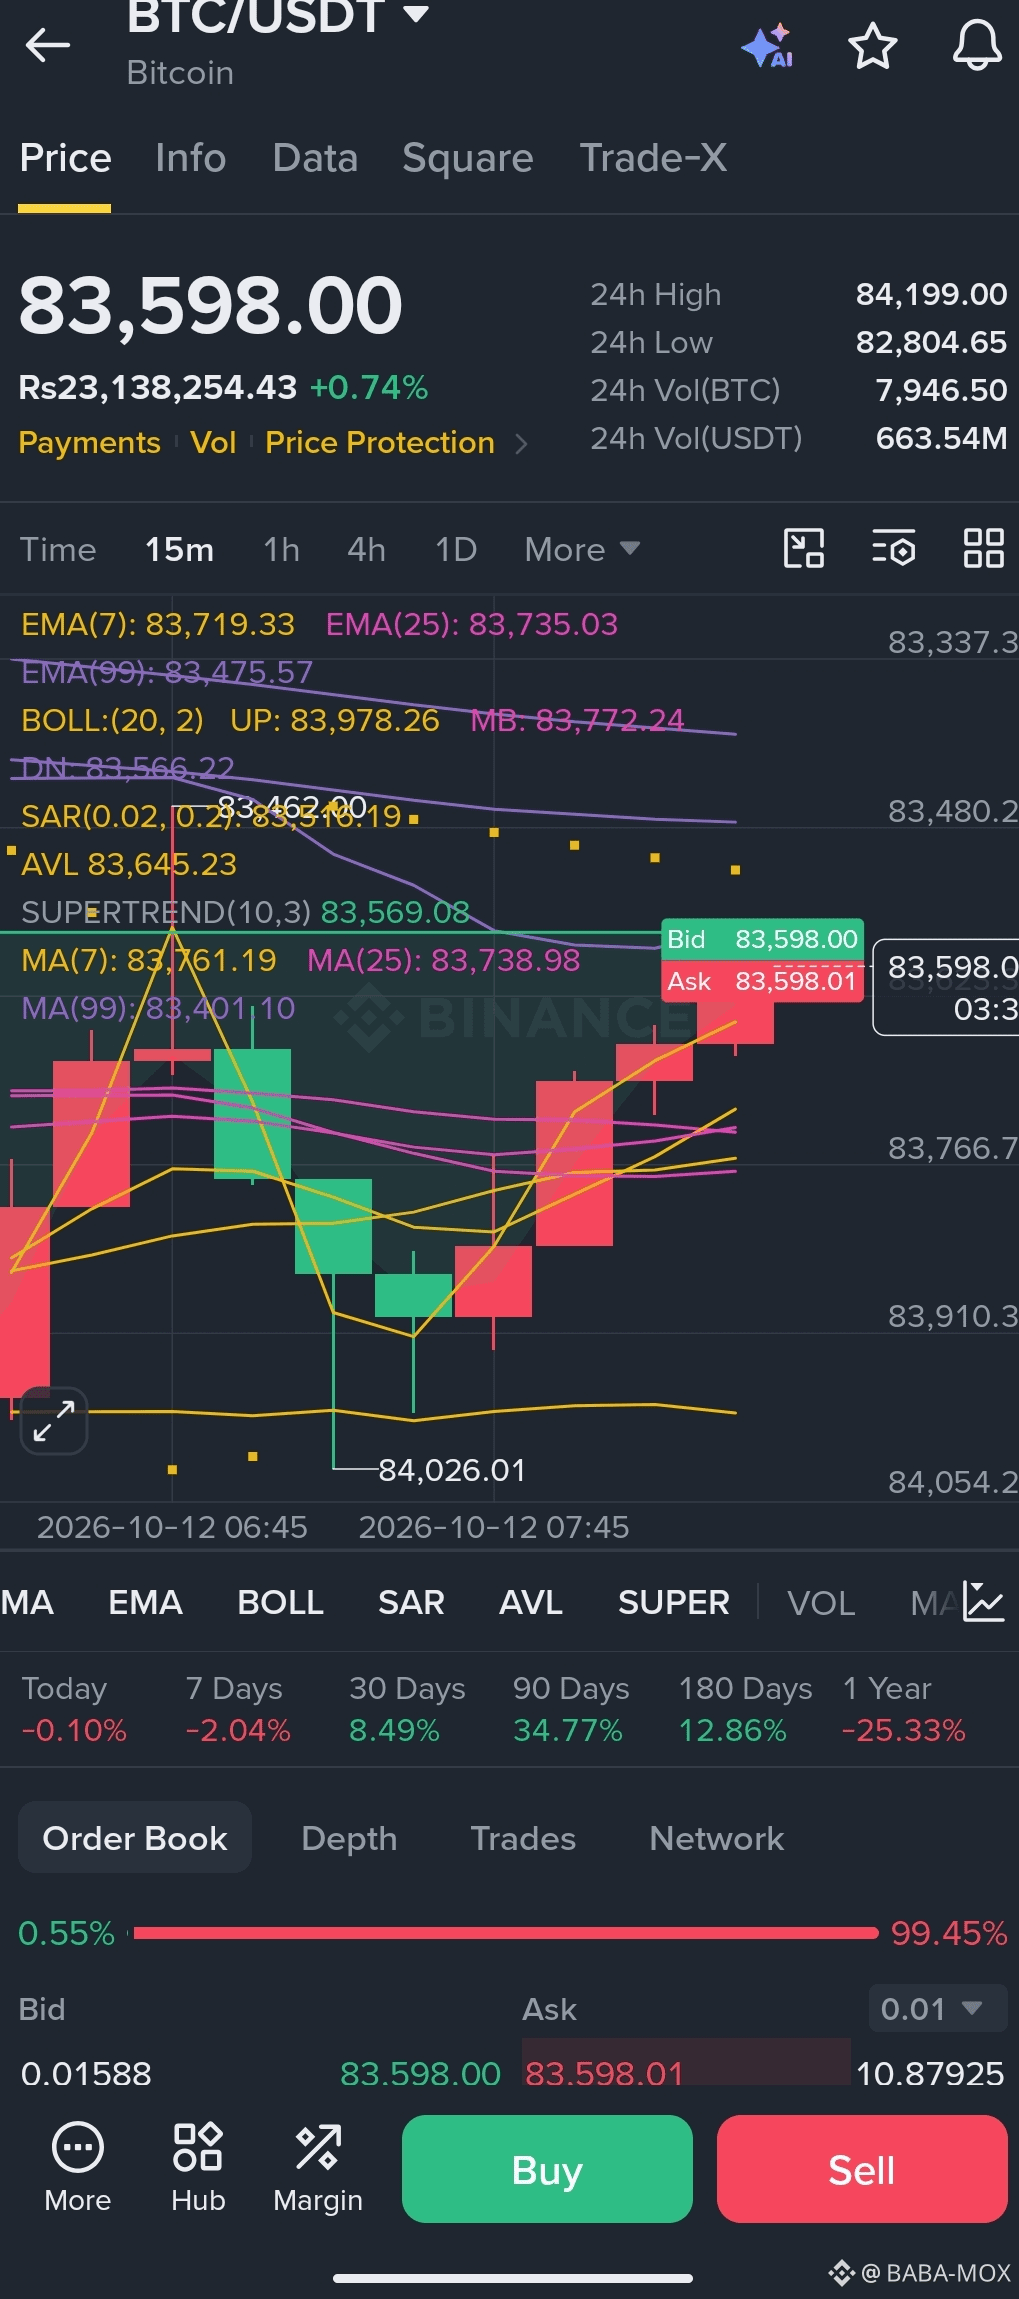
BTC $83,595 - 91% ASK = CAUTION ⚠️
Orderbook: 8.31% BID vs 91.69% ASK
Everyone selling at top
What I'm doing: WAITING
Not buying FOMO here
Real buy zone = when BID back to 30%+
#BTC #bitcoin #orderbook
BTC $83,595 - 91% ASK = CAUTION ⚠️
Orderbook: 8.31% BID vs 91.69% ASK
Everyone selling at top
What I'm doing: WAITING
Not buying FOMO here
Real buy zone = when BID back to 30%+
#BTC #bitcoin #orderbook
Orderbook: 8.31% BID vs 91.69% ASK
Everyone selling at top
What I'm doing: WAITING
Not buying FOMO here
Real buy zone = when BID back to 30%+
#BTC #bitcoin #orderbook
1
70
·
--
Article
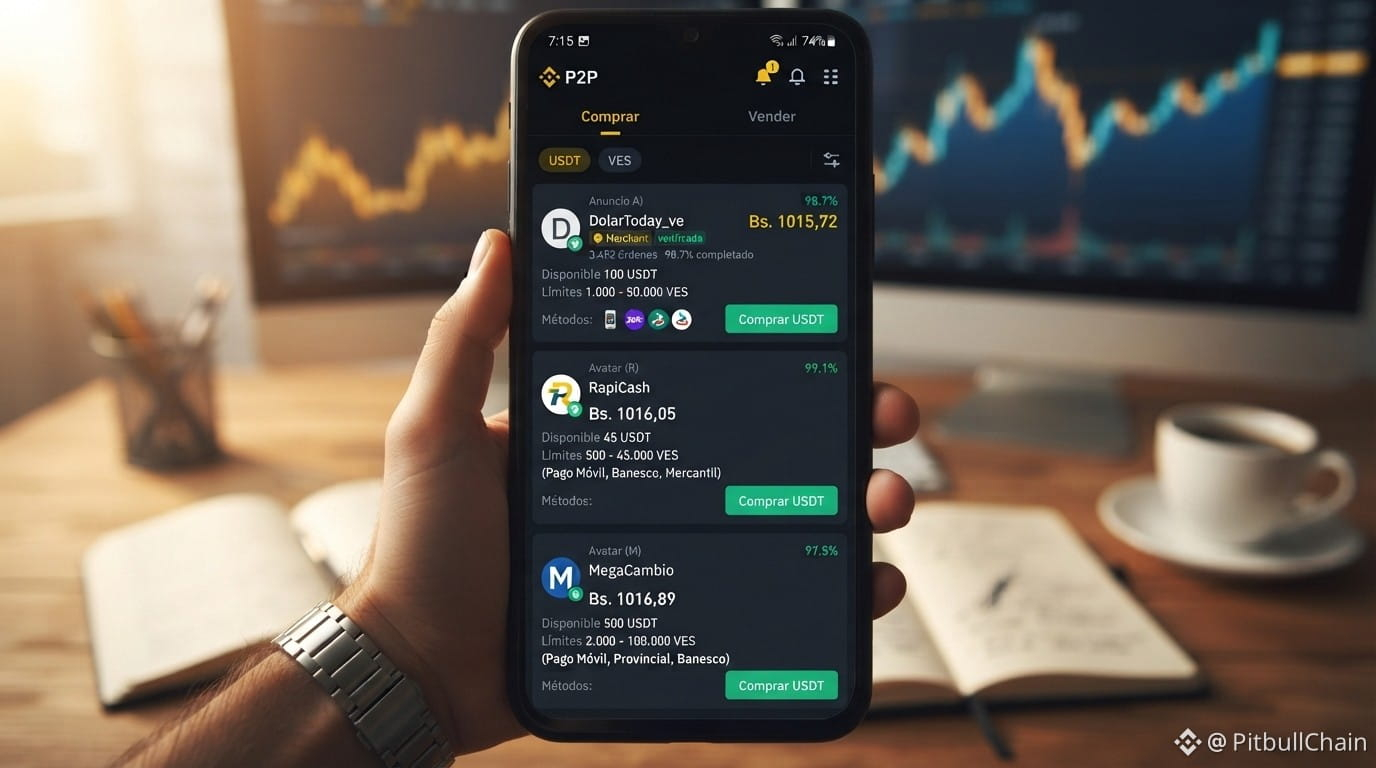
Binance and Other Platforms in P2P USDT/VES: Bank Depth and Actual SpreadLive Radar P2P Snapshot: 12/10/2026, 6:00:09 a.m.
USDT/VES reference rate Bs. 1032.24
Buy USDT Bs. 1032.24
USDT sell rate Bs. 962.28
BCV Bs. 876.80
Premium vs. BCV 17.73%
P2P spread 7.27%
Observed offers 192
Check current data on Radar P2P
The USDT/VES P2P market opened on October 12, 2026, with two different narratives about the same market. According to the Radar P2P snapshot at 10:00 UTC, the buy reference rate was 1,032.24 Bs and the sell reference rate was 962.28 Bs, with a spread of 69.96 Bs (7.27%) and a premium of 17.73% over the BCV rate of 876.7976 Bs. The market traffic light registered 71 points, a yellow status, and a moderate caution label.
Binance and Other Platforms in P2P USDT/VES: Bank Depth and Actual Spread
Live Radar P2P Snapshot: 12/10/2026, 6:00:09 a.m.
USDT/VES reference rate Bs. 1032.24
Buy USDT Bs. 1032.24
USDT sell rate Bs. 962.28
BCV Bs. 876.80
Premium vs. BCV 17.73%
P2P spread 7.27%
Observed offers 192
Check current data on Radar P2P
The USDT/VES P2P market opened on October 12, 2026, with two different narratives about the same market. According to the Radar P2P snapshot at 10:00 UTC, the buy reference rate was 1,032.24 Bs and the sell reference rate was 962.28 Bs, with a spread of 69.96 Bs (7.27%) and a premium of 17.73% over the BCV rate of 876.7976 Bs. The market traffic light registered 71 points, a yellow status, and a moderate caution label.
28

If you are still treating a calm order book as guaranteed liquidity, stop now.
Most traders realize this only after a market order slips straight through three price levels, turning a routine exit into an unexpected loss during sudden volatility.
On the surface, looking at order books on a quiet Tuesday feels reassuring. You see stacked bids, thick ask walls, and razor-thin spreads across pairs like $BTC and $ETH, which makes retail assume the market is deep enough to absorb size without moving. Some argue this resting liquidity is proof of healthy market making and stable pricing.
I disagree. The reality is that much of that resting depth is passive algorithmic spoofing designed to pull the millisecond real volume hits. When momentum shifts, those walls vanish instantly, leaving anyone trading large positions or altcoins like $SOL exposed to massive slippage.
Do you trust the order book depth during quiet hours, or do you wait for active volume before entering size?
#CryptoTrading #OrderBook #Liquidity
If you are still treating a calm order book as guaranteed liquidity, stop now.
Most traders realize this only after a market order slips straight through three price levels, turning a routine exit into an unexpected loss during sudden volatility.
On the surface, looking at order books on a quiet Tuesday feels reassuring. You see stacked bids, thick ask walls, and razor-thin spreads across pairs like $BTC and $ETH , which makes retail assume the market is deep enough to absorb size without moving. Some argue this resting liquidity is proof of healthy market making and stable pricing.
I disagree. The reality is that much of that resting depth is passive algorithmic spoofing designed to pull the millisecond real volume hits. When momentum shifts, those walls vanish instantly, leaving anyone trading large positions or altcoins like $SOL exposed to massive slippage.
Do you trust the order book depth during quiet hours, or do you wait for active volume before entering size?
#CryptoTrading #OrderBook #Liquidity

53

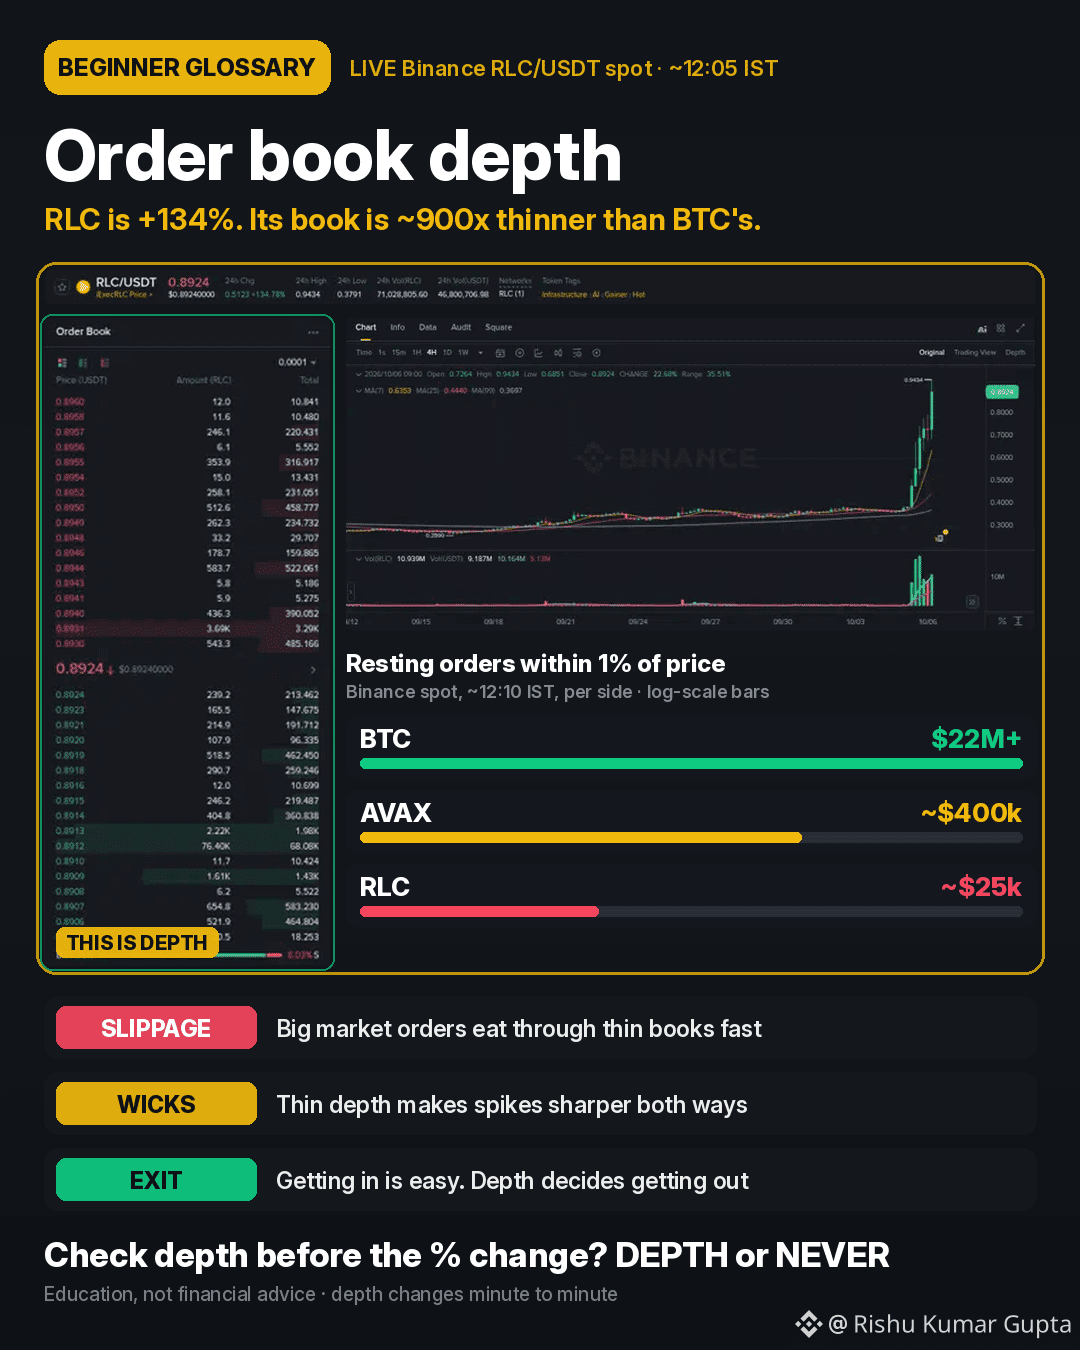
$RLC is up ~134% in 24h. Before the % change on any mover, I look at the order book.
Beginner glossary: ORDER BOOK DEPTH
Depth is how much money sits in resting buy and sell orders near the current price. It tells you how much size the market can absorb before price moves against you.
Binance spot books, ~12:10 IST, resting orders within 1% of price (per side):
• RLC/USDT ~$0.90: about $25k
• $AVAX ~$11.35: about $400k+
• $BTC ~$85.3k: over $22M
That's roughly 900x less depth on RLC than BTC.
Why it matters:
1. SLIPPAGE: a $30k market buy on RLC would clear more than 1% of the asks. On BTC it barely registers.
2. WICKS: thin books make spikes and dumps sharper in both directions. RLC's last 4H candle alone ran ~$0.69 to $0.94.
3. EXIT: getting in is easy. Depth decides how cleanly you get out.
Habit: order book and 24h volume first, % change last. Depth changes minute to minute, so check it live.
Education, not financial advice.
Do you check depth before trading a mover? Reply DEPTH or NEVER.
#OrderBook #CryptoBasics #BinanceSquare
428

·
--
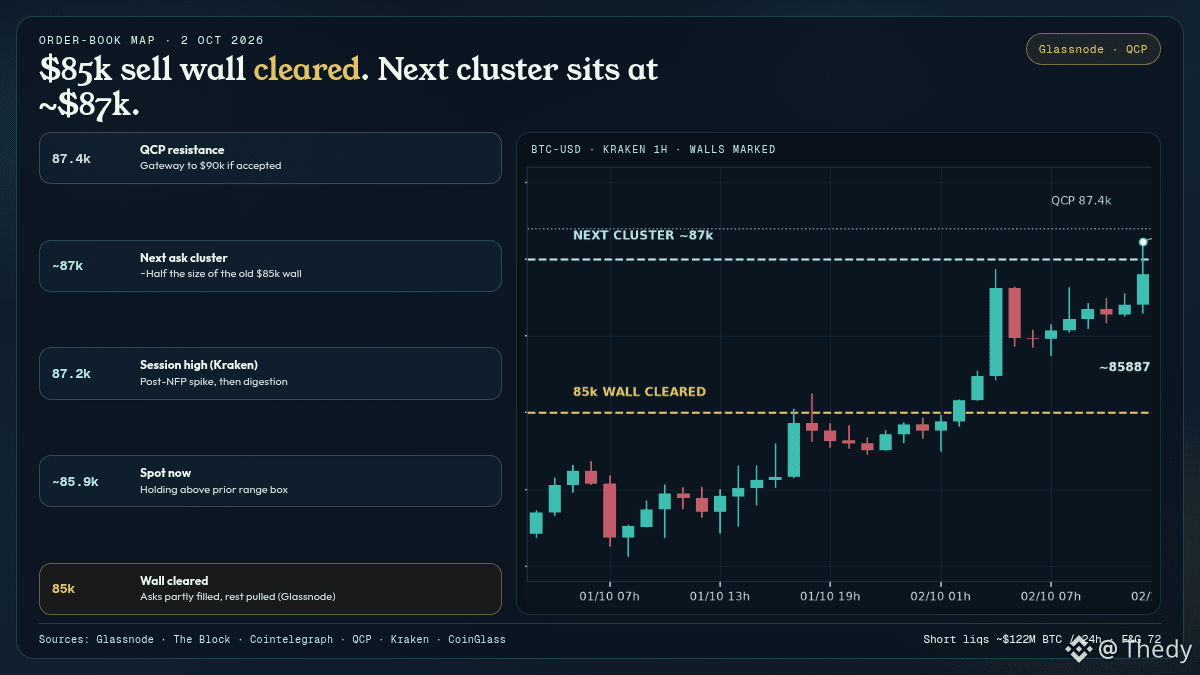
Bought $85k. Next cluster: $87k.
Glassnode (The Block / Cointelegraph): bids around $85k were partly executed, the rest pulled. Above, sell-side liquidity is easing. The next batch of orders sits around $87k, about half as dense as the previous wall.
Kraken Spot (~14:51 UTC): session high at 87,229$, then digestion towards ~85.9k. QCP places resistance at 87.4k (towards 90k) and support at 82.5k, held three times this week.
Meanwhile, short liquidations $BTC ~122 M$ over 24h (CoinGlass / Cointelegraph), total crypto ~210 M$. The squeeze helped the breakout; the question is whether price can hold above the prior box range of 82k–85k.
Scenarios:
• Hold >85k then retest 87k / 87.4k: the next wall becomes the real test
• Net loss of 85k: back into the weekly range
• Soft invalidation: flush below 84k with OI dropping
Will the next wall at $87k be a magnet, or a ceiling for $BTC ?
#Bitcoin #Crypto #OrderBook
118
Understanding Market Depth: How Order Books Shape Crypto Liquidity and Price ActionWhen transitioning from a beginner to an intermediate crypto trader, one of the most significant mindset shifts involves moving away from basic candlestick charts and looking directly at the engine driving market movements: the order book and its corresponding market depth.
While historical price charts tell you where an asset has been, market depth offers a real-time window into where supply and demand currently sit. Understanding how market depth works, how to read order books, and how market participants interact with liquidity is essential for reducing trading costs, managing risk, and avoiding common execution traps.
---
### What Is Market Depth?
At its core, market depth refers to the market’s ability to absorb relatively large market orders without causing significant price fluctuations. It represents the total volume of open buy and sell limit orders at various price levels surrounding the current spot price.
Market depth is visualized through two primary interface elements on centralized crypto exchanges:
1. **The Order Book:** A real-time, continuously updated list of pending buy orders (bids) and sell orders (asks).
2. **The Depth Chart:** A graphical representation of cumulative bids and asks stacked on either side of the current market price.
To understand market depth, one must first understand the fundamental divide in order execution: limit orders versus market orders. Limit orders provide liquidity to the market by sitting in the order book, waiting to be filled at a specific price or better. Market orders consume liquidity by executing instantly against the best available limit orders in the order book.
---
### Deconstructing the Order Book: Bids, Asks, and the Spread
An order book is split into two main sections:
* **Bids (Buy Side):** Located below the current market price, listed in descending order. The highest bid represents the highest price anyone is currently willing to pay for the asset.
* **Asks or Offers (Sell Side):** Located above the current market price, listed in ascending order. The lowest ask represents the cheapest price at which anyone is currently willing to sell the asset.
The gap between the highest bid and the lowest ask is known as the **bid-ask spread**.
In highly liquid markets—such as major trading pairs for Bitcoin or Ethereum on high-volume exchanges—the bid-ask spread is typically negligible, often a fraction of a cent or a single basis point. In contrast, illiquid markets or low-cap altcoin markets frequently feature wide bid-ask spreads. A wide spread means immediate entry and exit carry an implicit cost, as buying at the market price and instantly selling at the market price results in an immediate loss equal to the spread distance.
---
### Reading the Depth Chart
The depth chart visualizes the order book by plotting price along the horizontal axis (X-axis) and cumulative volume along the vertical axis (Y-axis).
* **The Buy Wall (Green Side):** Represents the cumulative sum of buy limit orders from the current price downward.
* **The Sell Wall (Red Side):** Represents the cumulative sum of sell limit orders from the current price upward.
When a visual "steep wall" appears on a depth chart, it indicates that a massive concentration of limit orders exists at a specific price point. For instance, if a large participant places a limit order to buy 1,000 units of an asset at $100, a steep green wall forms at $100.
To lower the market price below $100, market sellers must first sell enough volume to completely consume that 1,000-unit buy order. Consequently, significant buy walls often act as temporary psychological or structural support levels, while large sell walls act as resistance levels.
---
### Practical Example: Slippage and Order Sweeping
Understanding market depth is practical when executing trades above standard retail sizes. Suppose an trader wishes to buy $100,000 worth of a mid-cap digital asset using a market order.
Imagine the order book currently looks like this:
* **Best Ask:** $10.00 (Available Volume: $20,000)
* **Second Ask:** $10.10 (Available Volume: $30,000)
* **Third Ask:** $10.30 (Available Volume: $50,000)
If the trader submits a market buy order for $100,000, the exchange matching engine sweeps through the order book sequentially:
1. Fills $20,000 at $10.00
2. Fills $30,000 at $10.10
3. Fills $50,000 at $10.30
The trader’s expected purchase price was $10.00, but their **average execution price** ends up being approximately $10.18. The difference between the expected price and the actual execution price is known as **slippage**.
Slippage occurs precisely because the market depth at the top of the book was insufficient to fill the entire order at a single price point. Intermediate traders analyze market depth prior to execution to decide whether to split large orders into smaller tranches, use limit orders, or utilize automated algorithms like TWAP (Time-Weighted Average Price) to minimize market impact.
---
### Hidden Realities and Market Depth Manipulations
While market depth provides valuable insight, taking the order book at face value can be dangerous. Institutional participants, quantitative funds, and market makers use sophisticated strategies that alter how true liquidity is displayed.
#### 1. Phantom Liquidity and Spoofing
Not all visible orders are intended to be executed. "Spoofing" is a deceptive practice where a market actor places large limit orders (e.g., a massive buy wall) to create the false impression of strong support, enticing retail traders to buy. Once price approaches the fake wall, the actor cancels the order in milliseconds. Because limit orders can be canceled at any time prior to execution, displayed depth is never a guaranteed contract.
#### 2. Iceberg Orders
Large traders often wish to hide their true size to avoid moving the market against themselves. They utilize "iceberg orders," which divide a large order into small displayed segments. A trader might place an order to sell 50,000 units of BNB, but set the order book to display only 500 units at a time. As soon as one 500-unit tranche is filled, the next automatically appears. As a result, the visible order book may look thin, while hidden depth remains substantial.
#### 3. Off-Book Liquidity (OTC and Dark Pools)
A significant portion of global crypto volume takes place outside public order books through Over-the-Counter (OTC) desks or off-exchange liquidity venues. Highly capitalized entities routinely execute large block trades off-book precisely to avoid disrupting visible market depth on public exchanges.
---
### Incorporating Market Depth into Your Strategy
To effectively utilize market depth without falling victim to market noise:
* **Combine Depth with Volume Delta:** Do not rely on order book walls alone. Watch trade feeds (the time and sales tape) to verify whether orders at key depth levels are actually being executed or continuously canceled.
* **Assess Liquidity Across Venues:** Market depth varies significantly between exchanges. An asset may have deep liquidity on a tier-one venue while remaining extremely thin on smaller platforms.
* **Use Limit Orders for Position Entry:** To minimize execution drag from bid-ask spreads and slippage, default to patient limit orders when fast execution is not strictly required.
* **Practice Strict Risk Management:** Market conditions shift rapidly during periods of extreme volatility. During market-wide deleveraging events, liquidity providers often pull their limit orders entirely to mitigate their own risk, causing market depth to evaporate quickly and spreads to blow out wide.
---
### Conclusion
Market depth offers a dynamic view of supply and demand that raw price charts simply cannot capture. By learning to read order books, calculate potential slippage, and recognize the limitations of static order depth, intermediate traders gain a critical advantage in trade execution and risk assessment. However, because order books are volatile and subject to rapid cancellation, market depth analysis should always be integrated with disciplined position sizing, strict stop-loss rules, and a broader understanding of market context.
#CryptoTrading #MarketDepth #OrderBook
Understanding Market Depth: How Order Books Shape Crypto Liquidity and Price Action
When transitioning from a beginner to an intermediate crypto trader, one of the most significant mindset shifts involves moving away from basic candlestick charts and looking directly at the engine driving market movements: the order book and its corresponding market depth.
While historical price charts tell you where an asset has been, market depth offers a real-time window into where supply and demand currently sit. Understanding how market depth works, how to read order books, and how market participants interact with liquidity is essential for reducing trading costs, managing risk, and avoiding common execution traps.
---
### What Is Market Depth?
At its core, market depth refers to the market’s ability to absorb relatively large market orders without causing significant price fluctuations. It represents the total volume of open buy and sell limit orders at various price levels surrounding the current spot price.
Market depth is visualized through two primary interface elements on centralized crypto exchanges:
1. **The Order Book:** A real-time, continuously updated list of pending buy orders (bids) and sell orders (asks).
2. **The Depth Chart:** A graphical representation of cumulative bids and asks stacked on either side of the current market price.
To understand market depth, one must first understand the fundamental divide in order execution: limit orders versus market orders. Limit orders provide liquidity to the market by sitting in the order book, waiting to be filled at a specific price or better. Market orders consume liquidity by executing instantly against the best available limit orders in the order book.
---
### Deconstructing the Order Book: Bids, Asks, and the Spread
An order book is split into two main sections:
* **Bids (Buy Side):** Located below the current market price, listed in descending order. The highest bid represents the highest price anyone is currently willing to pay for the asset.
* **Asks or Offers (Sell Side):** Located above the current market price, listed in ascending order. The lowest ask represents the cheapest price at which anyone is currently willing to sell the asset.
The gap between the highest bid and the lowest ask is known as the **bid-ask spread**.
In highly liquid markets—such as major trading pairs for Bitcoin or Ethereum on high-volume exchanges—the bid-ask spread is typically negligible, often a fraction of a cent or a single basis point. In contrast, illiquid markets or low-cap altcoin markets frequently feature wide bid-ask spreads. A wide spread means immediate entry and exit carry an implicit cost, as buying at the market price and instantly selling at the market price results in an immediate loss equal to the spread distance.
---
### Reading the Depth Chart
The depth chart visualizes the order book by plotting price along the horizontal axis (X-axis) and cumulative volume along the vertical axis (Y-axis).
* **The Buy Wall (Green Side):** Represents the cumulative sum of buy limit orders from the current price downward.
* **The Sell Wall (Red Side):** Represents the cumulative sum of sell limit orders from the current price upward.
When a visual "steep wall" appears on a depth chart, it indicates that a massive concentration of limit orders exists at a specific price point. For instance, if a large participant places a limit order to buy 1,000 units of an asset at $100, a steep green wall forms at $100.
To lower the market price below $100, market sellers must first sell enough volume to completely consume that 1,000-unit buy order. Consequently, significant buy walls often act as temporary psychological or structural support levels, while large sell walls act as resistance levels.
---
### Practical Example: Slippage and Order Sweeping
Understanding market depth is practical when executing trades above standard retail sizes. Suppose an trader wishes to buy $100,000 worth of a mid-cap digital asset using a market order.
Imagine the order book currently looks like this:
* **Best Ask:** $10.00 (Available Volume: $20,000)
* **Second Ask:** $10.10 (Available Volume: $30,000)
* **Third Ask:** $10.30 (Available Volume: $50,000)
If the trader submits a market buy order for $100,000, the exchange matching engine sweeps through the order book sequentially:
1. Fills $20,000 at $10.00
2. Fills $30,000 at $10.10
3. Fills $50,000 at $10.30
The trader’s expected purchase price was $10.00, but their **average execution price** ends up being approximately $10.18. The difference between the expected price and the actual execution price is known as **slippage**.
Slippage occurs precisely because the market depth at the top of the book was insufficient to fill the entire order at a single price point. Intermediate traders analyze market depth prior to execution to decide whether to split large orders into smaller tranches, use limit orders, or utilize automated algorithms like TWAP (Time-Weighted Average Price) to minimize market impact.
---
### Hidden Realities and Market Depth Manipulations
While market depth provides valuable insight, taking the order book at face value can be dangerous. Institutional participants, quantitative funds, and market makers use sophisticated strategies that alter how true liquidity is displayed.
#### 1. Phantom Liquidity and Spoofing
Not all visible orders are intended to be executed. "Spoofing" is a deceptive practice where a market actor places large limit orders (e.g., a massive buy wall) to create the false impression of strong support, enticing retail traders to buy. Once price approaches the fake wall, the actor cancels the order in milliseconds. Because limit orders can be canceled at any time prior to execution, displayed depth is never a guaranteed contract.
#### 2. Iceberg Orders
Large traders often wish to hide their true size to avoid moving the market against themselves. They utilize "iceberg orders," which divide a large order into small displayed segments. A trader might place an order to sell 50,000 units of BNB, but set the order book to display only 500 units at a time. As soon as one 500-unit tranche is filled, the next automatically appears. As a result, the visible order book may look thin, while hidden depth remains substantial.
#### 3. Off-Book Liquidity (OTC and Dark Pools)
A significant portion of global crypto volume takes place outside public order books through Over-the-Counter (OTC) desks or off-exchange liquidity venues. Highly capitalized entities routinely execute large block trades off-book precisely to avoid disrupting visible market depth on public exchanges.
---
### Incorporating Market Depth into Your Strategy
To effectively utilize market depth without falling victim to market noise:
* **Combine Depth with Volume Delta:** Do not rely on order book walls alone. Watch trade feeds (the time and sales tape) to verify whether orders at key depth levels are actually being executed or continuously canceled.
* **Assess Liquidity Across Venues:** Market depth varies significantly between exchanges. An asset may have deep liquidity on a tier-one venue while remaining extremely thin on smaller platforms.
* **Use Limit Orders for Position Entry:** To minimize execution drag from bid-ask spreads and slippage, default to patient limit orders when fast execution is not strictly required.
* **Practice Strict Risk Management:** Market conditions shift rapidly during periods of extreme volatility. During market-wide deleveraging events, liquidity providers often pull their limit orders entirely to mitigate their own risk, causing market depth to evaporate quickly and spreads to blow out wide.
---
### Conclusion
Market depth offers a dynamic view of supply and demand that raw price charts simply cannot capture. By learning to read order books, calculate potential slippage, and recognize the limitations of static order depth, intermediate traders gain a critical advantage in trade execution and risk assessment. However, because order books are volatile and subject to rapid cancellation, market depth analysis should always be integrated with disciplined position sizing, strict stop-loss rules, and a broader understanding of market context.
#CryptoTrading #MarketDepth #OrderBook
1
114

·
--
THE REALITY BEHIND $SHIB AT $1 AND WHY GLITCHES ARE NOT REAL LIQUIDITY 🚨 📉
Phantom price spikes or interface display glitches do not represent actionable market liquidity. 📉 Institutional execution requires actual counterparty depth, and under $SHIB circulating supply metrics, a one-dollar valuation creates a structural market cap anomaly that no order book can absorb.
Realized fills only clear where bid-ask spreads find true equilibrium. 🔍 Smart money tracks order book depth and total market valuation rather than chasing localized feed anomalies. 💡
💬 How do you evaluate execution quality when sudden price anomalies appear on your chart? 👇
⚠️ Not financial advice. Always manage your risk. 🛡️
🏷️ #SHIB #Crypto #MarketStructure #OrderBook
🦈 🛡️

66

·
--
$BTC’s drop below the $84.2K–$85K liquidity cluster puts the order book in focus: after rejecting $87.3K and more than $3B in reported liquidations, the key question is whether bids absorb remaining forced supply or pull as price falls.
BTC is trading at $83,054, down 2.13% over 24 hours. Funding remains slightly positive at 0.0036%, while sentiment is still Greed at 74. That combination suggests positioning may not be fully reset, even after the wipeouts. Watch how price behaves on any retest of $84.2K–$85K: repeated offers and weak bid replenishment would favor continued drift lower; firm absorption and a reclaim could point to a leverage purge rather than a broader breakdown.
Key level: a sustained reclaim of $85K would weaken the immediate bearish read; failure to recover it keeps lower liquidity in play. Keep size conservative and define invalidation before entry; liquidation-driven moves can reverse quickly.
#Bitcoin #BTC #CryptoMarkets #OrderBook
$BTC ’s drop below the $84.2K–$85K liquidity cluster puts the order book in focus: after rejecting $87.3K and more than $3B in reported liquidations, the key question is whether bids absorb remaining forced supply or pull as price falls.
BTC is trading at $83,054, down 2.13% over 24 hours. Funding remains slightly positive at 0.0036%, while sentiment is still Greed at 74. That combination suggests positioning may not be fully reset, even after the wipeouts. Watch how price behaves on any retest of $84.2K–$85K: repeated offers and weak bid replenishment would favor continued drift lower; firm absorption and a reclaim could point to a leverage purge rather than a broader breakdown.
Key level: a sustained reclaim of $85K would weaken the immediate bearish read; failure to recover it keeps lower liquidity in play. Keep size conservative and define invalidation before entry; liquidation-driven moves can reverse quickly.
#Bitcoin #BTC #CryptoMarkets #OrderBook
74
·
--
After the $BTC $ETH $SOL 30 million-dollar forced liquidation, funding rates gave a more honest signal than the candlestick charts — BTC +0.0043%, ETH +0.0053% are still slightly positive, while SOL -0.0044% has turned negative. In the same washout, the divergence among the three curves itself is information.
From an order book perspective: a liquidation wave sweeps away both leveraged positions and resting orders. If funding then returns to zero or even negative, while open interest (OI) falls sharply, it means the market has gone through a true "weight loss" rather than simple panic. At that point, book depth is usually thinner, with fewer orders at the levels above and below, making price more sensitive to marginal orders — this is both an opportunity and a slippage trap. Conversely, if price rebounds but OI does not rise and funding remains flat, it suggests short covering rather than fresh long entries, so the sustainability is questionable.
The way to use this is contrarian: don’t chase the red and green bars, but check whether the funding + OI "reset" is complete. Current sentiment is 74 (Greed), but the funding backdrop has already neutralized, which is an observation window after leverage has been cleared out. $SOL is up +2.69% today, the only one of the three major assets showing strength while funding has turned negative. If OI falls in tandem, that would be healthy turnover; if OI rises while funding stays negative, it means shorts are adding exposure and caution is warranted.
Key technical levels: the $BTC 84,000 area is the dividing line between bulls and bears. If it breaks down and OI rises again, it indicates a new round of leveraged shorts entering the market, with a reference stop-loss below 83,000. $ETH 2,650 and $SOL 115 are structural support levels for their respective assets.
Risk management: use limit orders in a thin order book, control individual trade size, and treat invalidation levels as discipline rather than a bet. Do not blindly scale up positions just because funding turns negative. Crypto markets are highly volatile; the above is only a market observation, not investment advice. #BTC #FundingRate #OrderBook #LeverageReset
314


Heavy sell walls for $TLM at 0.60x. This tells me a push above the entry zone will face resistance. I plan my targets accordingly, ready to trim quickly.
🎯 $TLM QUANT SETUP 📊
💎 Entry Zone: 0.001361 - 0.001382
💎 🎯 Target 1: 0.001407
💎 🎯 Target 2: 0.001432
💎 🎯 Target 3: 0.001463
💎 🛑 Invalidation (SL): 0.001331
🔥 Deep Market Intel
💎 Order Book: Heavy Sell Walls (0.60x)
💎 1H Open Interest: Declining (-)
💎 Whales L/S: 54.0% Long
💎 Taker Flow: 0.67x 📊
#TLMScalp #OrderBook
1
352
Understanding the Order Book is paramount. $ETH and $VET both show "Heavy Buy Walls," which means significant demand is waiting at lower prices, acting as a cushion. This offers a higher probability of bounces from dips. In contrast, $U 's "Balanced DOM" requires a more nimble approach, as support might not be as concentrated.
#OrderBook #MarketDepth
#OrderBook #MarketDepth
300
Log in to explore more content
Join global crypto users on Binance Square
⚡️ Get latest and useful information about crypto.
💬 Trusted by the world’s largest crypto exchange.
👍 Discover real insights from verified creators.
Email / Phone number
Trending Topics
1
#CanMicrosoftDeliverOnAI
312,396 views
2,484 Discussing
2
#CanGoogleDefindItsCore
181,382 views
1,758 Discussing
3
#EarningsSeason
5.8M views
28,514 Discussing
4
#$10.9BBitcoinOptionsExpireFriday
100 views
10 Discussing
5
#ThailandSupremeCourtRulesBitcoinIsProperty
3 views
16 Discussing
6
#BitcoinSurpasses$81K
14,145 views
70 Discussing
7
#RobinhoodFalls8.4%AfterItsResults
8,643 views
185 Discussing
8
#KOSPISurges6.63%BackAbove6000
8,942 views
192 Discussing
9
#DatavaultAICantWithdrawBitcoinFromBiconomy
9,652 views
175 Discussing
10
#FOMCWatch
9.3M views
29,448 Discussing