
#marketmechanics
marketmechanics
8,736 views
98 Discussing
Hot
Latest

Understanding Crypto Liquidity: The Invisible Force Behind Market MovementsIn financial markets, volume often gets the primary spotlight. Traders analyze daily transaction volumes, social media momentum, and price charts to predict the next potential market movement. However, trading volume alone does not tell the full story of market stability, price stability, or trade execution quality. Behind every transaction lies a fundamental structural pillar that determines how smoothly assets move: market liquidity.
For intermediate crypto participants, moving beyond basic chart patterns requires a deep dive into liquidity mechanics. Liquidity dictates everything from execution slippage and transaction costs to systemic volatility and extreme market events. This guide explores the architecture of crypto liquidity, how it functions across centralized and decentralized trading venues, methods for measuring market depth, and essential risk management practices for navigating low-liquidity environments.
---
### What is Crypto Liquidity?
At its core, liquidity refers to the ease with which an asset can be converted into another asset or cash without causing a significant shift in its market price.
In a highly liquid market, there is an abundance of active buyers and sellers at any given moment. Because orders are plentiful on both sides of the market, large transactions can be absorbed efficiently with minimal impact on the prevailing price.
In contrast, an illiquid market lacks a dense cluster of active participants. When orders are sparse, even a moderate-sized trade can exhaust available buy or sell offers, forcing the price to jump or drop sharply to find the next available counterparty.
Liquidity is not static. It fluctuates based on market venue, time of day, macroeconomic conditions, and broader sentiment. While established digital assets like Bitcoin and Ethereum generally maintain deep liquidity across numerous global exchanges, smaller-cap altcoins often experience fragmented and shallow liquidity.
---
### The Two Architecture Models: Order Books vs. AMMs
To analyze liquidity accurately, one must understand how different trading venues match buyers and sellers. The crypto ecosystem primarily relies on two operational models:
#### 1. Centralized Exchange (CEX) Order Books
Centralized venues typically utilize a traditional central limit order book (CLOB). The order book aggregates all pending limit orders placed by market participants:
* **Bids:** Orders placed by buyers specifying the maximum price they are willing to pay.
* **Asks (Offers):** Orders placed by sellers specifying the minimum price they are willing to accept.
* **Bid-Ask Spread:** The numerical gap between the highest bid price and the lowest ask price.
In a liquid order book, the bid-ask spread is exceptionally tight. Institutional market makers continuously quote both bids and asks, providing balance and ensuring that retail and institutional traders can execute market orders close to the fair market value.
#### 2. Decentralized Exchange (DEX) Automated Market Makers (AMMs)
Decentralized protocols frequently replace traditional order books with Automated Market Makers (AMMs) powered by smart contracts. Rather than matching individual buyers with individual sellers, AMMs rely on **liquidity pools**—smart contracts containing pairs of tokens deposited by liquidity providers (LPs).
Prices in an AMM are determined mathematically through deterministic formulas, such as the constant product formula ($x \times y = k$). When a trader swaps tokens through a liquidity pool, they alter the balance of assets in that pool, which dynamically adjusts the asset price along a bonding curve. The larger the total value locked (TVL) in a liquidity pool relative to the trade size, the lower the resulting price displacement.
---
### Key Concepts: Slippage, Price Impact, and Market Depth
Evaluating liquidity requires familiarity with three critical market dynamics:
* **Market Depth:** Market depth measures the cumulative volume of buy and sell limit orders resting at various price levels above and below the current market price. A "deep" market has large volumes stacked near the mid-price, while a "shallow" market has thin order layers that offer little resistance to price movement.
* **Slippage:** Slippage is the difference between the expected price of a trade and the actual price at which it executes. Slippage commonly occurs during periods of fast-moving volatility or when executing orders that exceed the immediate volume available at the top of the order book.
* **Price Impact:** Price impact measures the percentage change in price caused directly by your own order execution. Large orders placed in shallow markets walk through multiple price levels in the order book, creating high price impact.
#### Practical Example of Order Depth
Consider a scenario where a trader attempts to sell 1,000 units of an asset currently quoted at $10.00:
* **Deep Market Scenario:** The order book contains buy limit orders for 500 units at $9.99, 500 units at $9.98, and 1,000 units at $9.97. The trade fills across the first two levels, resulting in an average execution price of $9.985 (a price impact of 0.15%).
* **Shallow Market Scenario:** The order book contains buy limit orders for only 100 units at $9.90, 200 units at $9.50, and 700 units at $8.50. The exact same 1,000-unit sell order consumes all three levels, pushing the final fill down to an average execution price of roughly $8.84 (a price impact of over 11%).
---
### How Intermediate Traders Can Evaluate Liquidity
Relying solely on reported 24-hour trading volume can be misleading, as volume numbers can be distorted by high-frequency wash trading or isolated volume spikes. To evaluate real liquidity, consider analyzing these metrics:
1. **2% Order Book Depth:** Check the total value of buy and sell orders within 2% of the current mid-price. This metric provides a clearer picture of how much capital is required to move the market price by 2%.
2. **Spread Percentage:** Calculate the spread as a percentage of the asset price (`(Ask - Bid) / Ask`). Tight spread percentages signal active market-making and lower immediate execution costs.
3. **Volume-to-TVL Ratio (for DEXs):** In decentralized finance, compare the daily trading volume of a pool to its total liquidity. Extremely high volume relative to low liquidity suggests that swaps will suffer higher price impact.
4. **Order Book Symmetry:** Examine whether liquidity is distributed evenly on both sides of the book. Asymmetrical order books (e.g., heavy ask depth but thin bid depth) signal potential directional vulnerability if market pressure shifts.
---
### Structural Risks and Limitations of Low Liquidity
Understanding liquidity is crucial for risk management because illiquidity amplifies structural trading hazards:
* **Liquidity Cascades:** In leveraged derivatives markets, liquidations occur automatically when collateral drops below margin requirements. If forced liquidation market orders hit a thin order book, they push prices further down, triggering subsequent liquidations. This cascading effect can cause sharp flash crashes.
* **The Illiquidity Exit Trap:** Bullish market conditions can make entering an illiquid asset simple because demand is high. However, when market sentiment turns bearish, bid depth can vanish almost overnight. Traders holding illiquid tokens may find it impossible to exit positions without taking catastrophic losses.
* **Phantom Liquidity:** Limit orders visible on an order book can be canceled instantly by automated algorithms. During moments of sudden market shock, algorithmic market makers often withdraw their bid and ask quotes simultaneously to protect their inventory. As a result, apparent depth can evaporate precisely when market participants need execution the most.
* **Impermanent Loss for Liquidity Providers:** Supplying assets to AMM pools involves unique mechanics. If the relative price of pooled assets diverges significantly from when they were deposited, liquidity providers may suffer impermanent loss compared to simply holding the raw assets in a private wallet.
---
### Practical Risk Mitigation Strategies
To reduce the impact of liquidity risks on your overall trading workflow, consider applying the following practices:
* **Default to Limit Orders:** Using limit orders allows you to define your precise execution price, protecting your trades from unexpected execution slippage during fast market moves.
* **Split Large Orders (TWAP):** Instead of placing a single market order, break larger trades into smaller fractions executed over time (Time-Weighted Average Price) to reduce market impact.
* **Check Depth Across Venues:** If trading substantial size, check liquidity depth across multiple trading venues to identify the venue with the deepest order book for that specific asset.
* **Exercise Caution During High-Impact Events:** Major macroeconomic reports, policy announcements, or protocol updates frequently cause market makers to temporarily widen spreads. Exercising patience during these windows can save significant transaction costs.
---
### Conclusion
Liquidity is the connective tissue of digital asset markets. It dictates trade execution quality, defines the boundaries of asset volatility, and plays a major role in systemic risk. By looking beyond simple price action and learning to read order book depth, spreads, and pool mechanics, intermediate market participants can navigate shifting market environments with greater precision and discipline.
#CryptoEducation #MarketMechanics #TradingStrategy
Understanding Crypto Liquidity: The Invisible Force Behind Market Movements
In financial markets, volume often gets the primary spotlight. Traders analyze daily transaction volumes, social media momentum, and price charts to predict the next potential market movement. However, trading volume alone does not tell the full story of market stability, price stability, or trade execution quality. Behind every transaction lies a fundamental structural pillar that determines how smoothly assets move: market liquidity.
For intermediate crypto participants, moving beyond basic chart patterns requires a deep dive into liquidity mechanics. Liquidity dictates everything from execution slippage and transaction costs to systemic volatility and extreme market events. This guide explores the architecture of crypto liquidity, how it functions across centralized and decentralized trading venues, methods for measuring market depth, and essential risk management practices for navigating low-liquidity environments.
---
### What is Crypto Liquidity?
At its core, liquidity refers to the ease with which an asset can be converted into another asset or cash without causing a significant shift in its market price.
In a highly liquid market, there is an abundance of active buyers and sellers at any given moment. Because orders are plentiful on both sides of the market, large transactions can be absorbed efficiently with minimal impact on the prevailing price.
In contrast, an illiquid market lacks a dense cluster of active participants. When orders are sparse, even a moderate-sized trade can exhaust available buy or sell offers, forcing the price to jump or drop sharply to find the next available counterparty.
Liquidity is not static. It fluctuates based on market venue, time of day, macroeconomic conditions, and broader sentiment. While established digital assets like Bitcoin and Ethereum generally maintain deep liquidity across numerous global exchanges, smaller-cap altcoins often experience fragmented and shallow liquidity.
---
### The Two Architecture Models: Order Books vs. AMMs
To analyze liquidity accurately, one must understand how different trading venues match buyers and sellers. The crypto ecosystem primarily relies on two operational models:
#### 1. Centralized Exchange (CEX) Order Books
Centralized venues typically utilize a traditional central limit order book (CLOB). The order book aggregates all pending limit orders placed by market participants:
* **Bids:** Orders placed by buyers specifying the maximum price they are willing to pay.
* **Asks (Offers):** Orders placed by sellers specifying the minimum price they are willing to accept.
* **Bid-Ask Spread:** The numerical gap between the highest bid price and the lowest ask price.
In a liquid order book, the bid-ask spread is exceptionally tight. Institutional market makers continuously quote both bids and asks, providing balance and ensuring that retail and institutional traders can execute market orders close to the fair market value.
#### 2. Decentralized Exchange (DEX) Automated Market Makers (AMMs)
Decentralized protocols frequently replace traditional order books with Automated Market Makers (AMMs) powered by smart contracts. Rather than matching individual buyers with individual sellers, AMMs rely on **liquidity pools**—smart contracts containing pairs of tokens deposited by liquidity providers (LPs).
Prices in an AMM are determined mathematically through deterministic formulas, such as the constant product formula ($x \times y = k$). When a trader swaps tokens through a liquidity pool, they alter the balance of assets in that pool, which dynamically adjusts the asset price along a bonding curve. The larger the total value locked (TVL) in a liquidity pool relative to the trade size, the lower the resulting price displacement.
---
### Key Concepts: Slippage, Price Impact, and Market Depth
Evaluating liquidity requires familiarity with three critical market dynamics:
* **Market Depth:** Market depth measures the cumulative volume of buy and sell limit orders resting at various price levels above and below the current market price. A "deep" market has large volumes stacked near the mid-price, while a "shallow" market has thin order layers that offer little resistance to price movement.
* **Slippage:** Slippage is the difference between the expected price of a trade and the actual price at which it executes. Slippage commonly occurs during periods of fast-moving volatility or when executing orders that exceed the immediate volume available at the top of the order book.
* **Price Impact:** Price impact measures the percentage change in price caused directly by your own order execution. Large orders placed in shallow markets walk through multiple price levels in the order book, creating high price impact.
#### Practical Example of Order Depth
Consider a scenario where a trader attempts to sell 1,000 units of an asset currently quoted at $10.00:
* **Deep Market Scenario:** The order book contains buy limit orders for 500 units at $9.99, 500 units at $9.98, and 1,000 units at $9.97. The trade fills across the first two levels, resulting in an average execution price of $9.985 (a price impact of 0.15%).
* **Shallow Market Scenario:** The order book contains buy limit orders for only 100 units at $9.90, 200 units at $9.50, and 700 units at $8.50. The exact same 1,000-unit sell order consumes all three levels, pushing the final fill down to an average execution price of roughly $8.84 (a price impact of over 11%).
---
### How Intermediate Traders Can Evaluate Liquidity
Relying solely on reported 24-hour trading volume can be misleading, as volume numbers can be distorted by high-frequency wash trading or isolated volume spikes. To evaluate real liquidity, consider analyzing these metrics:
1. **2% Order Book Depth:** Check the total value of buy and sell orders within 2% of the current mid-price. This metric provides a clearer picture of how much capital is required to move the market price by 2%.
2. **Spread Percentage:** Calculate the spread as a percentage of the asset price (`(Ask - Bid) / Ask`). Tight spread percentages signal active market-making and lower immediate execution costs.
3. **Volume-to-TVL Ratio (for DEXs):** In decentralized finance, compare the daily trading volume of a pool to its total liquidity. Extremely high volume relative to low liquidity suggests that swaps will suffer higher price impact.
4. **Order Book Symmetry:** Examine whether liquidity is distributed evenly on both sides of the book. Asymmetrical order books (e.g., heavy ask depth but thin bid depth) signal potential directional vulnerability if market pressure shifts.
---
### Structural Risks and Limitations of Low Liquidity
Understanding liquidity is crucial for risk management because illiquidity amplifies structural trading hazards:
* **Liquidity Cascades:** In leveraged derivatives markets, liquidations occur automatically when collateral drops below margin requirements. If forced liquidation market orders hit a thin order book, they push prices further down, triggering subsequent liquidations. This cascading effect can cause sharp flash crashes.
* **The Illiquidity Exit Trap:** Bullish market conditions can make entering an illiquid asset simple because demand is high. However, when market sentiment turns bearish, bid depth can vanish almost overnight. Traders holding illiquid tokens may find it impossible to exit positions without taking catastrophic losses.
* **Phantom Liquidity:** Limit orders visible on an order book can be canceled instantly by automated algorithms. During moments of sudden market shock, algorithmic market makers often withdraw their bid and ask quotes simultaneously to protect their inventory. As a result, apparent depth can evaporate precisely when market participants need execution the most.
* **Impermanent Loss for Liquidity Providers:** Supplying assets to AMM pools involves unique mechanics. If the relative price of pooled assets diverges significantly from when they were deposited, liquidity providers may suffer impermanent loss compared to simply holding the raw assets in a private wallet.
---
### Practical Risk Mitigation Strategies
To reduce the impact of liquidity risks on your overall trading workflow, consider applying the following practices:
* **Default to Limit Orders:** Using limit orders allows you to define your precise execution price, protecting your trades from unexpected execution slippage during fast market moves.
* **Split Large Orders (TWAP):** Instead of placing a single market order, break larger trades into smaller fractions executed over time (Time-Weighted Average Price) to reduce market impact.
* **Check Depth Across Venues:** If trading substantial size, check liquidity depth across multiple trading venues to identify the venue with the deepest order book for that specific asset.
* **Exercise Caution During High-Impact Events:** Major macroeconomic reports, policy announcements, or protocol updates frequently cause market makers to temporarily widen spreads. Exercising patience during these windows can save significant transaction costs.
---
### Conclusion
Liquidity is the connective tissue of digital asset markets. It dictates trade execution quality, defines the boundaries of asset volatility, and plays a major role in systemic risk. By looking beyond simple price action and learning to read order book depth, spreads, and pool mechanics, intermediate market participants can navigate shifting market environments with greater precision and discipline.
#CryptoEducation #MarketMechanics #TradingStrategy
For intermediate crypto participants, moving beyond basic chart patterns requires a deep dive into liquidity mechanics. Liquidity dictates everything from execution slippage and transaction costs to systemic volatility and extreme market events. This guide explores the architecture of crypto liquidity, how it functions across centralized and decentralized trading venues, methods for measuring market depth, and essential risk management practices for navigating low-liquidity environments.
---
### What is Crypto Liquidity?
At its core, liquidity refers to the ease with which an asset can be converted into another asset or cash without causing a significant shift in its market price.
In a highly liquid market, there is an abundance of active buyers and sellers at any given moment. Because orders are plentiful on both sides of the market, large transactions can be absorbed efficiently with minimal impact on the prevailing price.
In contrast, an illiquid market lacks a dense cluster of active participants. When orders are sparse, even a moderate-sized trade can exhaust available buy or sell offers, forcing the price to jump or drop sharply to find the next available counterparty.
Liquidity is not static. It fluctuates based on market venue, time of day, macroeconomic conditions, and broader sentiment. While established digital assets like Bitcoin and Ethereum generally maintain deep liquidity across numerous global exchanges, smaller-cap altcoins often experience fragmented and shallow liquidity.
---
### The Two Architecture Models: Order Books vs. AMMs
To analyze liquidity accurately, one must understand how different trading venues match buyers and sellers. The crypto ecosystem primarily relies on two operational models:
#### 1. Centralized Exchange (CEX) Order Books
Centralized venues typically utilize a traditional central limit order book (CLOB). The order book aggregates all pending limit orders placed by market participants:
* **Bids:** Orders placed by buyers specifying the maximum price they are willing to pay.
* **Asks (Offers):** Orders placed by sellers specifying the minimum price they are willing to accept.
* **Bid-Ask Spread:** The numerical gap between the highest bid price and the lowest ask price.
In a liquid order book, the bid-ask spread is exceptionally tight. Institutional market makers continuously quote both bids and asks, providing balance and ensuring that retail and institutional traders can execute market orders close to the fair market value.
#### 2. Decentralized Exchange (DEX) Automated Market Makers (AMMs)
Decentralized protocols frequently replace traditional order books with Automated Market Makers (AMMs) powered by smart contracts. Rather than matching individual buyers with individual sellers, AMMs rely on **liquidity pools**—smart contracts containing pairs of tokens deposited by liquidity providers (LPs).
Prices in an AMM are determined mathematically through deterministic formulas, such as the constant product formula ($x \times y = k$). When a trader swaps tokens through a liquidity pool, they alter the balance of assets in that pool, which dynamically adjusts the asset price along a bonding curve. The larger the total value locked (TVL) in a liquidity pool relative to the trade size, the lower the resulting price displacement.
---
### Key Concepts: Slippage, Price Impact, and Market Depth
Evaluating liquidity requires familiarity with three critical market dynamics:
* **Market Depth:** Market depth measures the cumulative volume of buy and sell limit orders resting at various price levels above and below the current market price. A "deep" market has large volumes stacked near the mid-price, while a "shallow" market has thin order layers that offer little resistance to price movement.
* **Slippage:** Slippage is the difference between the expected price of a trade and the actual price at which it executes. Slippage commonly occurs during periods of fast-moving volatility or when executing orders that exceed the immediate volume available at the top of the order book.
* **Price Impact:** Price impact measures the percentage change in price caused directly by your own order execution. Large orders placed in shallow markets walk through multiple price levels in the order book, creating high price impact.
#### Practical Example of Order Depth
Consider a scenario where a trader attempts to sell 1,000 units of an asset currently quoted at $10.00:
* **Deep Market Scenario:** The order book contains buy limit orders for 500 units at $9.99, 500 units at $9.98, and 1,000 units at $9.97. The trade fills across the first two levels, resulting in an average execution price of $9.985 (a price impact of 0.15%).
* **Shallow Market Scenario:** The order book contains buy limit orders for only 100 units at $9.90, 200 units at $9.50, and 700 units at $8.50. The exact same 1,000-unit sell order consumes all three levels, pushing the final fill down to an average execution price of roughly $8.84 (a price impact of over 11%).
---
### How Intermediate Traders Can Evaluate Liquidity
Relying solely on reported 24-hour trading volume can be misleading, as volume numbers can be distorted by high-frequency wash trading or isolated volume spikes. To evaluate real liquidity, consider analyzing these metrics:
1. **2% Order Book Depth:** Check the total value of buy and sell orders within 2% of the current mid-price. This metric provides a clearer picture of how much capital is required to move the market price by 2%.
2. **Spread Percentage:** Calculate the spread as a percentage of the asset price (`(Ask - Bid) / Ask`). Tight spread percentages signal active market-making and lower immediate execution costs.
3. **Volume-to-TVL Ratio (for DEXs):** In decentralized finance, compare the daily trading volume of a pool to its total liquidity. Extremely high volume relative to low liquidity suggests that swaps will suffer higher price impact.
4. **Order Book Symmetry:** Examine whether liquidity is distributed evenly on both sides of the book. Asymmetrical order books (e.g., heavy ask depth but thin bid depth) signal potential directional vulnerability if market pressure shifts.
---
### Structural Risks and Limitations of Low Liquidity
Understanding liquidity is crucial for risk management because illiquidity amplifies structural trading hazards:
* **Liquidity Cascades:** In leveraged derivatives markets, liquidations occur automatically when collateral drops below margin requirements. If forced liquidation market orders hit a thin order book, they push prices further down, triggering subsequent liquidations. This cascading effect can cause sharp flash crashes.
* **The Illiquidity Exit Trap:** Bullish market conditions can make entering an illiquid asset simple because demand is high. However, when market sentiment turns bearish, bid depth can vanish almost overnight. Traders holding illiquid tokens may find it impossible to exit positions without taking catastrophic losses.
* **Phantom Liquidity:** Limit orders visible on an order book can be canceled instantly by automated algorithms. During moments of sudden market shock, algorithmic market makers often withdraw their bid and ask quotes simultaneously to protect their inventory. As a result, apparent depth can evaporate precisely when market participants need execution the most.
* **Impermanent Loss for Liquidity Providers:** Supplying assets to AMM pools involves unique mechanics. If the relative price of pooled assets diverges significantly from when they were deposited, liquidity providers may suffer impermanent loss compared to simply holding the raw assets in a private wallet.
---
### Practical Risk Mitigation Strategies
To reduce the impact of liquidity risks on your overall trading workflow, consider applying the following practices:
* **Default to Limit Orders:** Using limit orders allows you to define your precise execution price, protecting your trades from unexpected execution slippage during fast market moves.
* **Split Large Orders (TWAP):** Instead of placing a single market order, break larger trades into smaller fractions executed over time (Time-Weighted Average Price) to reduce market impact.
* **Check Depth Across Venues:** If trading substantial size, check liquidity depth across multiple trading venues to identify the venue with the deepest order book for that specific asset.
* **Exercise Caution During High-Impact Events:** Major macroeconomic reports, policy announcements, or protocol updates frequently cause market makers to temporarily widen spreads. Exercising patience during these windows can save significant transaction costs.
---
### Conclusion
Liquidity is the connective tissue of digital asset markets. It dictates trade execution quality, defines the boundaries of asset volatility, and plays a major role in systemic risk. By looking beyond simple price action and learning to read order book depth, spreads, and pool mechanics, intermediate market participants can navigate shifting market environments with greater precision and discipline.
#CryptoEducation #MarketMechanics #TradingStrategy
57

·
--
Liquidity is just another word for exit. If you cannot sell your bag without crashing the chart, you do not have liquidity. You have a hostage situation. True liquidity means you can swap coins in and out with almost zero friction. The stays put while you move. Think of it like a grocery store. You want a specific brand of cereal. The shelf is full. You grab two boxes, pay, and leave. The tag did not change because of you. That is high liquidity. The market absorbed your buy order without blinking. Now imagine that store is a gas station at 3 AM during a storm. They have one bottle of water left. You want to buy it. The kid behind the counter upcharges you. The triples because supply is thin. In crypto, that thin supply is called slippage. Your order moves the market against you. A deep pool acts like a shock absorber. It takes the hit of large trades and keeps the stable for everyone else. Small trades vanish into the noise. Big trades ripple outward. The deeper the pool, the smaller the ripple. You do not just want to hold an asset. You want to know you can dump it if things go south. Without liquidity, you are locked in. You pay a premium just to leave the room. Market makers provide this depth. They stand ready to buy and sell at set levels. They smooth out the jagged edges of the chart. When their bids and asks show up thick, you have liquidity. When they vanish, you are on your own. Low liquidity environments punish patience. You wait for a that never appears. By the time it does, the exit door has locked. Check the depth before you jump in. If you are the only player at the table, you are not trading. You are gambling. Liquidity is the oxygen of the market. Without it, the chart suffocates. Keep it simple. If you cannot sell half your position without moving the candle, walk away. Liquidity #DeFiEducation #MarketMechanics
Liquidity is just another word for exit. If you cannot sell your bag without crashing the chart, you do not have liquidity. You have a hostage situation. True liquidity means you can swap coins in and out with almost zero friction. The stays put while you move. Think of it like a grocery store. You want a specific brand of cereal. The shelf is full. You grab two boxes, pay, and leave. The tag did not change because of you. That is high liquidity. The market absorbed your buy order without blinking. Now imagine that store is a gas station at 3 AM during a storm. They have one bottle of water left. You want to buy it. The kid behind the counter upcharges you. The triples because supply is thin. In crypto, that thin supply is called slippage. Your order moves the market against you. A deep pool acts like a shock absorber. It takes the hit of large trades and keeps the stable for everyone else. Small trades vanish into the noise. Big trades ripple outward. The deeper the pool, the smaller the ripple. You do not just want to hold an asset. You want to know you can dump it if things go south. Without liquidity, you are locked in. You pay a premium just to leave the room. Market makers provide this depth. They stand ready to buy and sell at set levels. They smooth out the jagged edges of the chart. When their bids and asks show up thick, you have liquidity. When they vanish, you are on your own. Low liquidity environments punish patience. You wait for a that never appears. By the time it does, the exit door has locked. Check the depth before you jump in. If you are the only player at the table, you are not trading. You are gambling. Liquidity is the oxygen of the market. Without it, the chart suffocates. Keep it simple. If you cannot sell half your position without moving the candle, walk away. Liquidity #DeFiEducation #MarketMechanics
12
·
--
Market manipulation is a concern in crypto trading. Wash trading is a tactic where a trader buys and sells $BTC at the same time to create fake activity. Spoofing involves placing fake orders to manipulate market sentiment. Front-running is when a trader uses inside information to trade before a large order is executed, affecting the market. For example, if a trader knows a large order for $ETH is coming, they may buy first to profit from the change. This can cause the market to be sitting at artificially inflated levels. Understanding these tactics is key to navigating the market. $BTC and $ETH traders should be aware of these risks. TradingTerms CryptoMarket Mechanics CryptoEducation tradingterms #cryptomarket #marketmechanics
Market manipulation is a concern in crypto trading. Wash trading is a tactic where a trader buys and sells $BTC at the same time to create fake activity. Spoofing involves placing fake orders to manipulate market sentiment. Front-running is when a trader uses inside information to trade before a large order is executed, affecting the market. For example, if a trader knows a large order for $ETH is coming, they may buy first to profit from the change. This can cause the market to be sitting at artificially inflated levels. Understanding these tactics is key to navigating the market. $BTC and $ETH traders should be aware of these risks. TradingTerms CryptoMarket Mechanics CryptoEducation tradingterms #cryptomarket #marketmechanics
33


Spend five minutes scrolling the feed today and it’s the exact same recycled noise: endless arguments over whether $BTC breaks $82k, or which narrative is about to pump next.
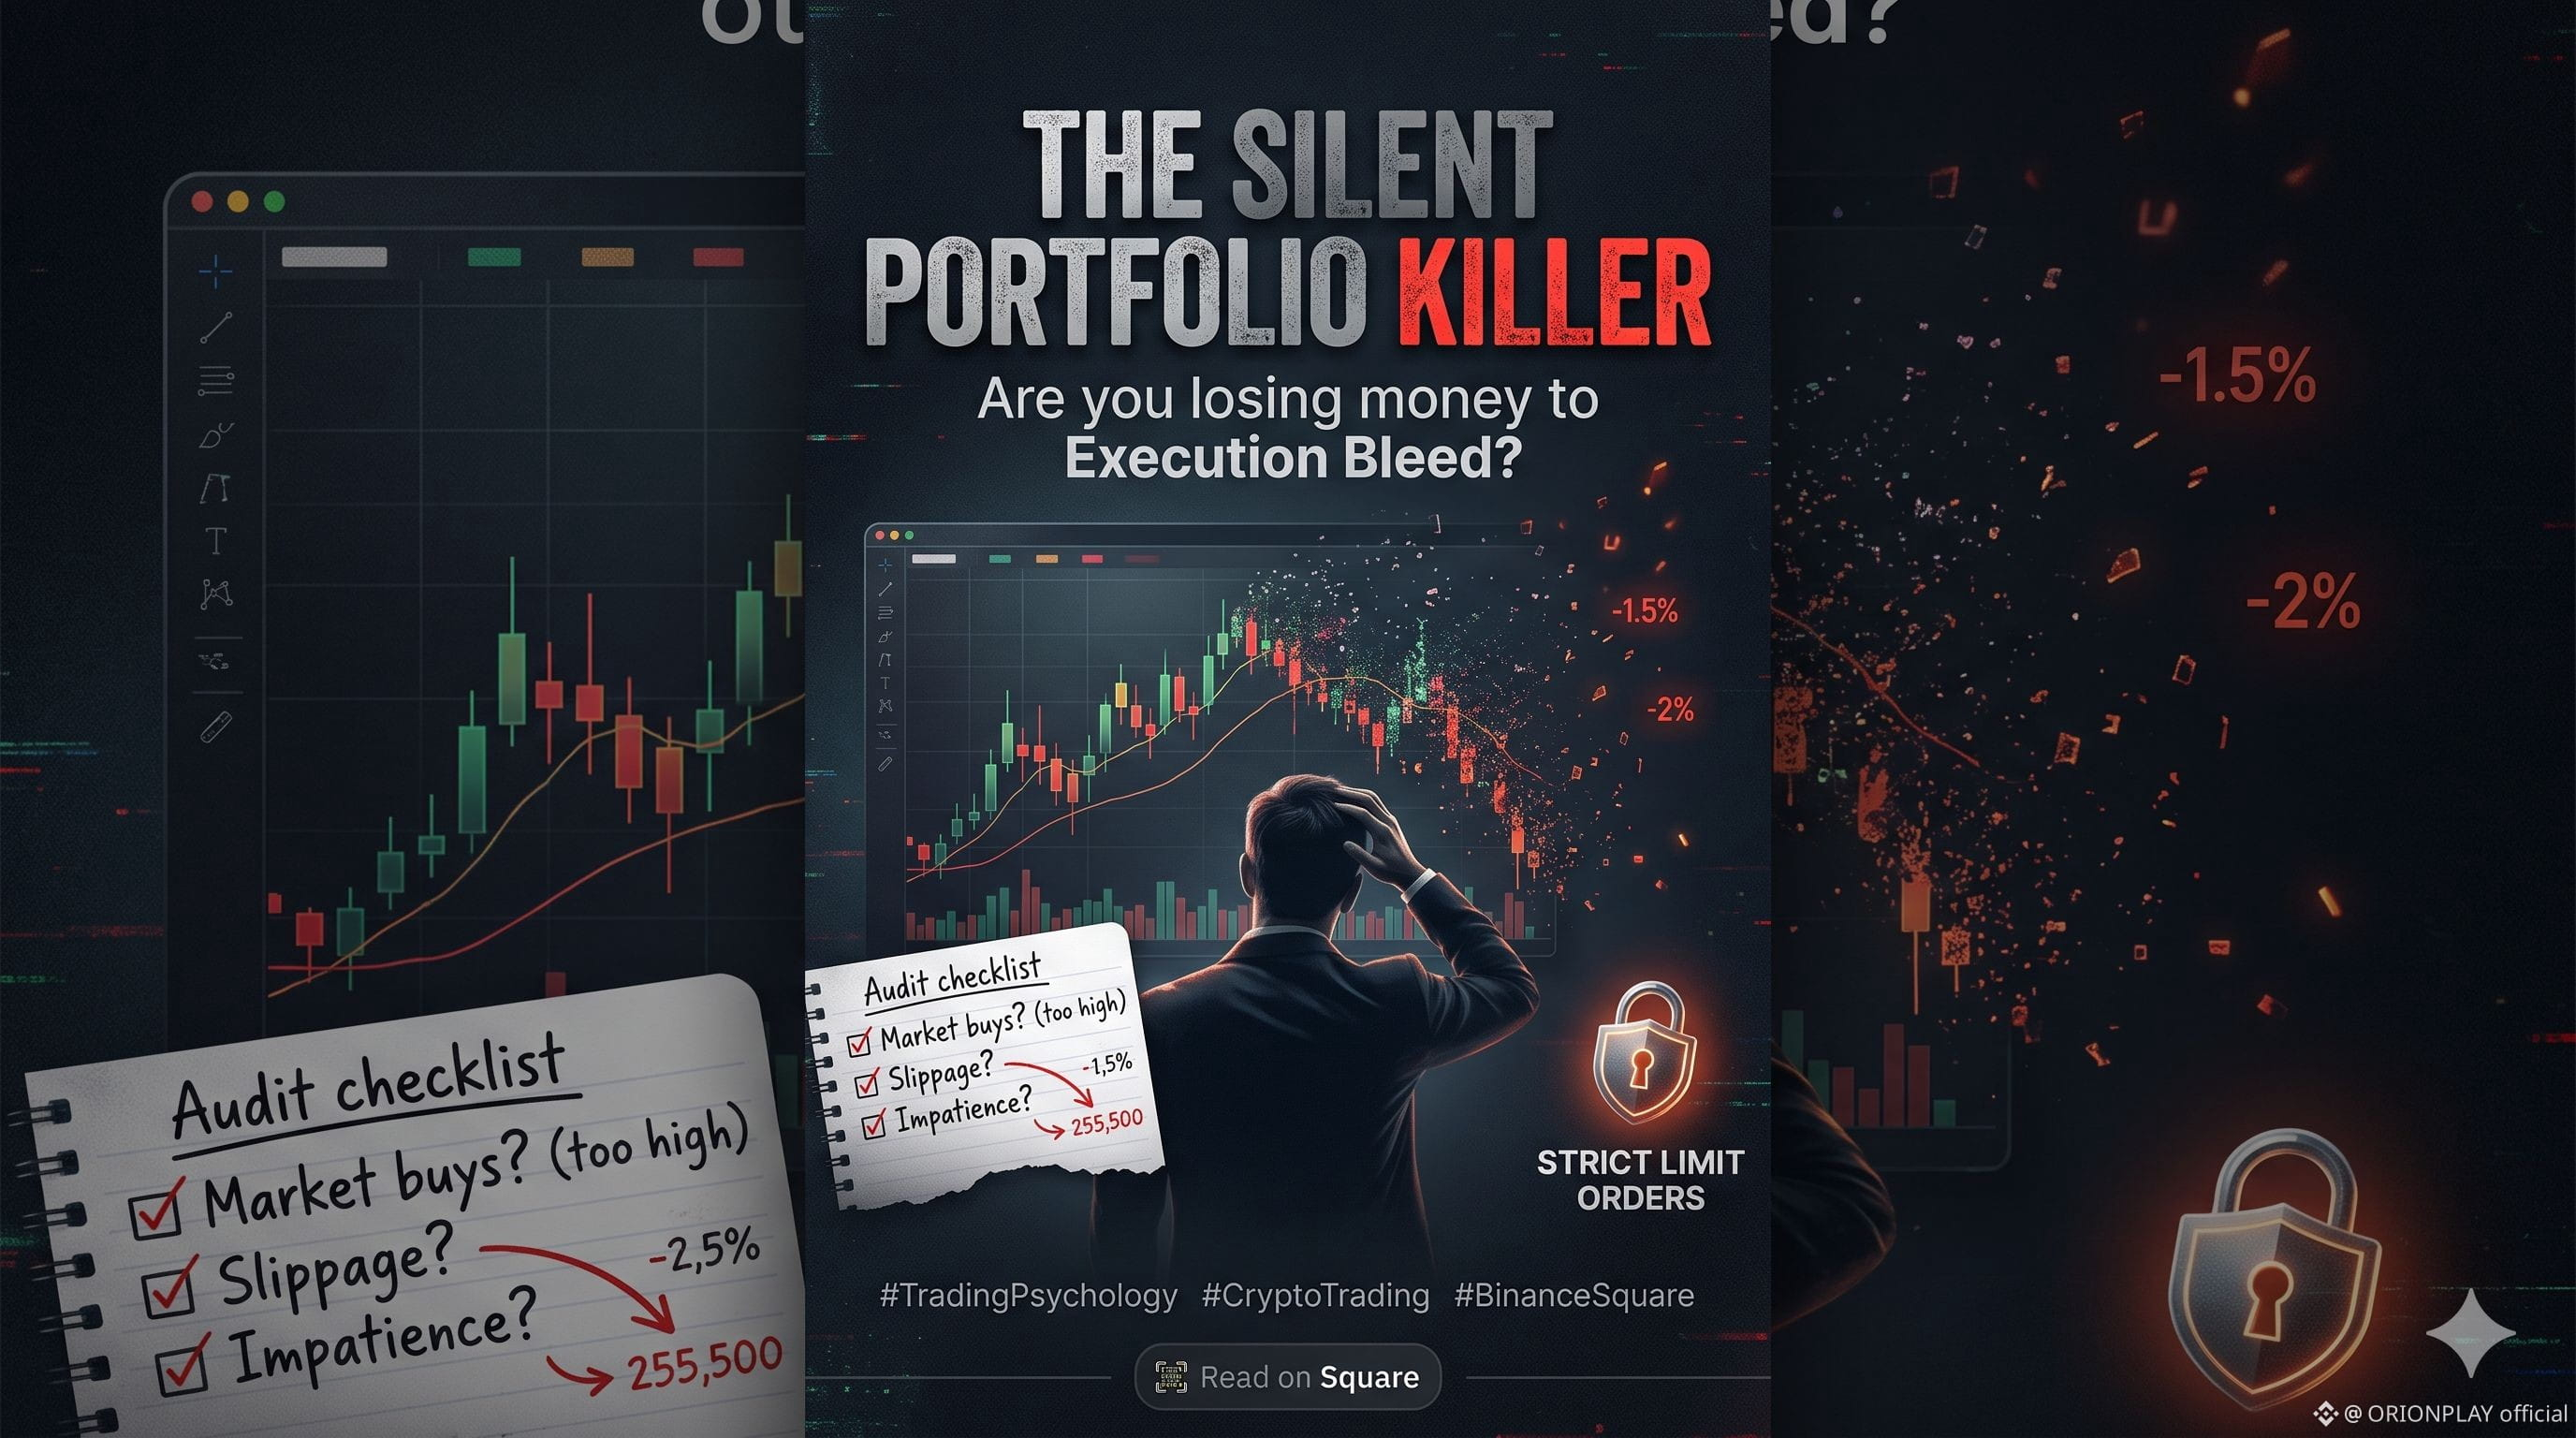
Almost nobody is talking about the quietest portfolio killer in sideways markets: execution bleed.
Over the past month, I went back and audited my own trading journal. My directional bias was actually decent, yet my net returns were noticeably lagging. The culprit wasn't bad chart analysis—it was impatience. Hitting "market buy" on mid-cap pairs during low-liquidity hours and over-rotating every time a 15-minute candle looked weak was quietly shaving 1.5% to 2% off my stack every single week.
When the broader market chops around waiting for macro clarity, your edge doesn't come from predicting the next breakout. It comes from basic mechanics. Using strict limit orders, checking order book depth before sizing in, and sitting on your hands when volume dries up will save you more money than any indicator ever will.
Stop trying to outsmart the chop. Audit your last ten trades and check how much you gave away purely to impatience and slippage. How are you managing your trade execution this week?
#TradingPsychology #CryptoTrading #MarketMechanics #BinanceSquare
Spend five minutes scrolling the feed today and it’s the exact same recycled noise: endless arguments over whether $BTC breaks $82k, or which narrative is about to pump next.
Almost nobody is talking about the quietest portfolio killer in sideways markets: execution bleed.
Over the past month, I went back and audited my own trading journal. My directional bias was actually decent, yet my net returns were noticeably lagging. The culprit wasn't bad chart analysis—it was impatience. Hitting "market buy" on mid-cap pairs during low-liquidity hours and over-rotating every time a 15-minute candle looked weak was quietly shaving 1.5% to 2% off my stack every single week.
When the broader market chops around waiting for macro clarity, your edge doesn't come from predicting the next breakout. It comes from basic mechanics. Using strict limit orders, checking order book depth before sizing in, and sitting on your hands when volume dries up will save you more money than any indicator ever will.
Stop trying to outsmart the chop. Audit your last ten trades and check how much you gave away purely to impatience and slippage. How are you managing your trade execution this week?
#TradingPsychology #CryptoTrading #MarketMechanics #BinanceSquare
Almost nobody is talking about the quietest portfolio killer in sideways markets: execution bleed.
Over the past month, I went back and audited my own trading journal. My directional bias was actually decent, yet my net returns were noticeably lagging. The culprit wasn't bad chart analysis—it was impatience. Hitting "market buy" on mid-cap pairs during low-liquidity hours and over-rotating every time a 15-minute candle looked weak was quietly shaving 1.5% to 2% off my stack every single week.
When the broader market chops around waiting for macro clarity, your edge doesn't come from predicting the next breakout. It comes from basic mechanics. Using strict limit orders, checking order book depth before sizing in, and sitting on your hands when volume dries up will save you more money than any indicator ever will.
Stop trying to outsmart the chop. Audit your last ten trades and check how much you gave away purely to impatience and slippage. How are you managing your trade execution this week?
#TradingPsychology #CryptoTrading #MarketMechanics #BinanceSquare
1
282

·
--
Bullish
🧠 CRYTPO 101: Who is Buying the Dips and How Do Prices Actually Move? 📈📉
Ever looked at a massive green hourly candle and wondered: Who are these buyers, where do they come from, and what actually forces the price to snap back up? Understanding the human psychology and mechanics behind the chart is the ultimate key to trading like a professional.
👥 1. The Faces Behind the Order Book:
The market isn't just an automated computer script; it is driven by two distinct groups of real-world participants connected instantly via the exchange:
• Retail Traders: Everyday participants like us, managing positions across the globe, executing spot buys from their mobile apps.
• The Whales & Institutions: Large-scale funds and high-net-worth entities holding massive capital reserves. When a fundamentally strong asset hits a heavy discount zone, these whales step in with massive buy orders, creating institutional-grade support blocks.
🔄 2. The Law of Order Flows (Supply vs. Demand):
Every single price tick on your chart is a direct result of an auction tug-of-war.
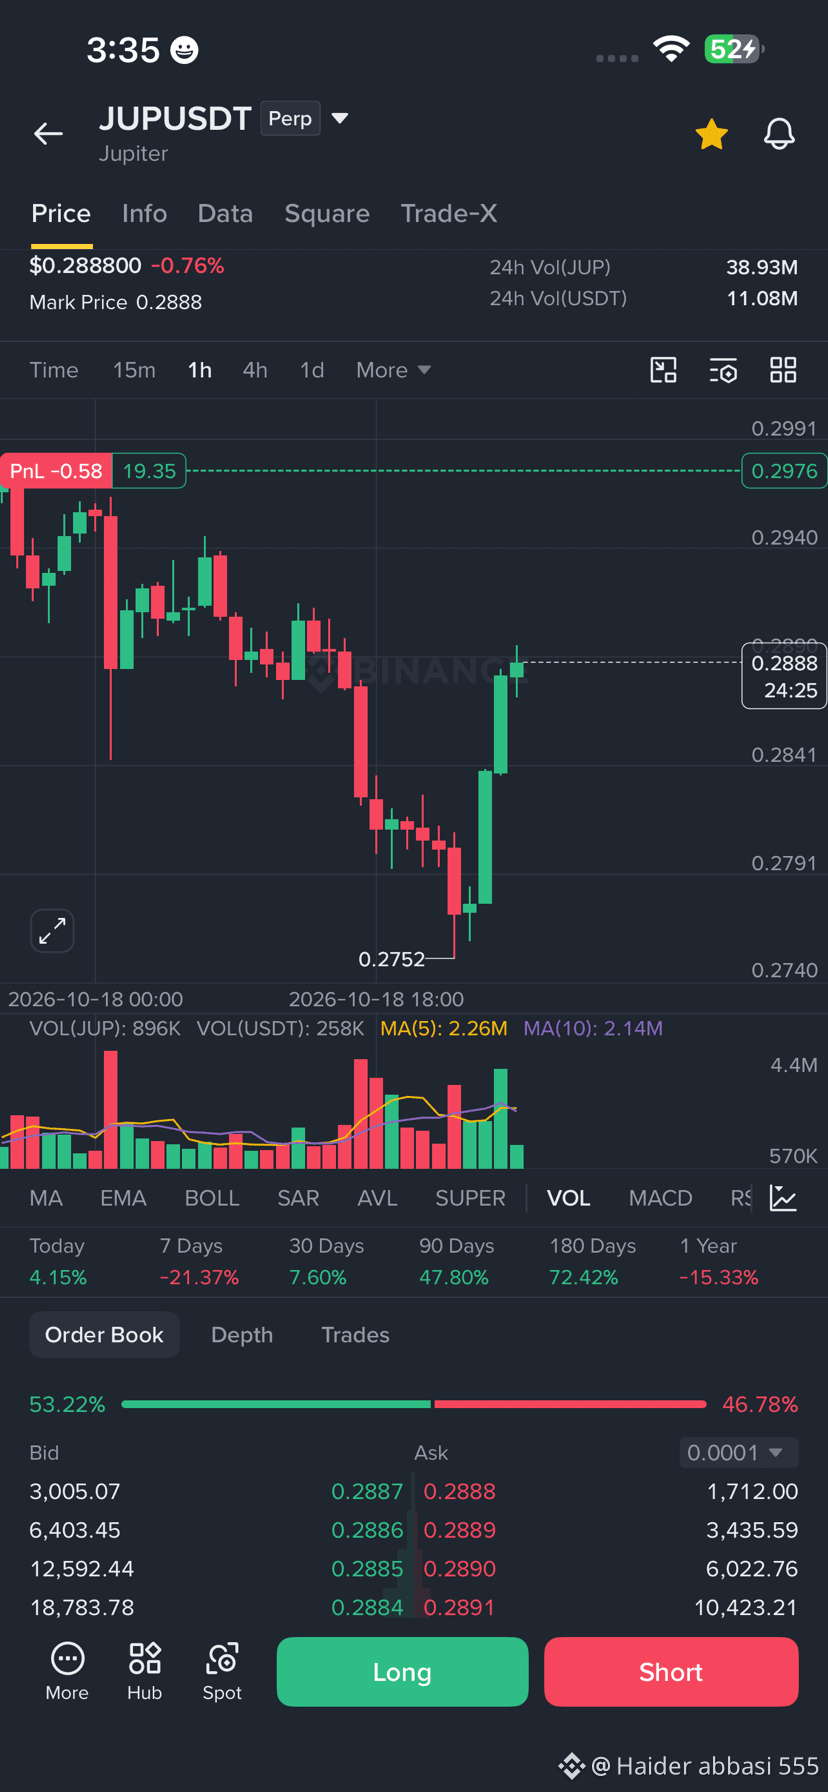
• How Prices Surge (Demand-Driven): When an asset hits a recognized macro bottom (like $JUP just did at $0.2752), selling momentum dries up. Suddenly, thousands of global buyers want the same limited tokens. To secure their entries, buyers willingly outbid each other, paying higher and higher prices. This aggressive buying pressure forces the price up, printing those beautiful, solid green candles.
• How Prices Drop (Supply-Driven): Conversely, when panic hits the retail sector, everyone rushes to exit at the same time. With a flood of sellers and a scarcity of active buyers, sellers are forced to lower their asking prices continuously just to get filled. This cascade is what causes sharp corrections.
🎯 The Bottom Line for Spot Holders:
The recent 1-Hour bullish reversal candle with high volume confirms that smart money looked at the discounted rates, stepped in aggressively, and absorbed the panic supply.
#cryptoeducation #MarketMechanics #orderbook #SupplyAndDemand $JUP
🧠 CRYTPO 101: Who is Buying the Dips and How Do Prices Actually Move? 📈📉
Ever looked at a massive green hourly candle and wondered: Who are these buyers, where do they come from, and what actually forces the price to snap back up? Understanding the human psychology and mechanics behind the chart is the ultimate key to trading like a professional.
👥 1. The Faces Behind the Order Book:
The market isn't just an automated computer script; it is driven by two distinct groups of real-world participants connected instantly via the exchange:
• Retail Traders: Everyday participants like us, managing positions across the globe, executing spot buys from their mobile apps.
• The Whales & Institutions: Large-scale funds and high-net-worth entities holding massive capital reserves. When a fundamentally strong asset hits a heavy discount zone, these whales step in with massive buy orders, creating institutional-grade support blocks.
🔄 2. The Law of Order Flows (Supply vs. Demand):
Every single price tick on your chart is a direct result of an auction tug-of-war.
• How Prices Surge (Demand-Driven): When an asset hits a recognized macro bottom (like $JUP just did at $0.2752), selling momentum dries up. Suddenly, thousands of global buyers want the same limited tokens. To secure their entries, buyers willingly outbid each other, paying higher and higher prices. This aggressive buying pressure forces the price up, printing those beautiful, solid green candles.
• How Prices Drop (Supply-Driven): Conversely, when panic hits the retail sector, everyone rushes to exit at the same time. With a flood of sellers and a scarcity of active buyers, sellers are forced to lower their asking prices continuously just to get filled. This cascade is what causes sharp corrections.
🎯 The Bottom Line for Spot Holders:
The recent 1-Hour bullish reversal candle with high volume confirms that smart money looked at the discounted rates, stepped in aggressively, and absorbed the panic supply.
#cryptoeducation #MarketMechanics #orderbook #SupplyAndDemand $JUP
Ever looked at a massive green hourly candle and wondered: Who are these buyers, where do they come from, and what actually forces the price to snap back up? Understanding the human psychology and mechanics behind the chart is the ultimate key to trading like a professional.
👥 1. The Faces Behind the Order Book:
The market isn't just an automated computer script; it is driven by two distinct groups of real-world participants connected instantly via the exchange:
• Retail Traders: Everyday participants like us, managing positions across the globe, executing spot buys from their mobile apps.
• The Whales & Institutions: Large-scale funds and high-net-worth entities holding massive capital reserves. When a fundamentally strong asset hits a heavy discount zone, these whales step in with massive buy orders, creating institutional-grade support blocks.
🔄 2. The Law of Order Flows (Supply vs. Demand):
Every single price tick on your chart is a direct result of an auction tug-of-war.
• How Prices Surge (Demand-Driven): When an asset hits a recognized macro bottom (like $JUP just did at $0.2752), selling momentum dries up. Suddenly, thousands of global buyers want the same limited tokens. To secure their entries, buyers willingly outbid each other, paying higher and higher prices. This aggressive buying pressure forces the price up, printing those beautiful, solid green candles.
• How Prices Drop (Supply-Driven): Conversely, when panic hits the retail sector, everyone rushes to exit at the same time. With a flood of sellers and a scarcity of active buyers, sellers are forced to lower their asking prices continuously just to get filled. This cascade is what causes sharp corrections.
🎯 The Bottom Line for Spot Holders:
The recent 1-Hour bullish reversal candle with high volume confirms that smart money looked at the discounted rates, stepped in aggressively, and absorbed the panic supply.
#cryptoeducation #MarketMechanics #orderbook #SupplyAndDemand $JUP
102

·
--
Understanding market mechanics helps detach emotion. The heavy sell walls on $TAO mean I'm acutely aware of potential resistance. This intel informs my strategy, just as general market structure guides my view on $ETH or $ANIME.
🔥 Deep Market Intel
💎 Order Book: Balanced DOM (0.98x)
💎 1H Open Interest: Accumulating (+)
💎 Whales L/S: 60.6% Long
💎 Taker Flow: 1.89x
💎
🎯 TAO MOMENTUM PLAY ⚡
💎 Entry Zone: 227.338 - 230.800
💎 🎯 Target 1: 233.725
💎 🎯 Target 2: 236.650
💎 🎯 Target 3: 240.160
💎 🛑 Invalidation (SL): 223.828
🔥 Deep Market Intel
💎 Order Book: Heavy Sell Walls (0.53x)
💎 1H Open Interest: Declining (-)
💎 Whales L/S: 64.4% Long
💎 Taker Flow: 0.91x 📊
#MarketMechanics #EmotionalDetachment
Understanding market mechanics helps detach emotion. The heavy sell walls on $TAO mean I'm acutely aware of potential resistance. This intel informs my strategy, just as general market structure guides my view on $ETH or $ANIME .
🔥 Deep Market Intel
💎 Order Book: Balanced DOM (0.98x)
💎 1H Open Interest: Accumulating (+)
💎 Whales L/S: 60.6% Long
💎 Taker Flow: 1.89x
💎
🎯 TAO MOMENTUM PLAY ⚡
💎 Entry Zone: 227.338 - 230.800
💎 🎯 Target 1: 233.725
💎 🎯 Target 2: 236.650
💎 🎯 Target 3: 240.160
💎 🛑 Invalidation (SL): 223.828
🔥 Deep Market Intel
💎 Order Book: Heavy Sell Walls (0.53x)
💎 1H Open Interest: Declining (-)
💎 Whales L/S: 64.4% Long
💎 Taker Flow: 0.91x 📊
#MarketMechanics #EmotionalDetachment
🔥 Deep Market Intel
💎 Order Book: Balanced DOM (0.98x)
💎 1H Open Interest: Accumulating (+)
💎 Whales L/S: 60.6% Long
💎 Taker Flow: 1.89x
💎
🎯 TAO MOMENTUM PLAY ⚡
💎 Entry Zone: 227.338 - 230.800
💎 🎯 Target 1: 233.725
💎 🎯 Target 2: 236.650
💎 🎯 Target 3: 240.160
💎 🛑 Invalidation (SL): 223.828
🔥 Deep Market Intel
💎 Order Book: Heavy Sell Walls (0.53x)
💎 1H Open Interest: Declining (-)
💎 Whales L/S: 64.4% Long
💎 Taker Flow: 0.91x 📊
#MarketMechanics #EmotionalDetachment
213

·
--
WHY DID $BTR SURVIVE THAT SAVAGE WICK WITHOUT GETTING LIQUIDATED? 🦈 ⚡
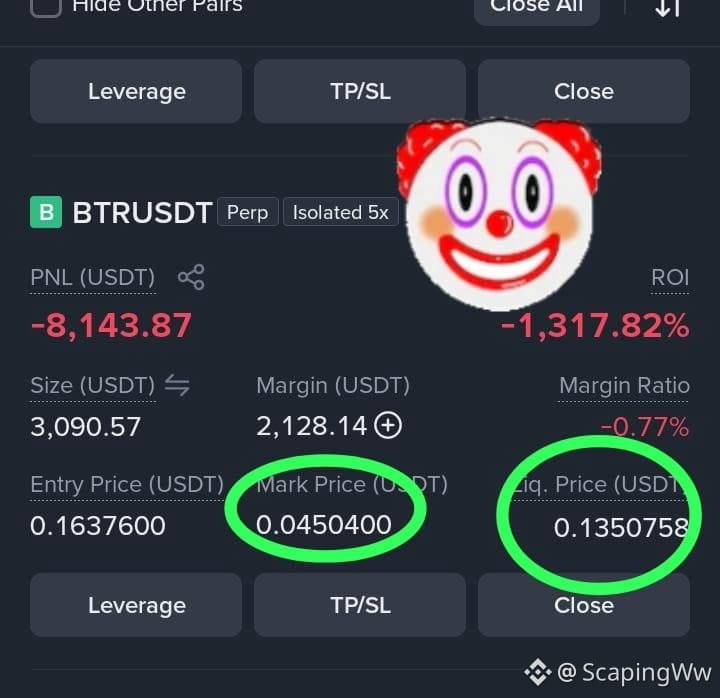
Liquidation mechanics on volatile setups like $BTR often catch traders off guard because contract engines calculate triggers off Mark Price, not spot last price. 📊 When market makers trigger sharp liquidity sweeps, thin order books can push last price extreme while mark price remains cushioned by index averages.
💡 If your leverage position survived that shadow wick, smart money was likely absorbing the dump to keep open interest stacked before the true expansion move. 💬 Did Mark Price keep your trade alive, or did you adjust your maintenance margin just in time? 👇
⚠️ Not financial advice. Always manage your risk. 🛡️
🏷️ #BTR #Liquidation #CryptoTrading #MarketMechanics
⚡ 🧠
WHY DID $BTR SURVIVE THAT SAVAGE WICK WITHOUT GETTING LIQUIDATED? 🦈 ⚡
Liquidation mechanics on volatile setups like $BTR often catch traders off guard because contract engines calculate triggers off Mark Price, not spot last price. 📊 When market makers trigger sharp liquidity sweeps, thin order books can push last price extreme while mark price remains cushioned by index averages.
💡 If your leverage position survived that shadow wick, smart money was likely absorbing the dump to keep open interest stacked before the true expansion move. 💬 Did Mark Price keep your trade alive, or did you adjust your maintenance margin just in time? 👇
⚠️ Not financial advice. Always manage your risk. 🛡️
🏷️ #BTR #Liquidation #CryptoTrading #MarketMechanics
⚡ 🧠
Liquidation mechanics on volatile setups like $BTR often catch traders off guard because contract engines calculate triggers off Mark Price, not spot last price. 📊 When market makers trigger sharp liquidity sweeps, thin order books can push last price extreme while mark price remains cushioned by index averages.
💡 If your leverage position survived that shadow wick, smart money was likely absorbing the dump to keep open interest stacked before the true expansion move. 💬 Did Mark Price keep your trade alive, or did you adjust your maintenance margin just in time? 👇
⚠️ Not financial advice. Always manage your risk. 🛡️
🏷️ #BTR #Liquidation #CryptoTrading #MarketMechanics
⚡ 🧠
144
·
--
Understanding market mechanics beyond price action is key. My general market intel helps filter out weak setups for tokens like $SUI and $DOGE .
🔥 Deep Market Intel
💎 Order Book: Balanced DOM (1.18x)
💎 1H Open Interest: Accumulating (+)
💎 Whales L/S: 70.9% Long
💎 Taker Flow: 0.74x 📊
Always consider the full picture.
#MarketMechanics #CryptoTips
Understanding market mechanics beyond price action is key. My general market intel helps filter out weak setups for tokens like $SUI and $DOGE .
🔥 Deep Market Intel
💎 Order Book: Balanced DOM (1.18x)
💎 1H Open Interest: Accumulating (+)
💎 Whales L/S: 70.9% Long
💎 Taker Flow: 0.74x 📊
Always consider the full picture.
#MarketMechanics #CryptoTips
🔥 Deep Market Intel
💎 Order Book: Balanced DOM (1.18x)
💎 1H Open Interest: Accumulating (+)
💎 Whales L/S: 70.9% Long
💎 Taker Flow: 0.74x 📊
Always consider the full picture.
#MarketMechanics #CryptoTips
179

The market doesn't print money. It transfers wealth from the impatient to the structured. 📉🧠
If you are only analyzing price charts, you are missing 80% of the picture:
• Liquidity Drives Price: Price moves where the stop losses are clustered.
• Volume Validates Intent: High price action with low volume is a temporary illusion.
Trade the mechanics, not your emotions. 🛡️
#CryptoAnalysis #MarketMechanics #BinanceSquare #smartmoney #bitcoin
The market doesn't print money. It transfers wealth from the impatient to the structured. 📉🧠
If you are only analyzing price charts, you are missing 80% of the picture:
• Liquidity Drives Price: Price moves where the stop losses are clustered.
• Volume Validates Intent: High price action with low volume is a temporary illusion.
Trade the mechanics, not your emotions. 🛡️
#CryptoAnalysis #MarketMechanics #BinanceSquare #smartmoney #bitcoin
If you are only analyzing price charts, you are missing 80% of the picture:
• Liquidity Drives Price: Price moves where the stop losses are clustered.
• Volume Validates Intent: High price action with low volume is a temporary illusion.
Trade the mechanics, not your emotions. 🛡️
#CryptoAnalysis #MarketMechanics #BinanceSquare #smartmoney #bitcoin
101

·
--

Article
How Bots Trade News in Microseconds – Before You Finish the HeadlineEver notice a token rip 5% the exact second breaking news hits X or Telegram? That’s not retail traders with fast fingers—it’s Natural Language Processing (NLP) married to High-Frequency Scraping (HFS) bots.
By the time your brain registers the first three words of a headline, an automated trading cluster—co-located next to exchange servers—has already ingested the text, scored its sentiment, and swept the order book.
Here’s how the invisible machine moves crypto markets in sub‑millisecond windows. 👇
---
📡 1. The High‑Frequency Ingestion Stack
To front‑run news, algorithms don’t open browsers. They pull data raw at the protocol layer:
· Direct feeds – Quants connect to high‑speed WebSocket streams (Binance announcement APIs, SEC EDGAR, X enterprise tiers, and wire services).
· RAM‑only parsing – Custom scrapers in C++ or Rust strip HTML, parse JSON, and tokenize text entirely in memory—zero disk I/O.
· Network edge – Servers housed in AWS or Equinix colocation cut round‑trip ping to exchange engines from ~50ms down to <1ms.
---
🧠 2. Sub‑Millisecond Sentiment Scoring
Raw text hits a pipeline of specialized models (FinBERT or ONNX/TensorRT‑optimized LLMs) that evaluate in under 5 milliseconds:
· Entity disambiguation – Instantly knows whether “Apple” means the tech giant or a DeFi memecoin, and “SEC” the regulator or a sports conference.
· Contextual nuance – Distinguishes “Revenue missed aggressive targets” (bearish) from “Missed targets, yet net profit hit all‑time highs” (bullish).
· Vector‑based scoring – Outputs a confidence score from –1.0 to +1.0. Anything above +0.85 triggers max‑leverage buys automatically.
---
📊 3. Real‑World Proof: The Crypto Speed Wars
We’ve seen this play out repeatedly:
· SEC X Account Hack (BTC ETF Fakeout) – Early 2024, a compromised SEC account posted fake ETF approval. NLP scrapers bought spot and futures within 40 milliseconds, sending BTC ~$1,000 higher before most humans even verified the source.
· Social‑media catalyst bots – Algorithms constantly monitor high‑profile accounts. A single ticker mention can move low‑liquidity memecoins 20–50% within 100 ms.
---
📉 4. What Happens to the Order Book
When a high‑confidence signal fires, three things occur simultaneously:
· Liquidity sweeps – Bot market orders eat all available limit orders across multiple price tiers in one go.
· Spread widening – Market‑making bots detect the sentiment volume and pull quotes to avoid getting caught, thinning liquidity.
· Phantom slippage – Retail traders who hit “Market Buy” just 3 seconds later end up buying near the top of the candle—right as bots take profits.
---
💡 Key Takeaway for Retail Traders:
Never try to manually out‑trade news with market orders. The system is engineered to fill you after the algorithms have already extracted the edge.
---
💬 What’s your move when major news drops?
Do you wait for the bot‑induced volatility to settle, or stick strictly to technicals? Drop your thoughts below!
Follow us for more market updates.
#AlgorithmicTrading #HighFrequencyTrading #MarketMechanics #CryptoNews
How Bots Trade News in Microseconds – Before You Finish the Headline
Ever notice a token rip 5% the exact second breaking news hits X or Telegram? That’s not retail traders with fast fingers—it’s Natural Language Processing (NLP) married to High-Frequency Scraping (HFS) bots.
By the time your brain registers the first three words of a headline, an automated trading cluster—co-located next to exchange servers—has already ingested the text, scored its sentiment, and swept the order book.
Here’s how the invisible machine moves crypto markets in sub‑millisecond windows. 👇
---
📡 1. The High‑Frequency Ingestion Stack
To front‑run news, algorithms don’t open browsers. They pull data raw at the protocol layer:
· Direct feeds – Quants connect to high‑speed WebSocket streams (Binance announcement APIs, SEC EDGAR, X enterprise tiers, and wire services).
· RAM‑only parsing – Custom scrapers in C++ or Rust strip HTML, parse JSON, and tokenize text entirely in memory—zero disk I/O.
· Network edge – Servers housed in AWS or Equinix colocation cut round‑trip ping to exchange engines from ~50ms down to <1ms.
---
🧠 2. Sub‑Millisecond Sentiment Scoring
Raw text hits a pipeline of specialized models (FinBERT or ONNX/TensorRT‑optimized LLMs) that evaluate in under 5 milliseconds:
· Entity disambiguation – Instantly knows whether “Apple” means the tech giant or a DeFi memecoin, and “SEC” the regulator or a sports conference.
· Contextual nuance – Distinguishes “Revenue missed aggressive targets” (bearish) from “Missed targets, yet net profit hit all‑time highs” (bullish).
· Vector‑based scoring – Outputs a confidence score from –1.0 to +1.0. Anything above +0.85 triggers max‑leverage buys automatically.
---
📊 3. Real‑World Proof: The Crypto Speed Wars
We’ve seen this play out repeatedly:
· SEC X Account Hack (BTC ETF Fakeout) – Early 2024, a compromised SEC account posted fake ETF approval. NLP scrapers bought spot and futures within 40 milliseconds, sending BTC ~$1,000 higher before most humans even verified the source.
· Social‑media catalyst bots – Algorithms constantly monitor high‑profile accounts. A single ticker mention can move low‑liquidity memecoins 20–50% within 100 ms.
---
📉 4. What Happens to the Order Book
When a high‑confidence signal fires, three things occur simultaneously:
· Liquidity sweeps – Bot market orders eat all available limit orders across multiple price tiers in one go.
· Spread widening – Market‑making bots detect the sentiment volume and pull quotes to avoid getting caught, thinning liquidity.
· Phantom slippage – Retail traders who hit “Market Buy” just 3 seconds later end up buying near the top of the candle—right as bots take profits.
---
💡 Key Takeaway for Retail Traders:
Never try to manually out‑trade news with market orders. The system is engineered to fill you after the algorithms have already extracted the edge.
---
💬 What’s your move when major news drops?
Do you wait for the bot‑induced volatility to settle, or stick strictly to technicals? Drop your thoughts below!
Follow us for more market updates.
#AlgorithmicTrading #HighFrequencyTrading #MarketMechanics #CryptoNews
By the time your brain registers the first three words of a headline, an automated trading cluster—co-located next to exchange servers—has already ingested the text, scored its sentiment, and swept the order book.
Here’s how the invisible machine moves crypto markets in sub‑millisecond windows. 👇
---
📡 1. The High‑Frequency Ingestion Stack
To front‑run news, algorithms don’t open browsers. They pull data raw at the protocol layer:
· Direct feeds – Quants connect to high‑speed WebSocket streams (Binance announcement APIs, SEC EDGAR, X enterprise tiers, and wire services).
· RAM‑only parsing – Custom scrapers in C++ or Rust strip HTML, parse JSON, and tokenize text entirely in memory—zero disk I/O.
· Network edge – Servers housed in AWS or Equinix colocation cut round‑trip ping to exchange engines from ~50ms down to <1ms.
---
🧠 2. Sub‑Millisecond Sentiment Scoring
Raw text hits a pipeline of specialized models (FinBERT or ONNX/TensorRT‑optimized LLMs) that evaluate in under 5 milliseconds:
· Entity disambiguation – Instantly knows whether “Apple” means the tech giant or a DeFi memecoin, and “SEC” the regulator or a sports conference.
· Contextual nuance – Distinguishes “Revenue missed aggressive targets” (bearish) from “Missed targets, yet net profit hit all‑time highs” (bullish).
· Vector‑based scoring – Outputs a confidence score from –1.0 to +1.0. Anything above +0.85 triggers max‑leverage buys automatically.
---
📊 3. Real‑World Proof: The Crypto Speed Wars
We’ve seen this play out repeatedly:
· SEC X Account Hack (BTC ETF Fakeout) – Early 2024, a compromised SEC account posted fake ETF approval. NLP scrapers bought spot and futures within 40 milliseconds, sending BTC ~$1,000 higher before most humans even verified the source.
· Social‑media catalyst bots – Algorithms constantly monitor high‑profile accounts. A single ticker mention can move low‑liquidity memecoins 20–50% within 100 ms.
---
📉 4. What Happens to the Order Book
When a high‑confidence signal fires, three things occur simultaneously:
· Liquidity sweeps – Bot market orders eat all available limit orders across multiple price tiers in one go.
· Spread widening – Market‑making bots detect the sentiment volume and pull quotes to avoid getting caught, thinning liquidity.
· Phantom slippage – Retail traders who hit “Market Buy” just 3 seconds later end up buying near the top of the candle—right as bots take profits.
---
💡 Key Takeaway for Retail Traders:
Never try to manually out‑trade news with market orders. The system is engineered to fill you after the algorithms have already extracted the edge.
---
💬 What’s your move when major news drops?
Do you wait for the bot‑induced volatility to settle, or stick strictly to technicals? Drop your thoughts below!
Follow us for more market updates.
#AlgorithmicTrading #HighFrequencyTrading #MarketMechanics #CryptoNews
95
·
--
Article
Why Bitcoin Crashes 10% in 60 Seconds With Zero Negative News – The Hidden Liquidation EngineEver watched BTC nuke thousands of dollars in under a minute while the spot market shows almost zero organic sell volume and the news feed is dead silent? That isn't a whale dumping physical coins—it is a Derivatives Cascade Liquidation: a violent chain reaction where over-leveraged futures positions trigger forced closures, creating immediate price spikes completely detached from spot demand.
By the time retail traders refresh their charts, the cascade has already vaporized billions in Open Interest (OI) and reset funding rates—all in the blink of an eye.
Here is the forensic breakdown of how leverage becomes a self-destruct mechanism in crypto markets. 👇
📐 1. The Leverage Trap & The "Liquidation Waterfall"
To understand the cascade, you must look at how an exchange's automated risk engine operates:
Maintenance Margin Collapse: At 50x–100x leverage, a tiny 1–2% adverse price move depletes a trader's entire collateral. Automated Risk Engines instantly issue forced market orders the millisecond the Mark Price breaches the liquidation threshold.The Mark Price Flaw: Exchanges use the Mark Price (an index calculated from spot exchanges) to trigger liquidations and prevent localized price manipulation. However, during rapid shifts, futures prices disconnect from spot indices, causing futures contracts to violently snap down or up to force convergence.Aggressive Order Sweeps: The exchange risk engine doesn't wait for limit buyers—it aggressively sweeps the bid/ask ladder, eating through multiple price tiers simultaneously to execute orders instantly.
⛓️ 2. The Cascade Effect – A Liquidity Domino Reaction
A single liquidation is just a spark. A cascade is a nuclear chain reaction:
Long Squeeze Dynamics: A quick 1.5% drop triggers the first cluster of heavily leveraged long positions. Their forced market-sell orders push the price down another 1%. That lower price immediately breaches the next layer of long stop-losses, triggering another wave of forced sells. Within seconds, a 2% dip snowballs into a 12–15% flash crash.Short Squeeze (The Inverse): Sudden unexpected upside momentum forces over-leveraged shorts to buy back their positions at market price. This concentrated buy pressure rockets the price straight up, triggering subsequent layers of short liquidations in a vertical "god candle."Auto-Deleveraging (ADL) Triggers: If order book liquidity evaporates completely and the insurance fund cannot absorb the shock, exchanges trigger Auto-Deleveraging (ADL)—forcibly closing the most profitable opposing traders' positions to preserve exchange balance.
📊 3. Real-World Proof: Massive Leverage Flushes
History repeatedly demonstrates how synthetic leverage overrides macro fundamentals:
The May 2021 Liquidation Wave: Over $8.5 Billion in leveraged positions vanished within 24 hours as BTC crashed from ~$58,000 to ~$42,000. The primary driver wasn't spot distribution—it was an automated long cascade processing hundreds of thousands of accounts at once.The August 2024 Global Liquidity Flush: Over $1.2 Billion in crypto leverage was wiped out in hours during a sudden yen carry-trade unwind. Bitcoin plunged below key support purely due to cross-market position liquidations rather than crypto-native bad news.The Massive Leverage Reset: Historic OI wipeouts show that when Open Interest reaches unsustainable highs, a brief 2% impulse can erase $10B+ in open contracts in a single session, resetting funding rates to bear-market lows instantly.
🧩 4. The Disconnect From Spot Demand
When a derivatives cascade fires off, physical spot markets are often passive observers:
Basis Dislocation: Perpetual futures trade at an extreme discount (during a crash) or premium (during a short squeeze) compared to the underlying spot price index.
Arbitrage Lag: High-frequency statistical arbitrageurs eventually step in to buy cheap futures and sell spot (or vice versa), re-anchoring the price gap. This arbitrage flow is what typically forms the sharp "V-shaped" recovery candle 5 to 15 minutes after the liquidation engine finishes sweeping.Synthetic Volatility: Spot depth charts often remain relatively stable while futures order books look like a cliff, proving that the move is driven purely by paper contracts rather than real asset distribution.
💡 Key Takeaways for Retail Risk Management:
Avoid Obvious Liquidation Heatmaps: Never stack tight stop-losses right below high-density swing lows where market makers and algorithms look for liquidity sweeps.Monitor Open Interest (OI) & Funding Rates: When OI hits record highs alongside heavily skewed positive funding, the market is primed for a long flush.Never Catch a Falling Knife with Market Orders: During an active cascade, order book spreads widen drastically. Wait for funding rates and the futures basis to normalize before looking for reversal setups.
💬 How do you handle rapid flash crashes? Do you set stink-bids on spot order books to catch liquidation wicks, or do you step away from the terminal until volatility cools off? Share your setup below!
Follow us for more crypto insights.
#Liquidations #cryptotrading #futuresignal #MarketMechanics
{spot}(DYDXUSDT)
Why Bitcoin Crashes 10% in 60 Seconds With Zero Negative News – The Hidden Liquidation Engine
Ever watched BTC nuke thousands of dollars in under a minute while the spot market shows almost zero organic sell volume and the news feed is dead silent? That isn't a whale dumping physical coins—it is a Derivatives Cascade Liquidation: a violent chain reaction where over-leveraged futures positions trigger forced closures, creating immediate price spikes completely detached from spot demand.
By the time retail traders refresh their charts, the cascade has already vaporized billions in Open Interest (OI) and reset funding rates—all in the blink of an eye.
Here is the forensic breakdown of how leverage becomes a self-destruct mechanism in crypto markets. 👇
📐 1. The Leverage Trap & The "Liquidation Waterfall"
To understand the cascade, you must look at how an exchange's automated risk engine operates:
Maintenance Margin Collapse: At 50x–100x leverage, a tiny 1–2% adverse price move depletes a trader's entire collateral. Automated Risk Engines instantly issue forced market orders the millisecond the Mark Price breaches the liquidation threshold.The Mark Price Flaw: Exchanges use the Mark Price (an index calculated from spot exchanges) to trigger liquidations and prevent localized price manipulation. However, during rapid shifts, futures prices disconnect from spot indices, causing futures contracts to violently snap down or up to force convergence.Aggressive Order Sweeps: The exchange risk engine doesn't wait for limit buyers—it aggressively sweeps the bid/ask ladder, eating through multiple price tiers simultaneously to execute orders instantly.
⛓️ 2. The Cascade Effect – A Liquidity Domino Reaction
A single liquidation is just a spark. A cascade is a nuclear chain reaction:
Long Squeeze Dynamics: A quick 1.5% drop triggers the first cluster of heavily leveraged long positions. Their forced market-sell orders push the price down another 1%. That lower price immediately breaches the next layer of long stop-losses, triggering another wave of forced sells. Within seconds, a 2% dip snowballs into a 12–15% flash crash.Short Squeeze (The Inverse): Sudden unexpected upside momentum forces over-leveraged shorts to buy back their positions at market price. This concentrated buy pressure rockets the price straight up, triggering subsequent layers of short liquidations in a vertical "god candle."Auto-Deleveraging (ADL) Triggers: If order book liquidity evaporates completely and the insurance fund cannot absorb the shock, exchanges trigger Auto-Deleveraging (ADL)—forcibly closing the most profitable opposing traders' positions to preserve exchange balance.
📊 3. Real-World Proof: Massive Leverage Flushes
History repeatedly demonstrates how synthetic leverage overrides macro fundamentals:
The May 2021 Liquidation Wave: Over $8.5 Billion in leveraged positions vanished within 24 hours as BTC crashed from ~$58,000 to ~$42,000. The primary driver wasn't spot distribution—it was an automated long cascade processing hundreds of thousands of accounts at once.The August 2024 Global Liquidity Flush: Over $1.2 Billion in crypto leverage was wiped out in hours during a sudden yen carry-trade unwind. Bitcoin plunged below key support purely due to cross-market position liquidations rather than crypto-native bad news.The Massive Leverage Reset: Historic OI wipeouts show that when Open Interest reaches unsustainable highs, a brief 2% impulse can erase $10B+ in open contracts in a single session, resetting funding rates to bear-market lows instantly.
🧩 4. The Disconnect From Spot Demand
When a derivatives cascade fires off, physical spot markets are often passive observers:
Basis Dislocation: Perpetual futures trade at an extreme discount (during a crash) or premium (during a short squeeze) compared to the underlying spot price index.
Arbitrage Lag: High-frequency statistical arbitrageurs eventually step in to buy cheap futures and sell spot (or vice versa), re-anchoring the price gap. This arbitrage flow is what typically forms the sharp "V-shaped" recovery candle 5 to 15 minutes after the liquidation engine finishes sweeping.Synthetic Volatility: Spot depth charts often remain relatively stable while futures order books look like a cliff, proving that the move is driven purely by paper contracts rather than real asset distribution.
💡 Key Takeaways for Retail Risk Management:
Avoid Obvious Liquidation Heatmaps: Never stack tight stop-losses right below high-density swing lows where market makers and algorithms look for liquidity sweeps.Monitor Open Interest (OI) & Funding Rates: When OI hits record highs alongside heavily skewed positive funding, the market is primed for a long flush.Never Catch a Falling Knife with Market Orders: During an active cascade, order book spreads widen drastically. Wait for funding rates and the futures basis to normalize before looking for reversal setups.
💬 How do you handle rapid flash crashes? Do you set stink-bids on spot order books to catch liquidation wicks, or do you step away from the terminal until volatility cools off? Share your setup below!
Follow us for more crypto insights.
#Liquidations #cryptotrading #futuresignal #MarketMechanics
By the time retail traders refresh their charts, the cascade has already vaporized billions in Open Interest (OI) and reset funding rates—all in the blink of an eye.
Here is the forensic breakdown of how leverage becomes a self-destruct mechanism in crypto markets. 👇
📐 1. The Leverage Trap & The "Liquidation Waterfall"
To understand the cascade, you must look at how an exchange's automated risk engine operates:
Maintenance Margin Collapse: At 50x–100x leverage, a tiny 1–2% adverse price move depletes a trader's entire collateral. Automated Risk Engines instantly issue forced market orders the millisecond the Mark Price breaches the liquidation threshold.The Mark Price Flaw: Exchanges use the Mark Price (an index calculated from spot exchanges) to trigger liquidations and prevent localized price manipulation. However, during rapid shifts, futures prices disconnect from spot indices, causing futures contracts to violently snap down or up to force convergence.Aggressive Order Sweeps: The exchange risk engine doesn't wait for limit buyers—it aggressively sweeps the bid/ask ladder, eating through multiple price tiers simultaneously to execute orders instantly.
⛓️ 2. The Cascade Effect – A Liquidity Domino Reaction
A single liquidation is just a spark. A cascade is a nuclear chain reaction:
Long Squeeze Dynamics: A quick 1.5% drop triggers the first cluster of heavily leveraged long positions. Their forced market-sell orders push the price down another 1%. That lower price immediately breaches the next layer of long stop-losses, triggering another wave of forced sells. Within seconds, a 2% dip snowballs into a 12–15% flash crash.Short Squeeze (The Inverse): Sudden unexpected upside momentum forces over-leveraged shorts to buy back their positions at market price. This concentrated buy pressure rockets the price straight up, triggering subsequent layers of short liquidations in a vertical "god candle."Auto-Deleveraging (ADL) Triggers: If order book liquidity evaporates completely and the insurance fund cannot absorb the shock, exchanges trigger Auto-Deleveraging (ADL)—forcibly closing the most profitable opposing traders' positions to preserve exchange balance.
📊 3. Real-World Proof: Massive Leverage Flushes
History repeatedly demonstrates how synthetic leverage overrides macro fundamentals:
The May 2021 Liquidation Wave: Over $8.5 Billion in leveraged positions vanished within 24 hours as BTC crashed from ~$58,000 to ~$42,000. The primary driver wasn't spot distribution—it was an automated long cascade processing hundreds of thousands of accounts at once.The August 2024 Global Liquidity Flush: Over $1.2 Billion in crypto leverage was wiped out in hours during a sudden yen carry-trade unwind. Bitcoin plunged below key support purely due to cross-market position liquidations rather than crypto-native bad news.The Massive Leverage Reset: Historic OI wipeouts show that when Open Interest reaches unsustainable highs, a brief 2% impulse can erase $10B+ in open contracts in a single session, resetting funding rates to bear-market lows instantly.
🧩 4. The Disconnect From Spot Demand
When a derivatives cascade fires off, physical spot markets are often passive observers:
Basis Dislocation: Perpetual futures trade at an extreme discount (during a crash) or premium (during a short squeeze) compared to the underlying spot price index.
Arbitrage Lag: High-frequency statistical arbitrageurs eventually step in to buy cheap futures and sell spot (or vice versa), re-anchoring the price gap. This arbitrage flow is what typically forms the sharp "V-shaped" recovery candle 5 to 15 minutes after the liquidation engine finishes sweeping.Synthetic Volatility: Spot depth charts often remain relatively stable while futures order books look like a cliff, proving that the move is driven purely by paper contracts rather than real asset distribution.
💡 Key Takeaways for Retail Risk Management:
Avoid Obvious Liquidation Heatmaps: Never stack tight stop-losses right below high-density swing lows where market makers and algorithms look for liquidity sweeps.Monitor Open Interest (OI) & Funding Rates: When OI hits record highs alongside heavily skewed positive funding, the market is primed for a long flush.Never Catch a Falling Knife with Market Orders: During an active cascade, order book spreads widen drastically. Wait for funding rates and the futures basis to normalize before looking for reversal setups.
💬 How do you handle rapid flash crashes? Do you set stink-bids on spot order books to catch liquidation wicks, or do you step away from the terminal until volatility cools off? Share your setup below!
Follow us for more crypto insights.
#Liquidations #cryptotrading #futuresignal #MarketMechanics
237
·
--
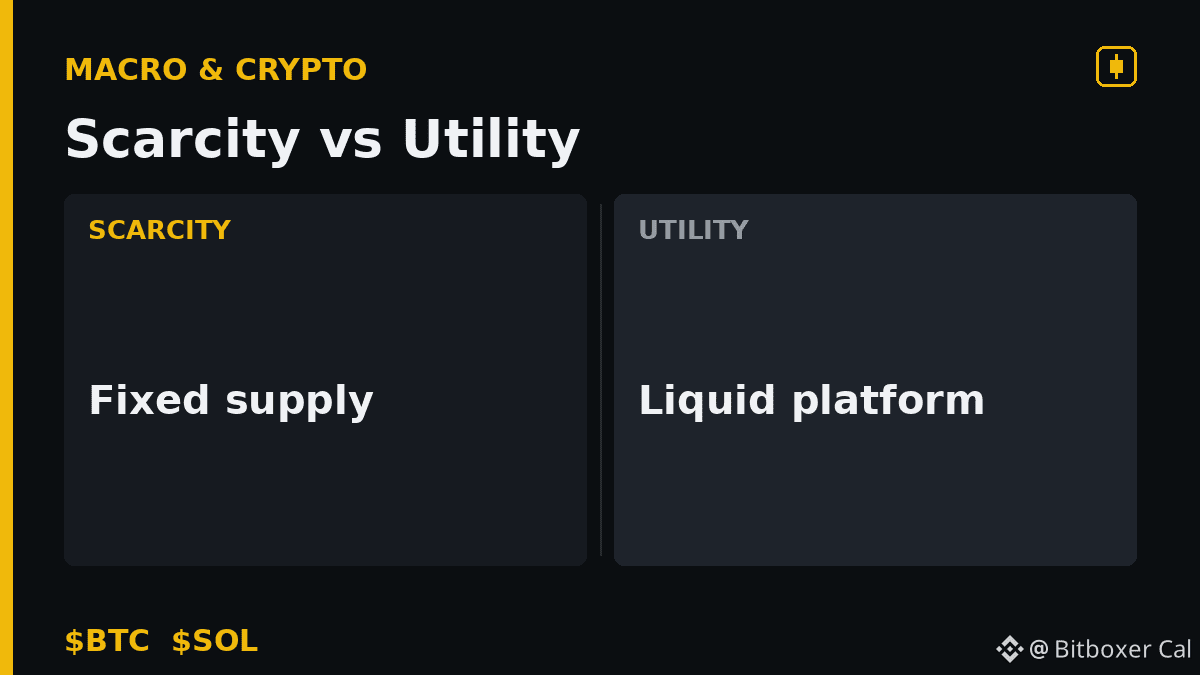
Luxury watches like the Patek Philippe Ref. 5016P hold value not for their function, but because their supply is locked by the laws of physics.
Capital hunts scarcity during a crunch, moving into assets where the production floor is permanently bolted shut. $BTC follows this hard-capped logic, while $SOL acts as the high-frequency floor where the auction happens. Stop hunting for utility and start watching for the exit door that only opens once.
#macro #marketmechanics #OnChain
Luxury watches like the Patek Philippe Ref. 5016P hold value not for their function, but because their supply is locked by the laws of physics.
Capital hunts scarcity during a crunch, moving into assets where the production floor is permanently bolted shut. $BTC follows this hard-capped logic, while $SOL acts as the high-frequency floor where the auction happens. Stop hunting for utility and start watching for the exit door that only opens once.
#macro #marketmechanics #OnChain
Capital hunts scarcity during a crunch, moving into assets where the production floor is permanently bolted shut. $BTC follows this hard-capped logic, while $SOL acts as the high-frequency floor where the auction happens. Stop hunting for utility and start watching for the exit door that only opens once.
#macro #marketmechanics #OnChain
119
·
--
The crowd views the blockbuster box office of 'Spider-Man: Brand New Day' as a win for the film studio's bottom line.
Savvy operators see this as a masterclass in IP licensing, where the real value flows to the distribution rails. In crypto, this exposes the trap of chasing hype; while everyone hunts for new tokens, the actual value accrues to the protocols securing the settlement layer, like $ETH or $BTC. Watch the fee-capture mechanisms to see who is truly building a moat.
#gaming #marketmechanics #DYOR
The crowd views the blockbuster box office of 'Spider-Man: Brand New Day' as a win for the film studio's bottom line.
Savvy operators see this as a masterclass in IP licensing, where the real value flows to the distribution rails. In crypto, this exposes the trap of chasing hype; while everyone hunts for new tokens, the actual value accrues to the protocols securing the settlement layer, like $ETH or $BTC . Watch the fee-capture mechanisms to see who is truly building a moat.
#gaming #marketmechanics #DYOR
Savvy operators see this as a masterclass in IP licensing, where the real value flows to the distribution rails. In crypto, this exposes the trap of chasing hype; while everyone hunts for new tokens, the actual value accrues to the protocols securing the settlement layer, like $ETH or $BTC . Watch the fee-capture mechanisms to see who is truly building a moat.
#gaming #marketmechanics #DYOR

64
·
--
Why does $XRP always catch fire the second it flirts with a psychological dollar?
It’s not protocol news; it’s retail collective momentum mirroring a classic short squeeze. Watch the Open Interest closely. When derivative contracts explode while spot volume stays flat, you’re looking at a house of cards built on borrowed conviction. Is this a breakout or just thin air?
$XRP $SOL #CryptoEducation #MarketMechanics #Liquidity
Why does $XRP always catch fire the second it flirts with a psychological dollar?
It’s not protocol news; it’s retail collective momentum mirroring a classic short squeeze. Watch the Open Interest closely. When derivative contracts explode while spot volume stays flat, you’re looking at a house of cards built on borrowed conviction. Is this a breakout or just thin air?
$XRP $SOL #CryptoEducation #MarketMechanics #Liquidity
It’s not protocol news; it’s retail collective momentum mirroring a classic short squeeze. Watch the Open Interest closely. When derivative contracts explode while spot volume stays flat, you’re looking at a house of cards built on borrowed conviction. Is this a breakout or just thin air?
$XRP $SOL #CryptoEducation #MarketMechanics #Liquidity
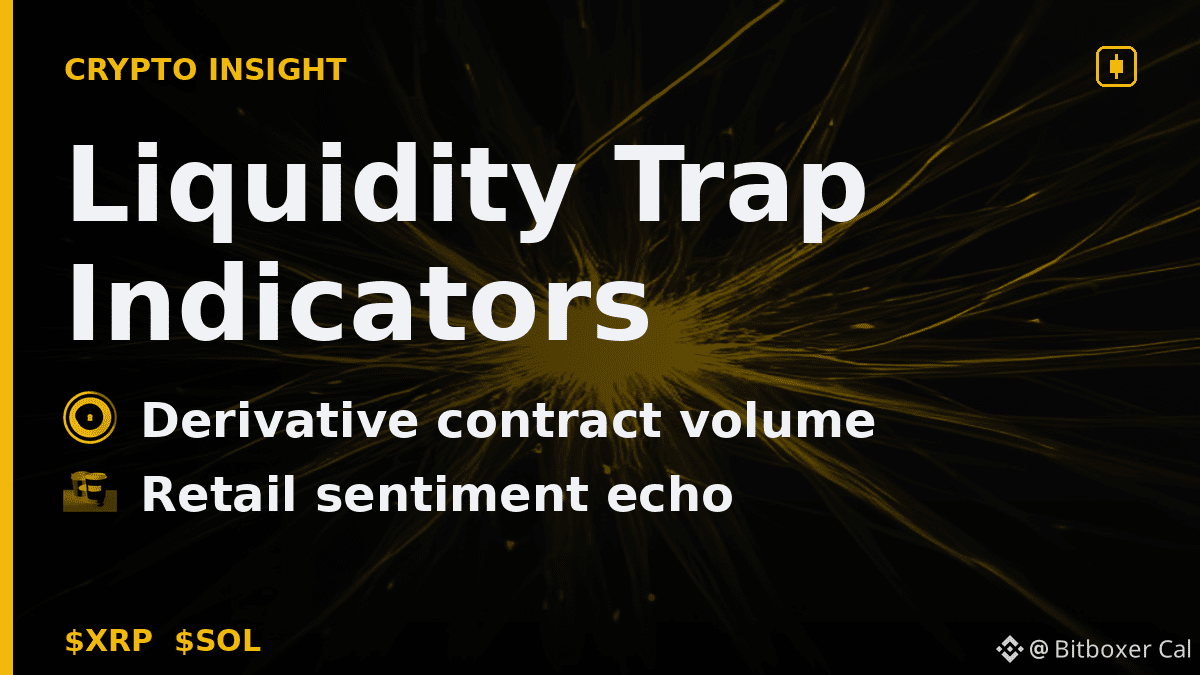
1
139
·
--
The 'Diamond Hander' holding $ETH through a storm thinks sheer willpower overrides market physics.
It’s a nice sentiment, but you can't stop a flood with a rake. Market forces don't care about your entry price. Watch the Open Interest in $BTC; it reveals when a crowded trade is about to trigger a cascade, regardless of how much stamina you have.
$ETH #CryptoEducation #MarketMechanics #CryptoNews
The 'Diamond Hander' holding $ETH through a storm thinks sheer willpower overrides market physics.
It’s a nice sentiment, but you can't stop a flood with a rake. Market forces don't care about your entry price. Watch the Open Interest in $BTC ; it reveals when a crowded trade is about to trigger a cascade, regardless of how much stamina you have.
$ETH #CryptoEducation #MarketMechanics #CryptoNews
It’s a nice sentiment, but you can't stop a flood with a rake. Market forces don't care about your entry price. Watch the Open Interest in $BTC ; it reveals when a crowded trade is about to trigger a cascade, regardless of how much stamina you have.
$ETH #CryptoEducation #MarketMechanics #CryptoNews
98
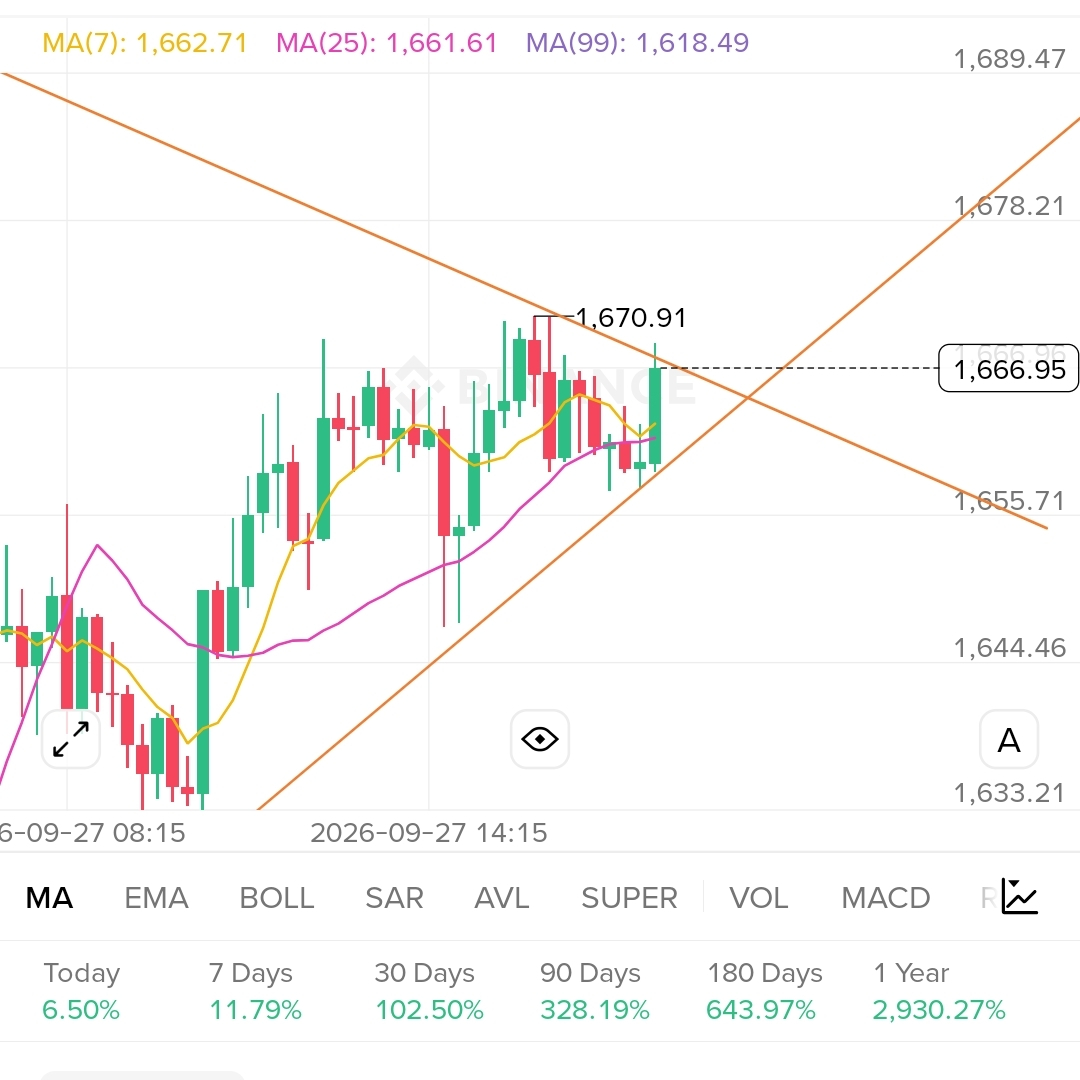
📉🚫 "Stop hunting" isn't a conspiracy; it's market makers finding liquidity for big orders. Clusters of retail stops below obvious levels are goldmines for them. It's pure market mechanics, not personal targeting.
Where do new traders put stops? Right under a clear swing low like $29,950, or a round number like $30,000. These are predictable zones. Instead, give your stop room. If the low is $29,950, don't put yours at $29,949. Think $29,870.
My rule: Identify the obvious support/resistance. Then, go *beyond* it by an additional 0.5%-1%, or use 1.5x the current Average True Range (ATR) from that level. Make your stop logical, but never *obvious*.
#FuturesTrading #StopLoss #MarketMechanics #TradingTips #RiskManagement
📉🚫 "Stop hunting" isn't a conspiracy; it's market makers finding liquidity for big orders. Clusters of retail stops below obvious levels are goldmines for them. It's pure market mechanics, not personal targeting.
Where do new traders put stops? Right under a clear swing low like $29,950, or a round number like $30,000. These are predictable zones. Instead, give your stop room. If the low is $29,950, don't put yours at $29,949. Think $29,870.
My rule: Identify the obvious support/resistance. Then, go *beyond* it by an additional 0.5%-1%, or use 1.5x the current Average True Range (ATR) from that level. Make your stop logical, but never *obvious*.
#FuturesTrading #StopLoss #MarketMechanics #TradingTips #RiskManagement
Where do new traders put stops? Right under a clear swing low like $29,950, or a round number like $30,000. These are predictable zones. Instead, give your stop room. If the low is $29,950, don't put yours at $29,949. Think $29,870.
My rule: Identify the obvious support/resistance. Then, go *beyond* it by an additional 0.5%-1%, or use 1.5x the current Average True Range (ATR) from that level. Make your stop logical, but never *obvious*.
#FuturesTrading #StopLoss #MarketMechanics #TradingTips #RiskManagement
27
·
--
Everyone’s panicking because $BTC dipped under $90,000, claiming the trend is dead.
They’re wrong. Volatility is just the entry fee for staying in the game. Don't let market noise blind you to the protocol stability that keeps $BTC and $XRP running, regardless of what the charts scream today.
#cryptoeducation #marketmechanics #Web3
Everyone’s panicking because $BTC dipped under $90,000, claiming the trend is dead.
They’re wrong. Volatility is just the entry fee for staying in the game. Don't let market noise blind you to the protocol stability that keeps $BTC and $XRP running, regardless of what the charts scream today.
#cryptoeducation #marketmechanics #Web3
They’re wrong. Volatility is just the entry fee for staying in the game. Don't let market noise blind you to the protocol stability that keeps $BTC and $XRP running, regardless of what the charts scream today.
#cryptoeducation #marketmechanics #Web3
107

·
--

Article
The Architecture of an $80K Market: Why TON, BNB, and AI Agents Are Rewriting the Playbook 📊If you are watching the charts today, you already know Bitcoin is solidifying above the $80,000 level. But while retail traders are staring at BTC and arguing over Michael Saylor's recent comments about potentially selling some MicroStrategy holdings to fund dividends, the actual "smart money" is focused entirely on infrastructure.
The market has shifted. We are no longer in an environment where capital blindly chases hype. Capital is now hunting for real-world distribution and autonomous execution. As I continue mapping out the mechanics for the automated tracking system and drafting the book, two top-tier heavyweight ecosystems—**TON** and BNB—are providing the perfect case studies for where this market is actually heading.
Here is the data-driven reality of what is happening under the surface today:
### 🌐 1. The TON Ecosystem: The Distribution Shock
For a long time, the market treated TON as just another Layer-1 competing in a crowded space. That narrative is dead. With Telegram officially taking deeper control of the TON blockchain, we are witnessing a structural collision between decentralized finance and a massive, pre-existing distribution network of 1 billion monthly active users.
*The Liquidity Funnel:** By slashing fees to near zero and delivering sub-second block confirmations, TON is no longer just a ledger; it is the native payment and Mini App engine for the internet's largest messaging platform.
*The Systemic View:** When we look at order flow, we aren't just looking for volume spikes anymore. We are looking for stickiness. TON’s integration into creator monetization and SocialFi means liquidity is entering the ecosystem and staying there, creating a much higher floor than traditional altcoins.
🔥 2. BNB Chain: The AI Payment Layer
We cannot talk about top-tier networks without looking at the structural advantage of BNB. The recent token burns (removing billions in notional value from the supply) are fundamentally sound, but the real narrative shift is happening around utility.
*Deflation meets Automation:** BNB Chain is aggressively positioning itself as the foundational layer for AI payments. As artificial intelligence models require micro-transactions to process requests and share data, they need a high-throughput, low-fee environment.
*The Compounding Effect:** You have a heavily deflationary asset serving as the gas for the largest crypto exchange in the world, now pivoting to become the settlement layer for machine-to-machine AI economies.
🤖 3. The Agentic AI Execution Frontier
This brings us to the most critical piece of the puzzle—and exactly why I am building an automated, live-data tracking infrastructure.
The era of rigid "trading bots" is over. What we are seeing built on top of networks like BNB and TON are Agentic AI frameworks. These are autonomous software agents that don't just alert you to an RSI divergence; they monitor Telegram sentiment on TON, track institutional ETF inflows, cross-reference BNB on-chain liquidity, and execute complex, multi-leg strategies without human intervention.
To survive this market, you have to trade the machine. The assets that will win this cycle are the ones providing the tracks for these AI agents to run on.
$BTC $TON $BNB
@Binance_News
@Binance_Academy
#MarketMechanics
#TONEcosystem
#BNBChain
#AgenticAI
#SystematicTrading
The Architecture of an $80K Market: Why TON, BNB, and AI Agents Are Rewriting the Playbook 📊
If you are watching the charts today, you already know Bitcoin is solidifying above the $80,000 level. But while retail traders are staring at BTC and arguing over Michael Saylor's recent comments about potentially selling some MicroStrategy holdings to fund dividends, the actual "smart money" is focused entirely on infrastructure.
The market has shifted. We are no longer in an environment where capital blindly chases hype. Capital is now hunting for real-world distribution and autonomous execution. As I continue mapping out the mechanics for the automated tracking system and drafting the book, two top-tier heavyweight ecosystems—**TON** and BNB—are providing the perfect case studies for where this market is actually heading.
Here is the data-driven reality of what is happening under the surface today:
### 🌐 1. The TON Ecosystem: The Distribution Shock
For a long time, the market treated TON as just another Layer-1 competing in a crowded space. That narrative is dead. With Telegram officially taking deeper control of the TON blockchain, we are witnessing a structural collision between decentralized finance and a massive, pre-existing distribution network of 1 billion monthly active users.
*The Liquidity Funnel:** By slashing fees to near zero and delivering sub-second block confirmations, TON is no longer just a ledger; it is the native payment and Mini App engine for the internet's largest messaging platform.
*The Systemic View:** When we look at order flow, we aren't just looking for volume spikes anymore. We are looking for stickiness. TON’s integration into creator monetization and SocialFi means liquidity is entering the ecosystem and staying there, creating a much higher floor than traditional altcoins.
🔥 2. BNB Chain: The AI Payment Layer
We cannot talk about top-tier networks without looking at the structural advantage of BNB. The recent token burns (removing billions in notional value from the supply) are fundamentally sound, but the real narrative shift is happening around utility.
*Deflation meets Automation:** BNB Chain is aggressively positioning itself as the foundational layer for AI payments. As artificial intelligence models require micro-transactions to process requests and share data, they need a high-throughput, low-fee environment.
*The Compounding Effect:** You have a heavily deflationary asset serving as the gas for the largest crypto exchange in the world, now pivoting to become the settlement layer for machine-to-machine AI economies.
🤖 3. The Agentic AI Execution Frontier
This brings us to the most critical piece of the puzzle—and exactly why I am building an automated, live-data tracking infrastructure.
The era of rigid "trading bots" is over. What we are seeing built on top of networks like BNB and TON are Agentic AI frameworks. These are autonomous software agents that don't just alert you to an RSI divergence; they monitor Telegram sentiment on TON, track institutional ETF inflows, cross-reference BNB on-chain liquidity, and execute complex, multi-leg strategies without human intervention.
To survive this market, you have to trade the machine. The assets that will win this cycle are the ones providing the tracks for these AI agents to run on.
$BTC $TON $BNB
@Binance News
@Binance Academy
#MarketMechanics
#TONEcosystem
#BNBChain
#AgenticAI
#SystematicTrading
The market has shifted. We are no longer in an environment where capital blindly chases hype. Capital is now hunting for real-world distribution and autonomous execution. As I continue mapping out the mechanics for the automated tracking system and drafting the book, two top-tier heavyweight ecosystems—**TON** and BNB—are providing the perfect case studies for where this market is actually heading.
Here is the data-driven reality of what is happening under the surface today:
### 🌐 1. The TON Ecosystem: The Distribution Shock
For a long time, the market treated TON as just another Layer-1 competing in a crowded space. That narrative is dead. With Telegram officially taking deeper control of the TON blockchain, we are witnessing a structural collision between decentralized finance and a massive, pre-existing distribution network of 1 billion monthly active users.
*The Liquidity Funnel:** By slashing fees to near zero and delivering sub-second block confirmations, TON is no longer just a ledger; it is the native payment and Mini App engine for the internet's largest messaging platform.
*The Systemic View:** When we look at order flow, we aren't just looking for volume spikes anymore. We are looking for stickiness. TON’s integration into creator monetization and SocialFi means liquidity is entering the ecosystem and staying there, creating a much higher floor than traditional altcoins.
🔥 2. BNB Chain: The AI Payment Layer
We cannot talk about top-tier networks without looking at the structural advantage of BNB. The recent token burns (removing billions in notional value from the supply) are fundamentally sound, but the real narrative shift is happening around utility.
*Deflation meets Automation:** BNB Chain is aggressively positioning itself as the foundational layer for AI payments. As artificial intelligence models require micro-transactions to process requests and share data, they need a high-throughput, low-fee environment.
*The Compounding Effect:** You have a heavily deflationary asset serving as the gas for the largest crypto exchange in the world, now pivoting to become the settlement layer for machine-to-machine AI economies.
🤖 3. The Agentic AI Execution Frontier
This brings us to the most critical piece of the puzzle—and exactly why I am building an automated, live-data tracking infrastructure.
The era of rigid "trading bots" is over. What we are seeing built on top of networks like BNB and TON are Agentic AI frameworks. These are autonomous software agents that don't just alert you to an RSI divergence; they monitor Telegram sentiment on TON, track institutional ETF inflows, cross-reference BNB on-chain liquidity, and execute complex, multi-leg strategies without human intervention.
To survive this market, you have to trade the machine. The assets that will win this cycle are the ones providing the tracks for these AI agents to run on.
$BTC $TON $BNB
@Binance News
@Binance Academy
#MarketMechanics
#TONEcosystem
#BNBChain
#AgenticAI
#SystematicTrading
1
160

·
--
Bullish
🔥 River (RIVER) Token Skyrockets ~2,000% What’s Really Going On? 🛶🚀
The crypto seas have been wild lately, and River’s native token, RIVER, has been one of the hottest stories out there. In just the last month, this once under-the-radar token has blasted off roughly 1,900%, landing it comfortably inside the top 100 tokens by market cap a meteoric ascent few saw coming. 📈🌪️
At the tail end of December, RIVER was trading near $5. Fast forward to this week, and it’s been changing hands around $82, giving it an estimated $1.6B market cap ranking it ~67th among all crypto assets. That kind of move demands attention. 🤑🔥
So what lit the fuse? Two big names in the crypto world Arthur Hayes and Justin Sun have publicly backed the project. Hayes, the former head, pushed for wider exchange listings back on January 6, and RIVER’s value began to rip higher even as broader crypto prices faded. Sun, the Tron founder, dropped $8M into the ecosystem, signaling support for Tron integration a move that brought both publicity and liquidity interest. 🤝🧠
River itself aims to solve a stubborn inefficiency in crypto: allowing stablecoins to flow across chains without messy bridges. With roughly $161M in TVL and its stablecoin ranking about #40 by market cap, the protocol has real fundamentals but hype has certainly been a fuel source. 🌉⚙️
Yet skeptics aren’t silent. Blockchain analytics firm CoinGlass flagged RIVER as a case study in how funding-rate dynamics can be engineered to attract traders into crowded positions, saying in essence: price suppression plus deeply negative funding can create a self-fulfilling belief in rebounds even if the “bounce” logic is a mirage. 🧨🔍
Bottom line? RIVER’s surge is real but it’s a cocktail of endorsements, market mechanics, and crowd psychology. Whether this momentum has staying power or is just a high-octane pump remains the biggest question in town. 🌊💭
#RiverToken 🌊#CryptoSurge 🚀#MarketMechanics 🧠
🔥 River (RIVER) Token Skyrockets ~2,000% What’s Really Going On? 🛶🚀
The crypto seas have been wild lately, and River’s native token, RIVER, has been one of the hottest stories out there. In just the last month, this once under-the-radar token has blasted off roughly 1,900%, landing it comfortably inside the top 100 tokens by market cap a meteoric ascent few saw coming. 📈🌪️
At the tail end of December, RIVER was trading near $5. Fast forward to this week, and it’s been changing hands around $82, giving it an estimated $1.6B market cap ranking it ~67th among all crypto assets. That kind of move demands attention. 🤑🔥
So what lit the fuse? Two big names in the crypto world Arthur Hayes and Justin Sun have publicly backed the project. Hayes, the former head, pushed for wider exchange listings back on January 6, and RIVER’s value began to rip higher even as broader crypto prices faded. Sun, the Tron founder, dropped $8M into the ecosystem, signaling support for Tron integration a move that brought both publicity and liquidity interest. 🤝🧠
River itself aims to solve a stubborn inefficiency in crypto: allowing stablecoins to flow across chains without messy bridges. With roughly $161M in TVL and its stablecoin ranking about #40 by market cap, the protocol has real fundamentals but hype has certainly been a fuel source. 🌉⚙️
Yet skeptics aren’t silent. Blockchain analytics firm CoinGlass flagged RIVER as a case study in how funding-rate dynamics can be engineered to attract traders into crowded positions, saying in essence: price suppression plus deeply negative funding can create a self-fulfilling belief in rebounds even if the “bounce” logic is a mirage. 🧨🔍
Bottom line? RIVER’s surge is real but it’s a cocktail of endorsements, market mechanics, and crowd psychology. Whether this momentum has staying power or is just a high-octane pump remains the biggest question in town. 🌊💭
#RiverToken 🌊#CryptoSurge 🚀#MarketMechanics 🧠
The crypto seas have been wild lately, and River’s native token, RIVER, has been one of the hottest stories out there. In just the last month, this once under-the-radar token has blasted off roughly 1,900%, landing it comfortably inside the top 100 tokens by market cap a meteoric ascent few saw coming. 📈🌪️
At the tail end of December, RIVER was trading near $5. Fast forward to this week, and it’s been changing hands around $82, giving it an estimated $1.6B market cap ranking it ~67th among all crypto assets. That kind of move demands attention. 🤑🔥
So what lit the fuse? Two big names in the crypto world Arthur Hayes and Justin Sun have publicly backed the project. Hayes, the former head, pushed for wider exchange listings back on January 6, and RIVER’s value began to rip higher even as broader crypto prices faded. Sun, the Tron founder, dropped $8M into the ecosystem, signaling support for Tron integration a move that brought both publicity and liquidity interest. 🤝🧠
River itself aims to solve a stubborn inefficiency in crypto: allowing stablecoins to flow across chains without messy bridges. With roughly $161M in TVL and its stablecoin ranking about #40 by market cap, the protocol has real fundamentals but hype has certainly been a fuel source. 🌉⚙️
Yet skeptics aren’t silent. Blockchain analytics firm CoinGlass flagged RIVER as a case study in how funding-rate dynamics can be engineered to attract traders into crowded positions, saying in essence: price suppression plus deeply negative funding can create a self-fulfilling belief in rebounds even if the “bounce” logic is a mirage. 🧨🔍
Bottom line? RIVER’s surge is real but it’s a cocktail of endorsements, market mechanics, and crowd psychology. Whether this momentum has staying power or is just a high-octane pump remains the biggest question in town. 🌊💭
#RiverToken 🌊#CryptoSurge 🚀#MarketMechanics 🧠

1
8
1.6k
Log in to explore more content
Join global crypto users on Binance Square
⚡️ Get latest and useful information about crypto.
💬 Trusted by the world’s largest crypto exchange.
👍 Discover real insights from verified creators.
Email / Phone number
Trending Topics
1
#HuangExitNvidiaStrategyInFocus
326 views
32 Discussing
2
#ChipStocksExtendLossesAfterNvidiaCEOChange
0 views
5 Discussing
3
#AnthropicRejectsIPODelayValuationinQuestion
549,271 views
4,517 Discussing
4
#BitMineReports$6.3BNetLossForFiscal2026
751 views
43 Discussing
5
#CoreWeaveJumps10%On168%RevenueGrowth
109,758 views
1,256 Discussing
6
#ZcashFallsBelow$1000ForFirstTimeSinceSeptember
58,872 views
240 Discussing
7
#MSCIRemovalMayCurbStrategy’sBitcoinBuying
18,614 views
312 Discussing
8
#TradFiForBeginners
493,648 views
3,357 Discussing
9
#CanNvidiaEarningsEaseMarketConcerns?
214,071 views
2,111 Discussing
10
#USJoblessClaimsRise
19.1M views
7,516 Discussing