
Thedy
367 Posts

Thedy
Report
Block User
Crypto lover and Blockchain passionate

#BinanceTurns7
Open Trade
Frequent Trader
5.5 Years
8 Following
44 Followers
75 Liked
1 Badges
Posts
Portfolio
All
Quotes
PINNED
·
--

Article
Top Low Market Cap Cryptocurrencies with High PotentialThe cryptocurrency market continues to offer a plethora of investment opportunities, especially among low market cap tokens. These projects often carry higher risk, but their unique use cases and innovative approaches could potentially lead to significant rewards. Here’s a look at some promising low market cap cryptocurrencies worth considering:
1. Retik (RETIK)
Retik is carving a niche in the real estate sector by introducing blockchain transparency to property transactions. This token aims to streamline and secure real estate deals, making the process more efficient and trustworthy. As the real estate market gradually adopts blockchain solutions, RETIK could see substantial growth.
2. Gala (GALA)
Gala has been making waves in the gaming and entertainment industry. With a strong use case and an active community, GALA is focused on creating decentralized gaming experiences. The project’s dedication to empowering game developers and providing players with true ownership of their in-game assets sets it apart in the crowded crypto space.
3. Sei (SEI)
Known for its applications in decentralized finance (DeFi), Sei offers a robust platform for developing and managing decentralized applications (dApps). The project's emphasis on providing secure, scalable, and user-friendly DeFi solutions positions it as a strong contender in the DeFi sector.
4. Xenon (XNA)
Xenon is dedicated to enhancing security and privacy features in the cryptocurrency world. As concerns about digital privacy grow, Xenon’s focus on providing robust security solutions makes it a noteworthy project. Its potential applications in secure transactions and privacy-focused applications could drive significant interest.
5. Hello (HELLO)
Hello aims to revolutionize social media by integrating blockchain technology to ensure user privacy and data security. With increasing awareness of data privacy issues, Hello's approach to creating a decentralized social media platform could attract users looking for more control over their personal information.
6. Zephyr (ZEPH)
Zephyr is focused on providing fast and secure cross-border transactions. Its practical applications in international finance, coupled with the increasing demand for efficient global payment solutions, make ZEPH a promising project. The token’s ability to facilitate quick and low-cost transactions could drive its adoption.
7. Digital Media Labs (DML)
Digital Media Labs seeks to decentralize content creation and distribution, empowering creators through blockchain technology. By eliminating intermediaries, DML aims to give content creators more control and a fairer share of revenue. This approach could significantly impact the media and entertainment industries.
8.Velas (VLX)
Description: Velas is an EVM blockchain known for its high transaction speed and low costs, supporting decentralized applications.
9. IOTA (IOTA)
Though not as low-cap as some others, IOTA’s innovative Tangle technology offers a unique approach to the Internet of Things (IoT) sector. Its feeless and scalable nature makes it suitable for a wide range of IoT applications. IOTA's potential to disrupt the IoT industry makes it a cryptocurrency to watch.
10. Gemini (GEM)
Gemini is gaining popularity due to its unique features and potential to support various decentralized applications. The token’s versatility and strong community support could contribute to its growth. GEM's ability to facilitate different dApps makes it a valuable addition to the crypto ecosystem.
Conclusion
These cryptocurrencies are noteworthy for their potential driven by unique use cases, technological innovations, and active communities. While investing in low market cap cryptocurrencies can be highly rewarding, it is crucial to conduct thorough research and exercise caution. Always consider the risks and perform due diligence before making investment decisions.
#altcoins #DYOR
Top Low Market Cap Cryptocurrencies with High Potential
The cryptocurrency market continues to offer a plethora of investment opportunities, especially among low market cap tokens. These projects often carry higher risk, but their unique use cases and innovative approaches could potentially lead to significant rewards. Here’s a look at some promising low market cap cryptocurrencies worth considering:
1. Retik (RETIK)
Retik is carving a niche in the real estate sector by introducing blockchain transparency to property transactions. This token aims to streamline and secure real estate deals, making the process more efficient and trustworthy. As the real estate market gradually adopts blockchain solutions, RETIK could see substantial growth.
2. Gala (GALA)
Gala has been making waves in the gaming and entertainment industry. With a strong use case and an active community, GALA is focused on creating decentralized gaming experiences. The project’s dedication to empowering game developers and providing players with true ownership of their in-game assets sets it apart in the crowded crypto space.
3. Sei (SEI)
Known for its applications in decentralized finance (DeFi), Sei offers a robust platform for developing and managing decentralized applications (dApps). The project's emphasis on providing secure, scalable, and user-friendly DeFi solutions positions it as a strong contender in the DeFi sector.
4. Xenon (XNA)
Xenon is dedicated to enhancing security and privacy features in the cryptocurrency world. As concerns about digital privacy grow, Xenon’s focus on providing robust security solutions makes it a noteworthy project. Its potential applications in secure transactions and privacy-focused applications could drive significant interest.
5. Hello (HELLO)
Hello aims to revolutionize social media by integrating blockchain technology to ensure user privacy and data security. With increasing awareness of data privacy issues, Hello's approach to creating a decentralized social media platform could attract users looking for more control over their personal information.
6. Zephyr (ZEPH)
Zephyr is focused on providing fast and secure cross-border transactions. Its practical applications in international finance, coupled with the increasing demand for efficient global payment solutions, make ZEPH a promising project. The token’s ability to facilitate quick and low-cost transactions could drive its adoption.
7. Digital Media Labs (DML)
Digital Media Labs seeks to decentralize content creation and distribution, empowering creators through blockchain technology. By eliminating intermediaries, DML aims to give content creators more control and a fairer share of revenue. This approach could significantly impact the media and entertainment industries.
8.Velas (VLX)
Description: Velas is an EVM blockchain known for its high transaction speed and low costs, supporting decentralized applications.
9. IOTA (IOTA)
Though not as low-cap as some others, IOTA’s innovative Tangle technology offers a unique approach to the Internet of Things (IoT) sector. Its feeless and scalable nature makes it suitable for a wide range of IoT applications. IOTA's potential to disrupt the IoT industry makes it a cryptocurrency to watch.
10. Gemini (GEM)
Gemini is gaining popularity due to its unique features and potential to support various decentralized applications. The token’s versatility and strong community support could contribute to its growth. GEM's ability to facilitate different dApps makes it a valuable addition to the crypto ecosystem.
Conclusion
These cryptocurrencies are noteworthy for their potential driven by unique use cases, technological innovations, and active communities. While investing in low market cap cryptocurrencies can be highly rewarding, it is crucial to conduct thorough research and exercise caution. Always consider the risks and perform due diligence before making investment decisions.
#altcoins #DYOR
1. Retik (RETIK)
Retik is carving a niche in the real estate sector by introducing blockchain transparency to property transactions. This token aims to streamline and secure real estate deals, making the process more efficient and trustworthy. As the real estate market gradually adopts blockchain solutions, RETIK could see substantial growth.
2. Gala (GALA)
Gala has been making waves in the gaming and entertainment industry. With a strong use case and an active community, GALA is focused on creating decentralized gaming experiences. The project’s dedication to empowering game developers and providing players with true ownership of their in-game assets sets it apart in the crowded crypto space.
3. Sei (SEI)
Known for its applications in decentralized finance (DeFi), Sei offers a robust platform for developing and managing decentralized applications (dApps). The project's emphasis on providing secure, scalable, and user-friendly DeFi solutions positions it as a strong contender in the DeFi sector.
4. Xenon (XNA)
Xenon is dedicated to enhancing security and privacy features in the cryptocurrency world. As concerns about digital privacy grow, Xenon’s focus on providing robust security solutions makes it a noteworthy project. Its potential applications in secure transactions and privacy-focused applications could drive significant interest.
5. Hello (HELLO)
Hello aims to revolutionize social media by integrating blockchain technology to ensure user privacy and data security. With increasing awareness of data privacy issues, Hello's approach to creating a decentralized social media platform could attract users looking for more control over their personal information.
6. Zephyr (ZEPH)
Zephyr is focused on providing fast and secure cross-border transactions. Its practical applications in international finance, coupled with the increasing demand for efficient global payment solutions, make ZEPH a promising project. The token’s ability to facilitate quick and low-cost transactions could drive its adoption.
7. Digital Media Labs (DML)
Digital Media Labs seeks to decentralize content creation and distribution, empowering creators through blockchain technology. By eliminating intermediaries, DML aims to give content creators more control and a fairer share of revenue. This approach could significantly impact the media and entertainment industries.
8.Velas (VLX)
Description: Velas is an EVM blockchain known for its high transaction speed and low costs, supporting decentralized applications.
9. IOTA (IOTA)
Though not as low-cap as some others, IOTA’s innovative Tangle technology offers a unique approach to the Internet of Things (IoT) sector. Its feeless and scalable nature makes it suitable for a wide range of IoT applications. IOTA's potential to disrupt the IoT industry makes it a cryptocurrency to watch.
10. Gemini (GEM)
Gemini is gaining popularity due to its unique features and potential to support various decentralized applications. The token’s versatility and strong community support could contribute to its growth. GEM's ability to facilitate different dApps makes it a valuable addition to the crypto ecosystem.
Conclusion
These cryptocurrencies are noteworthy for their potential driven by unique use cases, technological innovations, and active communities. While investing in low market cap cryptocurrencies can be highly rewarding, it is crucial to conduct thorough research and exercise caution. Always consider the risks and perform due diligence before making investment decisions.
#altcoins #DYOR
11
2.9k
·
--
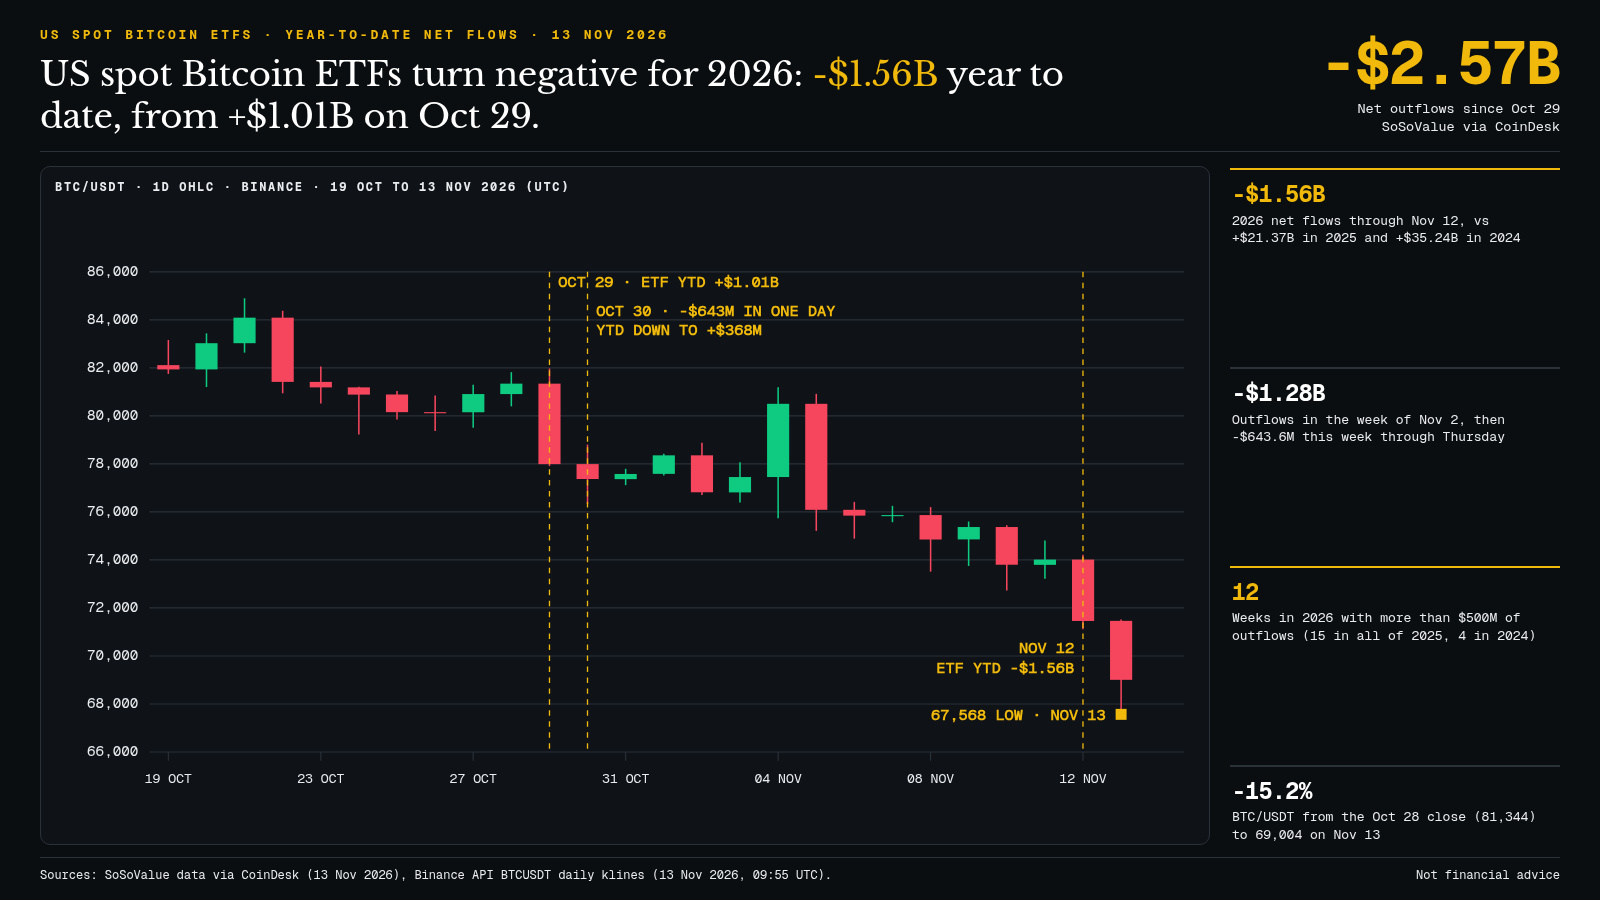
U.S. spot bitcoin ETFs are now seeing net outflows in 2026: -$1.56 billion since January 1, according to SoSoValue data analyzed by CoinDesk. Two weeks ago, the figure was still +$1.01 billion.
How $2.57 billion disappeared in two weeks:
10/29: Year-to-date flows stand at +$1.01 billion. The $BTC closes the previous day at $81,344 on Binance.
10/30: $643.3 million flows out in a single day. The year's balance falls to +$368 million.
Week of 11/2: -$1.28 billion. The market absorbs the blow, and BTC slides toward $75,000.
Week of 11/9: another -$643.6 million through Thursday. The year-to-date balance turns negative, and BTC drops below $70,000, hitting a low of $67,568 this morning on Binance.
The contrast with previous years is stark. ETFs attracted $21.37 billion in net inflows in 2025 and $35.24 billion in 2024. In 2026, there have already been 12 weeks with more than $500 million in outflows, compared with 15 in all of 2025 and 4 in 2024. Four more by the end of December would set a record.
My take: the institutional buyer that had been absorbing every dip for two years has turned into a seller, and spot BTC is down 15% since the 10/28 close. As long as flows remain in the red, every bounce risks becoming an exit opportunity. A return to net inflows over two or three sessions, ideally alongside a softer U.S. PPI, due today, would be the first real sign of stabilization. Without that, the $67,500 zone remains fragile.
Do you think ETFs are driving the price of bitcoin today, or are they just following the market?
#Bitcoin #ETF
Sources: SoSoValue via CoinDesk (11/13), Binance BTCUSDT daily candlestick API (11/13, 09:55 UTC). Not financial advice.
U.S. spot bitcoin ETFs are now seeing net outflows in 2026: -$1.56 billion since January 1, according to SoSoValue data analyzed by CoinDesk. Two weeks ago, the figure was still +$1.01 billion.
How $2.57 billion disappeared in two weeks:
10/29: Year-to-date flows stand at +$1.01 billion. The $BTC closes the previous day at $81,344 on Binance.
10/30: $643.3 million flows out in a single day. The year's balance falls to +$368 million.
Week of 11/2: -$1.28 billion. The market absorbs the blow, and BTC slides toward $75,000.
Week of 11/9: another -$643.6 million through Thursday. The year-to-date balance turns negative, and BTC drops below $70,000, hitting a low of $67,568 this morning on Binance.
The contrast with previous years is stark. ETFs attracted $21.37 billion in net inflows in 2025 and $35.24 billion in 2024. In 2026, there have already been 12 weeks with more than $500 million in outflows, compared with 15 in all of 2025 and 4 in 2024. Four more by the end of December would set a record.
My take: the institutional buyer that had been absorbing every dip for two years has turned into a seller, and spot BTC is down 15% since the 10/28 close. As long as flows remain in the red, every bounce risks becoming an exit opportunity. A return to net inflows over two or three sessions, ideally alongside a softer U.S. PPI, due today, would be the first real sign of stabilization. Without that, the $67,500 zone remains fragile.
Do you think ETFs are driving the price of bitcoin today, or are they just following the market?
#Bitcoin #ETF
Sources: SoSoValue via CoinDesk (11/13), Binance BTCUSDT daily candlestick API (11/13, 09:55 UTC). Not financial advice.
How $2.57 billion disappeared in two weeks:
10/29: Year-to-date flows stand at +$1.01 billion. The $BTC closes the previous day at $81,344 on Binance.
10/30: $643.3 million flows out in a single day. The year's balance falls to +$368 million.
Week of 11/2: -$1.28 billion. The market absorbs the blow, and BTC slides toward $75,000.
Week of 11/9: another -$643.6 million through Thursday. The year-to-date balance turns negative, and BTC drops below $70,000, hitting a low of $67,568 this morning on Binance.
The contrast with previous years is stark. ETFs attracted $21.37 billion in net inflows in 2025 and $35.24 billion in 2024. In 2026, there have already been 12 weeks with more than $500 million in outflows, compared with 15 in all of 2025 and 4 in 2024. Four more by the end of December would set a record.
My take: the institutional buyer that had been absorbing every dip for two years has turned into a seller, and spot BTC is down 15% since the 10/28 close. As long as flows remain in the red, every bounce risks becoming an exit opportunity. A return to net inflows over two or three sessions, ideally alongside a softer U.S. PPI, due today, would be the first real sign of stabilization. Without that, the $67,500 zone remains fragile.
Do you think ETFs are driving the price of bitcoin today, or are they just following the market?
#Bitcoin #ETF
Sources: SoSoValue via CoinDesk (11/13), Binance BTCUSDT daily candlestick API (11/13, 09:55 UTC). Not financial advice.
73
·
--
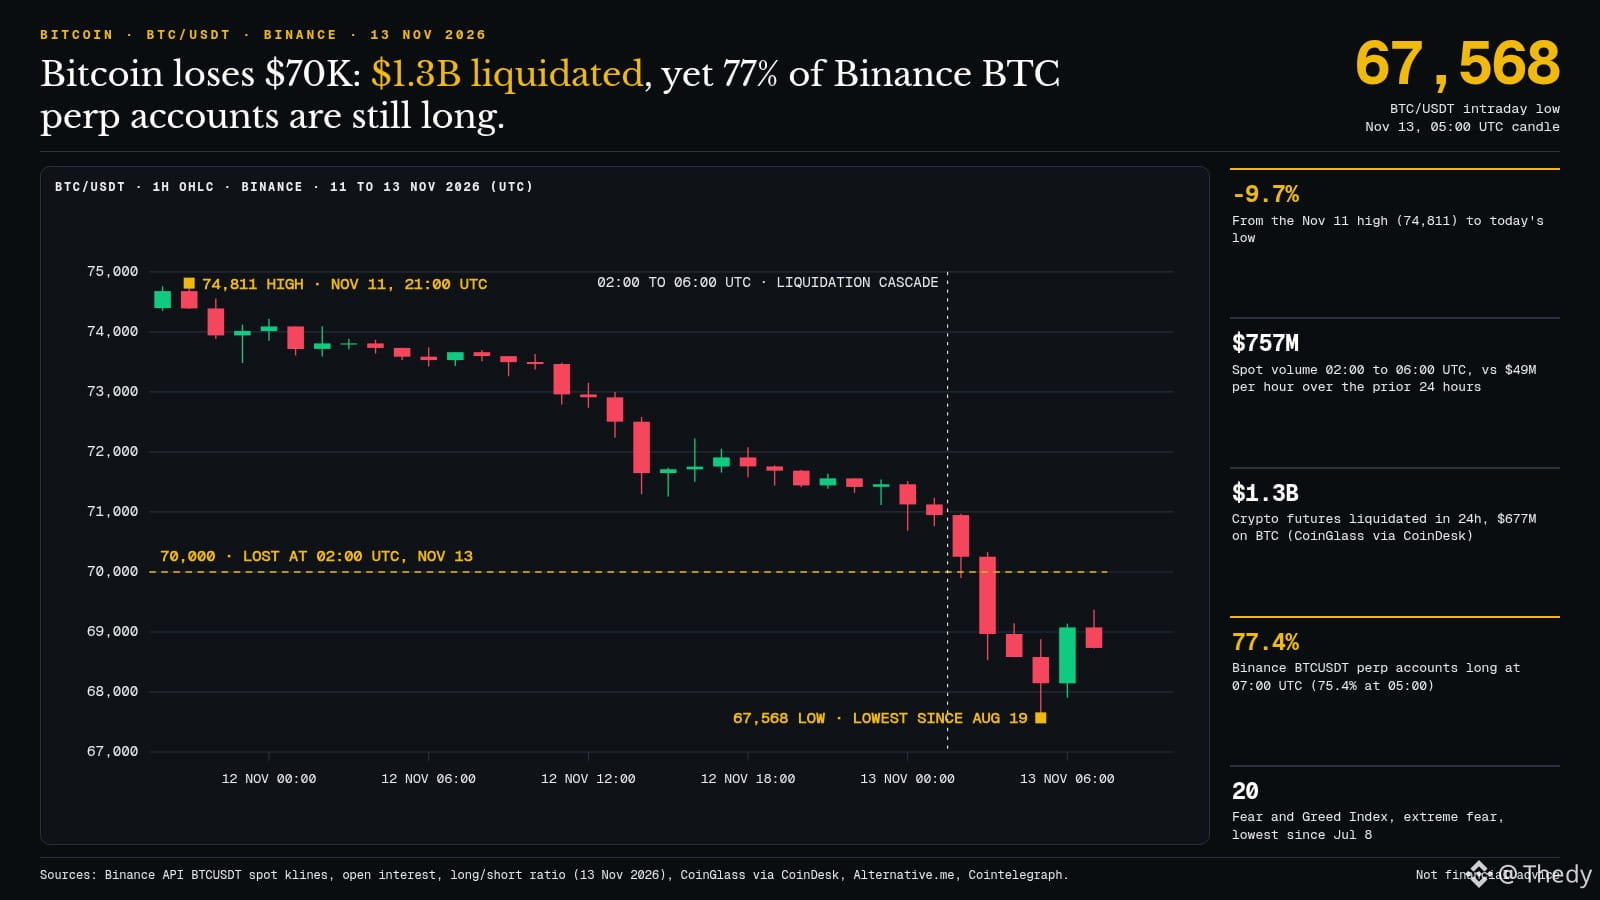
The $BTC a lost $70,000 overnight: it hit a low of $67,568 on Binance at 05:00 UTC, a level not seen since August 19.
Everywhere you look, people say this flush “cleared out leverage.” The numbers tell a different story.
Yes, the purge was violent. More than $1.3B in futures positions were liquidated in 24 hours, including $677M in Bitcoin, and nearly $500M at the exact moment $70,000 gave way (CoinGlass via CoinDesk). On spot markets, the BTC/USDT pair traded around $757M between 02:00 and 06:00 UTC, compared with an average of $49M per hour over the previous 24 hours.
But on Binance perpetuals, BTCUSDT open interest fell by only around 4% ($7.28B on 11/12 at 14:00 UTC, $6.99B at 05:00 UTC). And the share of accounts buying increased during the drop: 75.4% at 05:00 UTC, 77.4% at 07:00 UTC. Retail is buying the falling knife.
Meanwhile, the broader picture isn’t improving. The Fear and Greed Index is at 20, its lowest since July 8 (Alternative.me, Cointelegraph). The dollar is at its highest since April 2025, a Fed rate hike in December is largely priced in, and U.S. PPI is expected today. Since the November 11 high of $74,811, the decline has reached 9.7%.
My take: as long as accounts remain this heavily long, there’s still fuel for a second wick down. A close back above $70,000 alongside softer PPI would reduce that risk. On the other hand, losing $67,568 would open the way toward the August 19 low, around $64,166. $ETH, meanwhile, remains below $2,000.
Are you buying this dip, or waiting until the longs are really flushed out?
#Bitcoin #Binance
Sources: Binance BTCUSDT API (spot, open interest, long/short ratio, 11/13 07:45 UTC), CoinGlass via CoinDesk, Alternative.me, Cointelegraph. Not financial advice.
The $BTC a lost $70,000 overnight: it hit a low of $67,568 on Binance at 05:00 UTC, a level not seen since August 19.
Everywhere you look, people say this flush “cleared out leverage.” The numbers tell a different story.
Yes, the purge was violent. More than $1.3B in futures positions were liquidated in 24 hours, including $677M in Bitcoin, and nearly $500M at the exact moment $70,000 gave way (CoinGlass via CoinDesk). On spot markets, the BTC/USDT pair traded around $757M between 02:00 and 06:00 UTC, compared with an average of $49M per hour over the previous 24 hours.
But on Binance perpetuals, BTCUSDT open interest fell by only around 4% ($7.28B on 11/12 at 14:00 UTC, $6.99B at 05:00 UTC). And the share of accounts buying increased during the drop: 75.4% at 05:00 UTC, 77.4% at 07:00 UTC. Retail is buying the falling knife.
Meanwhile, the broader picture isn’t improving. The Fear and Greed Index is at 20, its lowest since July 8 (Alternative.me, Cointelegraph). The dollar is at its highest since April 2025, a Fed rate hike in December is largely priced in, and U.S. PPI is expected today. Since the November 11 high of $74,811, the decline has reached 9.7%.
My take: as long as accounts remain this heavily long, there’s still fuel for a second wick down. A close back above $70,000 alongside softer PPI would reduce that risk. On the other hand, losing $67,568 would open the way toward the August 19 low, around $64,166. $ETH , meanwhile, remains below $2,000.
Are you buying this dip, or waiting until the longs are really flushed out?
#Bitcoin #Binance
Sources: Binance BTCUSDT API (spot, open interest, long/short ratio, 11/13 07:45 UTC), CoinGlass via CoinDesk, Alternative.me, Cointelegraph. Not financial advice.
Everywhere you look, people say this flush “cleared out leverage.” The numbers tell a different story.
Yes, the purge was violent. More than $1.3B in futures positions were liquidated in 24 hours, including $677M in Bitcoin, and nearly $500M at the exact moment $70,000 gave way (CoinGlass via CoinDesk). On spot markets, the BTC/USDT pair traded around $757M between 02:00 and 06:00 UTC, compared with an average of $49M per hour over the previous 24 hours.
But on Binance perpetuals, BTCUSDT open interest fell by only around 4% ($7.28B on 11/12 at 14:00 UTC, $6.99B at 05:00 UTC). And the share of accounts buying increased during the drop: 75.4% at 05:00 UTC, 77.4% at 07:00 UTC. Retail is buying the falling knife.
Meanwhile, the broader picture isn’t improving. The Fear and Greed Index is at 20, its lowest since July 8 (Alternative.me, Cointelegraph). The dollar is at its highest since April 2025, a Fed rate hike in December is largely priced in, and U.S. PPI is expected today. Since the November 11 high of $74,811, the decline has reached 9.7%.
My take: as long as accounts remain this heavily long, there’s still fuel for a second wick down. A close back above $70,000 alongside softer PPI would reduce that risk. On the other hand, losing $67,568 would open the way toward the August 19 low, around $64,166. $ETH , meanwhile, remains below $2,000.
Are you buying this dip, or waiting until the longs are really flushed out?
#Bitcoin #Binance
Sources: Binance BTCUSDT API (spot, open interest, long/short ratio, 11/13 07:45 UTC), CoinGlass via CoinDesk, Alternative.me, Cointelegraph. Not financial advice.
101
·
--
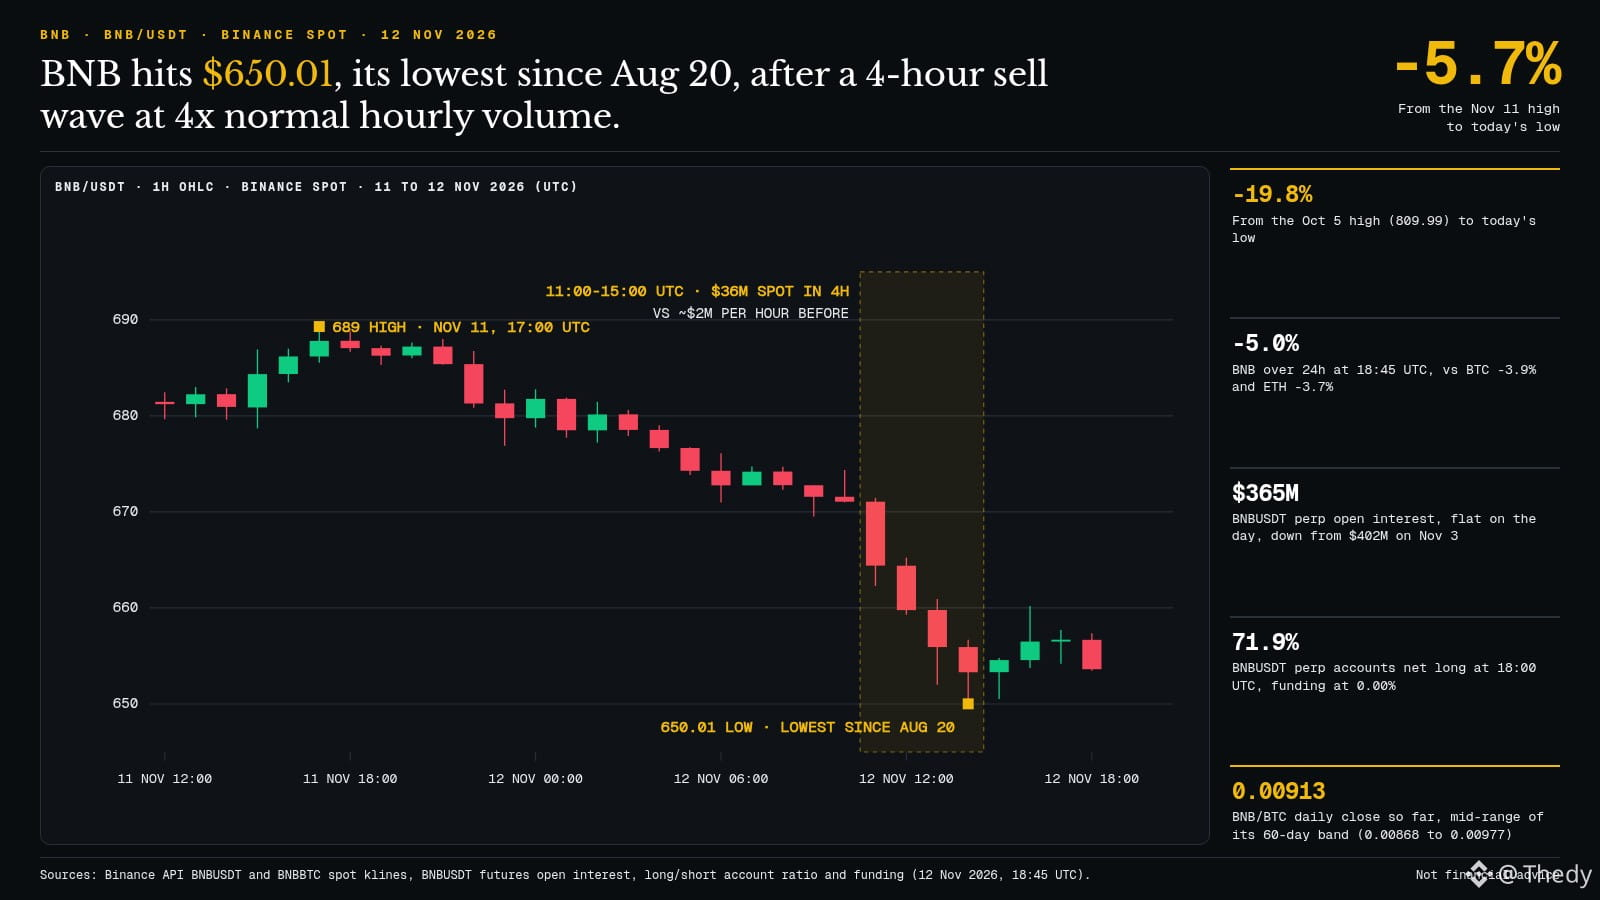
The $BNB a touched $650.01 on Binance this Thursday, 12/11, its lowest since August 20. And the decline didn't stretch across the day: most of it played out over four hours.
Between 11:00 and 15:00 UTC, around $36M worth of BNB changed hands on the BNB/USDT spot market, or roughly $9M per hour versus an average of $2.2M over the previous 23 hours.
Since the peak of $689.30 on 11/11 at 17:00 UTC, the drop has reached 5.7%. From the October 5 high ($809.99), it's down 19.8%.
Over 24 hours, BNB is down 5% as of around 18:45 UTC, more than the $BTC (-3.9%) and the $ETH (-3.7%).
On the derivatives side, there's no sign of panic: open interest in the BNBUSDT perpetual contract remains around $365M (versus $402M on 3/11), funding is at 0.00%, and 71.9% of accounts were still long at 18:00 UTC.
My take: this is spot selling driven by the broader market (hot US inflation, the fifth day of BTC ETF outflows, tech under pressure alongside Nvidia), not an issue specific to BNB. Holding the $650 zone at the close would leave the door open to a return toward $670–680. Losing it would put the August 20 low, around $622, back in play.
Do you see $650 as a buying zone or a stopping point before $622?
#BNB #Binance
Sources: Binance API for BNBUSDT and BNBBTC (spot, open interest, long/short ratio, funding, 12/11 18:45 UTC), CoinDesk and CoinMarketCap for the macro context. Not financial advice.
The $BNB a touched $650.01 on Binance this Thursday, 12/11, its lowest since August 20. And the decline didn't stretch across the day: most of it played out over four hours.
Between 11:00 and 15:00 UTC, around $36M worth of BNB changed hands on the BNB/USDT spot market, or roughly $9M per hour versus an average of $2.2M over the previous 23 hours.
Since the peak of $689.30 on 11/11 at 17:00 UTC, the drop has reached 5.7%. From the October 5 high ($809.99), it's down 19.8%.
Over 24 hours, BNB is down 5% as of around 18:45 UTC, more than the $BTC (-3.9%) and the $ETH (-3.7%).
On the derivatives side, there's no sign of panic: open interest in the BNBUSDT perpetual contract remains around $365M (versus $402M on 3/11), funding is at 0.00%, and 71.9% of accounts were still long at 18:00 UTC.
My take: this is spot selling driven by the broader market (hot US inflation, the fifth day of BTC ETF outflows, tech under pressure alongside Nvidia), not an issue specific to BNB. Holding the $650 zone at the close would leave the door open to a return toward $670–680. Losing it would put the August 20 low, around $622, back in play.
Do you see $650 as a buying zone or a stopping point before $622?
#BNB #Binance
Sources: Binance API for BNBUSDT and BNBBTC (spot, open interest, long/short ratio, funding, 12/11 18:45 UTC), CoinDesk and CoinMarketCap for the macro context. Not financial advice.
Between 11:00 and 15:00 UTC, around $36M worth of BNB changed hands on the BNB/USDT spot market, or roughly $9M per hour versus an average of $2.2M over the previous 23 hours.
Since the peak of $689.30 on 11/11 at 17:00 UTC, the drop has reached 5.7%. From the October 5 high ($809.99), it's down 19.8%.
Over 24 hours, BNB is down 5% as of around 18:45 UTC, more than the $BTC (-3.9%) and the $ETH (-3.7%).
On the derivatives side, there's no sign of panic: open interest in the BNBUSDT perpetual contract remains around $365M (versus $402M on 3/11), funding is at 0.00%, and 71.9% of accounts were still long at 18:00 UTC.
My take: this is spot selling driven by the broader market (hot US inflation, the fifth day of BTC ETF outflows, tech under pressure alongside Nvidia), not an issue specific to BNB. Holding the $650 zone at the close would leave the door open to a return toward $670–680. Losing it would put the August 20 low, around $622, back in play.
Do you see $650 as a buying zone or a stopping point before $622?
#BNB #Binance
Sources: Binance API for BNBUSDT and BNBBTC (spot, open interest, long/short ratio, funding, 12/11 18:45 UTC), CoinDesk and CoinMarketCap for the macro context. Not financial advice.
10
·
--
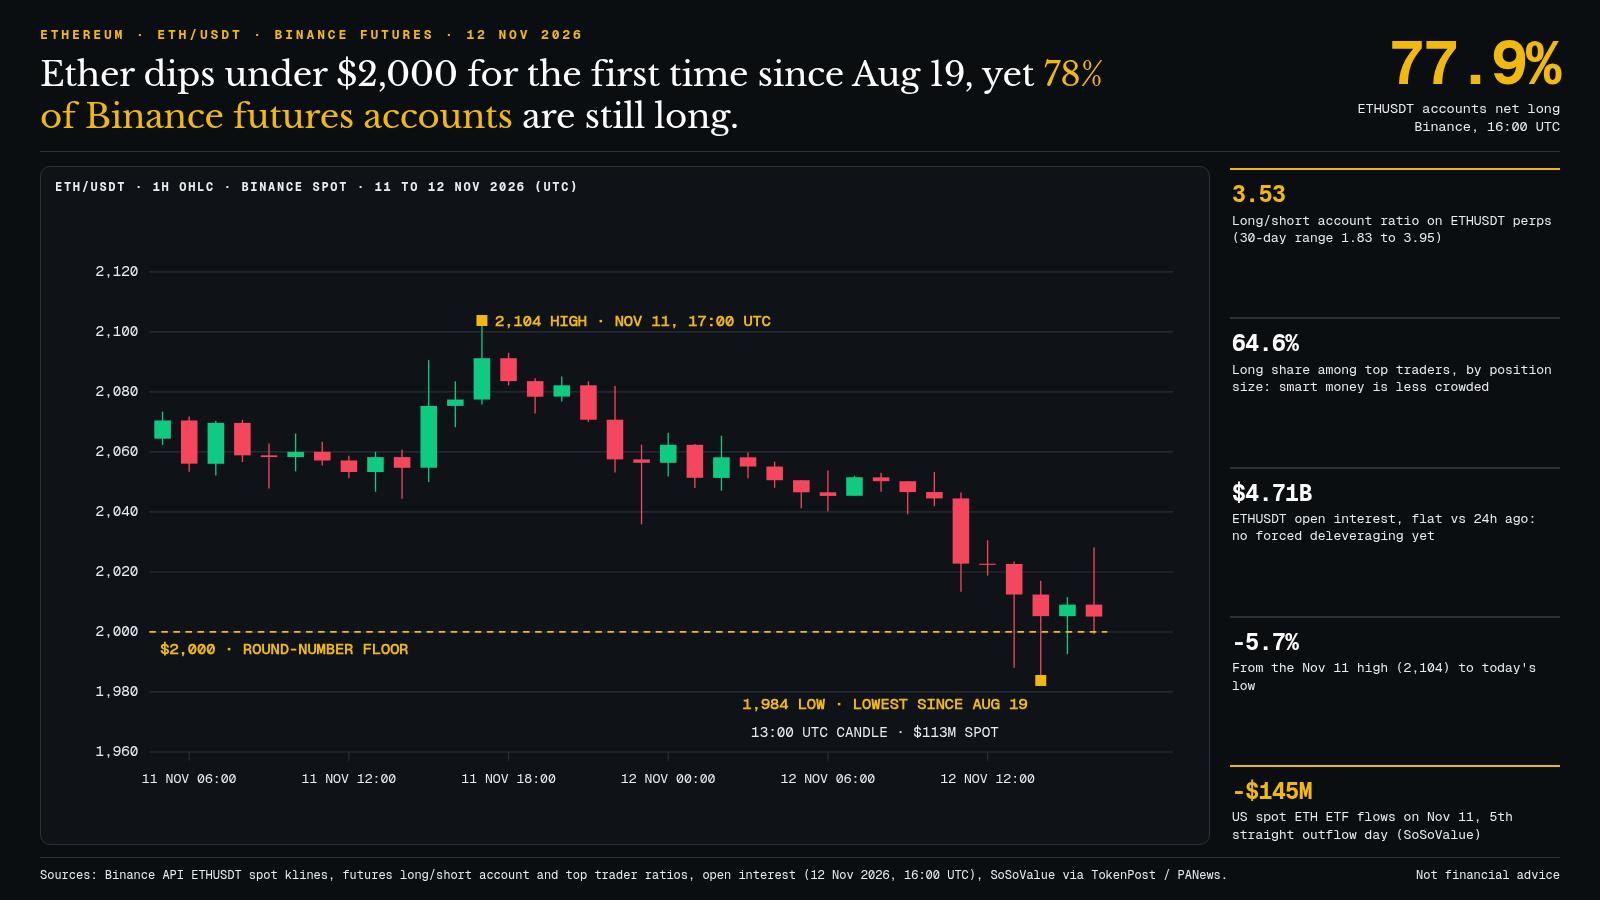
The $ETH fell below $2,000 today for the first time since August 19. So, have traders capitulated? Binance data suggests otherwise.
The day's low touched $1,983.82 on Binance during the 14:00 UTC candle, following an hour from 13:00 UTC with about $113M in spot volume (versus $6–11M per hour this morning). Since the November 11 high of $2,103.78 at 17:00 UTC, the decline has reached 5.7%.
Yet at 16:00 UTC, 77.9% of accounts on the ETHUSDT perpetual contract were long, for a long/short ratio of 3.53. Over 30 days, this ratio has ranged between 1.83 and 3.95: so we're near the top of the range, in the middle of a decline. Open interest remains steady at around $4.71B over 24 hours, and funding is still slightly positive. No one has been forced out yet.
One detail that matters: among large accounts (top traders, measured by position size), the share of longs drops to 64.6%. Smaller accounts are buying the dip; larger ones are much less exposed. On the institutional side, US spot ETH ETFs lost $145M on November 11, their fifth consecutive day of outflows (SoSoValue), as the $BTC slides toward $71,500.
My take: a market falling while so many longs remain open has rarely finished flushing them out. If $2,000 holds at the close and ETFs return to inflows, those buyers will have been right. A daily close below $1,980, on the other hand, could trigger a cascade of liquidations, with August's $1,900 area as the next reference point.
Are you among the 78% holding their long, or are you waiting for the flush?
#Ethereum #Binance
Sources: Binance ETHUSDT API (spot, long/short ratios, open interest, Nov. 12, 16:00 UTC), SoSoValue via TokenPost and PANews. Not financial advice.
The $ETH fell below $2,000 today for the first time since August 19. So, have traders capitulated? Binance data suggests otherwise.
The day's low touched $1,983.82 on Binance during the 14:00 UTC candle, following an hour from 13:00 UTC with about $113M in spot volume (versus $6–11M per hour this morning). Since the November 11 high of $2,103.78 at 17:00 UTC, the decline has reached 5.7%.
Yet at 16:00 UTC, 77.9% of accounts on the ETHUSDT perpetual contract were long, for a long/short ratio of 3.53. Over 30 days, this ratio has ranged between 1.83 and 3.95: so we're near the top of the range, in the middle of a decline. Open interest remains steady at around $4.71B over 24 hours, and funding is still slightly positive. No one has been forced out yet.
One detail that matters: among large accounts (top traders, measured by position size), the share of longs drops to 64.6%. Smaller accounts are buying the dip; larger ones are much less exposed. On the institutional side, US spot ETH ETFs lost $145M on November 11, their fifth consecutive day of outflows (SoSoValue), as the $BTC slides toward $71,500.
My take: a market falling while so many longs remain open has rarely finished flushing them out. If $2,000 holds at the close and ETFs return to inflows, those buyers will have been right. A daily close below $1,980, on the other hand, could trigger a cascade of liquidations, with August's $1,900 area as the next reference point.
Are you among the 78% holding their long, or are you waiting for the flush?
#Ethereum #Binance
Sources: Binance ETHUSDT API (spot, long/short ratios, open interest, Nov. 12, 16:00 UTC), SoSoValue via TokenPost and PANews. Not financial advice.
The day's low touched $1,983.82 on Binance during the 14:00 UTC candle, following an hour from 13:00 UTC with about $113M in spot volume (versus $6–11M per hour this morning). Since the November 11 high of $2,103.78 at 17:00 UTC, the decline has reached 5.7%.
Yet at 16:00 UTC, 77.9% of accounts on the ETHUSDT perpetual contract were long, for a long/short ratio of 3.53. Over 30 days, this ratio has ranged between 1.83 and 3.95: so we're near the top of the range, in the middle of a decline. Open interest remains steady at around $4.71B over 24 hours, and funding is still slightly positive. No one has been forced out yet.
One detail that matters: among large accounts (top traders, measured by position size), the share of longs drops to 64.6%. Smaller accounts are buying the dip; larger ones are much less exposed. On the institutional side, US spot ETH ETFs lost $145M on November 11, their fifth consecutive day of outflows (SoSoValue), as the $BTC slides toward $71,500.
My take: a market falling while so many longs remain open has rarely finished flushing them out. If $2,000 holds at the close and ETFs return to inflows, those buyers will have been right. A daily close below $1,980, on the other hand, could trigger a cascade of liquidations, with August's $1,900 area as the next reference point.
Are you among the 78% holding their long, or are you waiting for the flush?
#Ethereum #Binance
Sources: Binance ETHUSDT API (spot, long/short ratios, open interest, Nov. 12, 16:00 UTC), SoSoValue via TokenPost and PANews. Not financial advice.
76
·
--
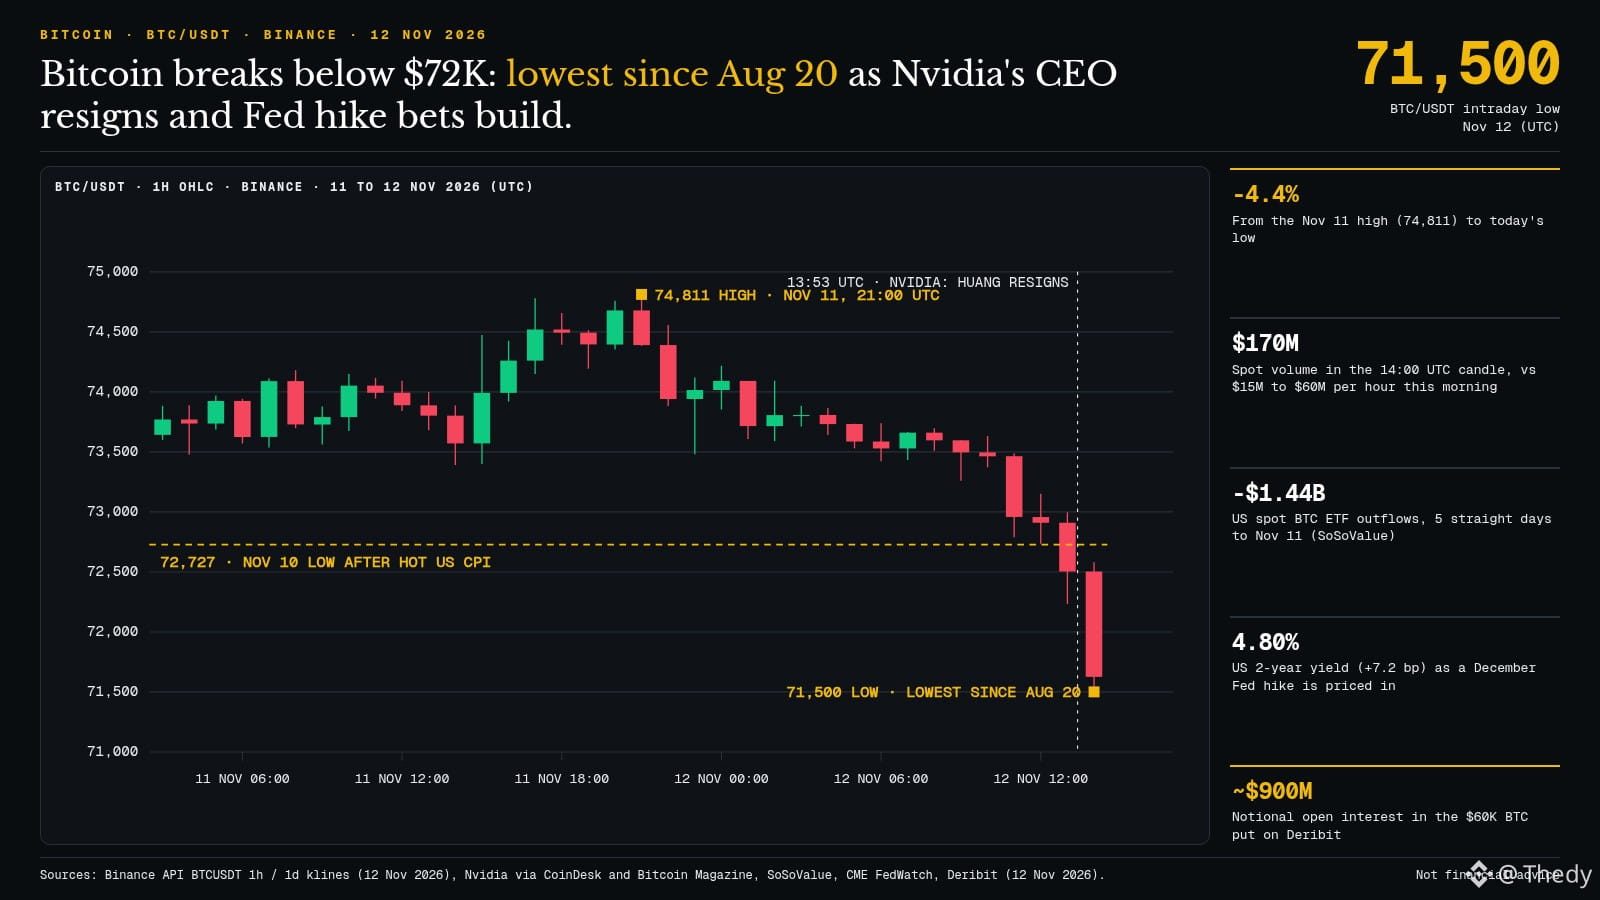
The $BTC fell below $72,000 this afternoon, hitting a low of $71,500 on Binance—the lowest level since August 20.
The trigger came from Wall Street. At 13:53 UTC, Nvidia confirmed the immediate resignation of Jensen Huang, CEO and board member. CFO Colette Kress is serving as interim CEO, Harvey Jones becomes board chair, and the November 17 earnings date remains unchanged (CoinDesk, Bitcoin Magazine).
The chart shows a clear breakdown. The $72,727 floor set on November 10 after hotter-than-expected US inflation gave way, and the 14:00 UTC candle saw about $170 million in spot volume, compared with $15 million to $60 million per hour this morning. Since the November 11 peak of $74,811 at 21:00 UTC, the decline has reached 4.4%.
Nvidia isn't the only factor. The US 2-year yield climbed to 4.80% (+7.2 bps), the market considers a Fed rate hike in December a done deal (CME FedWatch), and spot bitcoin ETFs have lost $1.44 billion over five sessions (SoSoValue). On Deribit, the $60,000 put has nearly $900 million in open interest.
My take: until $BTC reclaims $72,727, that level becomes resistance, and the market remains on edge ahead of Friday's PPI release. A move back above it, alongside ETF flows turning positive, would make this just a panic wick. A rejection, on the other hand, would open up the $70,000 zone, while $ETH is already struggling around $2,000.
Do you read this move as Nvidia-related capitulation, or as the start of a genuine repricing of interest rates?
#Bitcoin #Nvidia
Sources: Binance BTCUSDT API (November 12), Nvidia via CoinDesk and Bitcoin Magazine, SoSoValue, CME FedWatch, Deribit. Not financial advice.
The $BTC fell below $72,000 this afternoon, hitting a low of $71,500 on Binance—the lowest level since August 20.
The trigger came from Wall Street. At 13:53 UTC, Nvidia confirmed the immediate resignation of Jensen Huang, CEO and board member. CFO Colette Kress is serving as interim CEO, Harvey Jones becomes board chair, and the November 17 earnings date remains unchanged (CoinDesk, Bitcoin Magazine).
The chart shows a clear breakdown. The $72,727 floor set on November 10 after hotter-than-expected US inflation gave way, and the 14:00 UTC candle saw about $170 million in spot volume, compared with $15 million to $60 million per hour this morning. Since the November 11 peak of $74,811 at 21:00 UTC, the decline has reached 4.4%.
Nvidia isn't the only factor. The US 2-year yield climbed to 4.80% (+7.2 bps), the market considers a Fed rate hike in December a done deal (CME FedWatch), and spot bitcoin ETFs have lost $1.44 billion over five sessions (SoSoValue). On Deribit, the $60,000 put has nearly $900 million in open interest.
My take: until $BTC reclaims $72,727, that level becomes resistance, and the market remains on edge ahead of Friday's PPI release. A move back above it, alongside ETF flows turning positive, would make this just a panic wick. A rejection, on the other hand, would open up the $70,000 zone, while $ETH is already struggling around $2,000.
Do you read this move as Nvidia-related capitulation, or as the start of a genuine repricing of interest rates?
#Bitcoin #Nvidia
Sources: Binance BTCUSDT API (November 12), Nvidia via CoinDesk and Bitcoin Magazine, SoSoValue, CME FedWatch, Deribit. Not financial advice.
The trigger came from Wall Street. At 13:53 UTC, Nvidia confirmed the immediate resignation of Jensen Huang, CEO and board member. CFO Colette Kress is serving as interim CEO, Harvey Jones becomes board chair, and the November 17 earnings date remains unchanged (CoinDesk, Bitcoin Magazine).
The chart shows a clear breakdown. The $72,727 floor set on November 10 after hotter-than-expected US inflation gave way, and the 14:00 UTC candle saw about $170 million in spot volume, compared with $15 million to $60 million per hour this morning. Since the November 11 peak of $74,811 at 21:00 UTC, the decline has reached 4.4%.
Nvidia isn't the only factor. The US 2-year yield climbed to 4.80% (+7.2 bps), the market considers a Fed rate hike in December a done deal (CME FedWatch), and spot bitcoin ETFs have lost $1.44 billion over five sessions (SoSoValue). On Deribit, the $60,000 put has nearly $900 million in open interest.
My take: until $BTC reclaims $72,727, that level becomes resistance, and the market remains on edge ahead of Friday's PPI release. A move back above it, alongside ETF flows turning positive, would make this just a panic wick. A rejection, on the other hand, would open up the $70,000 zone, while $ETH is already struggling around $2,000.
Do you read this move as Nvidia-related capitulation, or as the start of a genuine repricing of interest rates?
#Bitcoin #Nvidia
Sources: Binance BTCUSDT API (November 12), Nvidia via CoinDesk and Bitcoin Magazine, SoSoValue, CME FedWatch, Deribit. Not financial advice.
90
·
--
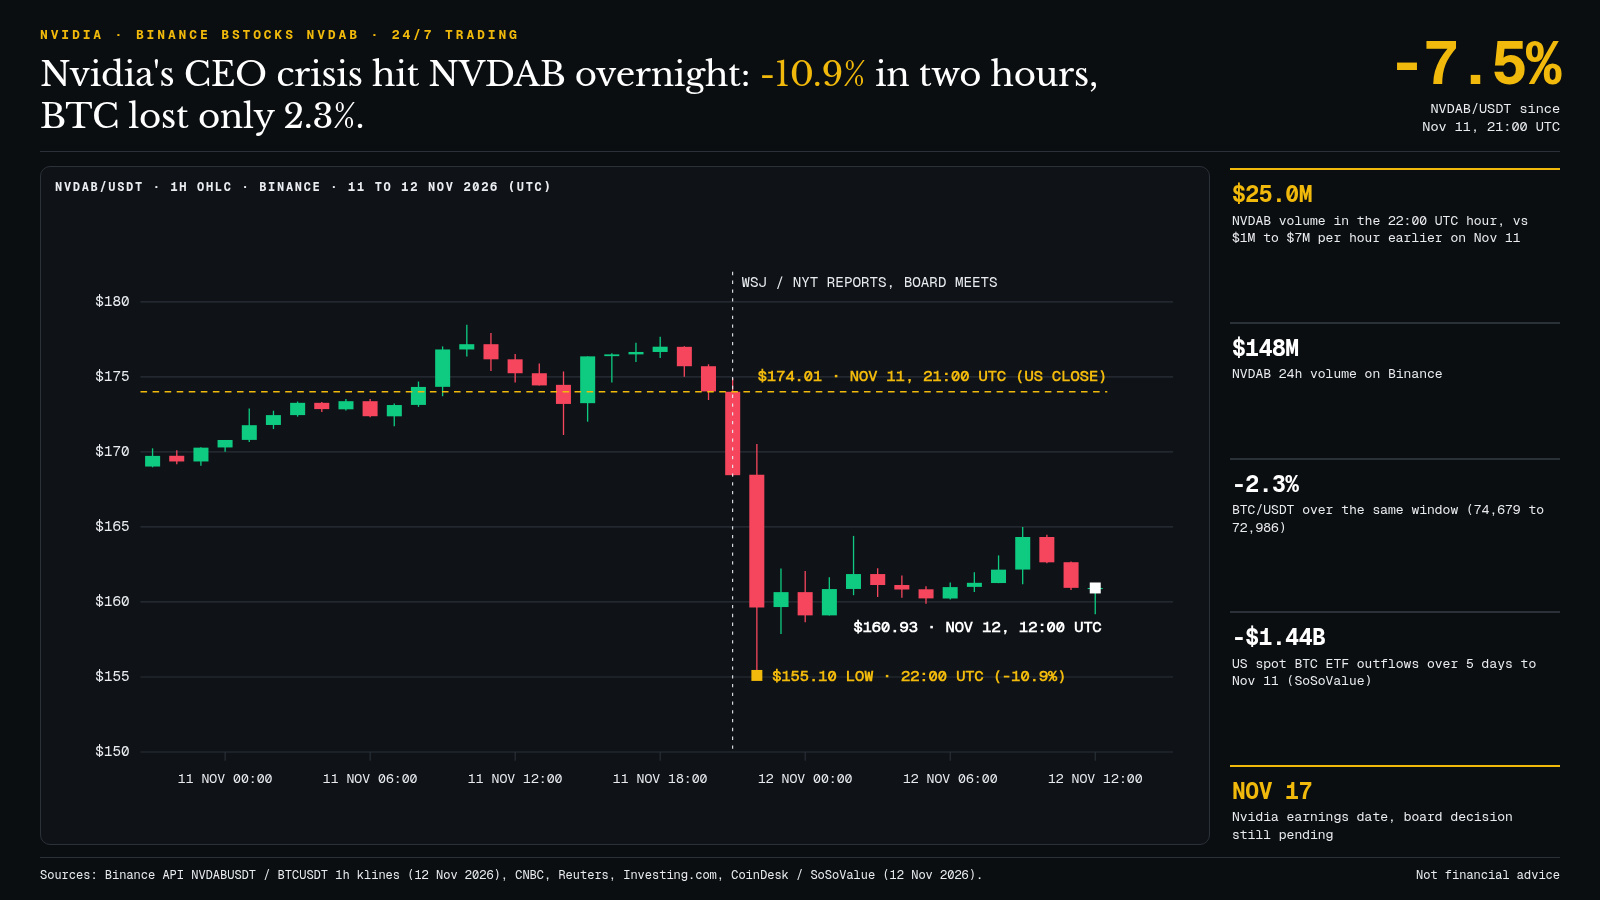
Nvidia in the midst of a governance crisis: NVDAB, Binance’s 24/7-traded bStocks tokenized stock, plunged 10.9% in two hours overnight. Over the same period, $BTC lost just 2.3%.
The idea circulating since this morning: “if Nvidia plunges, AI takes crypto down with it.” Binance’s data tells a different story.
First, the context. After the US market close on 11/11, the WSJ and NYT reported that Nvidia’s board of directors was meeting to decide Jensen Huang’s future (CNBC, Reuters). No decision has been announced so far.
The numbers (Binance API, 1-hour UTC candles):
- NVDAB at $174.01 at 21:00 UTC, hitting a low of $155.10 in the 22:00 candle, around $160.9 at 12:00 UTC, down 7.5%
- $25M traded in the 22:00 hour alone, compared with around $1M to $7M per hour earlier on 11/11
- $BTC over the same period: 74,679 → 72,986
Another sign that the sell-off is targeting Nvidia, not the whole sector: AMD (+3.9%) and Broadcom (+3%) were up in premarket trading, according to CNBC.
In my view, what’s really weighing on BTC is elsewhere: the fifth day of outflows from spot ETFs, totaling $1.44B since 5/11 (SoSoValue via CoinDesk). BTC’s drop actually came around 11:00 UTC, well after the Nvidia shock.
Two possible scenarios from here. If the board keeps Huang, NVDAB could recover some of its losses, back toward $165–170. If his departure is confirmed, several analysts cited by CNBC see a further drop of up to 20%, and then a real Nasdaq risk-off move could hit $BTC and $ETH. Next milestone: Nvidia earnings on 17/11.
Are you already following tokenized stocks to keep up with US news overnight, or is it still just noise to you?
#Nvidia #bStocks
Sources: Binance API NVDABUSDT/BTCUSDT (12/11), CNBC, Reuters, Investing.com, CoinDesk/SoSoValue. Not financial advice.
Nvidia in the midst of a governance crisis: NVDAB, Binance’s 24/7-traded bStocks tokenized stock, plunged 10.9% in two hours overnight. Over the same period, $BTC lost just 2.3%.
The idea circulating since this morning: “if Nvidia plunges, AI takes crypto down with it.” Binance’s data tells a different story.
First, the context. After the US market close on 11/11, the WSJ and NYT reported that Nvidia’s board of directors was meeting to decide Jensen Huang’s future (CNBC, Reuters). No decision has been announced so far.
The numbers (Binance API, 1-hour UTC candles):
- NVDAB at $174.01 at 21:00 UTC, hitting a low of $155.10 in the 22:00 candle, around $160.9 at 12:00 UTC, down 7.5%
- $25M traded in the 22:00 hour alone, compared with around $1M to $7M per hour earlier on 11/11
- $BTC over the same period: 74,679 → 72,986
Another sign that the sell-off is targeting Nvidia, not the whole sector: AMD (+3.9%) and Broadcom (+3%) were up in premarket trading, according to CNBC.
In my view, what’s really weighing on BTC is elsewhere: the fifth day of outflows from spot ETFs, totaling $1.44B since 5/11 (SoSoValue via CoinDesk). BTC’s drop actually came around 11:00 UTC, well after the Nvidia shock.
Two possible scenarios from here. If the board keeps Huang, NVDAB could recover some of its losses, back toward $165–170. If his departure is confirmed, several analysts cited by CNBC see a further drop of up to 20%, and then a real Nasdaq risk-off move could hit $BTC and $ETH . Next milestone: Nvidia earnings on 17/11.
Are you already following tokenized stocks to keep up with US news overnight, or is it still just noise to you?
#Nvidia #bStocks
Sources: Binance API NVDABUSDT/BTCUSDT (12/11), CNBC, Reuters, Investing.com, CoinDesk/SoSoValue. Not financial advice.
The idea circulating since this morning: “if Nvidia plunges, AI takes crypto down with it.” Binance’s data tells a different story.
First, the context. After the US market close on 11/11, the WSJ and NYT reported that Nvidia’s board of directors was meeting to decide Jensen Huang’s future (CNBC, Reuters). No decision has been announced so far.
The numbers (Binance API, 1-hour UTC candles):
- NVDAB at $174.01 at 21:00 UTC, hitting a low of $155.10 in the 22:00 candle, around $160.9 at 12:00 UTC, down 7.5%
- $25M traded in the 22:00 hour alone, compared with around $1M to $7M per hour earlier on 11/11
- $BTC over the same period: 74,679 → 72,986
Another sign that the sell-off is targeting Nvidia, not the whole sector: AMD (+3.9%) and Broadcom (+3%) were up in premarket trading, according to CNBC.
In my view, what’s really weighing on BTC is elsewhere: the fifth day of outflows from spot ETFs, totaling $1.44B since 5/11 (SoSoValue via CoinDesk). BTC’s drop actually came around 11:00 UTC, well after the Nvidia shock.
Two possible scenarios from here. If the board keeps Huang, NVDAB could recover some of its losses, back toward $165–170. If his departure is confirmed, several analysts cited by CNBC see a further drop of up to 20%, and then a real Nasdaq risk-off move could hit $BTC and $ETH . Next milestone: Nvidia earnings on 17/11.
Are you already following tokenized stocks to keep up with US news overnight, or is it still just noise to you?
#Nvidia #bStocks
Sources: Binance API NVDABUSDT/BTCUSDT (12/11), CNBC, Reuters, Investing.com, CoinDesk/SoSoValue. Not financial advice.
90
·
--
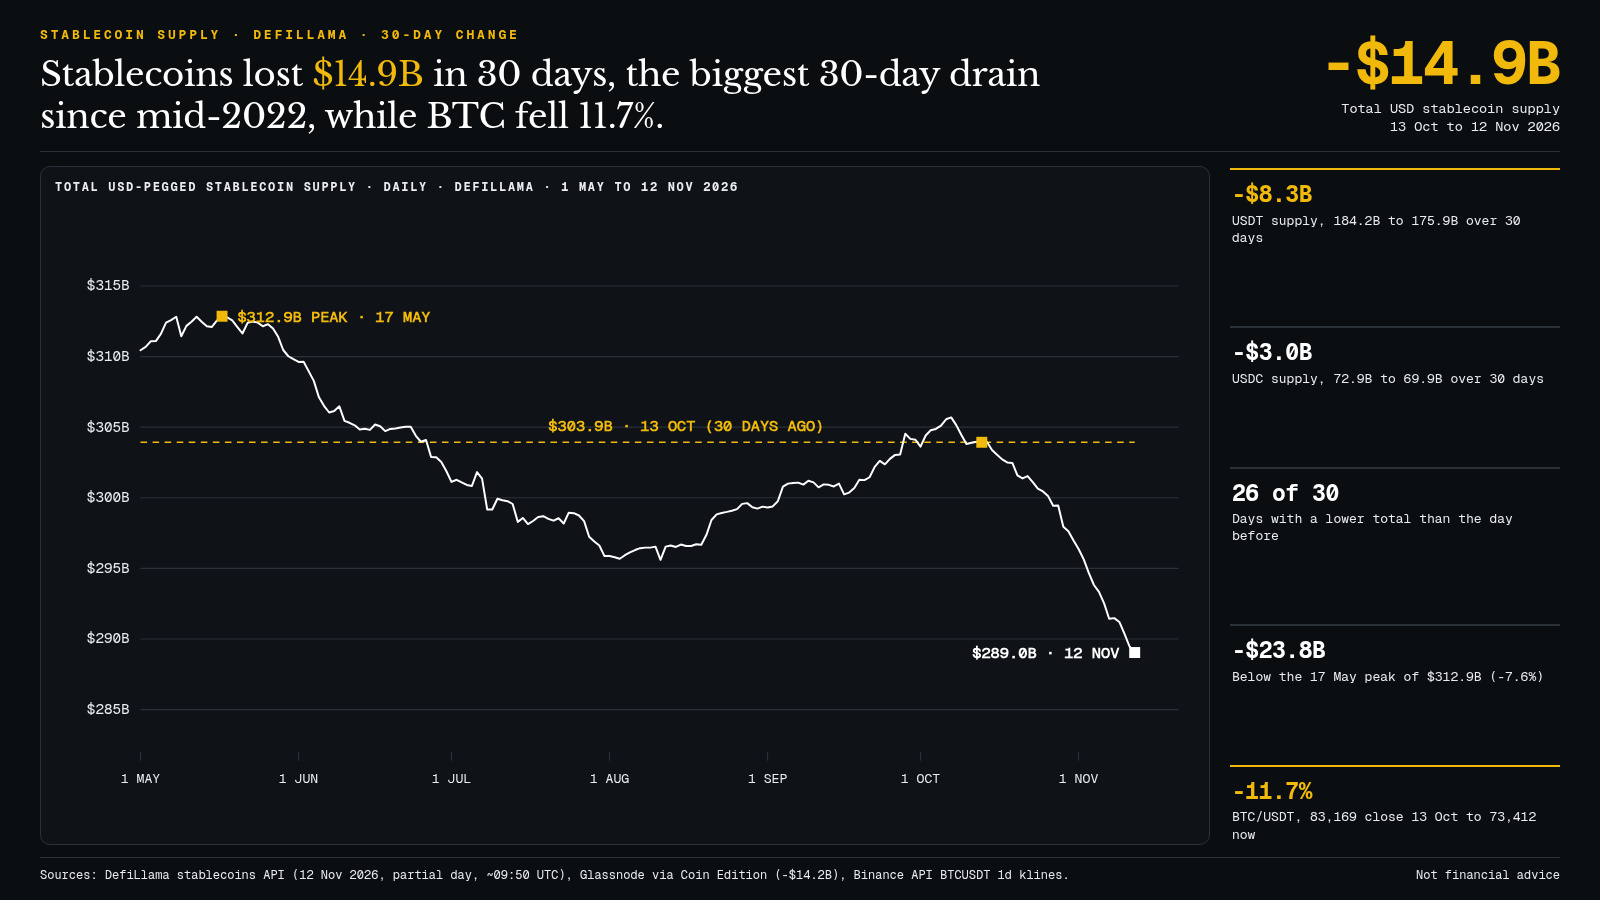
The fuel powering the crypto market is running low: the total stablecoin supply has lost $14.9B in 30 days, according to DefiLlama—the worst 30-day drop since mid-2022.
The chart speaks for itself. $303.9B on 13/10, $289.0B on 12/11 (partial day, ~09:50 UTC). The total fell on 26 of the past 30 days, and is now $23.8B below its 17/05 peak ($312.9B). Glassnode, cited by Coin Edition, comes up with a similar figure: -$14.2B, the biggest drop since June 2022.
What's shrinking? Mainly $USDT: $184.2 → $175.9B (-$8.3B). $USDC follows at $72.9 → $69.9B (-$3.0B). Over the same period, $BTC went from 83,169 (Binance close on 13/10) to around 73,400, a drop of 11.7%. And on the spot BTC ETF front, SoSoValue recorded a fifth consecutive day of outflows on 11/11, at nearly $300M.
My take: stablecoins being burned rather than deployed means purchasing power is leaving the ecosystem—not just traders waiting on the sidelines in USDT. As long as this curve keeps falling, every BTC bounce is happening against thinner reserves.
What would change the picture: a return to positive net issuance for several days (with the total climbing back above ~$295B), alongside ETFs buying again. Conversely, if the contraction continues at a pace of ~$0.5B/day, the $72,700–$73,000 zone for BTC could be retested.
Do you look at stablecoin supply before buying a bounce, or is it an indicator you ignore?
#Stablecoins #Bitcoin
Sources: DefiLlama stablecoins API (12/11), Glassnode via Coin Edition, SoSoValue via Coin Edition (11/11), Binance API. Not financial advice.
The fuel powering the crypto market is running low: the total stablecoin supply has lost $14.9B in 30 days, according to DefiLlama—the worst 30-day drop since mid-2022.
The chart speaks for itself. $303.9B on 13/10, $289.0B on 12/11 (partial day, ~09:50 UTC). The total fell on 26 of the past 30 days, and is now $23.8B below its 17/05 peak ($312.9B). Glassnode, cited by Coin Edition, comes up with a similar figure: -$14.2B, the biggest drop since June 2022.
What's shrinking? Mainly $USDT: $184.2 → $175.9B (-$8.3B). $USDC follows at $72.9 → $69.9B (-$3.0B). Over the same period, $BTC went from 83,169 (Binance close on 13/10) to around 73,400, a drop of 11.7%. And on the spot BTC ETF front, SoSoValue recorded a fifth consecutive day of outflows on 11/11, at nearly $300M.
My take: stablecoins being burned rather than deployed means purchasing power is leaving the ecosystem—not just traders waiting on the sidelines in USDT. As long as this curve keeps falling, every BTC bounce is happening against thinner reserves.
What would change the picture: a return to positive net issuance for several days (with the total climbing back above ~$295B), alongside ETFs buying again. Conversely, if the contraction continues at a pace of ~$0.5B/day, the $72,700–$73,000 zone for BTC could be retested.
Do you look at stablecoin supply before buying a bounce, or is it an indicator you ignore?
#Stablecoins #Bitcoin
Sources: DefiLlama stablecoins API (12/11), Glassnode via Coin Edition, SoSoValue via Coin Edition (11/11), Binance API. Not financial advice.
The chart speaks for itself. $303.9B on 13/10, $289.0B on 12/11 (partial day, ~09:50 UTC). The total fell on 26 of the past 30 days, and is now $23.8B below its 17/05 peak ($312.9B). Glassnode, cited by Coin Edition, comes up with a similar figure: -$14.2B, the biggest drop since June 2022.
What's shrinking? Mainly $USDT: $184.2 → $175.9B (-$8.3B). $USDC follows at $72.9 → $69.9B (-$3.0B). Over the same period, $BTC went from 83,169 (Binance close on 13/10) to around 73,400, a drop of 11.7%. And on the spot BTC ETF front, SoSoValue recorded a fifth consecutive day of outflows on 11/11, at nearly $300M.
My take: stablecoins being burned rather than deployed means purchasing power is leaving the ecosystem—not just traders waiting on the sidelines in USDT. As long as this curve keeps falling, every BTC bounce is happening against thinner reserves.
What would change the picture: a return to positive net issuance for several days (with the total climbing back above ~$295B), alongside ETFs buying again. Conversely, if the contraction continues at a pace of ~$0.5B/day, the $72,700–$73,000 zone for BTC could be retested.
Do you look at stablecoin supply before buying a bounce, or is it an indicator you ignore?
#Stablecoins #Bitcoin
Sources: DefiLlama stablecoins API (12/11), Glassnode via Coin Edition, SoSoValue via Coin Edition (11/11), Binance API. Not financial advice.
101
·
--
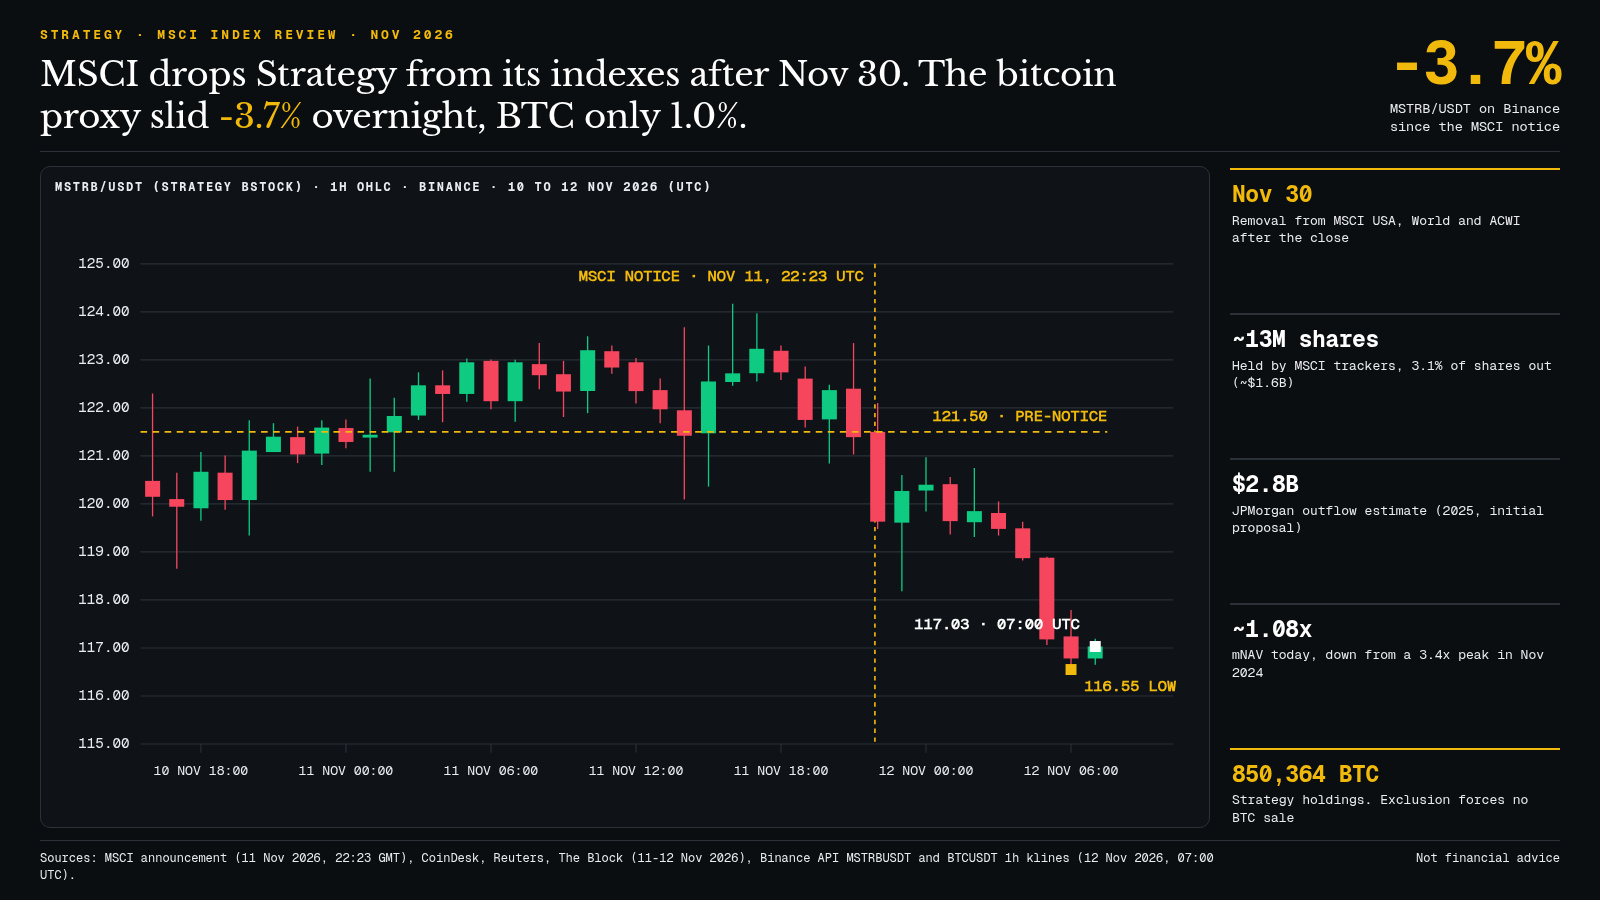
MSCI removes Strategy from its global indexes after the November 30 close. On Binance, the tokenized stock MSTRB has lost 3.7% since the announcement, while the $BTC has fallen only 1% over the same period.
Here’s how events unfolded:
10/15: MSCI adopts its new rule on “non-operating companies”—companies whose assets look more like a fund’s than a business’s.
11/11, 22:23 UTC: MSCI publishes the final list. Strategy is removed from the MSCI USA, World, and ACWI indexes. Metaplanet is also removed from the MSCI Japan Small Cap (Reuters, The Block).
Overnight: MSTRB falls from $121.50 (the 22:00 UTC open) to a low of $116.55, and trades at $117.03 at 07:00 UTC (Binance API). The $BTC slips from $74,390 to $73,620.
What this means in practice, according to CoinDesk: funds tracking MSCI hold around 13 million shares, or 3.1% of the company (about $1.6 billion). JPMorgan had estimated $2.8 billion in outflows in 2025, but that was based on the initial proposal. An important point: exclusion does not require Strategy to sell its 850,364 BTC.
The real issue, in my view, is the buying machine. The mNAV has already fallen to around 1.08x (from 3.4x at its November 2024 peak). Last week, of the $283.8 million raised, only $81.9 million went to BTC, while $188.3 million went to buying back STRC shares. Less passive demand means the premium risks staying depressed.
What to watch between now and 11/30:
- If MSTR stabilizes despite index-related selling, the event was already priced in, as 10x Research believes;
- If other index providers follow suit, JPMorgan cited outflows of up to $8.8 billion, dealing another blow to the BTC treasury narrative.
Does Strategy still have an impact on the price of BTC, or has this become a story about shareholders?
#Strategy #MSCI #Bitcoin
MSCI removes Strategy from its global indexes after the November 30 close. On Binance, the tokenized stock MSTRB has lost 3.7% since the announcement, while the $BTC has fallen only 1% over the same period.
Here’s how events unfolded:
10/15: MSCI adopts its new rule on “non-operating companies”—companies whose assets look more like a fund’s than a business’s.
11/11, 22:23 UTC: MSCI publishes the final list. Strategy is removed from the MSCI USA, World, and ACWI indexes. Metaplanet is also removed from the MSCI Japan Small Cap (Reuters, The Block).
Overnight: MSTRB falls from $121.50 (the 22:00 UTC open) to a low of $116.55, and trades at $117.03 at 07:00 UTC (Binance API). The $BTC slips from $74,390 to $73,620.
What this means in practice, according to CoinDesk: funds tracking MSCI hold around 13 million shares, or 3.1% of the company (about $1.6 billion). JPMorgan had estimated $2.8 billion in outflows in 2025, but that was based on the initial proposal. An important point: exclusion does not require Strategy to sell its 850,364 BTC.
The real issue, in my view, is the buying machine. The mNAV has already fallen to around 1.08x (from 3.4x at its November 2024 peak). Last week, of the $283.8 million raised, only $81.9 million went to BTC, while $188.3 million went to buying back STRC shares. Less passive demand means the premium risks staying depressed.
What to watch between now and 11/30:
- If MSTR stabilizes despite index-related selling, the event was already priced in, as 10x Research believes;
- If other index providers follow suit, JPMorgan cited outflows of up to $8.8 billion, dealing another blow to the BTC treasury narrative.
Does Strategy still have an impact on the price of BTC, or has this become a story about shareholders?
#Strategy #MSCI #Bitcoin
Here’s how events unfolded:
10/15: MSCI adopts its new rule on “non-operating companies”—companies whose assets look more like a fund’s than a business’s.
11/11, 22:23 UTC: MSCI publishes the final list. Strategy is removed from the MSCI USA, World, and ACWI indexes. Metaplanet is also removed from the MSCI Japan Small Cap (Reuters, The Block).
Overnight: MSTRB falls from $121.50 (the 22:00 UTC open) to a low of $116.55, and trades at $117.03 at 07:00 UTC (Binance API). The $BTC slips from $74,390 to $73,620.
What this means in practice, according to CoinDesk: funds tracking MSCI hold around 13 million shares, or 3.1% of the company (about $1.6 billion). JPMorgan had estimated $2.8 billion in outflows in 2025, but that was based on the initial proposal. An important point: exclusion does not require Strategy to sell its 850,364 BTC.
The real issue, in my view, is the buying machine. The mNAV has already fallen to around 1.08x (from 3.4x at its November 2024 peak). Last week, of the $283.8 million raised, only $81.9 million went to BTC, while $188.3 million went to buying back STRC shares. Less passive demand means the premium risks staying depressed.
What to watch between now and 11/30:
- If MSTR stabilizes despite index-related selling, the event was already priced in, as 10x Research believes;
- If other index providers follow suit, JPMorgan cited outflows of up to $8.8 billion, dealing another blow to the BTC treasury narrative.
Does Strategy still have an impact on the price of BTC, or has this become a story about shareholders?
#Strategy #MSCI #Bitcoin
78
·
--
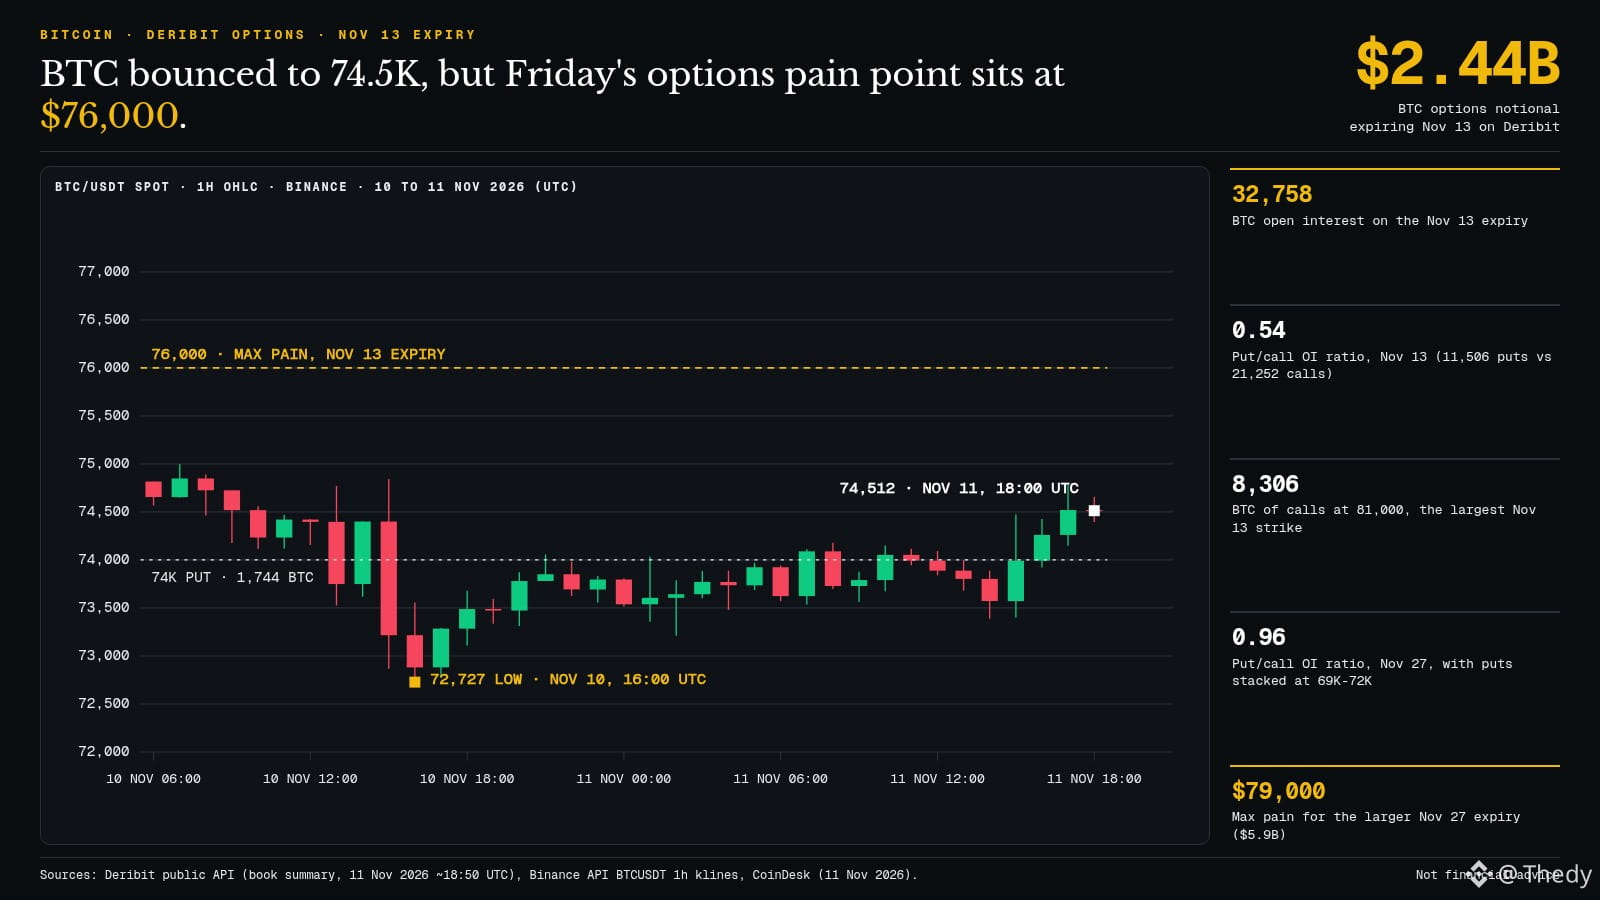
The $BTC rose to $74,500 on Wednesday evening, but Deribit's options market is telling a somewhat different story.
The prevailing idea: the rebound from Tuesday's low ($72,727 on Binance, 10/11 around 16:00 UTC) shows that the market has digested the hotter-than-expected U.S. CPI. Options data paint a more nuanced picture.
What Deribit shows (public API, 11/11 around 18:50 UTC):
- 32,758 BTC of open interest expire on Friday 13/11, or around $2.44 billion in notional value.
- Max pain for this expiry is at $76,000, around $1,500 above the current price.
- The put/call ratio in open interest is 0.54, but the largest position is an $81,000 call (8,306 BTC), far out of the money. On the put side, the heaviest strikes are $72,000, $74,000, and $70,000.
- For the 27/11 expiry (around $5.9 billion), the ratio rises to 0.96, with puts stacked between $69,000 and $72,000.
CoinDesk also noted on Wednesday that puts are trading 4 to 5 volatility points higher than calls, and that spot BTC ETFs saw $95 million in outflows on Tuesday, their fourth consecutive session of outflows, although the pace is slowing.
My take: the rebound is real, but demand for downside protection remains. The $81,000 call looks more like an old bet than a signal.
Two paths before Friday:
- A move back above $75,000 could see the price gravitate toward the $76,000 area as expiry approaches.
- A drop below $74,000 would put the $72,000–$72,700 area (put strike + Tuesday's low) back in focus.
Do you follow max pain, or is it just noise to you?
#Bitcoin #Options
The $BTC rose to $74,500 on Wednesday evening, but Deribit's options market is telling a somewhat different story.
The prevailing idea: the rebound from Tuesday's low ($72,727 on Binance, 10/11 around 16:00 UTC) shows that the market has digested the hotter-than-expected U.S. CPI. Options data paint a more nuanced picture.
What Deribit shows (public API, 11/11 around 18:50 UTC):
- 32,758 BTC of open interest expire on Friday 13/11, or around $2.44 billion in notional value.
- Max pain for this expiry is at $76,000, around $1,500 above the current price.
- The put/call ratio in open interest is 0.54, but the largest position is an $81,000 call (8,306 BTC), far out of the money. On the put side, the heaviest strikes are $72,000, $74,000, and $70,000.
- For the 27/11 expiry (around $5.9 billion), the ratio rises to 0.96, with puts stacked between $69,000 and $72,000.
CoinDesk also noted on Wednesday that puts are trading 4 to 5 volatility points higher than calls, and that spot BTC ETFs saw $95 million in outflows on Tuesday, their fourth consecutive session of outflows, although the pace is slowing.
My take: the rebound is real, but demand for downside protection remains. The $81,000 call looks more like an old bet than a signal.
Two paths before Friday:
- A move back above $75,000 could see the price gravitate toward the $76,000 area as expiry approaches.
- A drop below $74,000 would put the $72,000–$72,700 area (put strike + Tuesday's low) back in focus.
Do you follow max pain, or is it just noise to you?
#Bitcoin #Options
The prevailing idea: the rebound from Tuesday's low ($72,727 on Binance, 10/11 around 16:00 UTC) shows that the market has digested the hotter-than-expected U.S. CPI. Options data paint a more nuanced picture.
What Deribit shows (public API, 11/11 around 18:50 UTC):
- 32,758 BTC of open interest expire on Friday 13/11, or around $2.44 billion in notional value.
- Max pain for this expiry is at $76,000, around $1,500 above the current price.
- The put/call ratio in open interest is 0.54, but the largest position is an $81,000 call (8,306 BTC), far out of the money. On the put side, the heaviest strikes are $72,000, $74,000, and $70,000.
- For the 27/11 expiry (around $5.9 billion), the ratio rises to 0.96, with puts stacked between $69,000 and $72,000.
CoinDesk also noted on Wednesday that puts are trading 4 to 5 volatility points higher than calls, and that spot BTC ETFs saw $95 million in outflows on Tuesday, their fourth consecutive session of outflows, although the pace is slowing.
My take: the rebound is real, but demand for downside protection remains. The $81,000 call looks more like an old bet than a signal.
Two paths before Friday:
- A move back above $75,000 could see the price gravitate toward the $76,000 area as expiry approaches.
- A drop below $74,000 would put the $72,000–$72,700 area (put strike + Tuesday's low) back in focus.
Do you follow max pain, or is it just noise to you?
#Bitcoin #Options
25
·
--
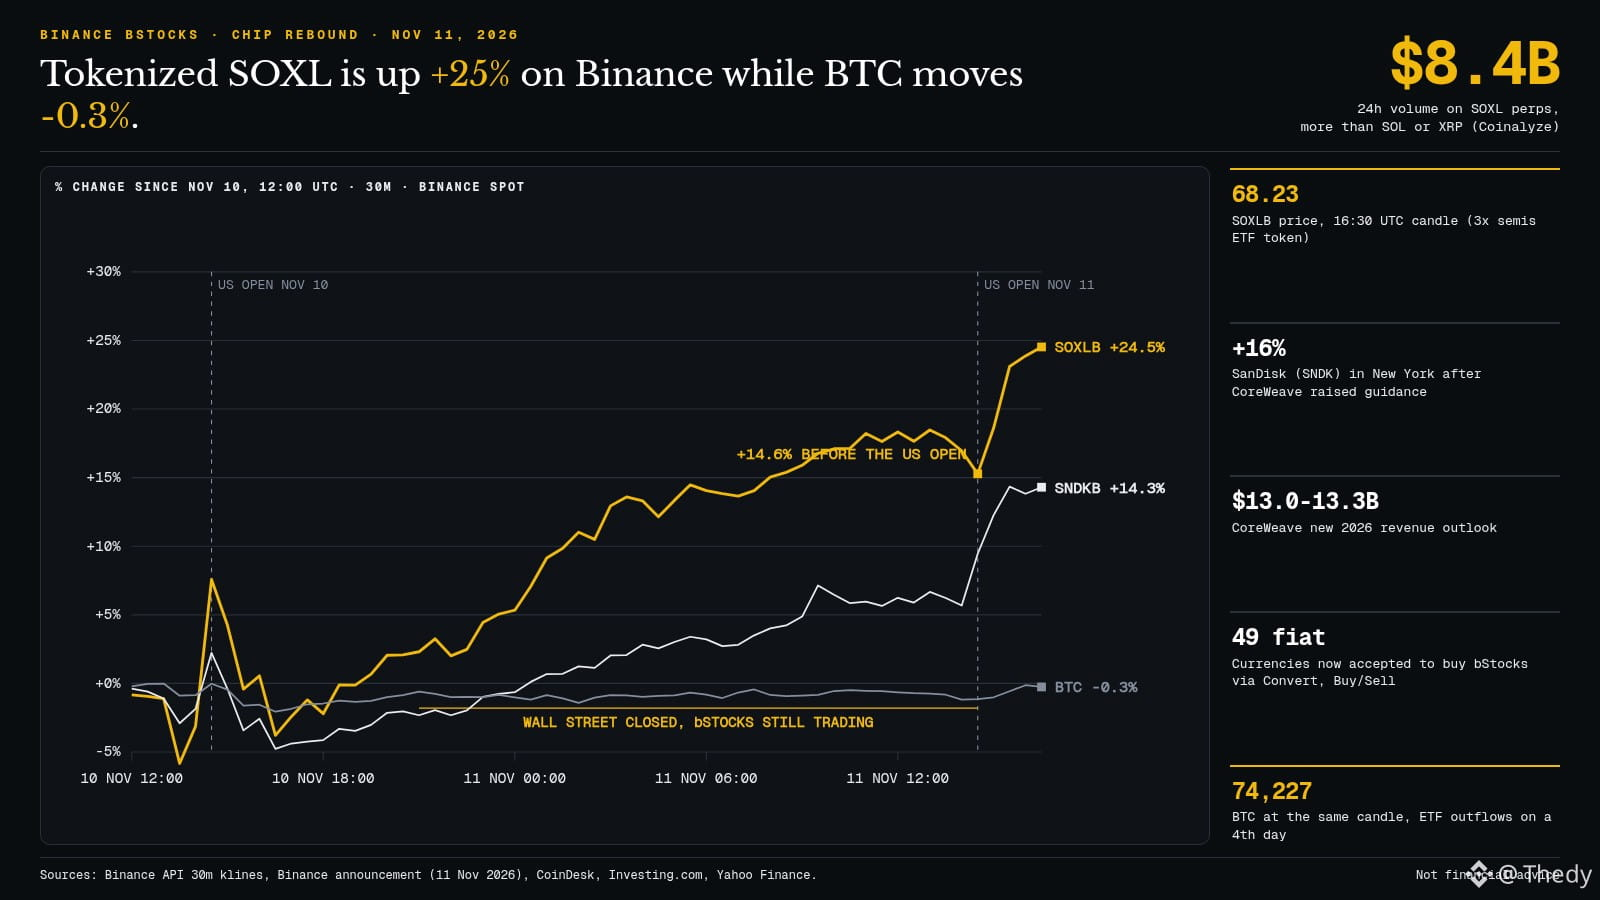
On Binance, the SOXLB token (the 3x leveraged semiconductor ETF in bStocks form) is up about +25% since yesterday at 12:00 UTC. Over the same period, the $BTC is down 0.3%.
The trigger came from Wall Street: CoreWeave raised its 2026 revenue forecast to $13–13.3 billion on Tuesday evening. This Wednesday, SanDisk is up around 16% in New York, Micron more than 12%, and Nvidia nearly 4% (Investing.com, Yahoo Finance).
What interests me is the time-zone gap. bStocks trade 24/7. Between the U.S. market close on 11/10 (21:00 UTC) and the open on 11/11 (14:30 UTC), SOXLB had already gained +14.6% on Binance, before the underlying market even reopened.
As for bitcoin, the mood is the opposite. U.S. spot BTC ETFs saw $95 million in outflows on Tuesday, their fourth consecutive day of outflows (SoSoValue via CoinDesk), and the market is pricing in a Fed rate hike in December. BTC is holding around $74,200, without following the stock rebound.
Another signal noted by CoinDesk (Coinalyze data): SOXL perpetuals saw $8.4 billion in volume over 24 hours, more than those on $SOL or $XRP. And since this morning, Binance has allowed users to buy and sell bStocks directly with fiat currencies, with 49 currencies accepted, depending on eligible regions.
My take: some speculative capital is rotating into tokenized tech stocks as the AI narrative picks up again and BTC stagnates. But SOXLB remains a 3x product: by the same logic, a day with a -8% move in semiconductors means roughly -24%. Nvidia reports earnings on 11/17—a real test for this rebound.
If BTC ETFs return to inflows, the rotation could quickly reverse. Otherwise, the gap could persist until the Fed meeting on 12/9.
Are you already trading tokenized stocks, or are you staying 100% crypto?
#bStocks #TokenizedStocks
On Binance, the SOXLB token (the 3x leveraged semiconductor ETF in bStocks form) is up about +25% since yesterday at 12:00 UTC. Over the same period, the $BTC is down 0.3%.
The trigger came from Wall Street: CoreWeave raised its 2026 revenue forecast to $13–13.3 billion on Tuesday evening. This Wednesday, SanDisk is up around 16% in New York, Micron more than 12%, and Nvidia nearly 4% (Investing.com, Yahoo Finance).
What interests me is the time-zone gap. bStocks trade 24/7. Between the U.S. market close on 11/10 (21:00 UTC) and the open on 11/11 (14:30 UTC), SOXLB had already gained +14.6% on Binance, before the underlying market even reopened.
As for bitcoin, the mood is the opposite. U.S. spot BTC ETFs saw $95 million in outflows on Tuesday, their fourth consecutive day of outflows (SoSoValue via CoinDesk), and the market is pricing in a Fed rate hike in December. BTC is holding around $74,200, without following the stock rebound.
Another signal noted by CoinDesk (Coinalyze data): SOXL perpetuals saw $8.4 billion in volume over 24 hours, more than those on $SOL or $XRP . And since this morning, Binance has allowed users to buy and sell bStocks directly with fiat currencies, with 49 currencies accepted, depending on eligible regions.
My take: some speculative capital is rotating into tokenized tech stocks as the AI narrative picks up again and BTC stagnates. But SOXLB remains a 3x product: by the same logic, a day with a -8% move in semiconductors means roughly -24%. Nvidia reports earnings on 11/17—a real test for this rebound.
If BTC ETFs return to inflows, the rotation could quickly reverse. Otherwise, the gap could persist until the Fed meeting on 12/9.
Are you already trading tokenized stocks, or are you staying 100% crypto?
#bStocks #TokenizedStocks
The trigger came from Wall Street: CoreWeave raised its 2026 revenue forecast to $13–13.3 billion on Tuesday evening. This Wednesday, SanDisk is up around 16% in New York, Micron more than 12%, and Nvidia nearly 4% (Investing.com, Yahoo Finance).
What interests me is the time-zone gap. bStocks trade 24/7. Between the U.S. market close on 11/10 (21:00 UTC) and the open on 11/11 (14:30 UTC), SOXLB had already gained +14.6% on Binance, before the underlying market even reopened.
As for bitcoin, the mood is the opposite. U.S. spot BTC ETFs saw $95 million in outflows on Tuesday, their fourth consecutive day of outflows (SoSoValue via CoinDesk), and the market is pricing in a Fed rate hike in December. BTC is holding around $74,200, without following the stock rebound.
Another signal noted by CoinDesk (Coinalyze data): SOXL perpetuals saw $8.4 billion in volume over 24 hours, more than those on $SOL or $XRP . And since this morning, Binance has allowed users to buy and sell bStocks directly with fiat currencies, with 49 currencies accepted, depending on eligible regions.
My take: some speculative capital is rotating into tokenized tech stocks as the AI narrative picks up again and BTC stagnates. But SOXLB remains a 3x product: by the same logic, a day with a -8% move in semiconductors means roughly -24%. Nvidia reports earnings on 11/17—a real test for this rebound.
If BTC ETFs return to inflows, the rotation could quickly reverse. Otherwise, the gap could persist until the Fed meeting on 12/9.
Are you already trading tokenized stocks, or are you staying 100% crypto?
#bStocks #TokenizedStocks
77
·
--
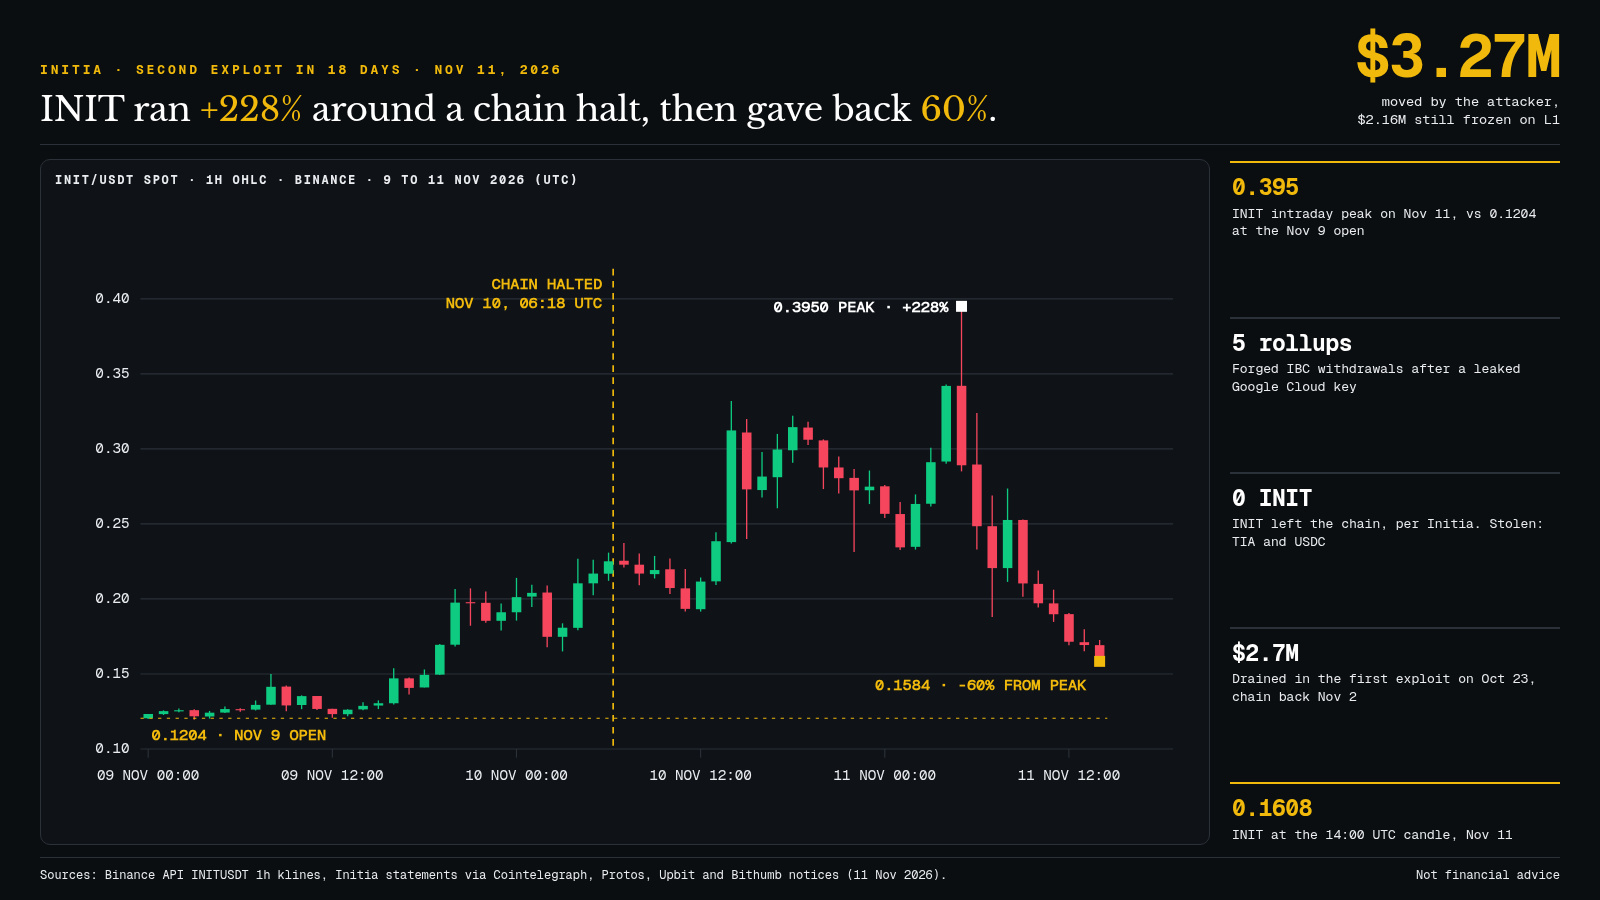
Initia ($INIT) rose de +228 % en trois jours alors que sa blockchain était piratée et mise à l'arrêt. Depuis ce matin, le token a perdu 60 %.
Le fil des événements sur la paire INIT/USDT de Binance :
23/10 : premier exploit. Une faille MoveVM, environ 2,7 M$ drainés. La chaîne est arrêtée, puis relancée le 2/11. Upbit classe l'INIT comme « token sous surveillance » le 26/10, avec un examen prévu jusqu'au 23-27/11.
9/11 : l'attaquant entre grâce à une clé Google Cloud compromise. L'INIT ouvre à 0,1204 $.
10/11 à 06:18 UTC : Initia arrête son L1 avec les validateurs. L'INIT cotait déjà autour de 0,22 $ à ce moment-là. Upbit et Bithumb suspendent les retraits, mais les échanges se poursuivent.
11/11 : Initia publie son bilan. Des retraits IBC falsifiés sur 5 rollups, 3,27 M$ déplacés, dont 2,16 M$ restent gelés sur la chaîne à l'arrêt. L'attaquant a sorti 13 400 $TIA, 8 000 USDC.inj et 597 000 USDC Noble. Aucun INIT n'a quitté la chaîne, selon l'équipe. Côté prix, l'INIT atteint 0,395 $ sur la bougie de 05:00 UTC, puis glisse jusqu'à 0,1584 $ à 14:00 UTC.
Mon interprétation : la hausse n'était pas un vote de confiance. Une chaîne à l'arrêt, des dépôts et retraits bloqués sur plusieurs plateformes et une offre échangeable réduite : c'est le terrain idéal pour un squeeze, pas pour une réévaluation. Selon Protos, les pertes cumulées des deux incidents dépassent déjà la TVL restante du réseau.
À surveiller maintenant : la date de redémarrage (Initia reconstruit son infrastructure à partir de zéro), qui prendra en charge la recapitalisation des 3,27 M$ et la décision d'Upbit fin novembre. Un retour sous 0,12 $ effacerait toute la hausse.
Deux piratages en 18 jours : garderiez-vous un token dont la chaîne est à l'arrêt, ou attendriez-vous le redémarrage avant d'y toucher ?
#Initia #CryptoSecurity
Initia ($INIT ) rose de +228 % en trois jours alors que sa blockchain était piratée et mise à l'arrêt. Depuis ce matin, le token a perdu 60 %.
Le fil des événements sur la paire INIT/USDT de Binance :
23/10 : premier exploit. Une faille MoveVM, environ 2,7 M$ drainés. La chaîne est arrêtée, puis relancée le 2/11. Upbit classe l'INIT comme « token sous surveillance » le 26/10, avec un examen prévu jusqu'au 23-27/11.
9/11 : l'attaquant entre grâce à une clé Google Cloud compromise. L'INIT ouvre à 0,1204 $.
10/11 à 06:18 UTC : Initia arrête son L1 avec les validateurs. L'INIT cotait déjà autour de 0,22 $ à ce moment-là. Upbit et Bithumb suspendent les retraits, mais les échanges se poursuivent.
11/11 : Initia publie son bilan. Des retraits IBC falsifiés sur 5 rollups, 3,27 M$ déplacés, dont 2,16 M$ restent gelés sur la chaîne à l'arrêt. L'attaquant a sorti 13 400 $TIA , 8 000 USDC.inj et 597 000 USDC Noble. Aucun INIT n'a quitté la chaîne, selon l'équipe. Côté prix, l'INIT atteint 0,395 $ sur la bougie de 05:00 UTC, puis glisse jusqu'à 0,1584 $ à 14:00 UTC.
Mon interprétation : la hausse n'était pas un vote de confiance. Une chaîne à l'arrêt, des dépôts et retraits bloqués sur plusieurs plateformes et une offre échangeable réduite : c'est le terrain idéal pour un squeeze, pas pour une réévaluation. Selon Protos, les pertes cumulées des deux incidents dépassent déjà la TVL restante du réseau.
À surveiller maintenant : la date de redémarrage (Initia reconstruit son infrastructure à partir de zéro), qui prendra en charge la recapitalisation des 3,27 M$ et la décision d'Upbit fin novembre. Un retour sous 0,12 $ effacerait toute la hausse.
Deux piratages en 18 jours : garderiez-vous un token dont la chaîne est à l'arrêt, ou attendriez-vous le redémarrage avant d'y toucher ?
#Initia #CryptoSecurity
Le fil des événements sur la paire INIT/USDT de Binance :
23/10 : premier exploit. Une faille MoveVM, environ 2,7 M$ drainés. La chaîne est arrêtée, puis relancée le 2/11. Upbit classe l'INIT comme « token sous surveillance » le 26/10, avec un examen prévu jusqu'au 23-27/11.
9/11 : l'attaquant entre grâce à une clé Google Cloud compromise. L'INIT ouvre à 0,1204 $.
10/11 à 06:18 UTC : Initia arrête son L1 avec les validateurs. L'INIT cotait déjà autour de 0,22 $ à ce moment-là. Upbit et Bithumb suspendent les retraits, mais les échanges se poursuivent.
11/11 : Initia publie son bilan. Des retraits IBC falsifiés sur 5 rollups, 3,27 M$ déplacés, dont 2,16 M$ restent gelés sur la chaîne à l'arrêt. L'attaquant a sorti 13 400 $TIA , 8 000 USDC.inj et 597 000 USDC Noble. Aucun INIT n'a quitté la chaîne, selon l'équipe. Côté prix, l'INIT atteint 0,395 $ sur la bougie de 05:00 UTC, puis glisse jusqu'à 0,1584 $ à 14:00 UTC.
Mon interprétation : la hausse n'était pas un vote de confiance. Une chaîne à l'arrêt, des dépôts et retraits bloqués sur plusieurs plateformes et une offre échangeable réduite : c'est le terrain idéal pour un squeeze, pas pour une réévaluation. Selon Protos, les pertes cumulées des deux incidents dépassent déjà la TVL restante du réseau.
À surveiller maintenant : la date de redémarrage (Initia reconstruit son infrastructure à partir de zéro), qui prendra en charge la recapitalisation des 3,27 M$ et la décision d'Upbit fin novembre. Un retour sous 0,12 $ effacerait toute la hausse.
Deux piratages en 18 jours : garderiez-vous un token dont la chaîne est à l'arrêt, ou attendriez-vous le redémarrage avant d'y toucher ?
#Initia #CryptoSecurity
74
·
--
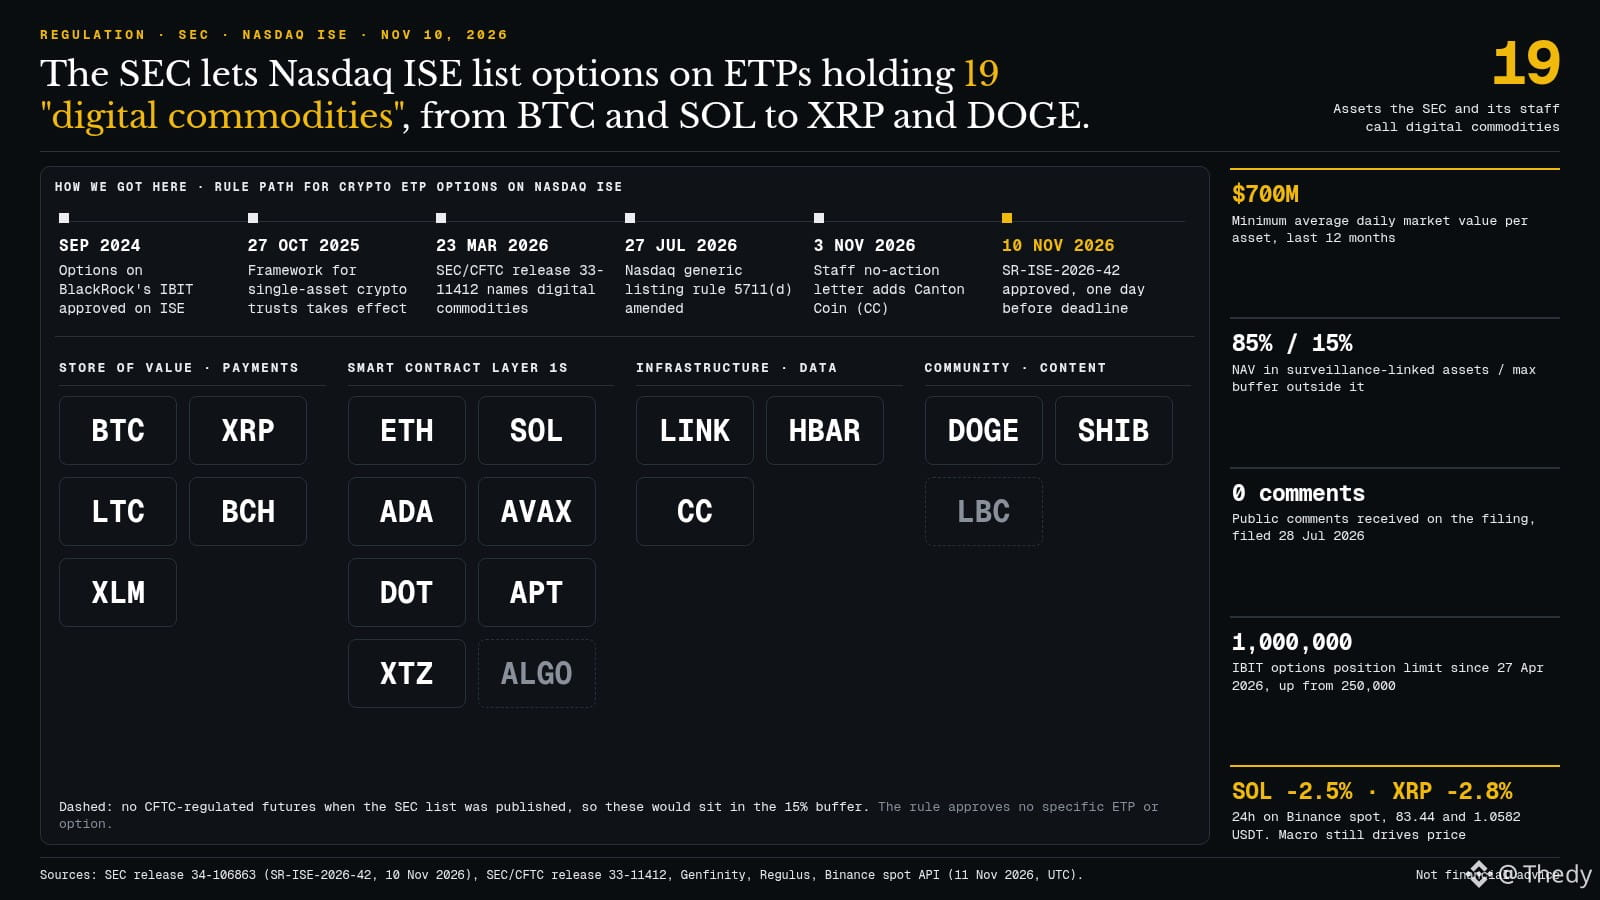
The SEC has opened the door to options on crypto ETPs beyond BTC and ETH. On 10/11, it approved Nasdaq ISE’s SR-ISE-2026-42 rule (Order 34-106863), one day before its 11/11 deadline.
What the text says, in practical terms:
- ISE can now list options on trusts that hold “digital commodities,” without going back to the SEC for each product.
- The reference list includes 19 assets: BTC, $ETH, $SOL, $XRP, ADA, AVAX, LINK, HBAR, XLM, DOT, LTC, DOGE, BCH, APT, XTZ, SHIB, ALGO, LBC, plus Canton Coin, added in a staff letter on 3/11.
- Each asset in a trust must have an average daily market value of at least $700 million over 12 months.
- 85% of net assets must be in assets with derivatives on a market covered by a surveillance-sharing agreement (CME, Coinbase Derivatives). The remaining 15% max serves as a buffer.
Important point: the rule does not approve any specific ETP or option. Each product must first be listed, then pass the tests.
My take: this is plumbing, not an immediate price catalyst. This morning, SOL is down about 2.5% and XRP 2.8% over 24 hours on Binance; the Fed is weighing more heavily than the SEC. But options on IBIT have shown the logical next step: the position limit rose from 250,000 to 1,000,000 contracts in April. Options listed on SOL or XRP ETPs would give institutions a way to hedge and generate returns, giving them more reasons to hold the underlying asset. If no issuer makes a move in the next few weeks, the effect will remain theoretical. ALGO and LBC, which had no regulated futures when the list was drawn up, will have to use the 15% buffer.
Which ETP do you think will be the first to have options listed after BTC and ETH: SOL, XRP, or a multi-asset basket?
#SEC #CryptoETF
The SEC has opened the door to options on crypto ETPs beyond BTC and ETH. On 10/11, it approved Nasdaq ISE’s SR-ISE-2026-42 rule (Order 34-106863), one day before its 11/11 deadline.
What the text says, in practical terms:
- ISE can now list options on trusts that hold “digital commodities,” without going back to the SEC for each product.
- The reference list includes 19 assets: BTC, $ETH , $SOL , $XRP , ADA, AVAX, LINK, HBAR, XLM, DOT, LTC, DOGE, BCH, APT, XTZ, SHIB, ALGO, LBC, plus Canton Coin, added in a staff letter on 3/11.
- Each asset in a trust must have an average daily market value of at least $700 million over 12 months.
- 85% of net assets must be in assets with derivatives on a market covered by a surveillance-sharing agreement (CME, Coinbase Derivatives). The remaining 15% max serves as a buffer.
Important point: the rule does not approve any specific ETP or option. Each product must first be listed, then pass the tests.
My take: this is plumbing, not an immediate price catalyst. This morning, SOL is down about 2.5% and XRP 2.8% over 24 hours on Binance; the Fed is weighing more heavily than the SEC. But options on IBIT have shown the logical next step: the position limit rose from 250,000 to 1,000,000 contracts in April. Options listed on SOL or XRP ETPs would give institutions a way to hedge and generate returns, giving them more reasons to hold the underlying asset. If no issuer makes a move in the next few weeks, the effect will remain theoretical. ALGO and LBC, which had no regulated futures when the list was drawn up, will have to use the 15% buffer.
Which ETP do you think will be the first to have options listed after BTC and ETH: SOL, XRP, or a multi-asset basket?
#SEC #CryptoETF
What the text says, in practical terms:
- ISE can now list options on trusts that hold “digital commodities,” without going back to the SEC for each product.
- The reference list includes 19 assets: BTC, $ETH , $SOL , $XRP , ADA, AVAX, LINK, HBAR, XLM, DOT, LTC, DOGE, BCH, APT, XTZ, SHIB, ALGO, LBC, plus Canton Coin, added in a staff letter on 3/11.
- Each asset in a trust must have an average daily market value of at least $700 million over 12 months.
- 85% of net assets must be in assets with derivatives on a market covered by a surveillance-sharing agreement (CME, Coinbase Derivatives). The remaining 15% max serves as a buffer.
Important point: the rule does not approve any specific ETP or option. Each product must first be listed, then pass the tests.
My take: this is plumbing, not an immediate price catalyst. This morning, SOL is down about 2.5% and XRP 2.8% over 24 hours on Binance; the Fed is weighing more heavily than the SEC. But options on IBIT have shown the logical next step: the position limit rose from 250,000 to 1,000,000 contracts in April. Options listed on SOL or XRP ETPs would give institutions a way to hedge and generate returns, giving them more reasons to hold the underlying asset. If no issuer makes a move in the next few weeks, the effect will remain theoretical. ALGO and LBC, which had no regulated futures when the list was drawn up, will have to use the 15% buffer.
Which ETP do you think will be the first to have options listed after BTC and ETH: SOL, XRP, or a multi-asset basket?
#SEC #CryptoETF
214
·
--
Will the Fed really raise rates on December 9? The market has practically considered it a done deal since Tuesday’s CPI report, and Goldman Sachs is now adding another hike in March 2027.
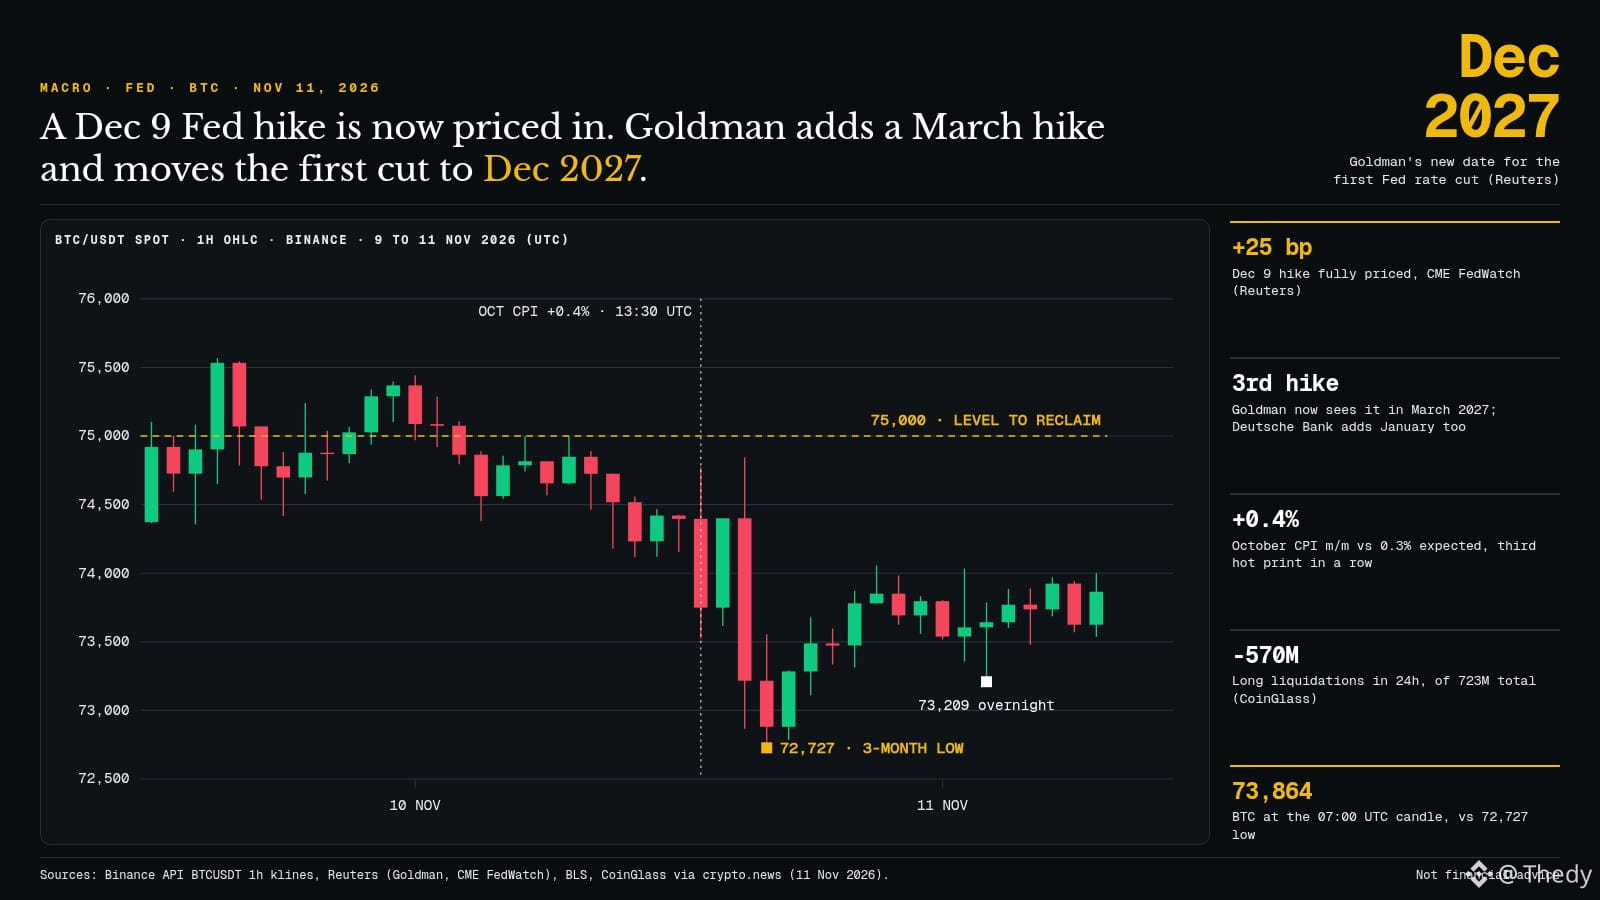
Short answer: yes, that’s the base-case scenario. According to Reuters this Wednesday, 11/11, contracts tracked by CME FedWatch fully price in a 25-basis-point hike on December 9, with a small probability of a 50-basis-point hike. The trigger was October inflation, up 0.4% month over month versus 0.3% expected—the third consecutive upside surprise.
What’s really changing is what comes next. David Mericle, Goldman’s chief economist, now expects a third hike in the cycle in March 2027 (January is possible) and pushes the first rate cut back to December 2027. Deutsche Bank goes further, adding a hike in January on top of those in December and March.
For $BTC, the impact was immediate. On Binance, the price fell from $74,770 at the time of the CPI release (13:30 UTC) to a low of $72,727 around 16:00 UTC, its weakest level since August. Overnight, it bottomed at $73,209, and BTC was hovering around $73,860 at 07:00 UTC. According to CoinGlass (via crypto.news), $723 million in positions were liquidated over 24 hours, including about $570 million in longs.
My take: the shock from the data has been absorbed, but not the shock from the rate outlook. Higher rates for longer mean a real opportunity cost for assets that don’t generate yield. As long as $75,000 hasn’t been reclaimed, any rebounds remain fragile. A decisive break below $72,727 would put pressure back on longs, while a move back above $75,000 would show that the market had already priced everything in.
The real question: is another Fed hike in March already priced into BTC, or is the market only just waking up to it?
#Bitcoin #Fed
Will the Fed really raise rates on December 9? The market has practically considered it a done deal since Tuesday’s CPI report, and Goldman Sachs is now adding another hike in March 2027.
Short answer: yes, that’s the base-case scenario. According to Reuters this Wednesday, 11/11, contracts tracked by CME FedWatch fully price in a 25-basis-point hike on December 9, with a small probability of a 50-basis-point hike. The trigger was October inflation, up 0.4% month over month versus 0.3% expected—the third consecutive upside surprise.
What’s really changing is what comes next. David Mericle, Goldman’s chief economist, now expects a third hike in the cycle in March 2027 (January is possible) and pushes the first rate cut back to December 2027. Deutsche Bank goes further, adding a hike in January on top of those in December and March.
For $BTC , the impact was immediate. On Binance, the price fell from $74,770 at the time of the CPI release (13:30 UTC) to a low of $72,727 around 16:00 UTC, its weakest level since August. Overnight, it bottomed at $73,209, and BTC was hovering around $73,860 at 07:00 UTC. According to CoinGlass (via crypto.news), $723 million in positions were liquidated over 24 hours, including about $570 million in longs.
My take: the shock from the data has been absorbed, but not the shock from the rate outlook. Higher rates for longer mean a real opportunity cost for assets that don’t generate yield. As long as $75,000 hasn’t been reclaimed, any rebounds remain fragile. A decisive break below $72,727 would put pressure back on longs, while a move back above $75,000 would show that the market had already priced everything in.
The real question: is another Fed hike in March already priced into BTC, or is the market only just waking up to it?
#Bitcoin #Fed
Short answer: yes, that’s the base-case scenario. According to Reuters this Wednesday, 11/11, contracts tracked by CME FedWatch fully price in a 25-basis-point hike on December 9, with a small probability of a 50-basis-point hike. The trigger was October inflation, up 0.4% month over month versus 0.3% expected—the third consecutive upside surprise.
What’s really changing is what comes next. David Mericle, Goldman’s chief economist, now expects a third hike in the cycle in March 2027 (January is possible) and pushes the first rate cut back to December 2027. Deutsche Bank goes further, adding a hike in January on top of those in December and March.
For $BTC , the impact was immediate. On Binance, the price fell from $74,770 at the time of the CPI release (13:30 UTC) to a low of $72,727 around 16:00 UTC, its weakest level since August. Overnight, it bottomed at $73,209, and BTC was hovering around $73,860 at 07:00 UTC. According to CoinGlass (via crypto.news), $723 million in positions were liquidated over 24 hours, including about $570 million in longs.
My take: the shock from the data has been absorbed, but not the shock from the rate outlook. Higher rates for longer mean a real opportunity cost for assets that don’t generate yield. As long as $75,000 hasn’t been reclaimed, any rebounds remain fragile. A decisive break below $72,727 would put pressure back on longs, while a move back above $75,000 would show that the market had already priced everything in.
The real question: is another Fed hike in March already priced into BTC, or is the market only just waking up to it?
#Bitcoin #Fed
79
·
--
Grayscale launched a major ad campaign for Zcash this Tuesday, 10/11, with a front-page takeover in the Wall Street Journal. On the same day, the $ZEC lost 17% in less than two hours on Binance.
The common assumption is that a campaign by a major ETF issuer pushes the price up. The day's numbers tell a different story.
On Binance, ZEC hit $1,199.82 in the 15:00 UTC candle, then fell to $994.22 around 16:45 UTC. That was its lowest level of the day since September 4. The single 15-minute candle at 15:30 UTC was down 5.8%, with around $26 million traded—six times more than in the preceding candles.
Leverage positions drove the decline. EconoTimes counted $8.96 million in longs liquidated in one hour across Binance, Bybit, and OKX, compared with $110,000 in shorts. CryptoTicker reported that ZEC open interest on OKX fell from around $162 million to $130 million in less than two hours. No project-specific news (hack, delisting, outage) was reported, and the $BTC itself was below $74,000 after the U.S. CPI release.
As for Grayscale, according to The Block: $1 million in grants pledged to the ecosystem, including $400,000 already distributed to four projects, and 100% of the ZCSH ETF's fees reinvested in the network during its first year. But the ETF saw more than $15 million in net outflows in November, following $46.25 million in outflows in October.
My takeaway: marketing works over months; leverage works over minutes. ZEC is still 39% below its September 26 high of $1,698. A move back above $1,100 would erase a good chunk of the drop. A daily close below $1,000 would instead open the door to the early-September zone.
Do you think the Grayscale campaign can bring in spot buyers, or do the ETF outflows carry more weight?
#Zcash #ZEC
Grayscale launched a major ad campaign for Zcash this Tuesday, 10/11, with a front-page takeover in the Wall Street Journal. On the same day, the $ZEC lost 17% in less than two hours on Binance.
The common assumption is that a campaign by a major ETF issuer pushes the price up. The day's numbers tell a different story.
On Binance, ZEC hit $1,199.82 in the 15:00 UTC candle, then fell to $994.22 around 16:45 UTC. That was its lowest level of the day since September 4. The single 15-minute candle at 15:30 UTC was down 5.8%, with around $26 million traded—six times more than in the preceding candles.
Leverage positions drove the decline. EconoTimes counted $8.96 million in longs liquidated in one hour across Binance, Bybit, and OKX, compared with $110,000 in shorts. CryptoTicker reported that ZEC open interest on OKX fell from around $162 million to $130 million in less than two hours. No project-specific news (hack, delisting, outage) was reported, and the $BTC itself was below $74,000 after the U.S. CPI release.
As for Grayscale, according to The Block: $1 million in grants pledged to the ecosystem, including $400,000 already distributed to four projects, and 100% of the ZCSH ETF's fees reinvested in the network during its first year. But the ETF saw more than $15 million in net outflows in November, following $46.25 million in outflows in October.
My takeaway: marketing works over months; leverage works over minutes. ZEC is still 39% below its September 26 high of $1,698. A move back above $1,100 would erase a good chunk of the drop. A daily close below $1,000 would instead open the door to the early-September zone.
Do you think the Grayscale campaign can bring in spot buyers, or do the ETF outflows carry more weight?
#Zcash #ZEC
The common assumption is that a campaign by a major ETF issuer pushes the price up. The day's numbers tell a different story.
On Binance, ZEC hit $1,199.82 in the 15:00 UTC candle, then fell to $994.22 around 16:45 UTC. That was its lowest level of the day since September 4. The single 15-minute candle at 15:30 UTC was down 5.8%, with around $26 million traded—six times more than in the preceding candles.
Leverage positions drove the decline. EconoTimes counted $8.96 million in longs liquidated in one hour across Binance, Bybit, and OKX, compared with $110,000 in shorts. CryptoTicker reported that ZEC open interest on OKX fell from around $162 million to $130 million in less than two hours. No project-specific news (hack, delisting, outage) was reported, and the $BTC itself was below $74,000 after the U.S. CPI release.
As for Grayscale, according to The Block: $1 million in grants pledged to the ecosystem, including $400,000 already distributed to four projects, and 100% of the ZCSH ETF's fees reinvested in the network during its first year. But the ETF saw more than $15 million in net outflows in November, following $46.25 million in outflows in October.
My takeaway: marketing works over months; leverage works over minutes. ZEC is still 39% below its September 26 high of $1,698. A move back above $1,100 would erase a good chunk of the drop. A daily close below $1,000 would instead open the door to the early-September zone.
Do you think the Grayscale campaign can bring in spot buyers, or do the ETF outflows carry more weight?
#Zcash #ZEC
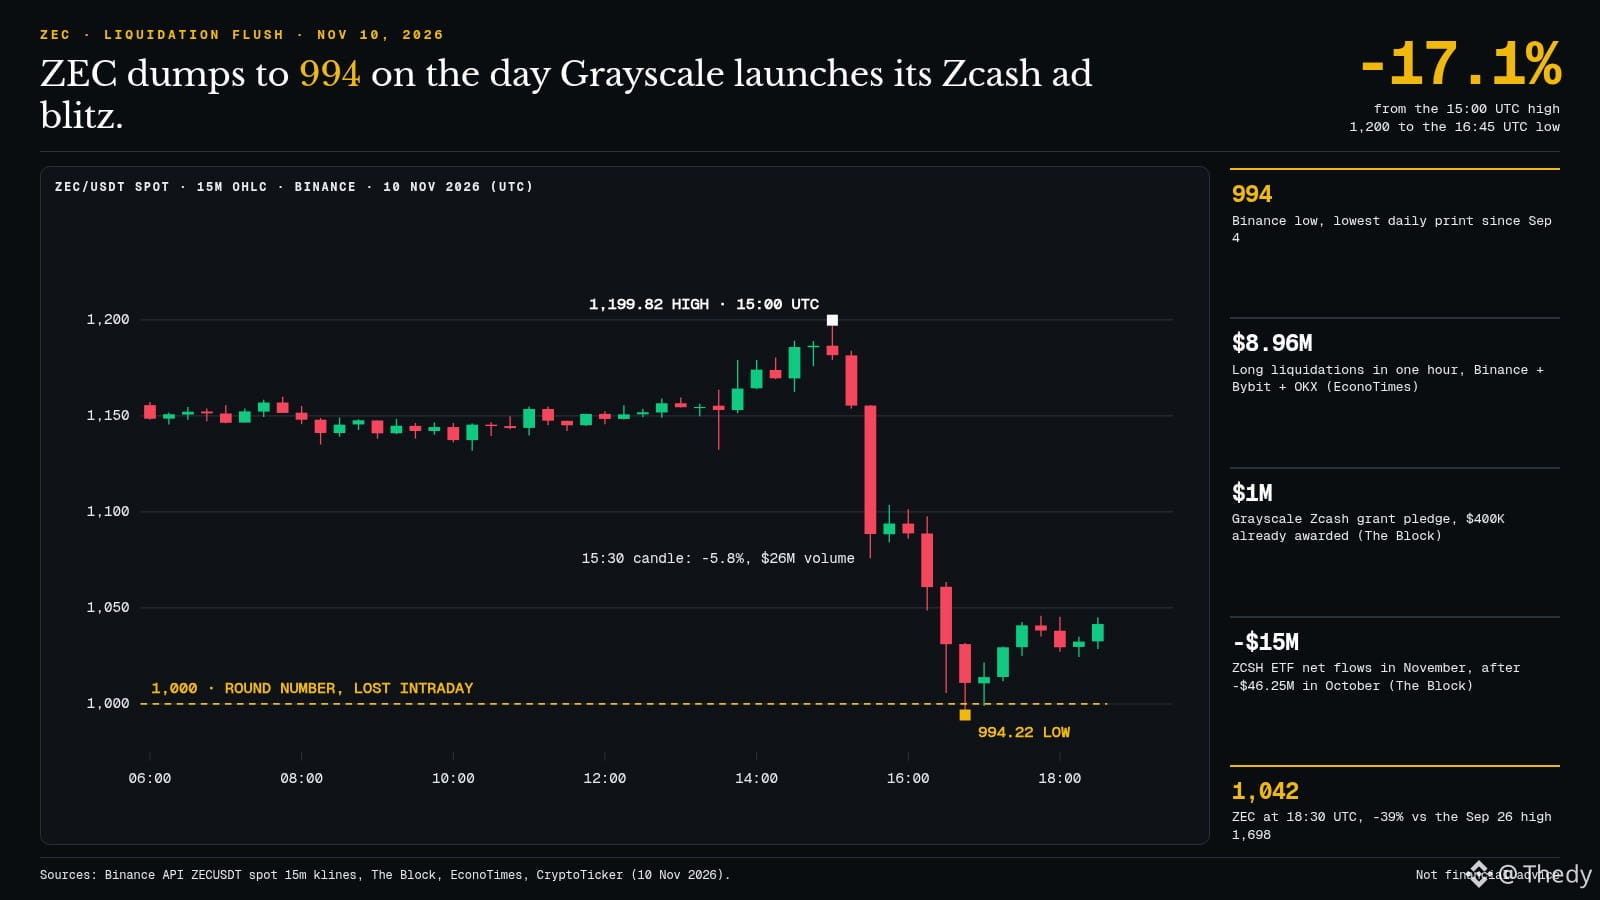
157
·
--
The $BTC a gave way at Sunday’s floor: $72,727 on Binance around 16:00 UTC, its lowest price since August 20.
How we got here, in three stages:
Sunday 8/11, evening: first test at $73,510, followed by a quick recovery above $75,000 on Monday.
Tuesday 10/11, 13:30 UTC: October CPI comes in hot (+0.4% vs. 0.3% expected). A wick hits $73,525, $15 above the floor, and the level holds once again.
Tuesday, 15:00 UTC: after Wall Street opens, a rebound to $74,844, then a sharp rejection. The Nasdaq turns down 1.1% during the session, while Nvidia loses 6%, according to CoinDesk. BTC falls back below $73,510 and hits $72,727, a $2,117 drop from the rejection.
What’s weighing in the background: -$201M in spot BTC ETF outflows on Monday (Farside), traders beginning to bet on a Fed rate hike in December, and a $ETH down to $2,006 (-5.3% over 24h).
My take: a support level tested twice in 48 hours and then broken on the third attempt is rarely an accident. Price is also trading below the 21-week moving average, around $73,078 according to Cointelegraph.
Two short-term paths:
- Reclaim $73,510 on a 4-hour close: the breakdown becomes a wick, and the market returns to its range.
- Failure below this level: former support becomes resistance, and the next reference cited by Cointelegraph is the 200-week average, around $67,755.
Would you buy back in this zone below $73,000, or wait to see if $73,510 is reclaimed?
#Bitcoin #BTC
The $BTC a gave way at Sunday’s floor: $72,727 on Binance around 16:00 UTC, its lowest price since August 20.
How we got here, in three stages:
Sunday 8/11, evening: first test at $73,510, followed by a quick recovery above $75,000 on Monday.
Tuesday 10/11, 13:30 UTC: October CPI comes in hot (+0.4% vs. 0.3% expected). A wick hits $73,525, $15 above the floor, and the level holds once again.
Tuesday, 15:00 UTC: after Wall Street opens, a rebound to $74,844, then a sharp rejection. The Nasdaq turns down 1.1% during the session, while Nvidia loses 6%, according to CoinDesk. BTC falls back below $73,510 and hits $72,727, a $2,117 drop from the rejection.
What’s weighing in the background: -$201M in spot BTC ETF outflows on Monday (Farside), traders beginning to bet on a Fed rate hike in December, and a $ETH down to $2,006 (-5.3% over 24h).
My take: a support level tested twice in 48 hours and then broken on the third attempt is rarely an accident. Price is also trading below the 21-week moving average, around $73,078 according to Cointelegraph.
Two short-term paths:
- Reclaim $73,510 on a 4-hour close: the breakdown becomes a wick, and the market returns to its range.
- Failure below this level: former support becomes resistance, and the next reference cited by Cointelegraph is the 200-week average, around $67,755.
Would you buy back in this zone below $73,000, or wait to see if $73,510 is reclaimed?
#Bitcoin #BTC
How we got here, in three stages:
Sunday 8/11, evening: first test at $73,510, followed by a quick recovery above $75,000 on Monday.
Tuesday 10/11, 13:30 UTC: October CPI comes in hot (+0.4% vs. 0.3% expected). A wick hits $73,525, $15 above the floor, and the level holds once again.
Tuesday, 15:00 UTC: after Wall Street opens, a rebound to $74,844, then a sharp rejection. The Nasdaq turns down 1.1% during the session, while Nvidia loses 6%, according to CoinDesk. BTC falls back below $73,510 and hits $72,727, a $2,117 drop from the rejection.
What’s weighing in the background: -$201M in spot BTC ETF outflows on Monday (Farside), traders beginning to bet on a Fed rate hike in December, and a $ETH down to $2,006 (-5.3% over 24h).
My take: a support level tested twice in 48 hours and then broken on the third attempt is rarely an accident. Price is also trading below the 21-week moving average, around $73,078 according to Cointelegraph.
Two short-term paths:
- Reclaim $73,510 on a 4-hour close: the breakdown becomes a wick, and the market returns to its range.
- Failure below this level: former support becomes resistance, and the next reference cited by Cointelegraph is the 200-week average, around $67,755.
Would you buy back in this zone below $73,000, or wait to see if $73,510 is reclaimed?
#Bitcoin #BTC
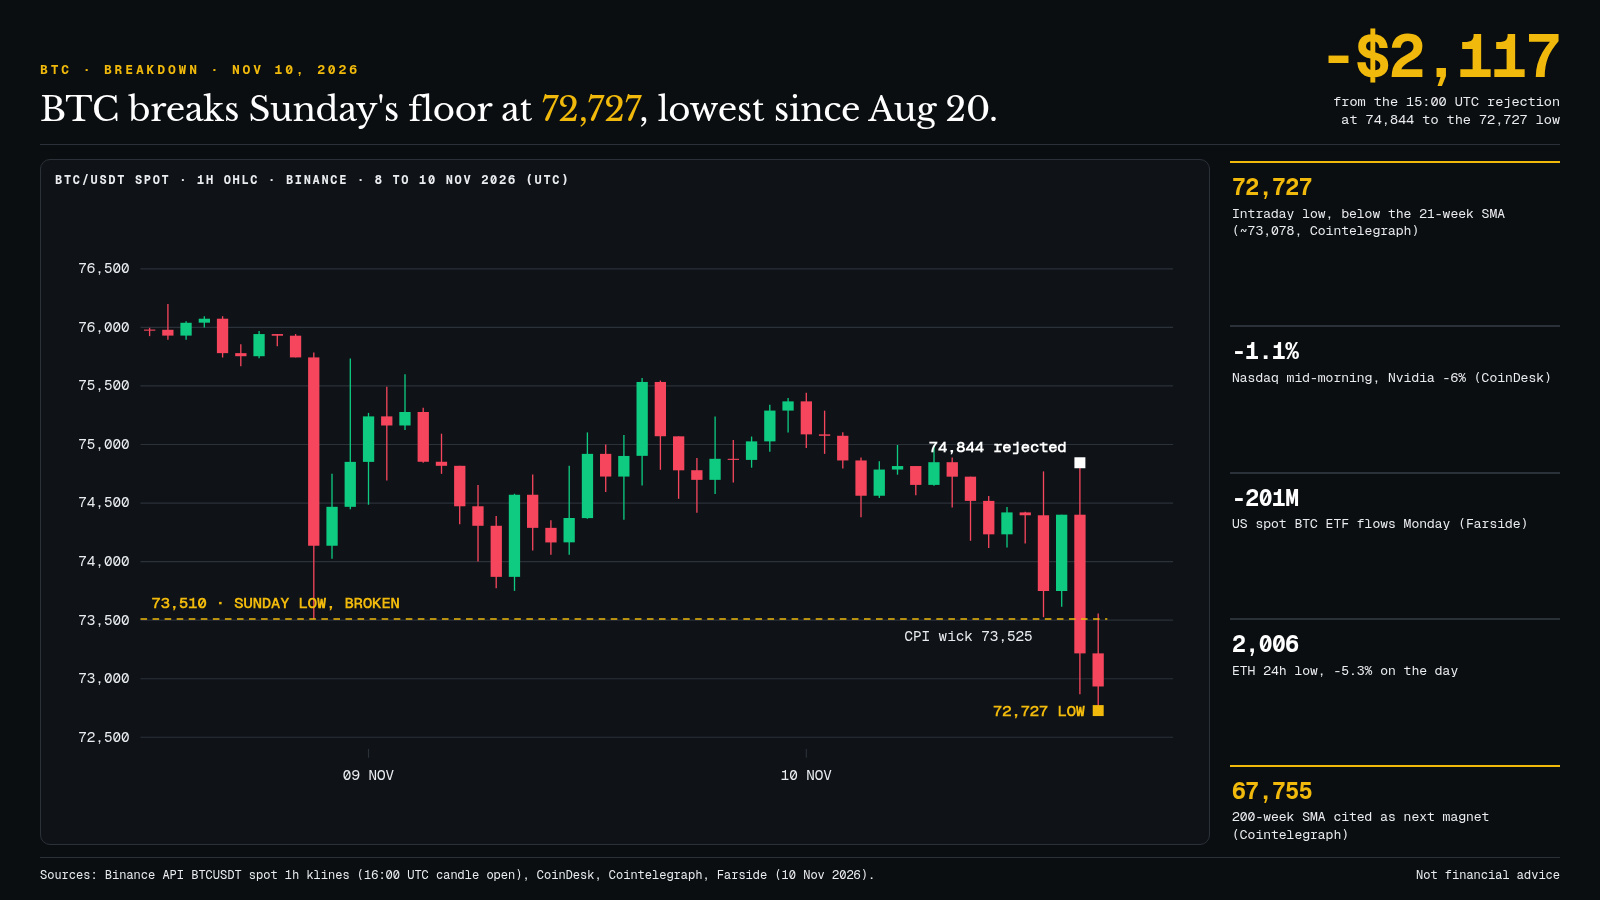
116
·
--
U.S. inflation for October came in hotter than expected (+0.4% month over month versus 0.3% expected, core at +0.3% versus 0.2%), and the $BTC a made the day's most violent round trip in a single minute.
The chart shows the action in 15-minute candles on Binance. At 13:30 UTC, when the BLS released the figures, BTC first rose to $74,770, then plunged to $73,525 in the same minute: a $1,245 swing. That low stopped $15 above Sunday evening's trough ($73,510). An hour later, the price had returned to around $74,200, about $200 below the pre-release level ($74,411).
The accompanying figures: around $200M in long positions liquidated in five minutes, according to BeInCrypto; the $ETH fell to $2,028 from $2,098; and BTCUSDT perpetual open interest rose around 1.6% between 13:30 and 14:30 UTC. No annual figure this time: the BLS did not publish one because it had no October 2025 survey during the shutdown (CoinDesk).
My take: the market flushed out leverage, but immediately added it back. Rising open interest right after a flush is fuel for the next wick, in either direction. And the backdrop remains heavy: BTC ETFs saw outflows of $201M on Monday, while bets on a Fed rate hike in December are growing.
What I'm watching: a 4-hour close above $74,770 would erase the CPI shock. A clear break below $73,500 would open up a zone with no recent support on this chart.
Do you think this hot CPI reading is already priced in, or will the real reaction come with this evening's ETF flows?
#CPI #Bitcoin
U.S. inflation for October came in hotter than expected (+0.4% month over month versus 0.3% expected, core at +0.3% versus 0.2%), and the $BTC a made the day's most violent round trip in a single minute.
The chart shows the action in 15-minute candles on Binance. At 13:30 UTC, when the BLS released the figures, BTC first rose to $74,770, then plunged to $73,525 in the same minute: a $1,245 swing. That low stopped $15 above Sunday evening's trough ($73,510). An hour later, the price had returned to around $74,200, about $200 below the pre-release level ($74,411).
The accompanying figures: around $200M in long positions liquidated in five minutes, according to BeInCrypto; the $ETH fell to $2,028 from $2,098; and BTCUSDT perpetual open interest rose around 1.6% between 13:30 and 14:30 UTC. No annual figure this time: the BLS did not publish one because it had no October 2025 survey during the shutdown (CoinDesk).
My take: the market flushed out leverage, but immediately added it back. Rising open interest right after a flush is fuel for the next wick, in either direction. And the backdrop remains heavy: BTC ETFs saw outflows of $201M on Monday, while bets on a Fed rate hike in December are growing.
What I'm watching: a 4-hour close above $74,770 would erase the CPI shock. A clear break below $73,500 would open up a zone with no recent support on this chart.
Do you think this hot CPI reading is already priced in, or will the real reaction come with this evening's ETF flows?
#CPI #Bitcoin
The chart shows the action in 15-minute candles on Binance. At 13:30 UTC, when the BLS released the figures, BTC first rose to $74,770, then plunged to $73,525 in the same minute: a $1,245 swing. That low stopped $15 above Sunday evening's trough ($73,510). An hour later, the price had returned to around $74,200, about $200 below the pre-release level ($74,411).
The accompanying figures: around $200M in long positions liquidated in five minutes, according to BeInCrypto; the $ETH fell to $2,028 from $2,098; and BTCUSDT perpetual open interest rose around 1.6% between 13:30 and 14:30 UTC. No annual figure this time: the BLS did not publish one because it had no October 2025 survey during the shutdown (CoinDesk).
My take: the market flushed out leverage, but immediately added it back. Rising open interest right after a flush is fuel for the next wick, in either direction. And the backdrop remains heavy: BTC ETFs saw outflows of $201M on Monday, while bets on a Fed rate hike in December are growing.
What I'm watching: a 4-hour close above $74,770 would erase the CPI shock. A clear break below $73,500 would open up a zone with no recent support on this chart.
Do you think this hot CPI reading is already priced in, or will the real reaction come with this evening's ETF flows?
#CPI #Bitcoin
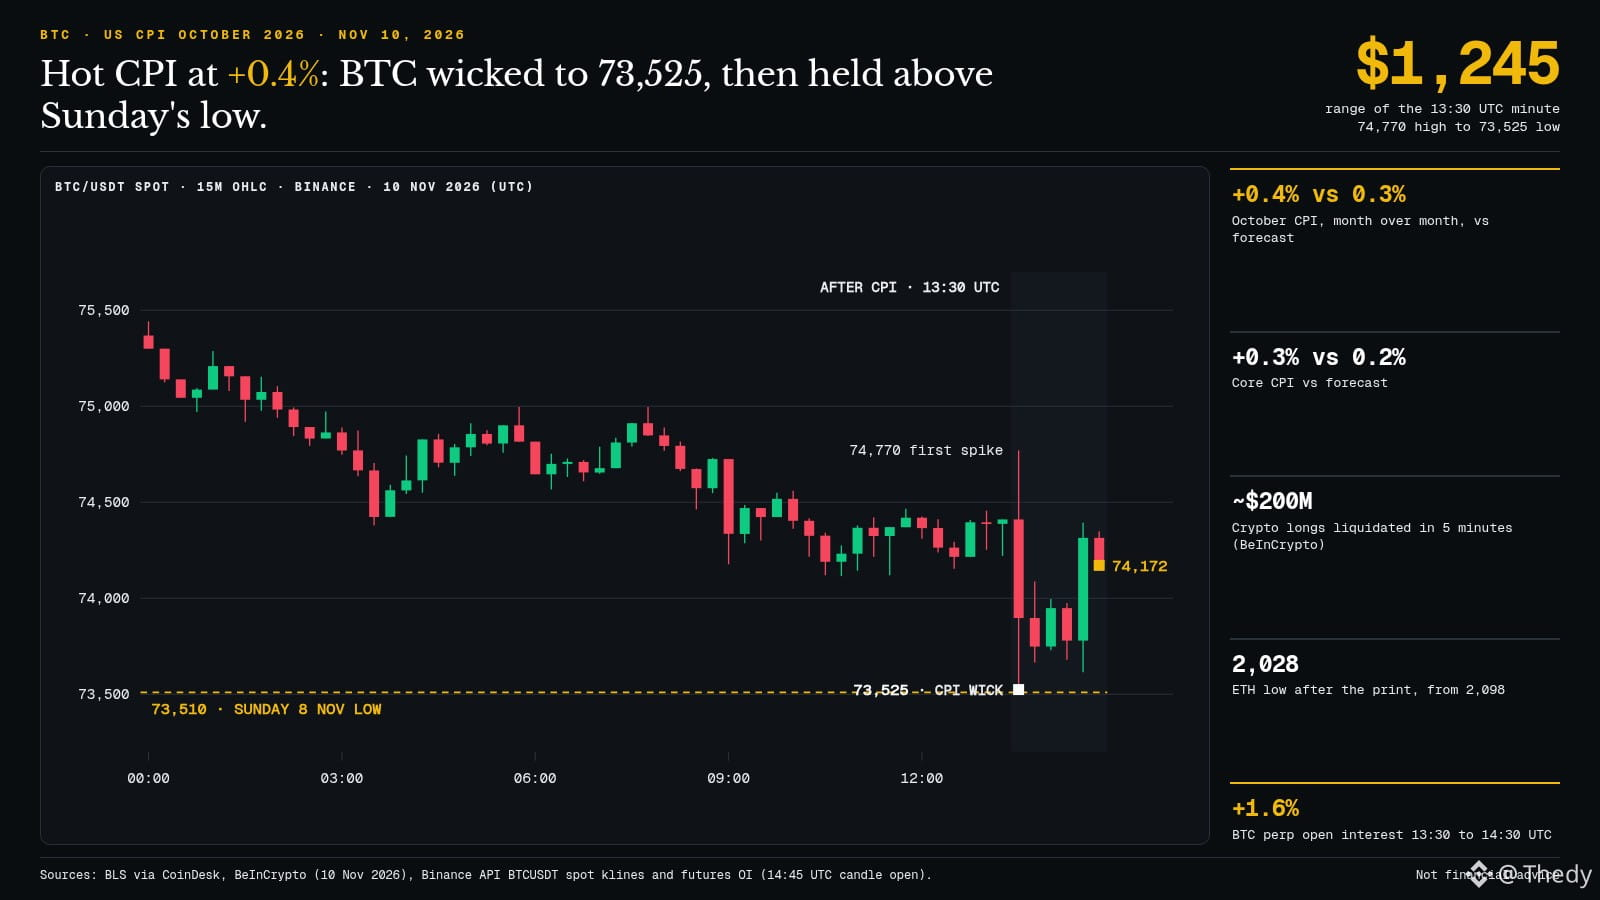
96
·
--
The XRP Ledger has a concrete plan for quantum computers: each account could add a quantum-resistant signing key, then disable the old one, at no extra cost. It’s laid out in the XRP Ledger Foundation’s quantum study, included in its roadmap updated on November 4 (via CoinDesk, 10/11).
As soon as an account signs a transaction, it exposes its public key. A powerful enough quantum computer could derive the secret key from it. Any account that has already sent a payment is at risk, including exchange wallets.
The new key uses ML-DSA-44, a scheme validated by NIST in 2024. It’s bulky: the key and signature weigh 3,732 bytes, compared with 105 for a regular payment. In storage, that’s 5,331 bytes per protected payment versus 1,704 today, about three times as much. Base fees won’t change (they’re burned on XRPL); node operators will absorb the extra cost.
What’s still missing: a bug means the Python prototype and the server and JavaScript versions don’t generate the same key from the same seed, and no network test has been published with all validators using post-quantum signatures. Timeline: a migration study in the first half of 2027, development and an audit in late 2027 or 2028, with Ripple aiming for a complete transition in 2028.
On the market side, $XRP remains under pressure at $1.087 on Binance around 09:45 UTC (24-hour low: $1.076). My take: not a short-term price catalyst, but rather a long-term argument in the quantum debate, which also affects $BTC. If the bug is fixed and tests are published in early 2027, the plan gains credibility. If the timeline slips beyond 2028, it loses its strength.
Would you disable your old key as soon as the option is available, or wait until the threat becomes real?
#XRP #Quantum
The XRP Ledger has a concrete plan for quantum computers: each account could add a quantum-resistant signing key, then disable the old one, at no extra cost. It’s laid out in the XRP Ledger Foundation’s quantum study, included in its roadmap updated on November 4 (via CoinDesk, 10/11).
As soon as an account signs a transaction, it exposes its public key. A powerful enough quantum computer could derive the secret key from it. Any account that has already sent a payment is at risk, including exchange wallets.
The new key uses ML-DSA-44, a scheme validated by NIST in 2024. It’s bulky: the key and signature weigh 3,732 bytes, compared with 105 for a regular payment. In storage, that’s 5,331 bytes per protected payment versus 1,704 today, about three times as much. Base fees won’t change (they’re burned on XRPL); node operators will absorb the extra cost.
What’s still missing: a bug means the Python prototype and the server and JavaScript versions don’t generate the same key from the same seed, and no network test has been published with all validators using post-quantum signatures. Timeline: a migration study in the first half of 2027, development and an audit in late 2027 or 2028, with Ripple aiming for a complete transition in 2028.
On the market side, $XRP remains under pressure at $1.087 on Binance around 09:45 UTC (24-hour low: $1.076). My take: not a short-term price catalyst, but rather a long-term argument in the quantum debate, which also affects $BTC . If the bug is fixed and tests are published in early 2027, the plan gains credibility. If the timeline slips beyond 2028, it loses its strength.
Would you disable your old key as soon as the option is available, or wait until the threat becomes real?
#XRP #Quantum
As soon as an account signs a transaction, it exposes its public key. A powerful enough quantum computer could derive the secret key from it. Any account that has already sent a payment is at risk, including exchange wallets.
The new key uses ML-DSA-44, a scheme validated by NIST in 2024. It’s bulky: the key and signature weigh 3,732 bytes, compared with 105 for a regular payment. In storage, that’s 5,331 bytes per protected payment versus 1,704 today, about three times as much. Base fees won’t change (they’re burned on XRPL); node operators will absorb the extra cost.
What’s still missing: a bug means the Python prototype and the server and JavaScript versions don’t generate the same key from the same seed, and no network test has been published with all validators using post-quantum signatures. Timeline: a migration study in the first half of 2027, development and an audit in late 2027 or 2028, with Ripple aiming for a complete transition in 2028.
On the market side, $XRP remains under pressure at $1.087 on Binance around 09:45 UTC (24-hour low: $1.076). My take: not a short-term price catalyst, but rather a long-term argument in the quantum debate, which also affects $BTC . If the bug is fixed and tests are published in early 2027, the plan gains credibility. If the timeline slips beyond 2028, it loses its strength.
Would you disable your old key as soon as the option is available, or wait until the threat becomes real?
#XRP #Quantum
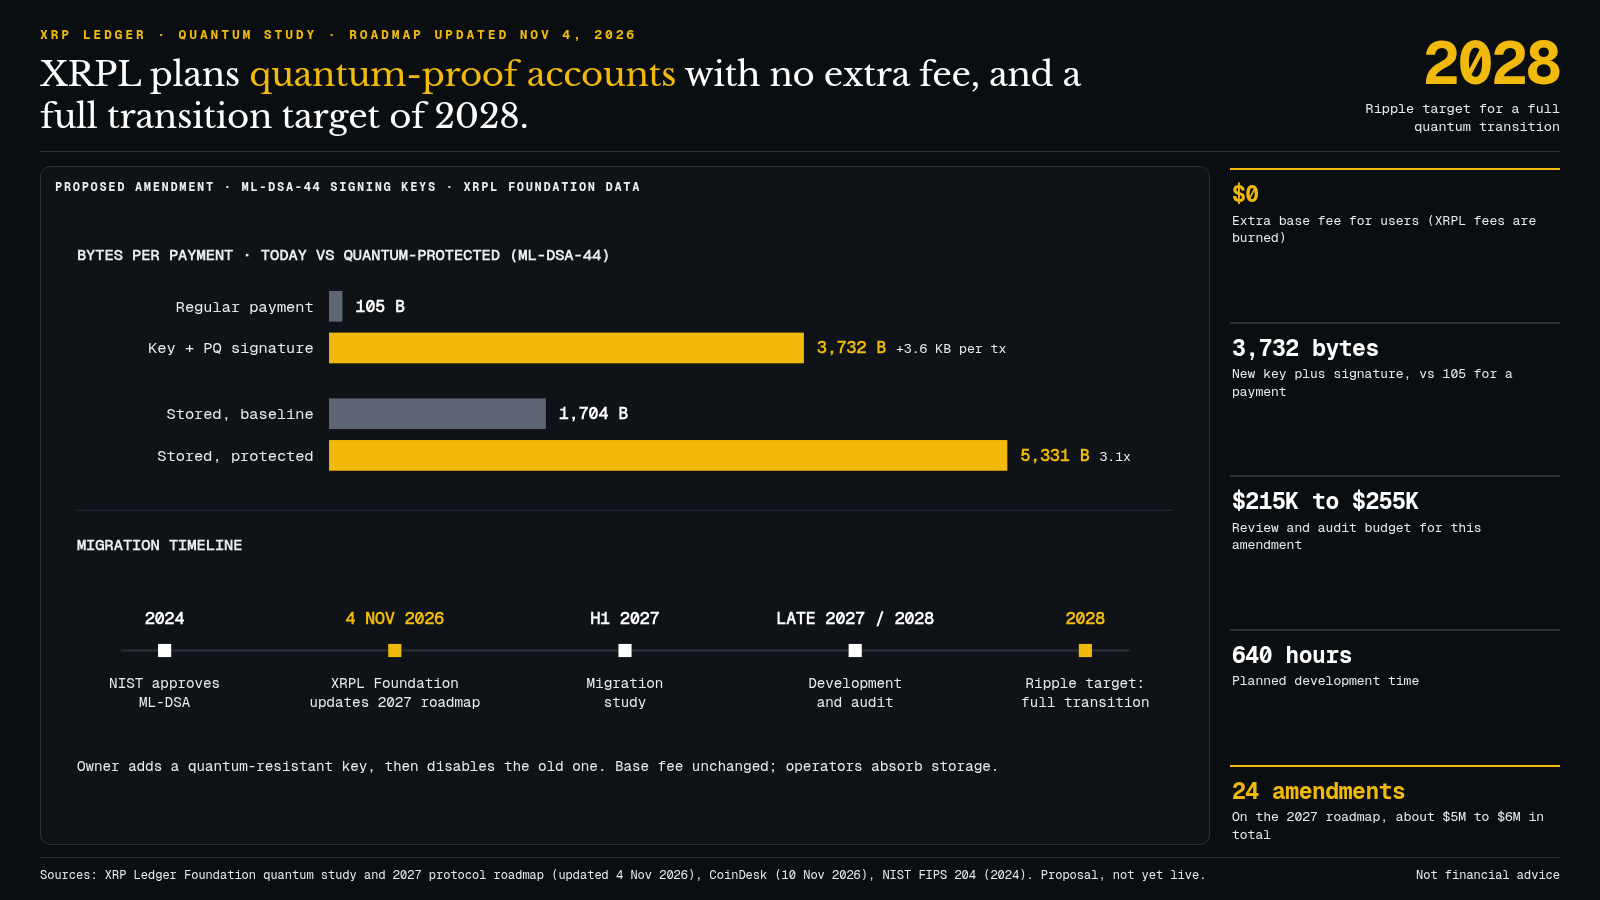
109
·
--
MARA Holdings, one of the largest publicly traded bitcoin miners in the United States, sold 13,597 $BTC in about six weeks, or 40% of the 34,012 BTC it held at the end of September. Average price: $81,039, for about $1.1 billion (Q3 shareholder letter published Monday, reported by CoinDesk on November 10).
1/ Where the money went. $750 million was used to repay bitcoin-backed loans, freeing up 17,477 BTC that had been used as collateral. The share of its holdings that is loaned or pledged as collateral fell to less than 5%, from 57% at the end of September.
2/ The shift is deliberate. In July 2024, MARA promised to keep every bitcoin it mined. Today, the company says it plans to continue selling to fund AI, with a share buyback authorized for up to $500 million and bondholders able to demand early repayment starting next year. More than 40,000 BTC sold since January.
3/ The timing wasn't bad. On Binance, BTC is at $74,970 this morning (07:46 UTC), after hitting a low of $73,510 on Sunday. My calculation: selling the same volume today would have brought in about $83 million less.
4/ What this says about the market. Mining is less profitable (Q3 revenue down 35%, to $164 million), and miners are turning into data center companies. They are another source of structural selling at a time when U.S. bitcoin ETFs saw $201 million in outflows on Monday, according to SoSoValue.
To watch today: U.S. CPI at 13:30 UTC. A soft reading could bring BTC back toward $77,000–$78,000; a break below $73,000 (support cited by CoinDesk analysts) would put these miner sales back at the center of the narrative.
Do you see MARA as a prudent seller that cleaned up its balance sheet at the right time, or as a sign that the “mine and hold” model is dead?
#Bitcoin #MARA
MARA Holdings, one of the largest publicly traded bitcoin miners in the United States, sold 13,597 $BTC in about six weeks, or 40% of the 34,012 BTC it held at the end of September. Average price: $81,039, for about $1.1 billion (Q3 shareholder letter published Monday, reported by CoinDesk on November 10).
1/ Where the money went. $750 million was used to repay bitcoin-backed loans, freeing up 17,477 BTC that had been used as collateral. The share of its holdings that is loaned or pledged as collateral fell to less than 5%, from 57% at the end of September.
2/ The shift is deliberate. In July 2024, MARA promised to keep every bitcoin it mined. Today, the company says it plans to continue selling to fund AI, with a share buyback authorized for up to $500 million and bondholders able to demand early repayment starting next year. More than 40,000 BTC sold since January.
3/ The timing wasn't bad. On Binance, BTC is at $74,970 this morning (07:46 UTC), after hitting a low of $73,510 on Sunday. My calculation: selling the same volume today would have brought in about $83 million less.
4/ What this says about the market. Mining is less profitable (Q3 revenue down 35%, to $164 million), and miners are turning into data center companies. They are another source of structural selling at a time when U.S. bitcoin ETFs saw $201 million in outflows on Monday, according to SoSoValue.
To watch today: U.S. CPI at 13:30 UTC. A soft reading could bring BTC back toward $77,000–$78,000; a break below $73,000 (support cited by CoinDesk analysts) would put these miner sales back at the center of the narrative.
Do you see MARA as a prudent seller that cleaned up its balance sheet at the right time, or as a sign that the “mine and hold” model is dead?
#Bitcoin #MARA
1/ Where the money went. $750 million was used to repay bitcoin-backed loans, freeing up 17,477 BTC that had been used as collateral. The share of its holdings that is loaned or pledged as collateral fell to less than 5%, from 57% at the end of September.
2/ The shift is deliberate. In July 2024, MARA promised to keep every bitcoin it mined. Today, the company says it plans to continue selling to fund AI, with a share buyback authorized for up to $500 million and bondholders able to demand early repayment starting next year. More than 40,000 BTC sold since January.
3/ The timing wasn't bad. On Binance, BTC is at $74,970 this morning (07:46 UTC), after hitting a low of $73,510 on Sunday. My calculation: selling the same volume today would have brought in about $83 million less.
4/ What this says about the market. Mining is less profitable (Q3 revenue down 35%, to $164 million), and miners are turning into data center companies. They are another source of structural selling at a time when U.S. bitcoin ETFs saw $201 million in outflows on Monday, according to SoSoValue.
To watch today: U.S. CPI at 13:30 UTC. A soft reading could bring BTC back toward $77,000–$78,000; a break below $73,000 (support cited by CoinDesk analysts) would put these miner sales back at the center of the narrative.
Do you see MARA as a prudent seller that cleaned up its balance sheet at the right time, or as a sign that the “mine and hold” model is dead?
#Bitcoin #MARA
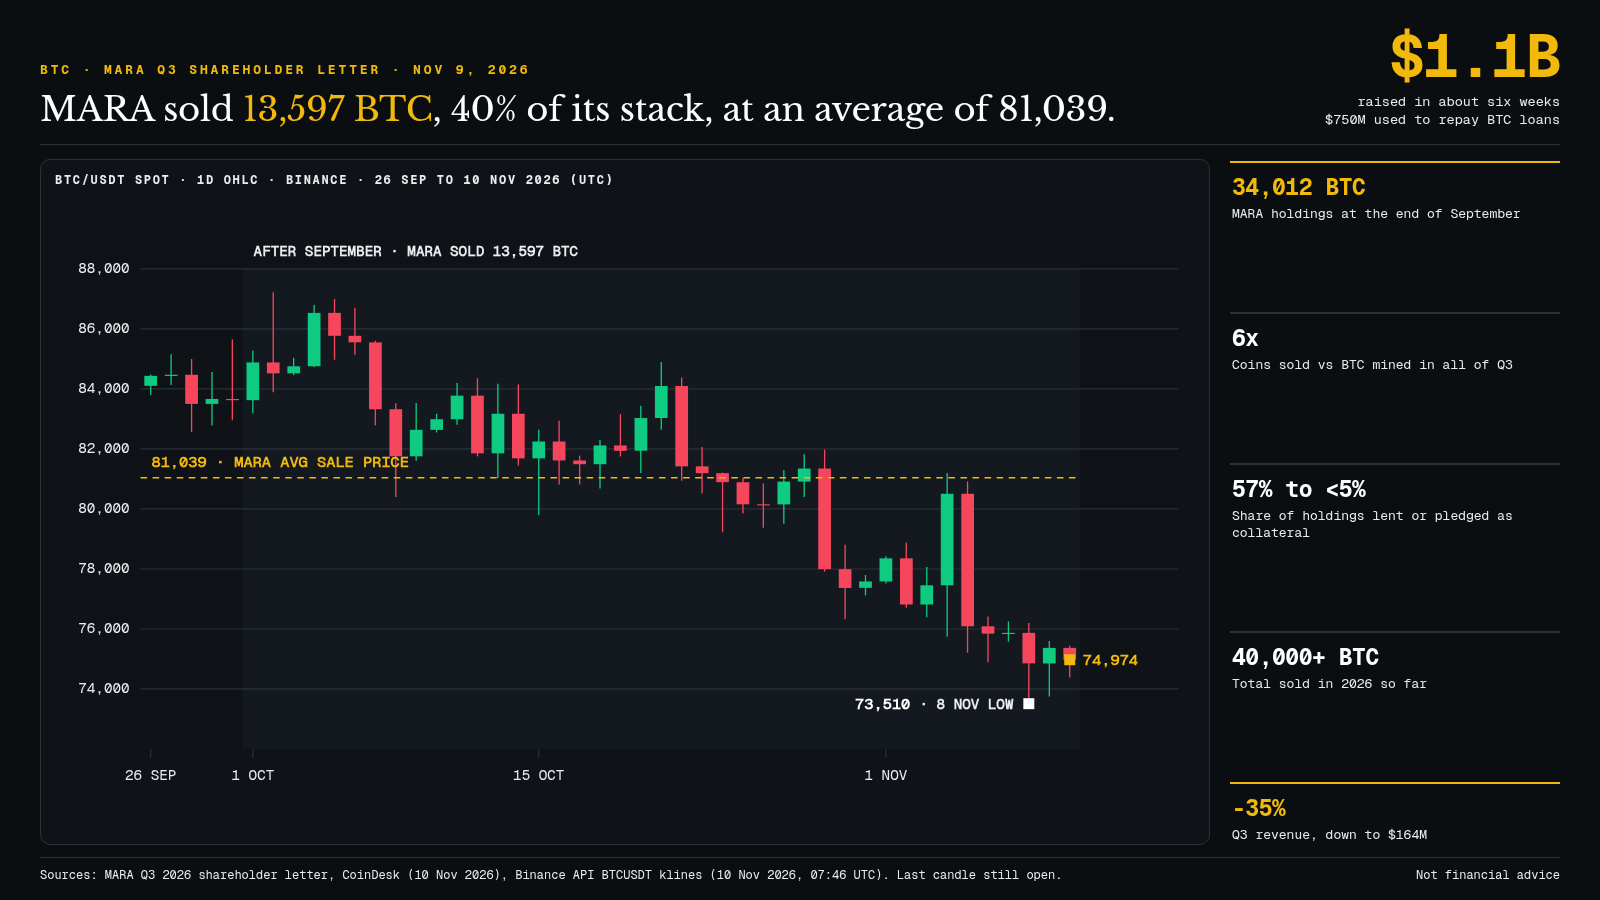
98
·
--
The $BTC fell back below Strategy’s average cost basis: about $74,600 on Binance at 18:45 UTC, versus an average of $75,456 paid for its 850,364 BTC.
The chart shows the scene in 4-hour candles. Strategy bought 1,036 BTC between November 2 and 8, at an average price of $79,012 (8-K published this Monday). The market fell below that price on November 6, then Sunday evening’s flush hit $73,510, the lowest since August.
What struck me most in the SEC filing was how the cash was allocated. Strategy sold 2.05 million MSTR shares for net proceeds of $283.8 million. Of that amount, $188.3 million went toward repurchasing its STRC preferred shares, just $81.9 million went into bitcoin, and $13.6 million remained in cash. According to Cointelegraph, since early October, STRC buybacks have reached about $1.06 billion, nearly five times the $219.7 million put into BTC.
My calculation, at the 18:45 UTC price: about $0.7 billion in unrealized losses on holdings acquired for $64.16 billion. Nothing alarming in itself—Strategy has a $4.77 billion cash reserve. But the message is clear: the priority right now is defending STRC, not accelerating purchases.
What I’m watching:
- A firm move back above $75,456 would put the holdings back in profit and cool the “Saylor underwater” narrative;
- A close below $73,500 would turn this average cost into resistance, with Tuesday’s US CPI as a possible catalyst.
Do you read this choice as financial prudence, or as a sign that corporate demand for BTC is waning?
#Bitcoin #Strategy
The $BTC fell back below Strategy’s average cost basis: about $74,600 on Binance at 18:45 UTC, versus an average of $75,456 paid for its 850,364 BTC.
The chart shows the scene in 4-hour candles. Strategy bought 1,036 BTC between November 2 and 8, at an average price of $79,012 (8-K published this Monday). The market fell below that price on November 6, then Sunday evening’s flush hit $73,510, the lowest since August.
What struck me most in the SEC filing was how the cash was allocated. Strategy sold 2.05 million MSTR shares for net proceeds of $283.8 million. Of that amount, $188.3 million went toward repurchasing its STRC preferred shares, just $81.9 million went into bitcoin, and $13.6 million remained in cash. According to Cointelegraph, since early October, STRC buybacks have reached about $1.06 billion, nearly five times the $219.7 million put into BTC.
My calculation, at the 18:45 UTC price: about $0.7 billion in unrealized losses on holdings acquired for $64.16 billion. Nothing alarming in itself—Strategy has a $4.77 billion cash reserve. But the message is clear: the priority right now is defending STRC, not accelerating purchases.
What I’m watching:
- A firm move back above $75,456 would put the holdings back in profit and cool the “Saylor underwater” narrative;
- A close below $73,500 would turn this average cost into resistance, with Tuesday’s US CPI as a possible catalyst.
Do you read this choice as financial prudence, or as a sign that corporate demand for BTC is waning?
#Bitcoin #Strategy
The chart shows the scene in 4-hour candles. Strategy bought 1,036 BTC between November 2 and 8, at an average price of $79,012 (8-K published this Monday). The market fell below that price on November 6, then Sunday evening’s flush hit $73,510, the lowest since August.
What struck me most in the SEC filing was how the cash was allocated. Strategy sold 2.05 million MSTR shares for net proceeds of $283.8 million. Of that amount, $188.3 million went toward repurchasing its STRC preferred shares, just $81.9 million went into bitcoin, and $13.6 million remained in cash. According to Cointelegraph, since early October, STRC buybacks have reached about $1.06 billion, nearly five times the $219.7 million put into BTC.
My calculation, at the 18:45 UTC price: about $0.7 billion in unrealized losses on holdings acquired for $64.16 billion. Nothing alarming in itself—Strategy has a $4.77 billion cash reserve. But the message is clear: the priority right now is defending STRC, not accelerating purchases.
What I’m watching:
- A firm move back above $75,456 would put the holdings back in profit and cool the “Saylor underwater” narrative;
- A close below $73,500 would turn this average cost into resistance, with Tuesday’s US CPI as a possible catalyst.
Do you read this choice as financial prudence, or as a sign that corporate demand for BTC is waning?
#Bitcoin #Strategy
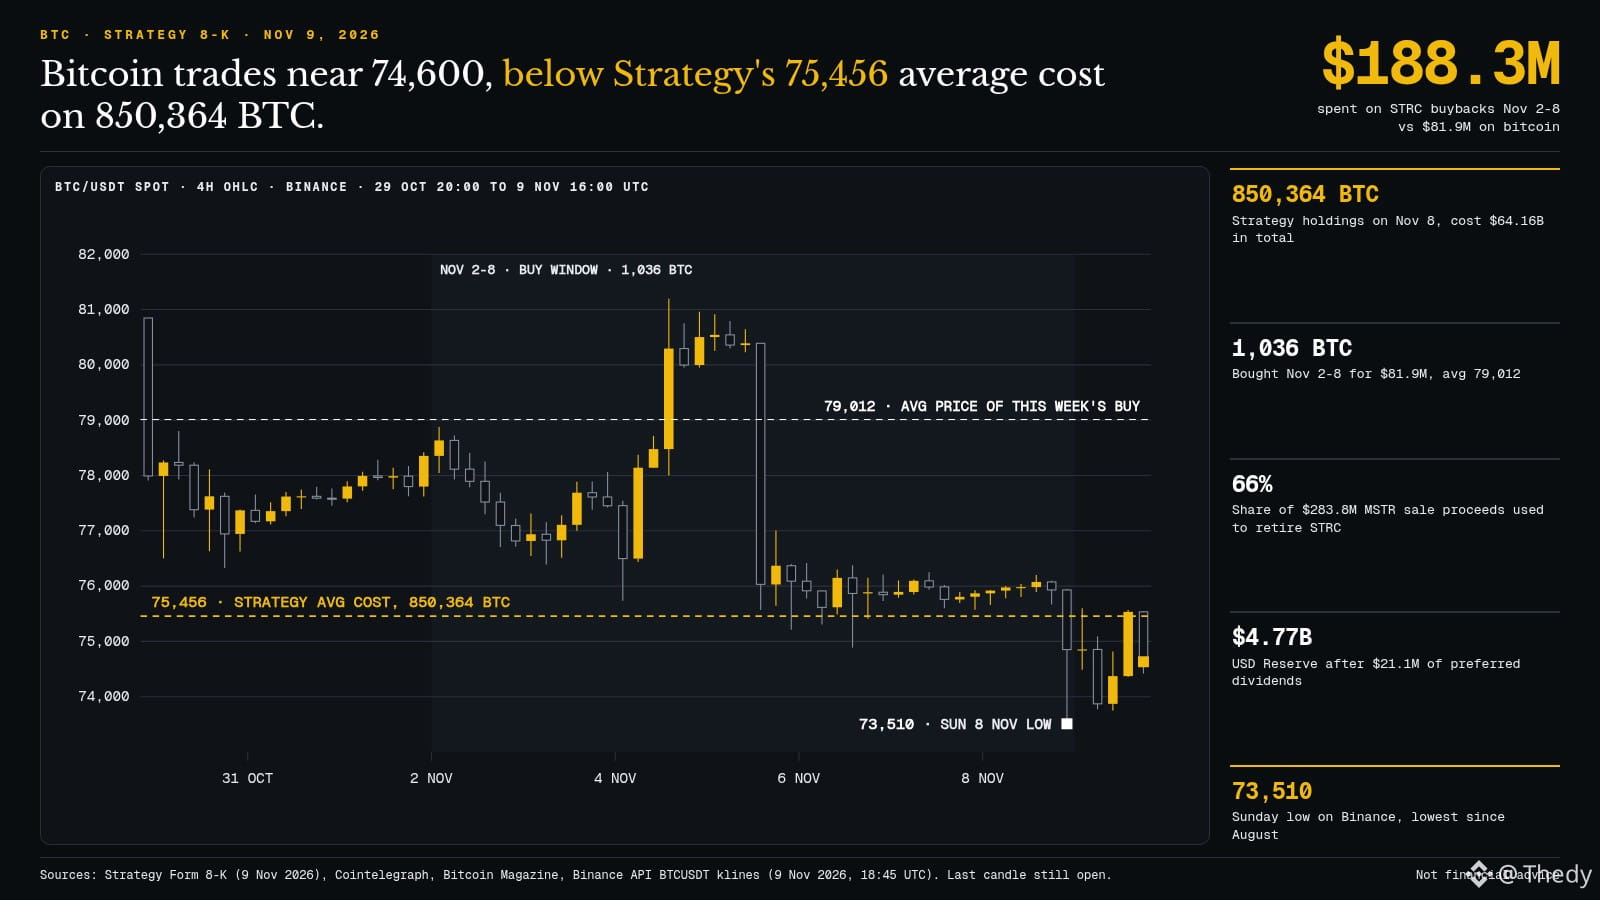
26
Log in to explore more content
Join global crypto users on Binance Square
⚡️ Get latest and useful information about crypto.
💬 Trusted by the world’s largest crypto exchange.
👍 Discover real insights from verified creators.
Email / Phone number
Trending Topics
WhatWillDriveCryptoandStocks’NextRebound?
58,830 views
825 Discussing
Bitcoin Slips Below $70,000 as Dollar Index Hits 19-Month High
Binance News
·17 Likes
·37.6k views
Anthropic’s6xIPODemandSignalsPotentialRecordRaise
18,697 views
388 Discussing
USCryptoETFsLose$1.48BInFiveDays
272 views
10 Discussing