

#writetoearn2026
writetoearn2026
105,563 views
639 Discussing
Hot
Latest

·
--
Bullish
$XRP
{spot}(XRPUSDT)
XRP's price increased to $1.5509 on September 25, marking a 1.09% rise. Over the three trading sessions from September 22 to 24, U.S. spot XRP exchange-traded funds (ETFs) attracted around $52.95 million in net inflows, indicating strong investor interest. Bitwise and Franklin's XRP ETFs were notable recipients, with Bitwise receiving nearly $9.9 million on September 24. These inflows reflect capital moving into XRP-related investment products, which could support the token's market demand going forward.
XRP trades at Rp27,551 on Pluang as of September 25, 2026, 15:51 WIB, showing a 3.74% gain in the past day. The token's market cap stands at Rp1.726,73 trillion, with a 24-hour trading volume of Rp88,23 trillion. Despite a majority of sell orders at 56%, typical holders keep XRP for around 71 days on the platform.
#xrp320 #Trendingcoin320 #mr320 #WriteToEarn2026 #Trendingissue
$XRP
XRP's price increased to $1.5509 on September 25, marking a 1.09% rise. Over the three trading sessions from September 22 to 24, U.S. spot XRP exchange-traded funds (ETFs) attracted around $52.95 million in net inflows, indicating strong investor interest. Bitwise and Franklin's XRP ETFs were notable recipients, with Bitwise receiving nearly $9.9 million on September 24. These inflows reflect capital moving into XRP-related investment products, which could support the token's market demand going forward.
XRP trades at Rp27,551 on Pluang as of September 25, 2026, 15:51 WIB, showing a 3.74% gain in the past day. The token's market cap stands at Rp1.726,73 trillion, with a 24-hour trading volume of Rp88,23 trillion. Despite a majority of sell orders at 56%, typical holders keep XRP for around 71 days on the platform.
#xrp320 #Trendingcoin320 #mr320 #WriteToEarn2026 #Trendingissue
XRP's price increased to $1.5509 on September 25, marking a 1.09% rise. Over the three trading sessions from September 22 to 24, U.S. spot XRP exchange-traded funds (ETFs) attracted around $52.95 million in net inflows, indicating strong investor interest. Bitwise and Franklin's XRP ETFs were notable recipients, with Bitwise receiving nearly $9.9 million on September 24. These inflows reflect capital moving into XRP-related investment products, which could support the token's market demand going forward.
XRP trades at Rp27,551 on Pluang as of September 25, 2026, 15:51 WIB, showing a 3.74% gain in the past day. The token's market cap stands at Rp1.726,73 trillion, with a 24-hour trading volume of Rp88,23 trillion. Despite a majority of sell orders at 56%, typical holders keep XRP for around 71 days on the platform.
#xrp320 #Trendingcoin320 #mr320 #WriteToEarn2026 #Trendingissue
38
·
--
Bullish
$SOL
{spot}(SOLUSDT)
🚨Solana poised for further rally🚨
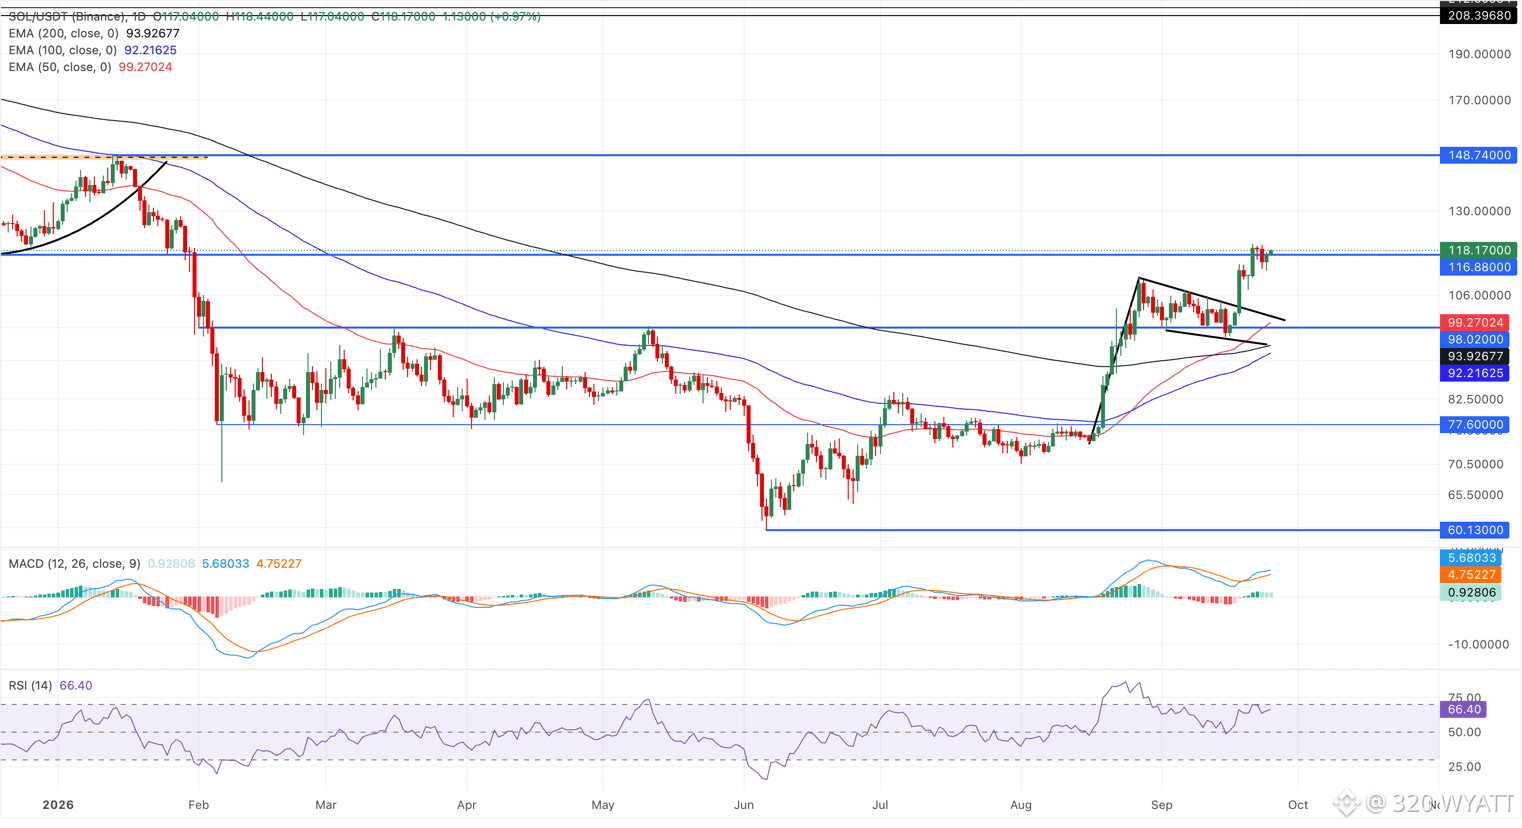
Solana trades around $118 on Friday, following a roughly 2% rebound the previous day. The altcoin holds significantly above the 50-, 100-, and 200-day EMAs at $99.27, $92.22, and $93.93, respectively, underpinning a constructive bullish bias.
From a technical perspective, the price is extending a breakout rally from a bullish flag pattern, marked by the 10% rally on September 18. To further extend the rally, Solana must confirm a bullish breakout of the December 18 low at $116.88, which could open the path toward the January 6 high at $148.74.
Momentum aligns with this stance, as the MACD remains above its signal line in positive territory, with a mildly positive histogram, while the RSI at 66 suggests firm bullish momentum without yet signaling extreme overbought conditions.
On the flip side, crucial support for Solana emerges at the broken trendline near the $100 psychological level, with the 50-day EMA at $99.21 reinforcing it.
#solana320 #mr320 #Trendingcoin320 #Trendingissue #writetoearn2026
$SOL
🚨Solana poised for further rally🚨
Solana trades around $118 on Friday, following a roughly 2% rebound the previous day. The altcoin holds significantly above the 50-, 100-, and 200-day EMAs at $99.27, $92.22, and $93.93, respectively, underpinning a constructive bullish bias.
From a technical perspective, the price is extending a breakout rally from a bullish flag pattern, marked by the 10% rally on September 18. To further extend the rally, Solana must confirm a bullish breakout of the December 18 low at $116.88, which could open the path toward the January 6 high at $148.74.
Momentum aligns with this stance, as the MACD remains above its signal line in positive territory, with a mildly positive histogram, while the RSI at 66 suggests firm bullish momentum without yet signaling extreme overbought conditions.
On the flip side, crucial support for Solana emerges at the broken trendline near the $100 psychological level, with the 50-day EMA at $99.21 reinforcing it.
#solana320 #mr320 #Trendingcoin320 #Trendingissue #writetoearn2026
🚨Solana poised for further rally🚨
Solana trades around $118 on Friday, following a roughly 2% rebound the previous day. The altcoin holds significantly above the 50-, 100-, and 200-day EMAs at $99.27, $92.22, and $93.93, respectively, underpinning a constructive bullish bias.
From a technical perspective, the price is extending a breakout rally from a bullish flag pattern, marked by the 10% rally on September 18. To further extend the rally, Solana must confirm a bullish breakout of the December 18 low at $116.88, which could open the path toward the January 6 high at $148.74.
Momentum aligns with this stance, as the MACD remains above its signal line in positive territory, with a mildly positive histogram, while the RSI at 66 suggests firm bullish momentum without yet signaling extreme overbought conditions.
On the flip side, crucial support for Solana emerges at the broken trendline near the $100 psychological level, with the 50-day EMA at $99.21 reinforcing it.
#solana320 #mr320 #Trendingcoin320 #Trendingissue #writetoearn2026
23
·
--
Bullish
$ADA
{spot}(ADAUSDT)
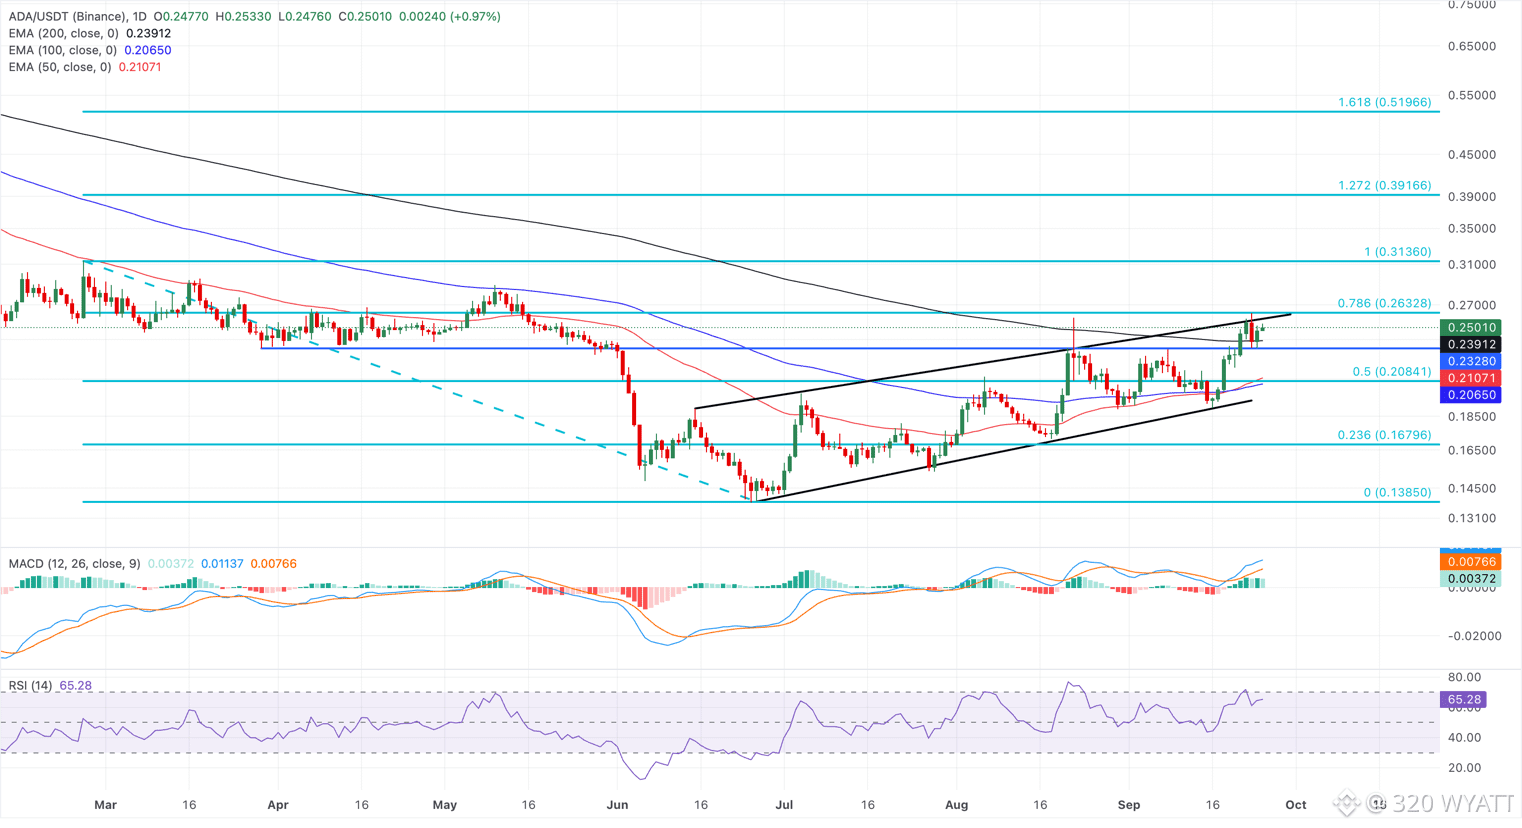
Cardano hovers around $0.2500 at press time on Friday, following a 4% rebound the previous day. The ADA token tests an overhead resistance trendline of the rising channel pattern, reinforced by the 78.6% Fibonacci retracement level at $0.2632, measured from $0.3136 to $0.1385.
A confirmed breakout above this resistance cluster could target the $0.3136 swing high, with upside toward the 1.272 Fibonacci extension level at $0.3916.
Momentum gauges back the constructive tone, with the RSI near 65 and the MACD in positive territory with a positive histogram, suggesting buyers retain control, albeit with conditions edging towards overbought.
On the flip side, the 200-day EMA at $0.2420 and the March 29 low at $0.2328 serve as the immediate support level, guarding the downside to the 50% retracement level at $0.2841, reinforced by the 50- and 100-day EMAs at $0.2106 and $0.2066, respectively.
#Ada320 #mr320 #Trendingcoin320 #Trendingissue #WriteToEarn2026
$ADA
Cardano hovers around $0.2500 at press time on Friday, following a 4% rebound the previous day. The ADA token tests an overhead resistance trendline of the rising channel pattern, reinforced by the 78.6% Fibonacci retracement level at $0.2632, measured from $0.3136 to $0.1385.
A confirmed breakout above this resistance cluster could target the $0.3136 swing high, with upside toward the 1.272 Fibonacci extension level at $0.3916.
Momentum gauges back the constructive tone, with the RSI near 65 and the MACD in positive territory with a positive histogram, suggesting buyers retain control, albeit with conditions edging towards overbought.
On the flip side, the 200-day EMA at $0.2420 and the March 29 low at $0.2328 serve as the immediate support level, guarding the downside to the 50% retracement level at $0.2841, reinforced by the 50- and 100-day EMAs at $0.2106 and $0.2066, respectively.
#Ada320 #mr320 #Trendingcoin320 #Trendingissue #WriteToEarn2026
Cardano hovers around $0.2500 at press time on Friday, following a 4% rebound the previous day. The ADA token tests an overhead resistance trendline of the rising channel pattern, reinforced by the 78.6% Fibonacci retracement level at $0.2632, measured from $0.3136 to $0.1385.
A confirmed breakout above this resistance cluster could target the $0.3136 swing high, with upside toward the 1.272 Fibonacci extension level at $0.3916.
Momentum gauges back the constructive tone, with the RSI near 65 and the MACD in positive territory with a positive histogram, suggesting buyers retain control, albeit with conditions edging towards overbought.
On the flip side, the 200-day EMA at $0.2420 and the March 29 low at $0.2328 serve as the immediate support level, guarding the downside to the 50% retracement level at $0.2841, reinforced by the 50- and 100-day EMAs at $0.2106 and $0.2066, respectively.
#Ada320 #mr320 #Trendingcoin320 #Trendingissue #WriteToEarn2026
16
·
--
Bullish
$XRP
{spot}(XRPUSDT)
🚨Ripple takes a rebound above $1.50🚨
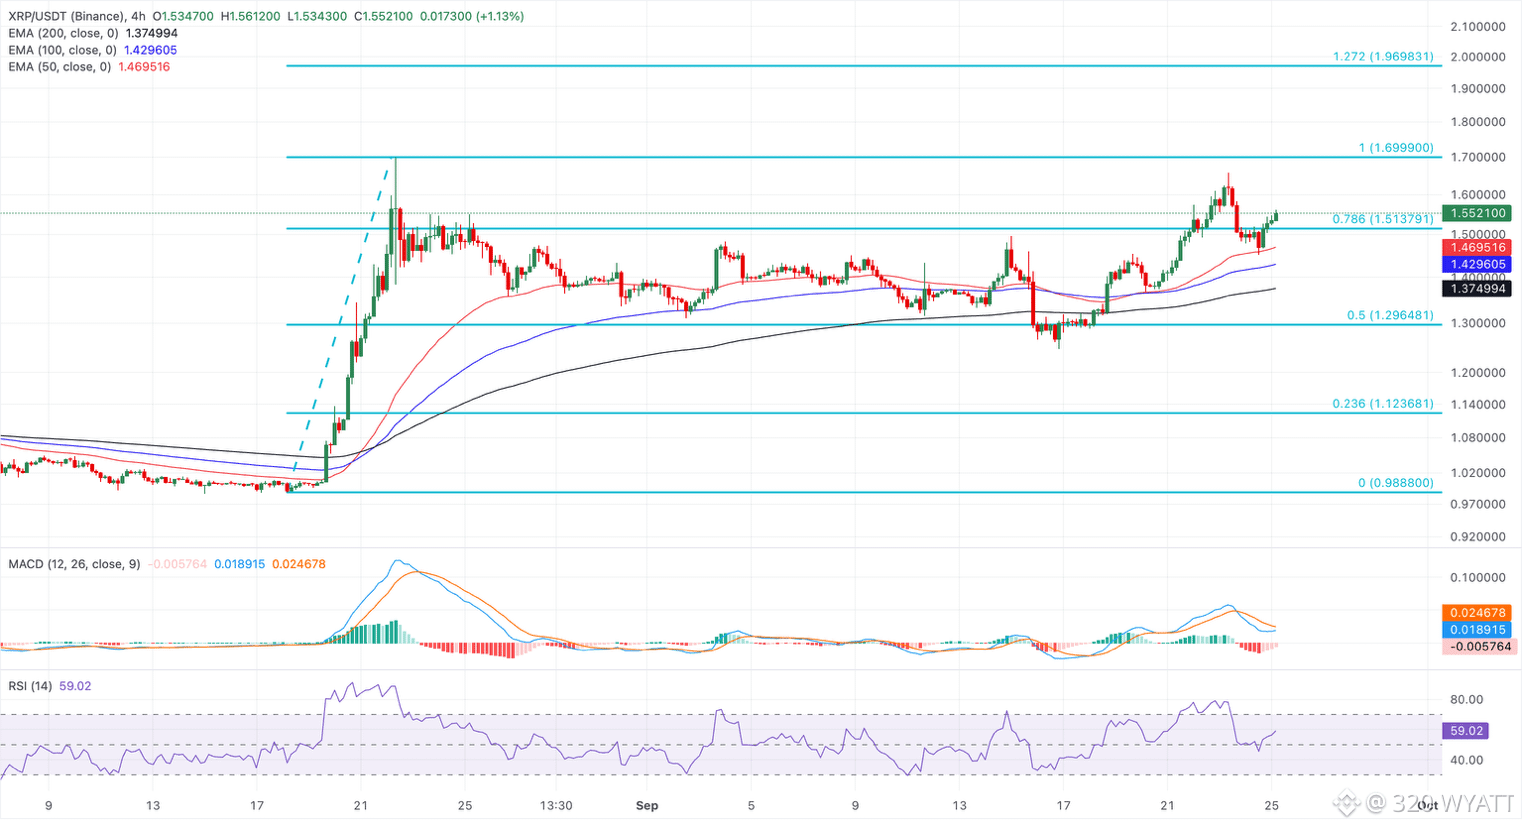
Ripple trades above $1.55 at press time on Friday, maintaining a constructive near-term bias. The cross-border remittance token stays clearly above the 50-, 100- and 200-period Exponential Moving Averages (EMAs) on the four-hour chart, which fan out positively, hinting at an intact uptrend structure.
Momentum is moderately supportive on the same chart, with the Relative Strength Index (RSI) hovering just under 60, while the Moving Average Convergence Divergence (MACD) remains marginally below zero, suggesting the latest advance is slowing but not yet reversing.
#xrp320 #mr320 #Trendingcoin320 #Trendingissue #WriteToEarn2026
$XRP
🚨Ripple takes a rebound above $1.50🚨
Ripple trades above $1.55 at press time on Friday, maintaining a constructive near-term bias. The cross-border remittance token stays clearly above the 50-, 100- and 200-period Exponential Moving Averages (EMAs) on the four-hour chart, which fan out positively, hinting at an intact uptrend structure.
Momentum is moderately supportive on the same chart, with the Relative Strength Index (RSI) hovering just under 60, while the Moving Average Convergence Divergence (MACD) remains marginally below zero, suggesting the latest advance is slowing but not yet reversing.
#xrp320 #mr320 #Trendingcoin320 #Trendingissue #WriteToEarn2026
🚨Ripple takes a rebound above $1.50🚨
Ripple trades above $1.55 at press time on Friday, maintaining a constructive near-term bias. The cross-border remittance token stays clearly above the 50-, 100- and 200-period Exponential Moving Averages (EMAs) on the four-hour chart, which fan out positively, hinting at an intact uptrend structure.
Momentum is moderately supportive on the same chart, with the Relative Strength Index (RSI) hovering just under 60, while the Moving Average Convergence Divergence (MACD) remains marginally below zero, suggesting the latest advance is slowing but not yet reversing.
#xrp320 #mr320 #Trendingcoin320 #Trendingissue #WriteToEarn2026
14
·
--
Bullish
$BTC
{spot}(BTCUSDT)
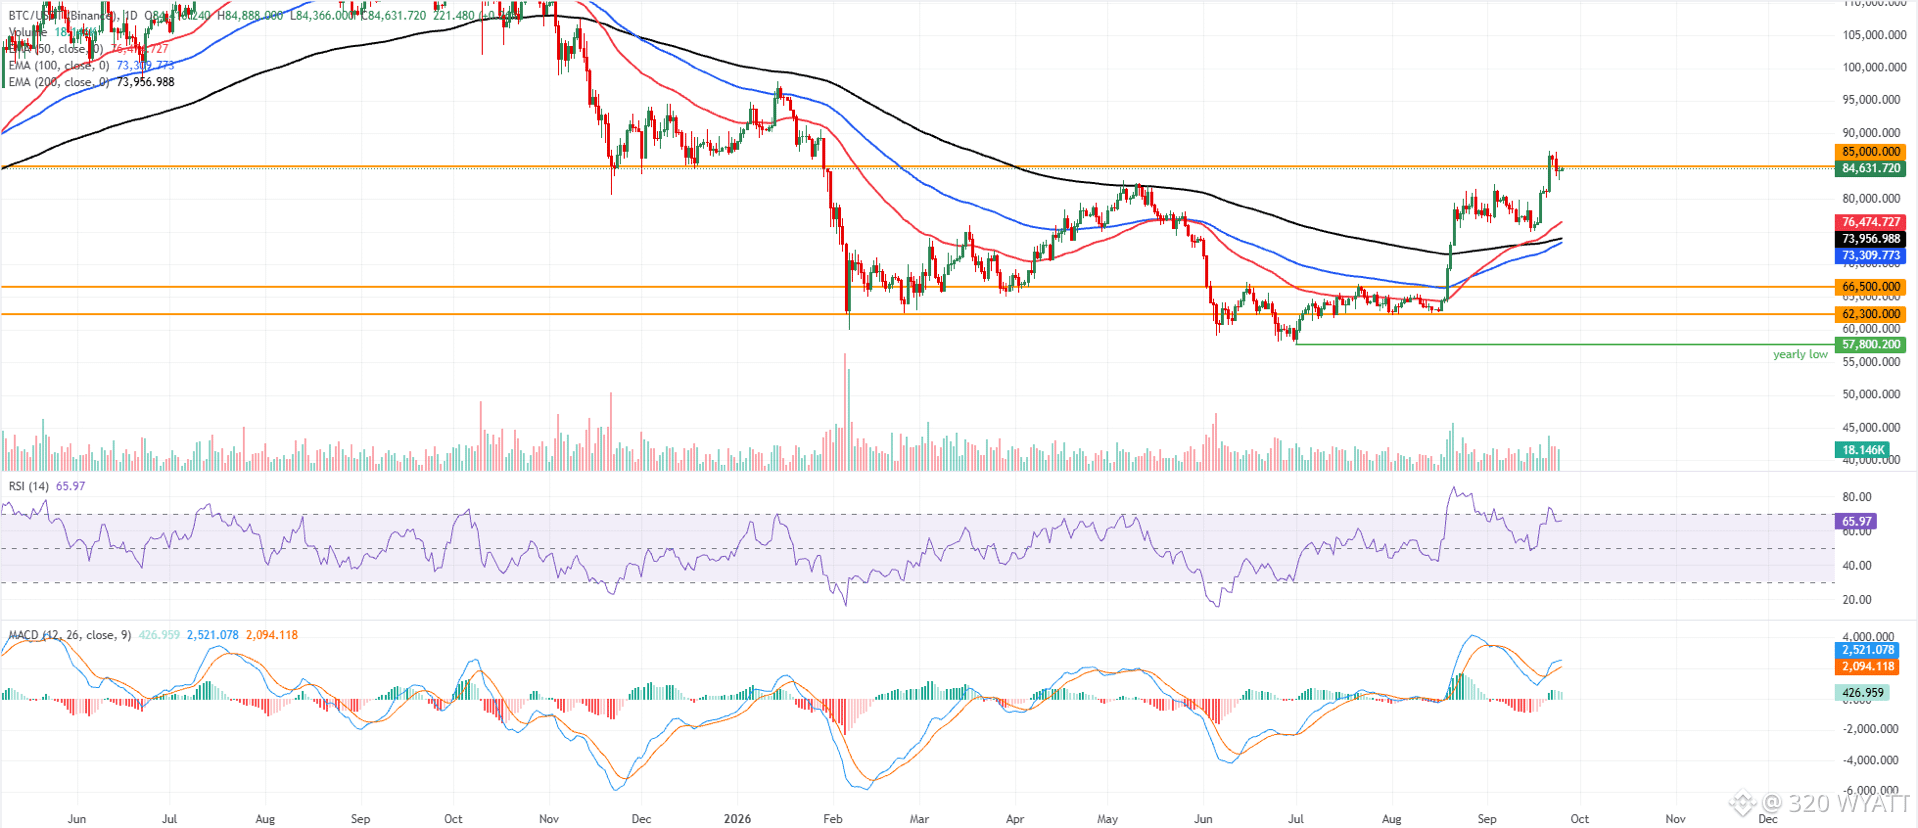
Bitcoin price trades at $84,631 on Friday, retaining a bullish near-term bias as it holds well above the 50-day, 100-day and 200-day Exponential Moving Averages (EMAs) clustered between roughly $73,300 and $76,400.
The Relative Strength Index (RSI) at 65 stays in positive territory without being overbought, while the Moving Average Convergence Divergence (MACD) remains in positive territory with the signal line above zero, hinting that upside momentum is still constructive even after the recent surge.
On the topside, immediate resistance is seen at the horizontal barrier near $85,000.
On the downside, the first relevant support is around the 50-day EMA at $76,474 and the 200-day and 100-day EMAs at $73,956 and $73,309, which form a broader demand zone on pullbacks. Deeper declines would expose horizontal supports at $66,500 and $62,300, where buyers could attempt to reassert control if a larger correction unfolds.
#BTC320 #Trendingcoin320 #mr320 #WriteToEarn2026 #Trendingissue
$BTC
Bitcoin price trades at $84,631 on Friday, retaining a bullish near-term bias as it holds well above the 50-day, 100-day and 200-day Exponential Moving Averages (EMAs) clustered between roughly $73,300 and $76,400.
The Relative Strength Index (RSI) at 65 stays in positive territory without being overbought, while the Moving Average Convergence Divergence (MACD) remains in positive territory with the signal line above zero, hinting that upside momentum is still constructive even after the recent surge.
On the topside, immediate resistance is seen at the horizontal barrier near $85,000.
On the downside, the first relevant support is around the 50-day EMA at $76,474 and the 200-day and 100-day EMAs at $73,956 and $73,309, which form a broader demand zone on pullbacks. Deeper declines would expose horizontal supports at $66,500 and $62,300, where buyers could attempt to reassert control if a larger correction unfolds.
#BTC320 #Trendingcoin320 #mr320 #WriteToEarn2026 #Trendingissue
Bitcoin price trades at $84,631 on Friday, retaining a bullish near-term bias as it holds well above the 50-day, 100-day and 200-day Exponential Moving Averages (EMAs) clustered between roughly $73,300 and $76,400.
The Relative Strength Index (RSI) at 65 stays in positive territory without being overbought, while the Moving Average Convergence Divergence (MACD) remains in positive territory with the signal line above zero, hinting that upside momentum is still constructive even after the recent surge.
On the topside, immediate resistance is seen at the horizontal barrier near $85,000.
On the downside, the first relevant support is around the 50-day EMA at $76,474 and the 200-day and 100-day EMAs at $73,956 and $73,309, which form a broader demand zone on pullbacks. Deeper declines would expose horizontal supports at $66,500 and $62,300, where buyers could attempt to reassert control if a larger correction unfolds.
#BTC320 #Trendingcoin320 #mr320 #WriteToEarn2026 #Trendingissue
56
·
--
Bullish
$XRP
{spot}(XRPUSDT)
XRP price recovered above $1.50 after dropping near $1.45 during a broader crypto market sell-off. The number of XRP holder addresses rose to 8.15 million, indicating growing interest beyond daily trading fluctuations. However, recent inflows of about 524,000 XRP to exchanges suggest some holders may be preparing to sell, though the scale is modest compared to earlier spikes. If XRP holds support around $1.45 and breaks above $1.60, it could continue its upward trend toward $1.66, but a drop below $1.42 might shift focus to lower support levels.
XRP trades at Rp27,506 on Pluang, up 3.50% as of Sep 25, 2026 04:43 WIB, showing resilience after recent market fluctuations. The platform sees a balanced order activity with 56% selling and 44% buying, and typical holders keep XRP for about 71 days. This steady trading behavior complements the news of rising holder addresses reaching 8.15 million, indicating sustained interest in XRP beyond short-term price moves.
#xrp320 #mr320 #Trendingcoin320 #WriteToEarn2026 #xrp
$XRP
XRP price recovered above $1.50 after dropping near $1.45 during a broader crypto market sell-off. The number of XRP holder addresses rose to 8.15 million, indicating growing interest beyond daily trading fluctuations. However, recent inflows of about 524,000 XRP to exchanges suggest some holders may be preparing to sell, though the scale is modest compared to earlier spikes. If XRP holds support around $1.45 and breaks above $1.60, it could continue its upward trend toward $1.66, but a drop below $1.42 might shift focus to lower support levels.
XRP trades at Rp27,506 on Pluang, up 3.50% as of Sep 25, 2026 04:43 WIB, showing resilience after recent market fluctuations. The platform sees a balanced order activity with 56% selling and 44% buying, and typical holders keep XRP for about 71 days. This steady trading behavior complements the news of rising holder addresses reaching 8.15 million, indicating sustained interest in XRP beyond short-term price moves.
#xrp320 #mr320 #Trendingcoin320 #WriteToEarn2026 #xrp
XRP price recovered above $1.50 after dropping near $1.45 during a broader crypto market sell-off. The number of XRP holder addresses rose to 8.15 million, indicating growing interest beyond daily trading fluctuations. However, recent inflows of about 524,000 XRP to exchanges suggest some holders may be preparing to sell, though the scale is modest compared to earlier spikes. If XRP holds support around $1.45 and breaks above $1.60, it could continue its upward trend toward $1.66, but a drop below $1.42 might shift focus to lower support levels.
XRP trades at Rp27,506 on Pluang, up 3.50% as of Sep 25, 2026 04:43 WIB, showing resilience after recent market fluctuations. The platform sees a balanced order activity with 56% selling and 44% buying, and typical holders keep XRP for about 71 days. This steady trading behavior complements the news of rising holder addresses reaching 8.15 million, indicating sustained interest in XRP beyond short-term price moves.
#xrp320 #mr320 #Trendingcoin320 #WriteToEarn2026 #xrp
95
·
--
Bullish
$BTC
{spot}(BTCUSDT)
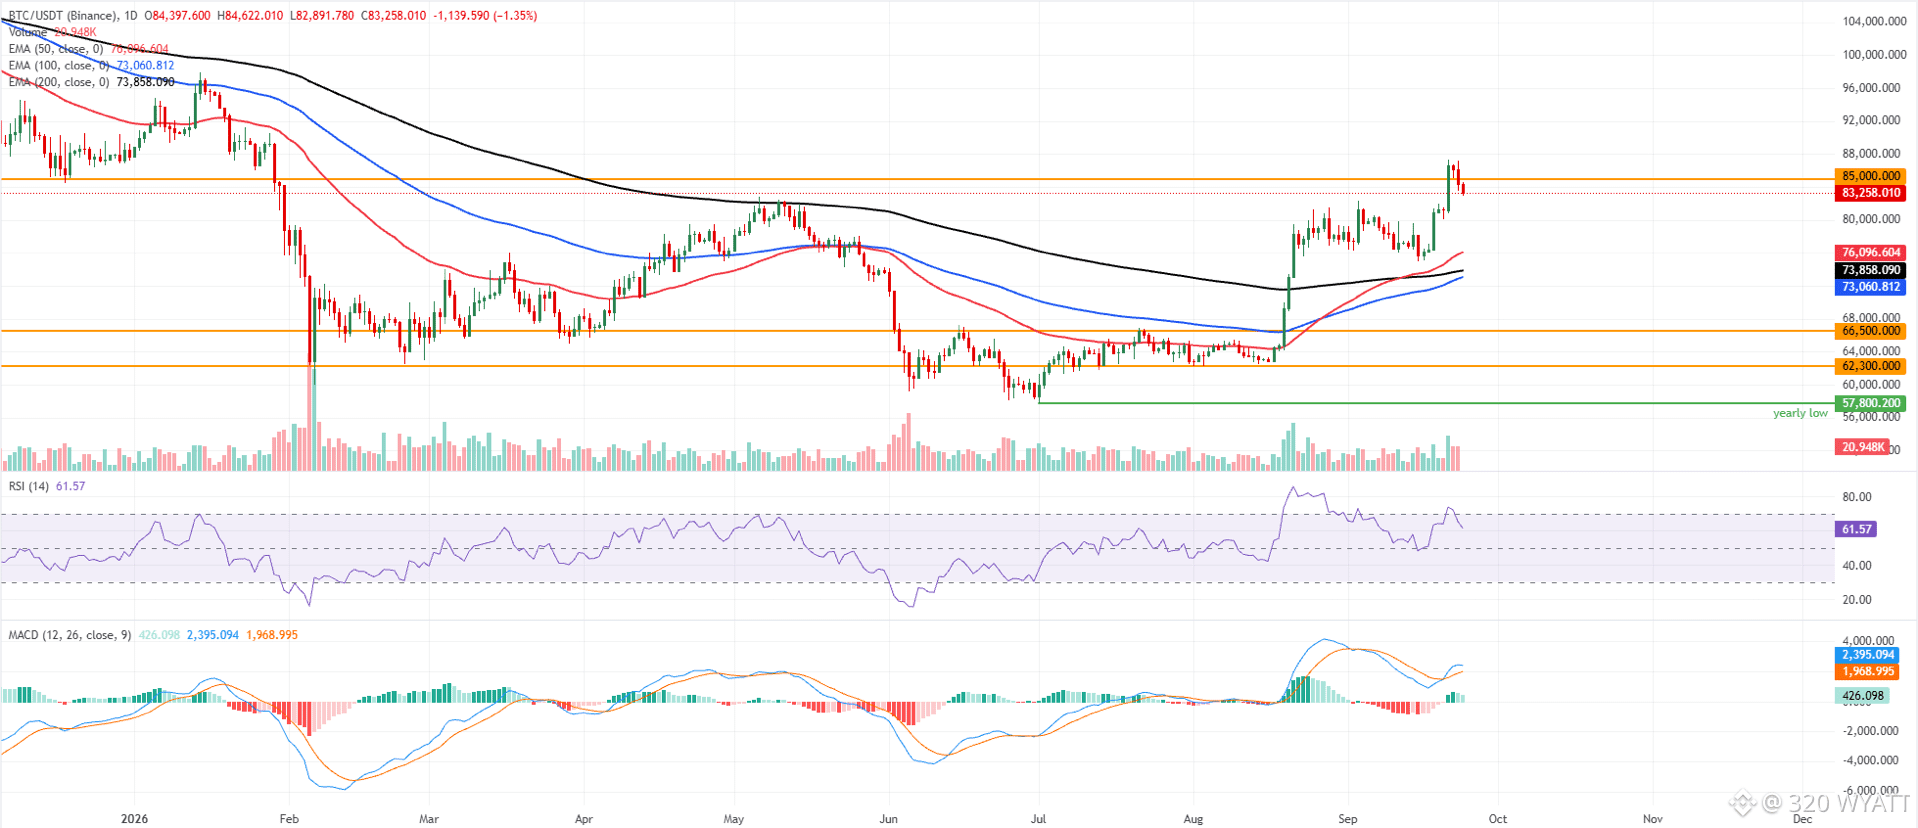
Bitcoin price trades at $84,550 at the time of writing on Thursday, extending the correction for the third consecutive day. Despite the pullback, BTC maintains a bullish near‑term bias as it holds well above the 50-day, 100-day and 200-day Exponential Moving Averages (EMAs) clustered between roughly $73,000 and $76,000.
The broader uptrend remains intact, with the Relative Strength Index (RSI) around 62 on the daily chart, pointing to firm but not extreme bullish momentum. At the same time, the Moving Average Convergence Divergence (MACD) histogram stays in positive territory, suggesting upside pressure remains despite the recent decline from the latest highs.
On the topside, initial resistance emerges at the horizontal barrier near $85,000, where a clear break would open the way for a higher rise into the $100,000 mark.
On the downside, immediate demand is expected around the current price area, followed by stronger structural support at the 50-day EMA at $76,096, the 200-day EMA at $73,858 and the 100-day EMA at $73,060. A deeper retracement toward the horizontal floors at $66,500 and $62,300 would still leave the broader bullish structure intact but signal a more extended corrective phase.
#BTC320 #mr320 #Trendingissue #WriteToEarn2026 #Trendingcoin320
$BTC
Bitcoin price trades at $84,550 at the time of writing on Thursday, extending the correction for the third consecutive day. Despite the pullback, BTC maintains a bullish near‑term bias as it holds well above the 50-day, 100-day and 200-day Exponential Moving Averages (EMAs) clustered between roughly $73,000 and $76,000.
The broader uptrend remains intact, with the Relative Strength Index (RSI) around 62 on the daily chart, pointing to firm but not extreme bullish momentum. At the same time, the Moving Average Convergence Divergence (MACD) histogram stays in positive territory, suggesting upside pressure remains despite the recent decline from the latest highs.
On the topside, initial resistance emerges at the horizontal barrier near $85,000, where a clear break would open the way for a higher rise into the $100,000 mark.
On the downside, immediate demand is expected around the current price area, followed by stronger structural support at the 50-day EMA at $76,096, the 200-day EMA at $73,858 and the 100-day EMA at $73,060. A deeper retracement toward the horizontal floors at $66,500 and $62,300 would still leave the broader bullish structure intact but signal a more extended corrective phase.
#BTC320 #mr320 #Trendingissue #WriteToEarn2026 #Trendingcoin320
Bitcoin price trades at $84,550 at the time of writing on Thursday, extending the correction for the third consecutive day. Despite the pullback, BTC maintains a bullish near‑term bias as it holds well above the 50-day, 100-day and 200-day Exponential Moving Averages (EMAs) clustered between roughly $73,000 and $76,000.
The broader uptrend remains intact, with the Relative Strength Index (RSI) around 62 on the daily chart, pointing to firm but not extreme bullish momentum. At the same time, the Moving Average Convergence Divergence (MACD) histogram stays in positive territory, suggesting upside pressure remains despite the recent decline from the latest highs.
On the topside, initial resistance emerges at the horizontal barrier near $85,000, where a clear break would open the way for a higher rise into the $100,000 mark.
On the downside, immediate demand is expected around the current price area, followed by stronger structural support at the 50-day EMA at $76,096, the 200-day EMA at $73,858 and the 100-day EMA at $73,060. A deeper retracement toward the horizontal floors at $66,500 and $62,300 would still leave the broader bullish structure intact but signal a more extended corrective phase.
#BTC320 #mr320 #Trendingissue #WriteToEarn2026 #Trendingcoin320
24
·
--
Bullish
$FIL
{spot}(FILUSDT)
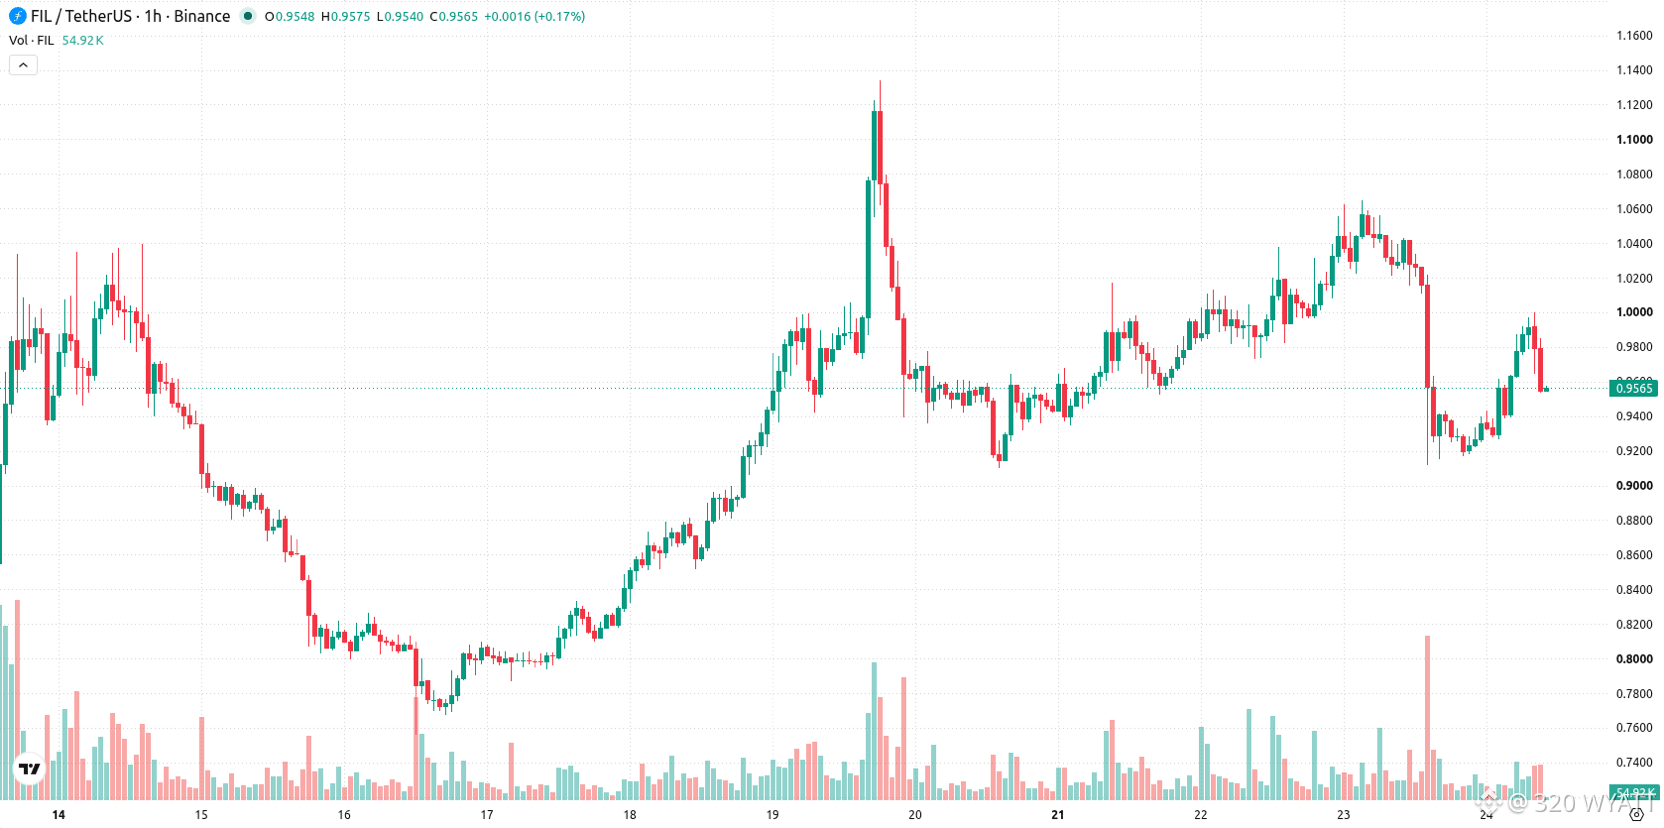
FIL remains above the MA-20 but is capped below the MA-50, while preserving distance from the MA-200 for long-term support. Immediate resistance is seen at the Ichimoku Kijun level of $0.97735, with the current range defined by $0.8889707 as key support and $1.0596 as the upper boundary. On the indicator front, MACD and ADX both reflect a strong bias toward sellers, but RSI hovers near neutral and shows a buy, while both Stochastic RSI and CCI have entered overbought territory. Bull/Bear Power detects intraday buyer activity, countered by a neutral Awesome Oscillator. This divergence among technical signals highlights mixed underlying momentum.
#Fil320 #mr320 #Trendingissue #writetoearn2026 #Trendingcoin320
$FIL
FIL remains above the MA-20 but is capped below the MA-50, while preserving distance from the MA-200 for long-term support. Immediate resistance is seen at the Ichimoku Kijun level of $0.97735, with the current range defined by $0.8889707 as key support and $1.0596 as the upper boundary. On the indicator front, MACD and ADX both reflect a strong bias toward sellers, but RSI hovers near neutral and shows a buy, while both Stochastic RSI and CCI have entered overbought territory. Bull/Bear Power detects intraday buyer activity, countered by a neutral Awesome Oscillator. This divergence among technical signals highlights mixed underlying momentum.
#Fil320 #mr320 #Trendingissue #writetoearn2026 #Trendingcoin320
FIL remains above the MA-20 but is capped below the MA-50, while preserving distance from the MA-200 for long-term support. Immediate resistance is seen at the Ichimoku Kijun level of $0.97735, with the current range defined by $0.8889707 as key support and $1.0596 as the upper boundary. On the indicator front, MACD and ADX both reflect a strong bias toward sellers, but RSI hovers near neutral and shows a buy, while both Stochastic RSI and CCI have entered overbought territory. Bull/Bear Power detects intraday buyer activity, countered by a neutral Awesome Oscillator. This divergence among technical signals highlights mixed underlying momentum.
#Fil320 #mr320 #Trendingissue #writetoearn2026 #Trendingcoin320
45
·
--
Bullish
$XRP
{spot}(XRPUSDT)
A $1,000 investment in XRP on September 24, 2026, could double to $2,000 if the token reaches its 52-week opening price of $2.94. XRP traded at about $1.47 at the time, with a 12-month high of $3.04 and a low of $0.98. Market data shows a 40% chance XRP will hit $2 by the end of 2026, with higher probabilities in 2027. Price movements will be influenced by Bitcoin trends and developments at Ripple Labs, including institutional adoption and potential market dilution.
XRP is currently priced at Rp26,674 on Pluang as of September 24, 2026, 20:21 WIB. The token has seen a 1-day decline of 3.96%, with a market capitalization of Rp1.658,04 trillion. Pluang users show a slight selling bias with 56% of orders to sell versus 44% to buy, and the typical holding period is 71 days.
#xrp320 #xrp #Trendingissue #Trendingcoin320 #WriteToEarn2026
$XRP
A $1,000 investment in XRP on September 24, 2026, could double to $2,000 if the token reaches its 52-week opening price of $2.94. XRP traded at about $1.47 at the time, with a 12-month high of $3.04 and a low of $0.98. Market data shows a 40% chance XRP will hit $2 by the end of 2026, with higher probabilities in 2027. Price movements will be influenced by Bitcoin trends and developments at Ripple Labs, including institutional adoption and potential market dilution.
XRP is currently priced at Rp26,674 on Pluang as of September 24, 2026, 20:21 WIB. The token has seen a 1-day decline of 3.96%, with a market capitalization of Rp1.658,04 trillion. Pluang users show a slight selling bias with 56% of orders to sell versus 44% to buy, and the typical holding period is 71 days.
#xrp320 #xrp #Trendingissue #Trendingcoin320 #WriteToEarn2026
A $1,000 investment in XRP on September 24, 2026, could double to $2,000 if the token reaches its 52-week opening price of $2.94. XRP traded at about $1.47 at the time, with a 12-month high of $3.04 and a low of $0.98. Market data shows a 40% chance XRP will hit $2 by the end of 2026, with higher probabilities in 2027. Price movements will be influenced by Bitcoin trends and developments at Ripple Labs, including institutional adoption and potential market dilution.
XRP is currently priced at Rp26,674 on Pluang as of September 24, 2026, 20:21 WIB. The token has seen a 1-day decline of 3.96%, with a market capitalization of Rp1.658,04 trillion. Pluang users show a slight selling bias with 56% of orders to sell versus 44% to buy, and the typical holding period is 71 days.
#xrp320 #xrp #Trendingissue #Trendingcoin320 #WriteToEarn2026
36
·
--
Bullish
$SOL
{spot}(SOLUSDT)
SOL's outlook for today turns on one level, $120, with the coin trading near $115 on Crypto exchange. Parameter reports that a four hour close above $120 would open $125 first and then $130 this week. Open interest also rose 10% to $7.33 billion, which shows traders are adding bets, not leaving.
On the way down, support waits at $114 and then $110. For the month, analyst Ali Martinez has flagged $150 once SOL clears $132. That road is real, but it is a climb of about 27% from here. It is a good trade, just a slow one next to a presale price.
#solana320 #WriteToEarn2026 #Trendingissue #solana #mr320
$SOL
SOL's outlook for today turns on one level, $120, with the coin trading near $115 on Crypto exchange. Parameter reports that a four hour close above $120 would open $125 first and then $130 this week. Open interest also rose 10% to $7.33 billion, which shows traders are adding bets, not leaving.
On the way down, support waits at $114 and then $110. For the month, analyst Ali Martinez has flagged $150 once SOL clears $132. That road is real, but it is a climb of about 27% from here. It is a good trade, just a slow one next to a presale price.
#solana320 #WriteToEarn2026 #Trendingissue #solana #mr320
SOL's outlook for today turns on one level, $120, with the coin trading near $115 on Crypto exchange. Parameter reports that a four hour close above $120 would open $125 first and then $130 this week. Open interest also rose 10% to $7.33 billion, which shows traders are adding bets, not leaving.
On the way down, support waits at $114 and then $110. For the month, analyst Ali Martinez has flagged $150 once SOL clears $132. That road is real, but it is a climb of about 27% from here. It is a good trade, just a slow one next to a presale price.
#solana320 #WriteToEarn2026 #Trendingissue #solana #mr320

172
·
--
Bullish
$XRP
{spot}(XRPUSDT)
Today, XRP trades near $1.50 after a 6.78% jump, per Coinpedia, with live charts on Crypto exchange. Big traders on the CME cut their bets against XRP by 46.3 million tokens, which pushed the move.
This week, the level to hold is $1.52, and traders will read the next CFTC report on September 25. This month, analyst Egrag Crypto says a hold above $1.54 opens the path past $1.62, per CoinMarketCap. By year end, the base case at crypto.news points to about $1.82, an 18% gain. XRP has room to climb, but it climbs in steps, not leaps.
#xrp320 #Trendingcoin320 #mr320 #WriteToEarn2026 #Trendingissue
$XRP
Today, XRP trades near $1.50 after a 6.78% jump, per Coinpedia, with live charts on Crypto exchange. Big traders on the CME cut their bets against XRP by 46.3 million tokens, which pushed the move.
This week, the level to hold is $1.52, and traders will read the next CFTC report on September 25. This month, analyst Egrag Crypto says a hold above $1.54 opens the path past $1.62, per CoinMarketCap. By year end, the base case at crypto.news points to about $1.82, an 18% gain. XRP has room to climb, but it climbs in steps, not leaps.
#xrp320 #Trendingcoin320 #mr320 #WriteToEarn2026 #Trendingissue
Today, XRP trades near $1.50 after a 6.78% jump, per Coinpedia, with live charts on Crypto exchange. Big traders on the CME cut their bets against XRP by 46.3 million tokens, which pushed the move.
This week, the level to hold is $1.52, and traders will read the next CFTC report on September 25. This month, analyst Egrag Crypto says a hold above $1.54 opens the path past $1.62, per CoinMarketCap. By year end, the base case at crypto.news points to about $1.82, an 18% gain. XRP has room to climb, but it climbs in steps, not leaps.
#xrp320 #Trendingcoin320 #mr320 #WriteToEarn2026 #Trendingissue

189
·
--
Bearish
$XRP
{spot}(XRPUSDT)
Ripple (XRP) trades at $1.52 as of this writing, up 1.6% on the day, with a 24-hour range spanning $1.5577 to $1.6561. Beneath the green candle sits a wrinkle worth flagging before the bulls get too comfortable. There’s a number circulating on-chain that most traders scrolling past the price chart haven’t clocked yet.
Binance’s XRP reserves have climbed to roughly 2.68 billion tokens, the highest balance since June, following a stretch of decline and a slow rebuild.
On-chain trackers noted the deposit surge ran 663% above the quarterly baseline, with withdrawals rising in tandem, a pattern that reads less like panic-selling and more like liquidity churn.
#xrp320 #mr320 #Trendingcoin320 #WriteToEarn2026 #Trendingissue
$XRP
Ripple (XRP) trades at $1.52 as of this writing, up 1.6% on the day, with a 24-hour range spanning $1.5577 to $1.6561. Beneath the green candle sits a wrinkle worth flagging before the bulls get too comfortable. There’s a number circulating on-chain that most traders scrolling past the price chart haven’t clocked yet.
Binance’s XRP reserves have climbed to roughly 2.68 billion tokens, the highest balance since June, following a stretch of decline and a slow rebuild.
On-chain trackers noted the deposit surge ran 663% above the quarterly baseline, with withdrawals rising in tandem, a pattern that reads less like panic-selling and more like liquidity churn.
#xrp320 #mr320 #Trendingcoin320 #WriteToEarn2026 #Trendingissue
Ripple (XRP) trades at $1.52 as of this writing, up 1.6% on the day, with a 24-hour range spanning $1.5577 to $1.6561. Beneath the green candle sits a wrinkle worth flagging before the bulls get too comfortable. There’s a number circulating on-chain that most traders scrolling past the price chart haven’t clocked yet.
Binance’s XRP reserves have climbed to roughly 2.68 billion tokens, the highest balance since June, following a stretch of decline and a slow rebuild.
On-chain trackers noted the deposit surge ran 663% above the quarterly baseline, with withdrawals rising in tandem, a pattern that reads less like panic-selling and more like liquidity churn.
#xrp320 #mr320 #Trendingcoin320 #WriteToEarn2026 #Trendingissue
2
294
·
--
Bearish
$XRP
{spot}(XRPUSDT)
Large-volume holders with between 100 million and 1 billion tokens have since late July increased their XRP uptake and now account for roughly 14% of the total supply, up from 12% on September 1 and nearly 11% on August 1.
XRP Supply Distribution | Source: Santiment
The whale cohort holding between 10 million and 100 million tokens shows steady but gradual XRP accumulation, now accounting for 18% of the total supply, according to Santiment. Further accumulation could support XRP’s short-term bullish outlook, increasing the odds of a sustained $1.60 breakout toward highs above $2.00.
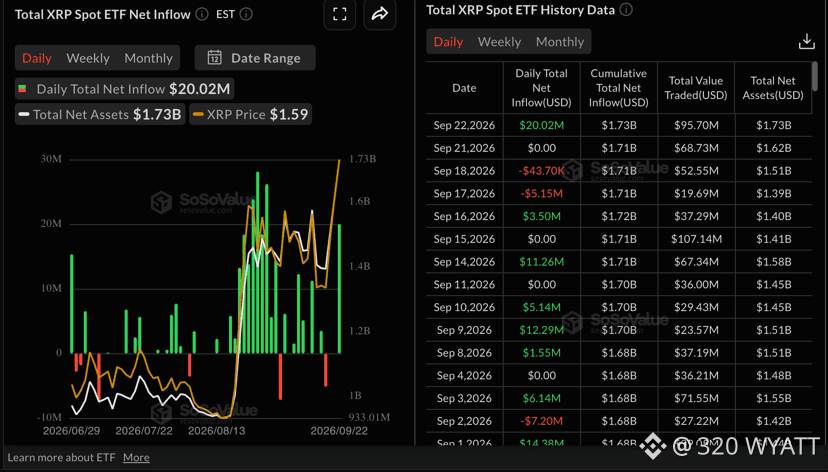
The remittance token, XRP, posted a notable jump in spot Exchange-Traded Funds (ETFs) inflows to $20 million on Tuesday, following muted activity the day before and $44,000 in outflows last Friday. Cumulative inflows edged higher to $1.73 billion, with net assets averaging $1.73 billion.
#xrp320 #mr320 #Trendingissue #WriteToEarn2026 #Trendingcoin320
$XRP
Large-volume holders with between 100 million and 1 billion tokens have since late July increased their XRP uptake and now account for roughly 14% of the total supply, up from 12% on September 1 and nearly 11% on August 1.
XRP Supply Distribution | Source: Santiment
The whale cohort holding between 10 million and 100 million tokens shows steady but gradual XRP accumulation, now accounting for 18% of the total supply, according to Santiment. Further accumulation could support XRP’s short-term bullish outlook, increasing the odds of a sustained $1.60 breakout toward highs above $2.00.
The remittance token, XRP, posted a notable jump in spot Exchange-Traded Funds (ETFs) inflows to $20 million on Tuesday, following muted activity the day before and $44,000 in outflows last Friday. Cumulative inflows edged higher to $1.73 billion, with net assets averaging $1.73 billion.
#xrp320 #mr320 #Trendingissue #WriteToEarn2026 #Trendingcoin320
Large-volume holders with between 100 million and 1 billion tokens have since late July increased their XRP uptake and now account for roughly 14% of the total supply, up from 12% on September 1 and nearly 11% on August 1.
XRP Supply Distribution | Source: Santiment
The whale cohort holding between 10 million and 100 million tokens shows steady but gradual XRP accumulation, now accounting for 18% of the total supply, according to Santiment. Further accumulation could support XRP’s short-term bullish outlook, increasing the odds of a sustained $1.60 breakout toward highs above $2.00.
The remittance token, XRP, posted a notable jump in spot Exchange-Traded Funds (ETFs) inflows to $20 million on Tuesday, following muted activity the day before and $44,000 in outflows last Friday. Cumulative inflows edged higher to $1.73 billion, with net assets averaging $1.73 billion.
#xrp320 #mr320 #Trendingissue #WriteToEarn2026 #Trendingcoin320
343
·
--
Bearish
$BTC $XAUT
{spot}(XAUTUSDT)
{spot}(BTCUSDT)
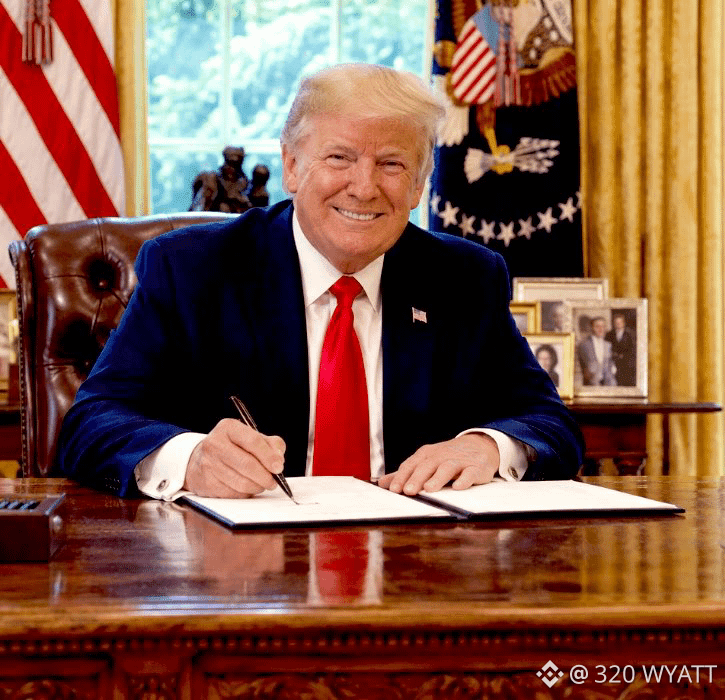
PRESIDENT TRUMP: 🇺🇸 “One day Bitcoin probably will overtake gold.”
#trump320 #BTC320 #Trendingcoin320 #Trendingissue #writetoearn2026
$BTC $XAUT
PRESIDENT TRUMP: 🇺🇸 “One day Bitcoin probably will overtake gold.”
#trump320 #BTC320 #Trendingcoin320 #Trendingissue #writetoearn2026
PRESIDENT TRUMP: 🇺🇸 “One day Bitcoin probably will overtake gold.”
#trump320 #BTC320 #Trendingcoin320 #Trendingissue #writetoearn2026

3
1.2k
·
--
Bullish
$ETH
{spot}(ETHUSDT)
The price of ethereum this morning, Wednesday, September 23, 2026, was 0.8% lower than Tuesday's open. Here's a look at how the opening ethereum price has changed versus last week, month, and year:
One week ago: +14.8%
One month ago: +13.6%
One year ago: -34.5%
#ETH320 #mr320 #Trendingcoin320 #WriteToEarn2026 #Trendingissue
$ETH
The price of ethereum this morning, Wednesday, September 23, 2026, was 0.8% lower than Tuesday's open. Here's a look at how the opening ethereum price has changed versus last week, month, and year:
One week ago: +14.8%
One month ago: +13.6%
One year ago: -34.5%
#ETH320 #mr320 #Trendingcoin320 #WriteToEarn2026 #Trendingissue
The price of ethereum this morning, Wednesday, September 23, 2026, was 0.8% lower than Tuesday's open. Here's a look at how the opening ethereum price has changed versus last week, month, and year:
One week ago: +14.8%
One month ago: +13.6%
One year ago: -34.5%
#ETH320 #mr320 #Trendingcoin320 #WriteToEarn2026 #Trendingissue

20
·
--
Bullish
$BTC
{spot}(BTCUSDT)
The price of bitcoin this morning, Wednesday, September 23, 2026, was flat compared to Tuesday's opening price. Here's a look at how the opening bitcoin price has changed versus last week, month, and year:
One week ago: +14%
One month ago: +11.8%
One year ago: -23.6%
#BTC320 #mr320 #Trendingissue #Trendingcoin320 #WriteToEarn2026
$BTC
The price of bitcoin this morning, Wednesday, September 23, 2026, was flat compared to Tuesday's opening price. Here's a look at how the opening bitcoin price has changed versus last week, month, and year:
One week ago: +14%
One month ago: +11.8%
One year ago: -23.6%
#BTC320 #mr320 #Trendingissue #Trendingcoin320 #WriteToEarn2026
The price of bitcoin this morning, Wednesday, September 23, 2026, was flat compared to Tuesday's opening price. Here's a look at how the opening bitcoin price has changed versus last week, month, and year:
One week ago: +14%
One month ago: +11.8%
One year ago: -23.6%
#BTC320 #mr320 #Trendingissue #Trendingcoin320 #WriteToEarn2026

22
·
--
Bullish
$XRP
{spot}(XRPUSDT)
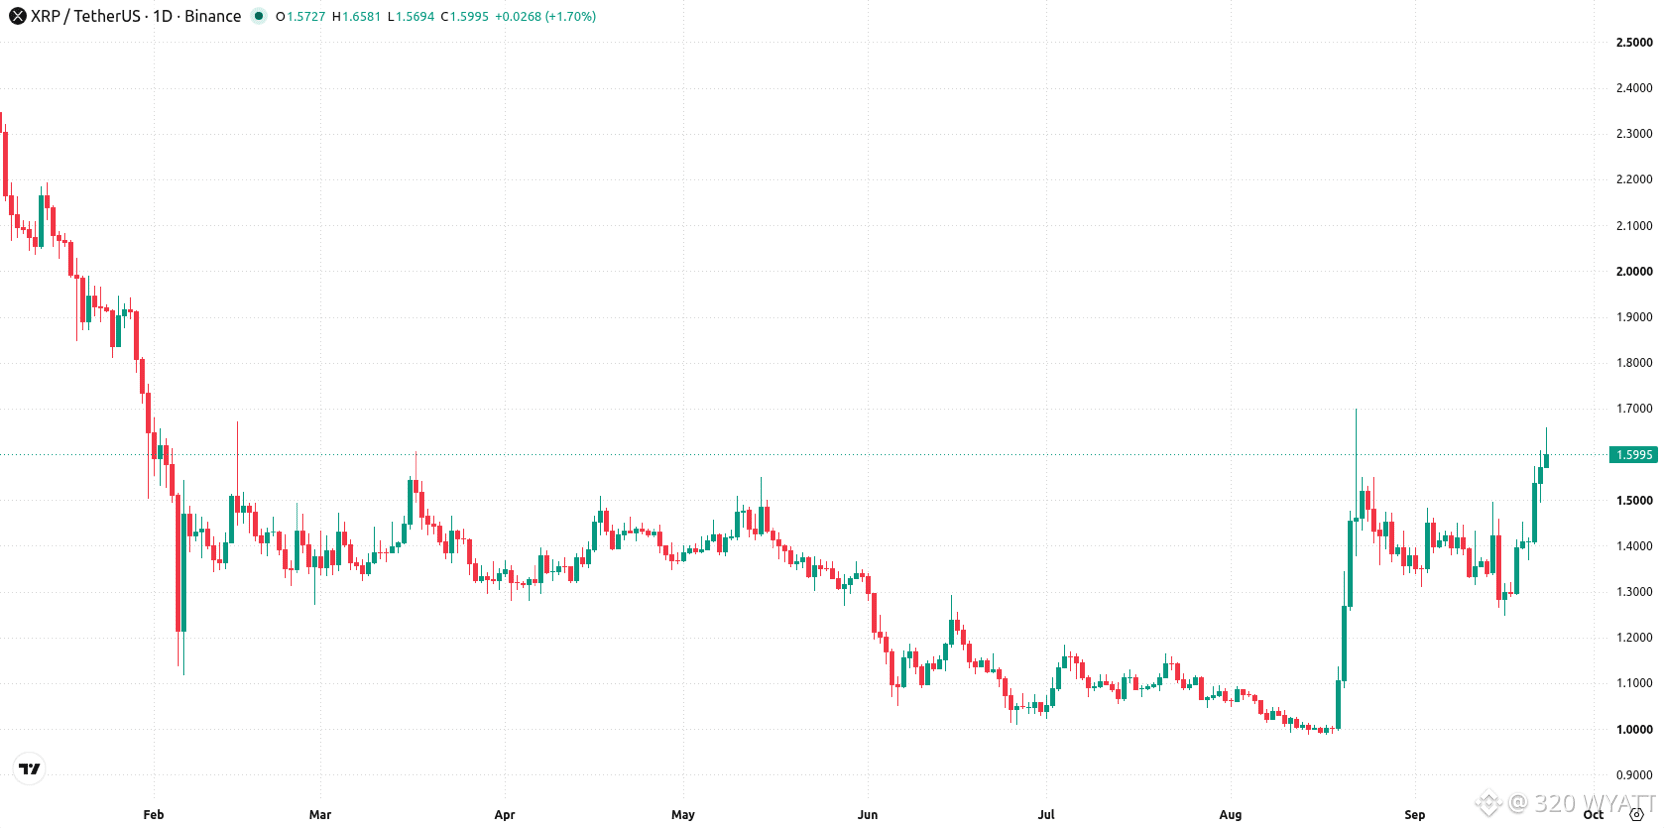
🚨Bullish momentum stretched as technical signals approach overbought territory🚨
On the daily chart, XRP has posted a sustained move higher with a firm trend, supported by a strong ADX reading of 35.1963 and buy-side signals from both MACD and Bull/Bear Power. Volatility this week stood at 24.98%. RSI is approaching overbought at 67.9063 while CCI and Stoch RSI are firmly in the overbought zone, indicating stretched momentum as price pushes toward the resistance at $1.6094. The nearest support sits at $1.4213, defined by the Ichimoku Kijun.
#xrp320 #Trendingcoin320 #Trendingissue #mr320 #WriteToEarn2026
$XRP
🚨Bullish momentum stretched as technical signals approach overbought territory🚨
On the daily chart, XRP has posted a sustained move higher with a firm trend, supported by a strong ADX reading of 35.1963 and buy-side signals from both MACD and Bull/Bear Power. Volatility this week stood at 24.98%. RSI is approaching overbought at 67.9063 while CCI and Stoch RSI are firmly in the overbought zone, indicating stretched momentum as price pushes toward the resistance at $1.6094. The nearest support sits at $1.4213, defined by the Ichimoku Kijun.
#xrp320 #Trendingcoin320 #Trendingissue #mr320 #WriteToEarn2026
🚨Bullish momentum stretched as technical signals approach overbought territory🚨
On the daily chart, XRP has posted a sustained move higher with a firm trend, supported by a strong ADX reading of 35.1963 and buy-side signals from both MACD and Bull/Bear Power. Volatility this week stood at 24.98%. RSI is approaching overbought at 67.9063 while CCI and Stoch RSI are firmly in the overbought zone, indicating stretched momentum as price pushes toward the resistance at $1.6094. The nearest support sits at $1.4213, defined by the Ichimoku Kijun.
#xrp320 #Trendingcoin320 #Trendingissue #mr320 #WriteToEarn2026
46
·
--
Bullish
$XRP
{spot}(XRPUSDT)
XRP is holding near $1.60 after a surge of almost 24% over the past week, buoyed by mounting institutional activity. Renewed interest from asset managers and deepening fund inflows are defining the recovery mood, but the setup now faces stretched technicals as the week ahead tests whether this momentum can be sustained.
#xrp320 #Trendingcoin320 #mr320 #Trendingissue #WriteToEarn2026
$XRP
XRP is holding near $1.60 after a surge of almost 24% over the past week, buoyed by mounting institutional activity. Renewed interest from asset managers and deepening fund inflows are defining the recovery mood, but the setup now faces stretched technicals as the week ahead tests whether this momentum can be sustained.
#xrp320 #Trendingcoin320 #mr320 #Trendingissue #WriteToEarn2026
XRP is holding near $1.60 after a surge of almost 24% over the past week, buoyed by mounting institutional activity. Renewed interest from asset managers and deepening fund inflows are defining the recovery mood, but the setup now faces stretched technicals as the week ahead tests whether this momentum can be sustained.
#xrp320 #Trendingcoin320 #mr320 #Trendingissue #WriteToEarn2026
62
·
--
Bullish
$XRP
{spot}(XRPUSDT)
XRP's market capitalization has surged back above $100 billion following an 8% price increase, making it one of the best-performing cryptocurrencies recently. Despite this milestone, XRP remains over 55% below its record high from last year, suggesting room for further growth. Increased activity from large holders and strong inflows into U.S. spot XRP ETFs indicate growing investor confidence. Analysts predict potential for continued price rallies amid heightened volatility expectations.
#xrp320 #Trendingissue #WriteToEarn2026 #Trendingcoin320 #mr320
$XRP
XRP's market capitalization has surged back above $100 billion following an 8% price increase, making it one of the best-performing cryptocurrencies recently. Despite this milestone, XRP remains over 55% below its record high from last year, suggesting room for further growth. Increased activity from large holders and strong inflows into U.S. spot XRP ETFs indicate growing investor confidence. Analysts predict potential for continued price rallies amid heightened volatility expectations.
#xrp320 #Trendingissue #WriteToEarn2026 #Trendingcoin320 #mr320
XRP's market capitalization has surged back above $100 billion following an 8% price increase, making it one of the best-performing cryptocurrencies recently. Despite this milestone, XRP remains over 55% below its record high from last year, suggesting room for further growth. Increased activity from large holders and strong inflows into U.S. spot XRP ETFs indicate growing investor confidence. Analysts predict potential for continued price rallies amid heightened volatility expectations.
#xrp320 #Trendingissue #WriteToEarn2026 #Trendingcoin320 #mr320
949
·
--
Bullish
$XRP
{spot}(XRPUSDT)
XRP reserves on Binance have climbed to roughly 2.6 billion tokens, their highest level since June, with the token trading above $1.50 today.
The buildup is unfolding in the middle of a broader market rally, though a closer look at the exchange flows suggests the extra supply has more to do with trading turnover than a wave of holders lining up to sell.
#xrp320 #Trendingcoin320 #mr320 #Trendingissue #WriteToEarn2026
$XRP
XRP reserves on Binance have climbed to roughly 2.6 billion tokens, their highest level since June, with the token trading above $1.50 today.
The buildup is unfolding in the middle of a broader market rally, though a closer look at the exchange flows suggests the extra supply has more to do with trading turnover than a wave of holders lining up to sell.
#xrp320 #Trendingcoin320 #mr320 #Trendingissue #WriteToEarn2026
XRP reserves on Binance have climbed to roughly 2.6 billion tokens, their highest level since June, with the token trading above $1.50 today.
The buildup is unfolding in the middle of a broader market rally, though a closer look at the exchange flows suggests the extra supply has more to do with trading turnover than a wave of holders lining up to sell.
#xrp320 #Trendingcoin320 #mr320 #Trendingissue #WriteToEarn2026

80
Log in to explore more content
Join global crypto users on Binance Square
⚡️ Get latest and useful information about crypto.
💬 Trusted by the world’s largest crypto exchange.
👍 Discover real insights from verified creators.
Email / Phone number
Trending Topics
1
#QNTRises39%
360 views
82 Discussing
2
#EthereumBreaksAbove$2700
155 views
31 Discussing
3
#BitgetBreachForgedRequestsNotStolenKeys
215 views
58 Discussing
4
#BitcoinSpotETFsTurnNetPositiveYTD
197 views
44 Discussing
5
#GrayscaleZcashETFHits$1BNetAssets
455 views
26 Discussing
6
#BitcoinSpotETFsNetInflow$191M
4,480 views
153 Discussing
7
#CFTCUpdatesGuidanceOnTokenizedAssets
29,099 views
1,068 Discussing
8
#BitgetSays$352MAffectedInHack
11,499 views
84 Discussing
9
#BinanceWillListHyperliquid(HYPE)
230,570 views
3,613 Discussing
10
#BrazilOrdersReportingOf$10KSelfCustodyTransfers
4,541 views
52 Discussing