eth320

7,009 views
71 Discussing
320 WYATT
·
--
Bullish
$ETH {spot}(ETHUSDT) Ethereum is currently trading at $2,295, maintaining a short-term bearish bias as it holds below key Exponential Moving Averages (EMAs). If the price attempts a recovery, it faces immediate overhead resistance at the 200-day EMA near $2,313, followed by the 100-day EMA at $2,353, and a broken ascending trendline pivot at $2,385. Higher horizontal and moving average barriers stand at $2,400 and $2,417 respectively, with a major cap further off at $2,770. On the downside, if the current pullback extends, the next critical structural support sits near $1,823, where buyers are expected to step in and defend the broader uptrend. This bearish outlook is supported by technical indicators, as the RSI remains weak at 37 and the MACD is negative, suggesting that any upward bounces will likely trigger selling pressure into nearby resistance. #ETH320 #Trendingissue #Trendingcoin320 #mr320 #writetoearn320
$ETH
Ethereum is currently trading at $2,295, maintaining a short-term bearish bias as it holds below key Exponential Moving Averages (EMAs). If the price attempts a recovery, it faces immediate overhead resistance at the 200-day EMA near $2,313, followed by the 100-day EMA at $2,353, and a broken ascending trendline pivot at $2,385. Higher horizontal and moving average barriers stand at $2,400 and $2,417 respectively, with a major cap further off at $2,770. On the downside, if the current pullback extends, the next critical structural support sits near $1,823, where buyers are expected to step in and defend the broader uptrend. This bearish outlook is supported by technical indicators, as the RSI remains weak at 37 and the MACD is negative, suggesting that any upward bounces will likely trigger selling pressure into nearby resistance.

#ETH320 #Trendingissue #Trendingcoin320 #mr320 #writetoearn320
·
--
Bearish
$ETH {spot}(ETHUSDT) 🚨Ethereum Price This Month🚨 After the sharp sell-off in June, Ethereum has spent the past few weeks finding its footing. Instead of continuing lower, the price has settled into a well-defined range, with buyers stepping in around $1,650–1,700 and sellers repeatedly defending the $1,800–1,850 zone. This back-and-forth has kept ETH in consolidation, but there are subtle signs that buyers are becoming more confident. Every pullback has been met with demand, allowing the market to print a series of higher lows. At the same time, bulls have yet to push through resistance, leaving the broader outlook undecided. For now, Ethereum remains at an important crossroads. A convincing move above the current range could shift momentum in favour of buyers, while another rejection would suggest that sellers are still firmly in control. #ETH320 #Trendingissue #mr320 #WriteToEarn2026 #BinanceTurns9
$ETH
🚨Ethereum Price This Month🚨

After the sharp sell-off in June, Ethereum has spent the past few weeks finding its footing. Instead of continuing lower, the price has settled into a well-defined range, with buyers stepping in around $1,650–1,700 and sellers repeatedly defending the $1,800–1,850 zone. This back-and-forth has kept ETH in consolidation, but there are subtle signs that buyers are becoming more confident.
Every pullback has been met with demand, allowing the market to print a series of higher lows. At the same time, bulls have yet to push through resistance, leaving the broader outlook undecided. For now, Ethereum remains at an important crossroads. A convincing move above the current range could shift momentum in favour of buyers, while another rejection would suggest that sellers are still firmly in control.

#ETH320 #Trendingissue #mr320 #WriteToEarn2026 #BinanceTurns9
·
--
Bullish
$ETH {spot}(ETHUSDT) 🚨Ethereum Coin Price Prediction for This Week🚨 Ethereum is projected to trade between $1,718 and $1,801 this week. ETH is currently above the 20-day EMA but still below the 50-day EMA at $1,801.25, making this level the key breakout zone for the week. A daily close above $1,801 could improve Ethereum’s short-term price outlook and open the path toward $1,960. On the downside, losing the $1,718 support level could bring renewed selling pressure. #ETH320 #Trendingissue #mr320 #WriteToEarn2026 #EthereumFoundationAIAgentsFindNodeCrashBug
$ETH
🚨Ethereum Coin Price Prediction for This Week🚨

Ethereum is projected to trade between $1,718 and $1,801 this week. ETH is currently above the 20-day EMA but still below the 50-day EMA at $1,801.25, making this level the key breakout zone for the week. A daily close above $1,801 could improve Ethereum’s short-term price outlook and open the path toward $1,960. On the downside, losing the $1,718 support level could bring renewed selling pressure.

#ETH320 #Trendingissue #mr320 #WriteToEarn2026 #EthereumFoundationAIAgentsFindNodeCrashBug
·
--
Bullish
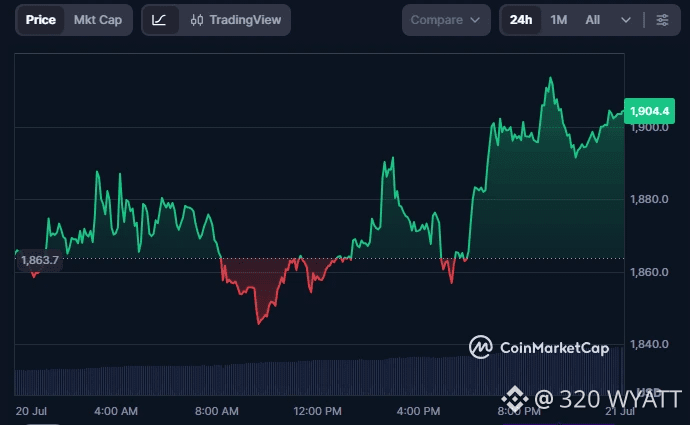
$ETH {spot}(ETHUSDT) 🚨Ethereum retesting a new support zone🚨 In the last 24 hours, Ethereum briefly pulled back below the support line, then once again recovered to trade above it. At press time, the price of ETH was $1,904, as the coin gained 2.35% in that time period. If buyers outnumber sellers, they can defend this recovery, and we will consider the re-test complete. This would also lay reliable groundwork for a continuation in the upward trend. A weekly close above the support line would further validate market strength and the potential for its next macro leg upward. #eth #ETH320 #mr320 #Trendingissue #WriteToEarn2026
$ETH
🚨Ethereum retesting a new support zone🚨

In the last 24 hours, Ethereum briefly pulled back below the support line, then once again recovered to trade above it. At press time, the price of ETH was $1,904, as the coin gained 2.35% in that time period.
If buyers outnumber sellers, they can defend this recovery, and we will consider the re-test complete. This would also lay reliable groundwork for a continuation in the upward trend. A weekly close above the support line would further validate market strength and the potential for its next macro leg upward.

#eth #ETH320 #mr320 #Trendingissue #WriteToEarn2026
·
--
Bullish
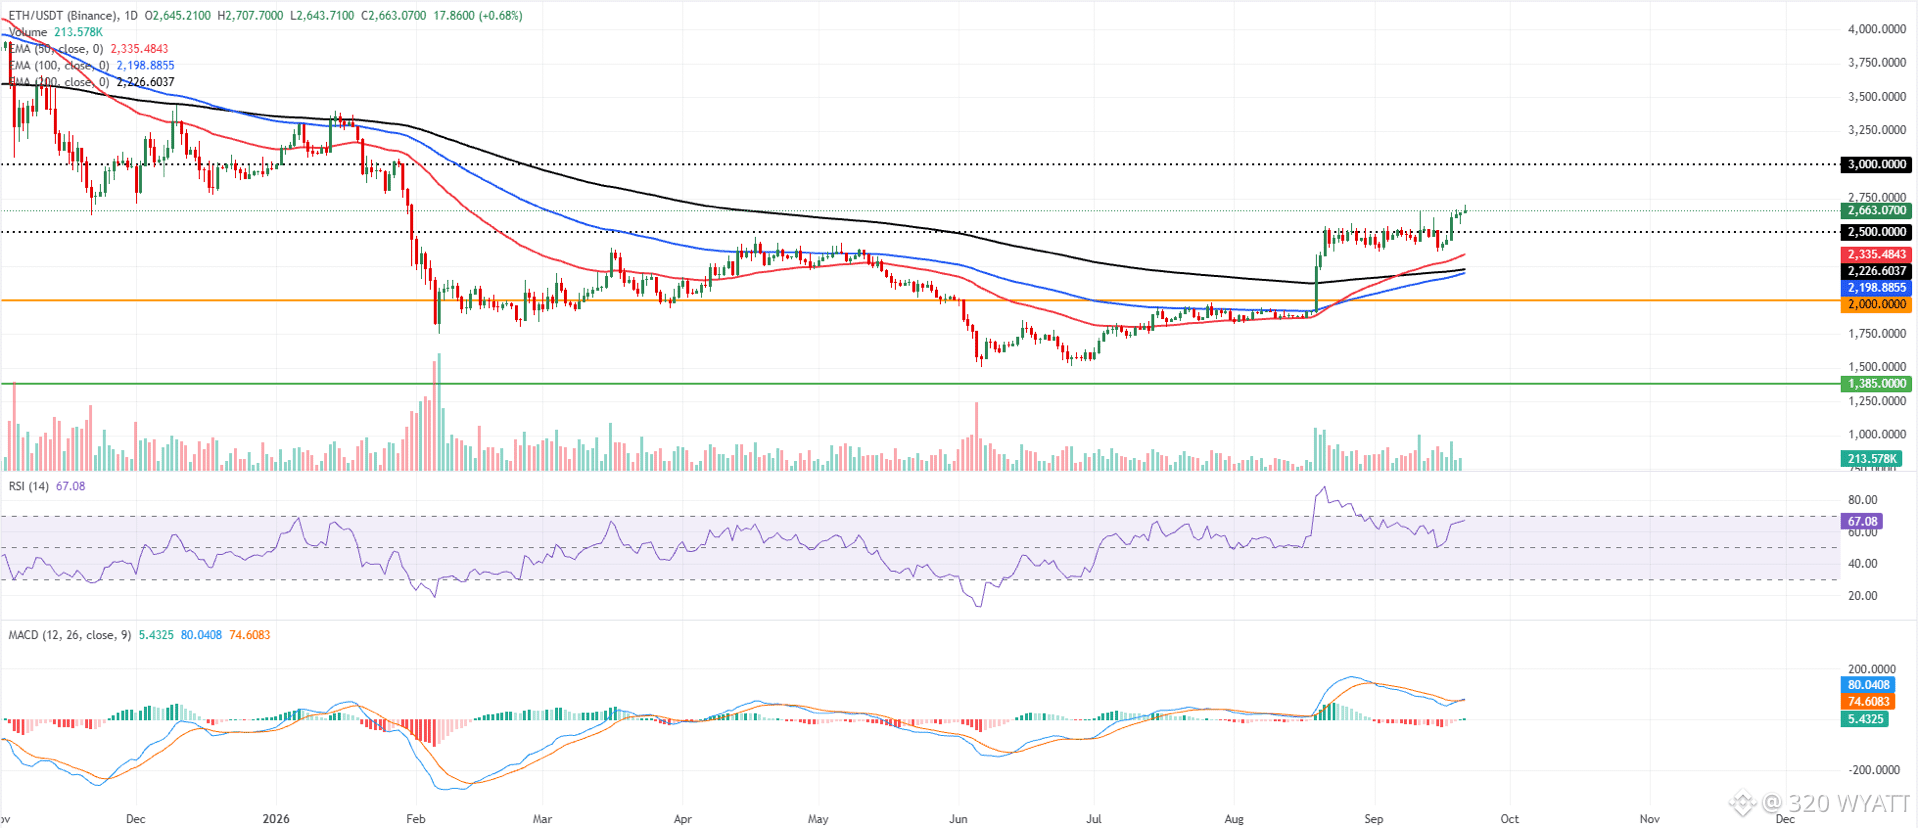
$ETH {spot}(ETHUSDT) 🚨🚨Ethereum bulls in control Ethereum price trades at $2,663 on Monday, maintaining a bullish near-term bias as price holds well above the 50-day, 100-day and 200-day EMAs, clustered between roughly $2,200 and $2,335. This stacked EMA structure suggests a firmly supported uptrend. At the same time, the RSI near 67 keeps the market just shy of overbought territory, and the MACD has turned positive, suggesting upside momentum remains intact but is maturing. On the downside, initial support appears at the recent horizontal level around $2,500, with the 50-day EMA at about $2,335 and the 100-day and 200-day EMAs near $2,198–$2,226 offering a deeper demand zone ahead of the psychological $2,000 handle. On the topside, the next notable resistance is the horizontal barrier at $3,000, and a daily close above this cap would open the way for further gains. At the same time, failure to clear it could encourage consolidation or a corrective pullback toward the EMA cluster. #ETH320 #ETH #Trendingissue #writetoearn2027 #mr320
$ETH
🚨🚨Ethereum bulls in control

Ethereum price trades at $2,663 on Monday, maintaining a bullish near-term bias as price holds well above the 50-day, 100-day and 200-day EMAs, clustered between roughly $2,200 and $2,335. This stacked EMA structure suggests a firmly supported uptrend. At the same time, the RSI near 67 keeps the market just shy of overbought territory, and the MACD has turned positive, suggesting upside momentum remains intact but is maturing.
On the downside, initial support appears at the recent horizontal level around $2,500, with the 50-day EMA at about $2,335 and the 100-day and 200-day EMAs near $2,198–$2,226 offering a deeper demand zone ahead of the psychological $2,000 handle.

On the topside, the next notable resistance is the horizontal barrier at $3,000, and a daily close above this cap would open the way for further gains. At the same time, failure to clear it could encourage consolidation or a corrective pullback toward the EMA cluster.

#ETH320 #ETH #Trendingissue #writetoearn2027 #mr320
·
--
Bullish
$ETH {spot}(ETHUSDT) A prominent crypto whale, currently netting over $5 million in weekly profits, has aggressively scaled into a massive $61 million Ethereum ($ETH) short position. This highly leveraged bearish bet faces an immediate liquidation price of $3,014. Should $ETH price action experience a sharp upward impulse and breach this psychological threshold, it will trigger an automated forced liquidation. This could potentially spark a "short squeeze," rapidly accelerating upward volatility. #ETH320 #mr320 #Trendingcoin320 #Trendingissue #writetoearn320
$ETH
A prominent crypto whale, currently netting over $5 million in weekly profits, has aggressively scaled into a massive $61 million Ethereum ($ETH ) short position.
This highly leveraged bearish bet faces an immediate liquidation price of $3,014. Should $ETH price action experience a sharp upward impulse and breach this psychological threshold, it will trigger an automated forced liquidation. This could potentially spark a "short squeeze," rapidly accelerating upward volatility.

#ETH320 #mr320 #Trendingcoin320 #Trendingissue #writetoearn320
·
--
Bullish
$ETH {spot}(ETHUSDT) 🚨ETH/USDT Market Snapshot🚨 24-Hour Range: Ether has fluctuated between a low of 1,776.38 USDT and a peak high of 1,809.76 USDT. Trading Volume: Global 24-hour volume for the asset is hitting 7.70 Billion USDT. Market Capitalization: Total ecosystem evaluation rests at 217.20 Billion USDT, consolidating its spot as the second-largest crypto. Circulating Supply: The network currently has 120.68 Million ETH in live circulation. #ETH320 #Trendingissue #mr320 #Trendingissue #writetoearn2026
$ETH
🚨ETH/USDT Market Snapshot🚨

24-Hour Range: Ether has fluctuated between a low of 1,776.38 USDT and a peak high of 1,809.76 USDT.

Trading Volume: Global 24-hour volume for the asset is hitting 7.70 Billion USDT.

Market Capitalization: Total ecosystem evaluation rests at 217.20 Billion USDT, consolidating its spot as the second-largest crypto.

Circulating Supply: The network currently has 120.68 Million ETH in live circulation.

#ETH320 #Trendingissue #mr320 #Trendingissue #writetoearn2026
·
--
Bearish
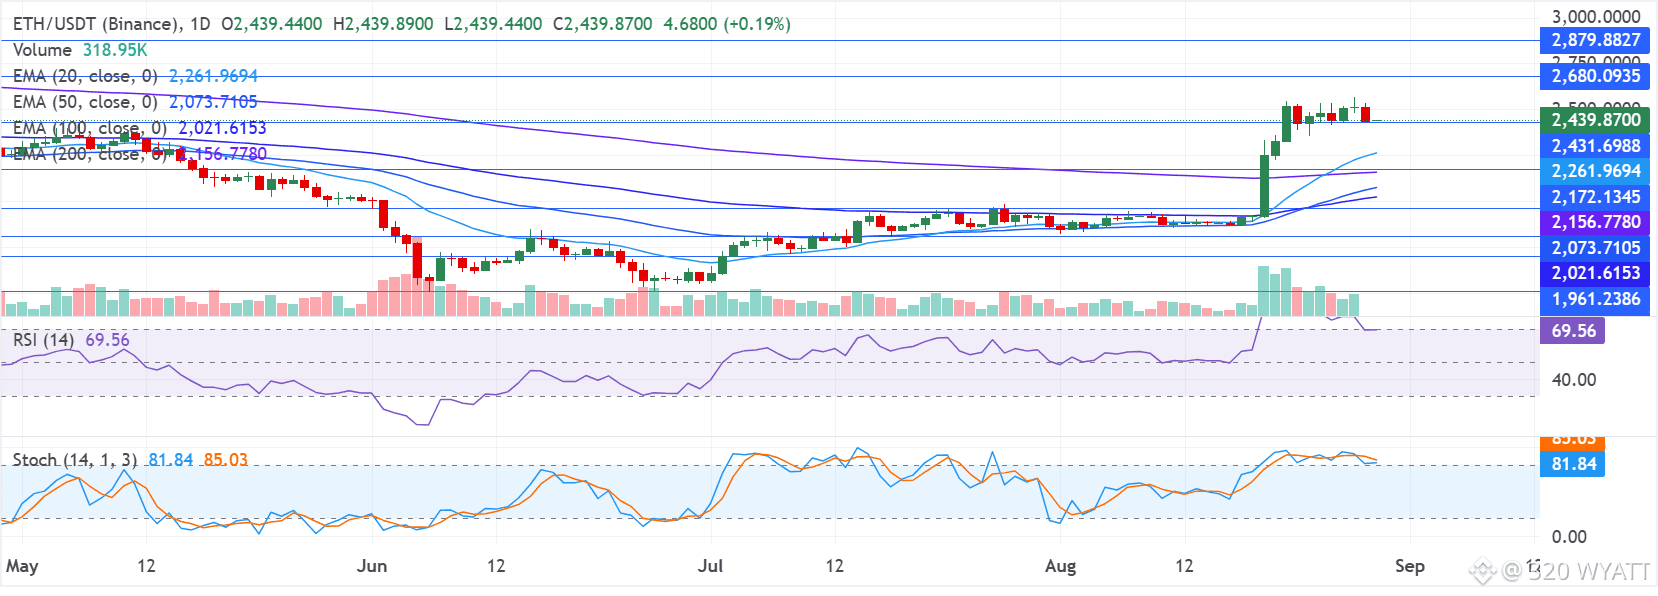
$ETH {spot}(ETHUSDT) 🚨Ethereum Price Forecast: ETH retests $2,431 support🚨 Ethereum recorded $97.3 million in liquidations over the past 24 hours, led by $75.8 million in long liquidations, according to Coinglass data. On the daily chart, ETH is holding a bullish near-term bias as it extends above its key Exponential Moving Averages (EMAs). The 20-day EMA at $2,261, along with the 50-, 100- and 200-day EMAs clustered between roughly $2,073 and $2,156, sits below price and suggests a well-supported uptrend. Momentum is strong, with the 14-day Relative Strength Index (RSI) hovering just under the overbought threshold at 69 and the Stochastic Oscillator (Stoch) elevated at 81, indicating bullish pressure persists as the rally becomes stretched in the short term. On the downside, immediate support is seen near the recent horizontal pivot at $2,431, which has held prices over the past week, followed by the 20-day EMA and prior structural floors at $2,172 and $1,961. Deeper pullbacks would expose the broader support band defined by the long-term EMAs between $2,021 and $2,156. Below that are the previous swing bases at $1,809, $1,701 and $1,507. #ETH320 #eth #mr320 #Trendingissue #WriteToEarn2026
$ETH
🚨Ethereum Price Forecast: ETH retests $2,431 support🚨

Ethereum recorded $97.3 million in liquidations over the past 24 hours, led by $75.8 million in long liquidations, according to Coinglass data.
On the daily chart, ETH is holding a bullish near-term bias as it extends above its key Exponential Moving Averages (EMAs). The 20-day EMA at $2,261, along with the 50-, 100- and 200-day EMAs clustered between roughly $2,073 and $2,156, sits below price and suggests a well-supported uptrend.
Momentum is strong, with the 14-day Relative Strength Index (RSI) hovering just under the overbought threshold at 69 and the Stochastic Oscillator (Stoch) elevated at 81, indicating bullish pressure persists as the rally becomes stretched in the short term.
On the downside, immediate support is seen near the recent horizontal pivot at $2,431, which has held prices over the past week, followed by the 20-day EMA and prior structural floors at $2,172 and $1,961. Deeper pullbacks would expose the broader support band defined by the long-term EMAs between $2,021 and $2,156. Below that are the previous swing bases at $1,809, $1,701 and $1,507.

#ETH320 #eth #mr320 #Trendingissue #WriteToEarn2026
·
--
Bullish
$ETH {spot}(ETHUSDT) ETF inflows give Ethereum regulated demand beyond crypto-native exchanges. One $143.8 million session does not guarantee a lasting trend, but institutions added exposure as ETH reclaimed higher levels. Continued buying could support $2,800 and then $3,000. Ethereum's broader investment case remains anchored in smart contracts, stablecoins, tokenized assets and decentralized finance. Its large developer base and settlement activity give ETH several long-term demand channels. However, buyers should watch whether inflows persist, because one strong session can be reversed if macro conditions or Treasury yields turn against risk assets. #ETH320 #writetoearn2026 #mr320 #Trendingissue #EthereumSurpasses$2700
$ETH
ETF inflows give Ethereum regulated demand beyond crypto-native exchanges. One $143.8 million session does not guarantee a lasting trend, but institutions added exposure as ETH reclaimed higher levels. Continued buying could support $2,800 and then $3,000.
Ethereum's broader investment case remains anchored in smart contracts, stablecoins, tokenized assets and decentralized finance. Its large developer base and settlement activity give ETH several long-term demand channels. However, buyers should watch whether inflows persist, because one strong session can be reversed if macro conditions or Treasury yields turn against risk assets.

#ETH320 #writetoearn2026 #mr320 #Trendingissue #EthereumSurpasses$2700
Ethereum Up or Down on September 22?

Ethereum Up or Down on September 22?

1%Up99%Down
Volume $74,891.63
·
--
Bullish
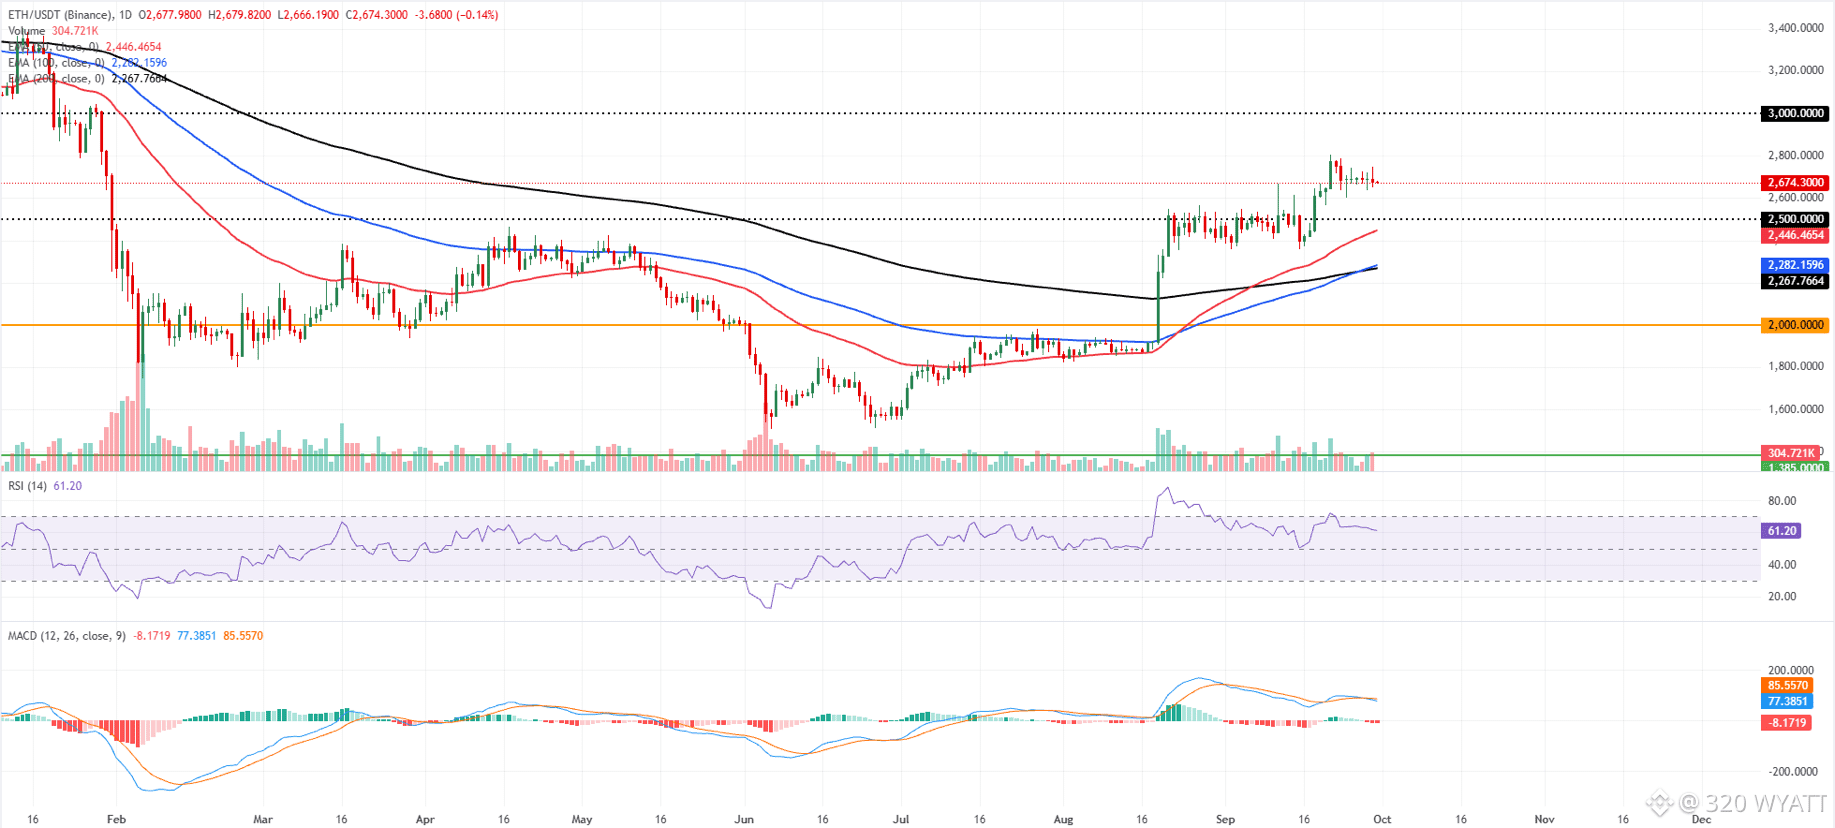
$ETH {spot}(ETHUSDT) 🚨 Ethereum bulls show signs of exhaustion 🚨 Ethereum price trades at $2,674 on Wednesday, consolidating near recent highs as bulls show signs of exhaustion. Despite pauses in its rally, ETH holds a constructive bias as it remains well above the 50-day, 100-day and 200-day EMAs at $2,446, $2,282 and $2,267, respectively. The cluster of underlying EMAs and the horizontal level at $2,500 reinforce a supportive backdrop. At the same time, the RSI around 61 suggests steady, but not overextended, upside momentum even as the MACD indicator slips further below zero, hinting at a mild loss of short-term upside conviction rather than a full-fledged reversal. On the downside, immediate support is seen at the $2,500 horizontal line, followed closely by the 50-day EMA at $2,446, with the 100-day and 200-day EMAs at $2,282 and $2,267 providing a deeper demand band ahead of the more distant $2,000 and $1,385 structural floors. On the topside, the next relevant resistance is the psychological $3,000 barrier, and a decisive daily close above it would likely open the way for an extension of the prevailing uptrend despite the currently cautious MACD signal. #ETH320 #mr320 #Trendingissue #Trendingcoin320 #writetoearn320
$ETH
🚨 Ethereum bulls show signs of exhaustion 🚨

Ethereum price trades at $2,674 on Wednesday, consolidating near recent highs as bulls show signs of exhaustion. Despite pauses in its rally, ETH holds a constructive bias as it remains well above the 50-day, 100-day and 200-day EMAs at $2,446, $2,282 and $2,267, respectively.
The cluster of underlying EMAs and the horizontal level at $2,500 reinforce a supportive backdrop. At the same time, the RSI around 61 suggests steady, but not overextended, upside momentum even as the MACD indicator slips further below zero, hinting at a mild loss of short-term upside conviction rather than a full-fledged reversal.
On the downside, immediate support is seen at the $2,500 horizontal line, followed closely by the 50-day EMA at $2,446, with the 100-day and 200-day EMAs at $2,282 and $2,267 providing a deeper demand band ahead of the more distant $2,000 and $1,385 structural floors.
On the topside, the next relevant resistance is the psychological $3,000 barrier, and a decisive daily close above it would likely open the way for an extension of the prevailing uptrend despite the currently cautious MACD signal.

#ETH320 #mr320 #Trendingissue #Trendingcoin320 #writetoearn320
·
--
Bullish
$BTC $ETH $XRP {spot}(XRPUSDT) {spot}(ETHUSDT) {spot}(BTCUSDT) 🚨XRP ETF Buyers Keep Showing Up Every Week🚨 demand for XRP's spot exchange-traded funds (ETFs) has held steady. The funds have drawn net inflows every week since mid-July, SoSoValue data shows. That streak now covers 11 weeks, including the current week through September 23. Bitcoin and Ethereum funds lacked that consistency. Bitcoin ETFs posted outflows in 3 of those weeks, including $462.7 million in the week ending September 11. Ethereum products lost $140 million in the week ending September 18. The XRP inflows are smaller, however. Most weeks brought in between $1 million and $20 million, although the week ending August 28 drew $110.5 million. Cumulative net inflows have now climbed to $1.75 billion. #BTC320 #ETH320 #xrp320 #Trendingissue #Trendingcoin320
$BTC $ETH $XRP
🚨XRP ETF Buyers Keep Showing Up Every Week🚨

demand for XRP's spot exchange-traded funds (ETFs) has held steady. The funds have drawn net inflows every week since mid-July, SoSoValue data shows. That streak now covers 11 weeks, including the current week through September 23.
Bitcoin and Ethereum funds lacked that consistency. Bitcoin ETFs posted outflows in 3 of those weeks, including $462.7 million in the week ending September 11. Ethereum products lost $140 million in the week ending September 18.
The XRP inflows are smaller, however. Most weeks brought in between $1 million and $20 million, although the week ending August 28 drew $110.5 million. Cumulative net inflows have now climbed to $1.75 billion.

#BTC320 #ETH320 #xrp320 #Trendingissue #Trendingcoin320
·
--
Bullish
$ETH {spot}(ETHUSDT) 🚨🚨Ethereum Coin Price Prediction for This Week Ethereum is projected to trade between $1,718 and $1,801 this week. ETH is currently above the 20-day EMA but still below the 50-day EMA at $1,801.25, making this level the key breakout zone for the week. A daily close above $1,801 could improve Ethereum’s short-term price outlook and open the path toward $1,960. On the downside, losing the $1,718 support level could bring renewed selling pressure. #eth #ETH320 #mr320 #Trendingissue #writetoearn2026
$ETH
🚨🚨Ethereum Coin Price Prediction for This Week

Ethereum is projected to trade between $1,718 and $1,801 this week. ETH is currently above the 20-day EMA but still below the 50-day EMA at $1,801.25, making this level the key breakout zone for the week. A daily close above $1,801 could improve Ethereum’s short-term price outlook and open the path toward $1,960. On the downside, losing the $1,718 support level could bring renewed selling pressure.

#eth #ETH320 #mr320 #Trendingissue #writetoearn2026
·
--
Bearish
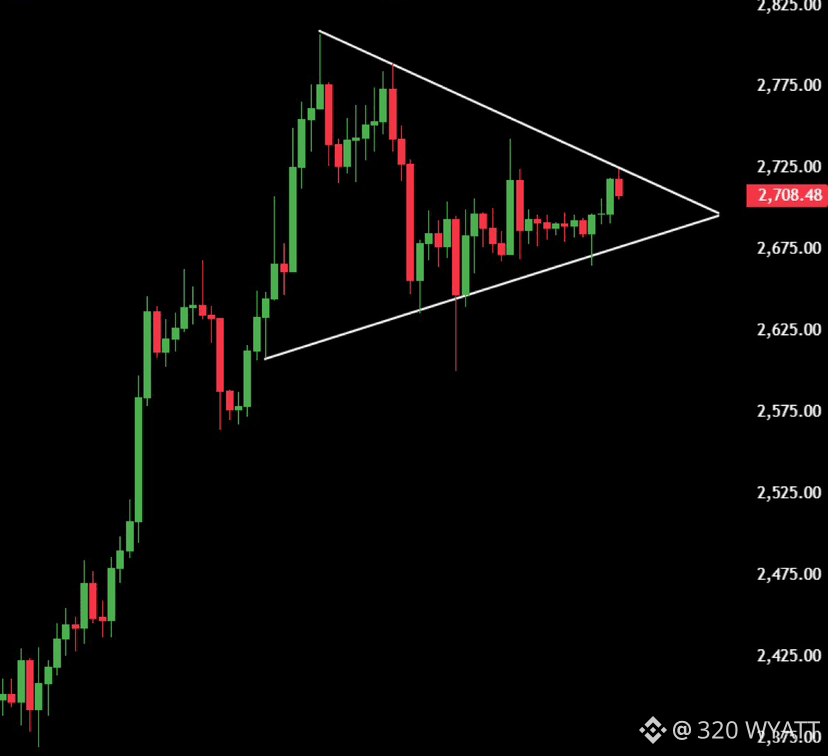
$ETH {spot}(ETHUSDT) Ethereum (ETH) is currently consolidating around $2,675, compressing directly beneath a formidable macro supply ceiling following persistent, yet hitherto unsuccessful, altercations with the $2,750–$2,800 resistance corridor. This localized accumulation succeeds a foundational, macro-scale double-bottom structure delineated near the $1,600 baseline, which catalyzed a structural reversal and the subsequent reclamation of the pivotal $2,000 psychological threshold. Having efficiently dismantled the secondary resistance cluster situated between $2,400 and $2,500, the asset now hinges on a critical inflection point. A decisive daily candle close exceeding the $2,800 threshold would validate an authentic structural breakout, shifting market focus toward the $3,000 milestone and exposing broader, higher-range supply regions. Conversely, should the immediate localized demand zone spanning $2,600–$2,650 fail to withstand bearish pressure, a deeper mean-reversion will likely precipitate, forcing market bulls to defend the $2,400–$2,450 structural retest zone to preserve the integrity of the macro uptrend. #ETH320 #Trendingissue #Trendingcoin320 #mr320 #writetoearn320
$ETH
Ethereum (ETH) is currently consolidating around $2,675, compressing directly beneath a formidable macro supply ceiling following persistent, yet hitherto unsuccessful, altercations with the $2,750–$2,800 resistance corridor. This localized accumulation succeeds a foundational, macro-scale double-bottom structure delineated near the $1,600 baseline, which catalyzed a structural reversal and the subsequent reclamation of the pivotal $2,000 psychological threshold. Having efficiently dismantled the secondary resistance cluster situated between $2,400 and $2,500, the asset now hinges on a critical inflection point. A decisive daily candle close exceeding the $2,800 threshold would validate an authentic structural breakout, shifting market focus toward the $3,000 milestone and exposing broader, higher-range supply regions. Conversely, should the immediate localized demand zone spanning $2,600–$2,650 fail to withstand bearish pressure, a deeper mean-reversion will likely precipitate, forcing market bulls to defend the $2,400–$2,450 structural retest zone to preserve the integrity of the macro uptrend.

#ETH320 #Trendingissue #Trendingcoin320 #mr320 #writetoearn320
·
--
Bullish
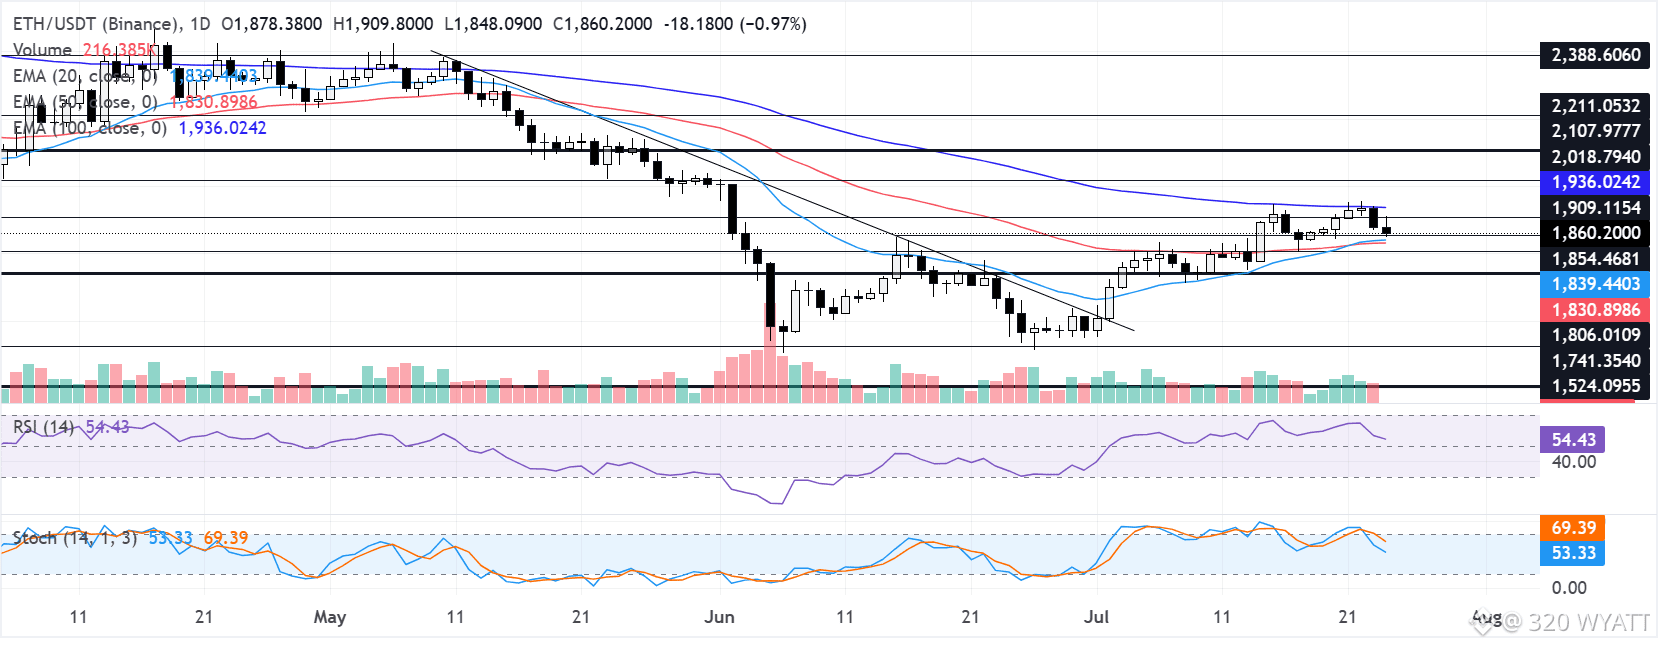
$ETH {spot}(ETHUSDT) 🚨🚨Ethereum Price Forecast: ETH risks further decline if it drops below the 20- and 50-day EMAs Ethereum has recorded $67.79 million in liquidations over the past 24 hours, led by $44.18 million in long liquidations. On the daily chart, ETH risks returning to a bearish structure as it is testing the 20- and 50-day Exponential Moving Averages (EMAs) at $1,839 and $1,831, respectively. Momentum gauges hint at declining buying pressure with the 14-day Relative Strength Index (RSI) and Stochastic Oscillator (Stoch) easing to 54 and 53, respectively. On the upside, initial resistance is seen at the horizontal barrier around $1,909, ahead of the 100-day EMA at $1,936 and the $2,019 zone, where prior supply has emerged. Further north, additional caps are located at $2,108 and $2,211, with more distant resistance clustered near $2,389 and $2,746. On the downside, immediate support is provided by the 20- and 50-day EMAs, followed by the recent structural floor near $1,806. A break below there would expose the next key supports around $1,741 and then $1,524. #eth #ETH320 #mr320 #writetoearn2026 #Trendingissue
$ETH
🚨🚨Ethereum Price Forecast: ETH risks further decline if it drops below the 20- and 50-day EMAs

Ethereum has recorded $67.79 million in liquidations over the past 24 hours, led by $44.18 million in long liquidations.
On the daily chart, ETH risks returning to a bearish structure as it is testing the 20- and 50-day Exponential Moving Averages (EMAs) at $1,839 and $1,831, respectively. Momentum gauges hint at declining buying pressure with the 14-day Relative Strength Index (RSI) and Stochastic Oscillator (Stoch) easing to 54 and 53, respectively.
On the upside, initial resistance is seen at the horizontal barrier around $1,909, ahead of the 100-day EMA at $1,936 and the $2,019 zone, where prior supply has emerged. Further north, additional caps are located at $2,108 and $2,211, with more distant resistance clustered near $2,389 and $2,746.
On the downside, immediate support is provided by the 20- and 50-day EMAs, followed by the recent structural floor near $1,806. A break below there would expose the next key supports around $1,741 and then $1,524.

#eth #ETH320 #mr320 #writetoearn2026 #Trendingissue
·
--
Bullish
$ETH {spot}(ETHUSDT) The chart’s projected path first extends toward approximately $2,688. It then turns lower toward the highlighted $2,587–$2,607 support band before outlining another advance. A dashed line near $2,597 marks the midpoint within that area. The projection places the follow-up recovery after the proposed test of this zone. The daily range high of $2,649.89 sits above the reaction band. However, the displayed retracement includes a move back below the range high before reaching the highlighted support. Under the supplied scenario, buyers would then defend that support before attempting to reach the upside liquidity target. Neither the support test nor its outcome is confirmed in the chart description. #ETH320 #mr320 #Trendingissue #WriteToEarn2026 #eth
$ETH
The chart’s projected path first extends toward approximately $2,688. It then turns lower toward the highlighted $2,587–$2,607 support band before outlining another advance. A dashed line near $2,597 marks the midpoint within that area. The projection places the follow-up recovery after the proposed test of this zone.
The daily range high of $2,649.89 sits above the reaction band. However, the displayed retracement includes a move back below the range high before reaching the highlighted support.
Under the supplied scenario, buyers would then defend that support before attempting to reach the upside liquidity target. Neither the support test nor its outcome is confirmed in the chart description.

#ETH320 #mr320 #Trendingissue #WriteToEarn2026 #eth
·
--
Bullish
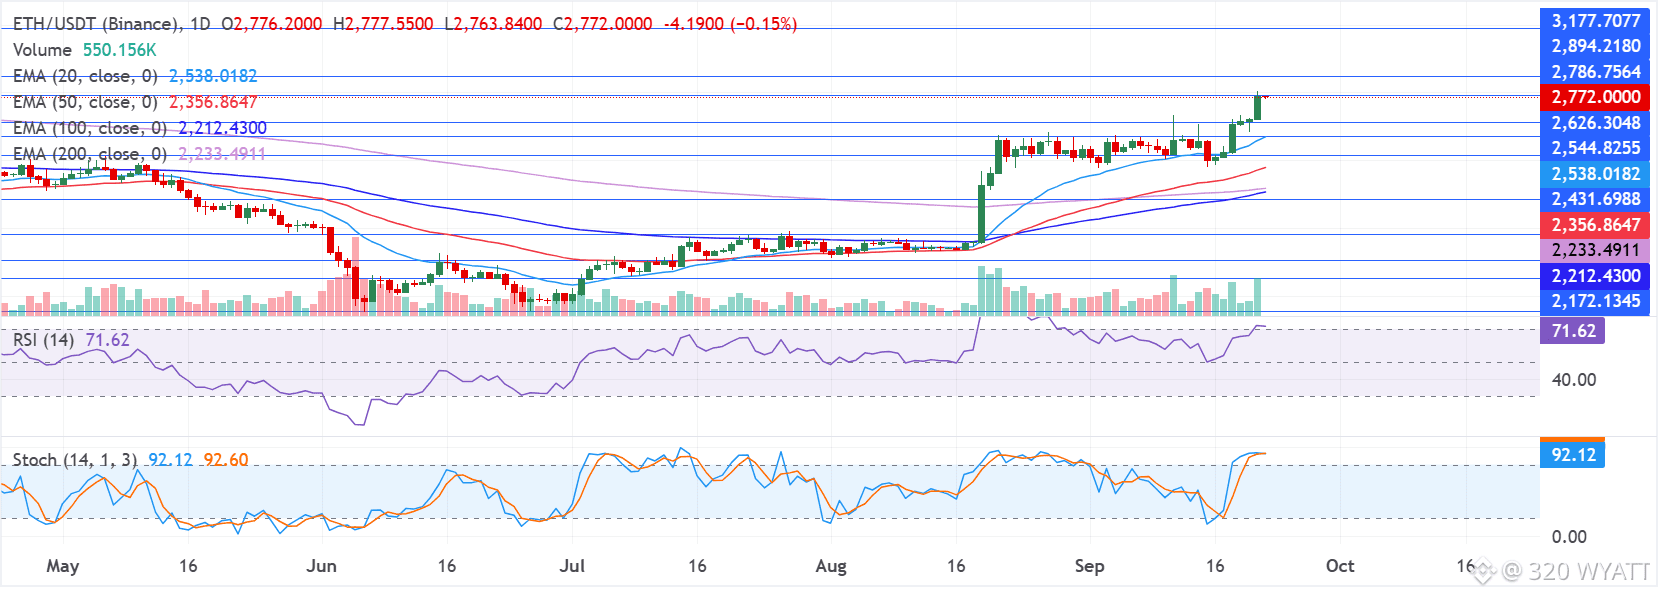
$ETH {spot}(ETHUSDT) 🚨Ethereum technical outlook: ETH faces $2,786 resistance🚨 Ethereum saw $224.7 million in liquidations over the past 24 hours, led by $191 million in short liquidations, according to Coinglass data. ​On the daily chart, ETH maintains a clear bullish bias as price holds well above the 20-, 50-, 100-, and 200-day Exponential Moving Averages (EMAs), with the 20-day EMA at $2,537 leading the short-term uptrend. The 14-day Relative Strength Index (RSI) at 71 and the Stochastic Oscillator (Stoch) at 91 both sit in overbought territory, suggesting strong but potentially stretched upside momentum as price grinds toward nearby overhead levels. On the topside, immediate resistance is located at the horizontal barrier at $2,786, which caps the latest advance for now before the $2,894 and $3,177 levels. On the downside, initial support is seen at the recent structural floor around $2,626, followed by a dense demand zone formed by the $2,544 horizontal level and the 20-day EMA at $2,537. Below that, the $2,431 horizontal support aligns with the 50-day EMA at $2,356, while deeper pullbacks could target the 200- and 100-day EMA before the prior support band near $2,172. #ETH320 #mr320 #Trendingissue #WriteToEarn2026 #eth
$ETH
🚨Ethereum technical outlook: ETH faces $2,786 resistance🚨

Ethereum saw $224.7 million in liquidations over the past 24 hours, led by $191 million in short liquidations, according to Coinglass data.
​On the daily chart, ETH maintains a clear bullish bias as price holds well above the 20-, 50-, 100-, and 200-day Exponential Moving Averages (EMAs), with the 20-day EMA at $2,537 leading the short-term uptrend.
The 14-day Relative Strength Index (RSI) at 71 and the Stochastic Oscillator (Stoch) at 91 both sit in overbought territory, suggesting strong but potentially stretched upside momentum as price grinds toward nearby overhead levels.
On the topside, immediate resistance is located at the horizontal barrier at $2,786, which caps the latest advance for now before the $2,894 and $3,177 levels.
On the downside, initial support is seen at the recent structural floor around $2,626, followed by a dense demand zone formed by the $2,544 horizontal level and the 20-day EMA at $2,537. Below that, the $2,431 horizontal support aligns with the 50-day EMA at $2,356, while deeper pullbacks could target the 200- and 100-day EMA before the prior support band near $2,172.

#ETH320 #mr320 #Trendingissue #WriteToEarn2026 #eth

·
--
Bearish
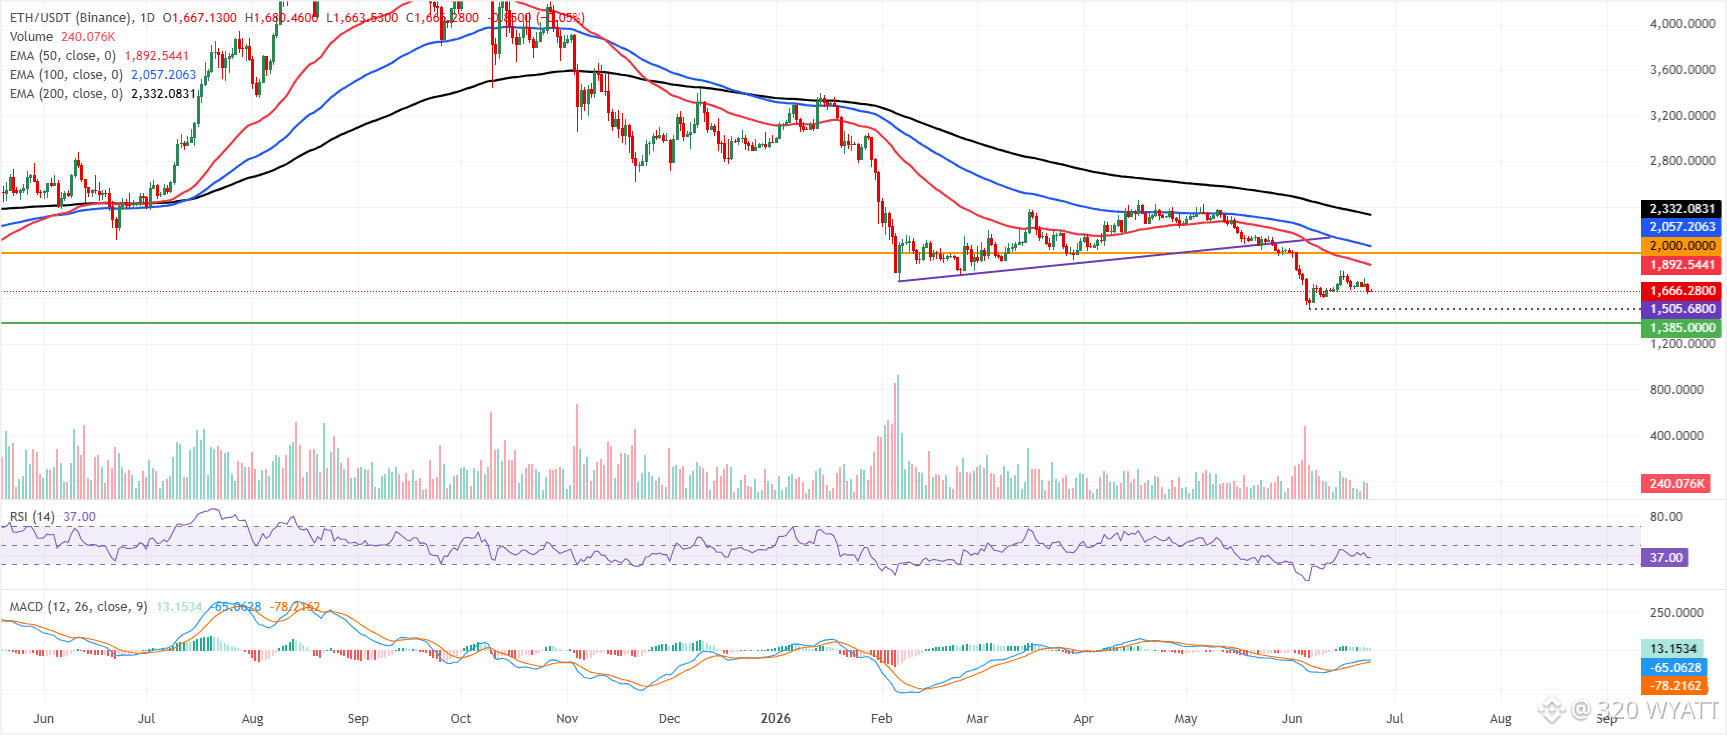
$ETH {spot}(ETHUSDT) Ethereum price trades at $1,666 on Wednesday, retaining a bearish near-term bias as price holds well below the key EMAs. The 50-day EMA is around $1,892, the 100-day EMA near $2,057 and the 200-day EMA at about $2,332 all sit overhead, suggesting that rebounds remain corrective within a broader downtrend. Momentum is attempting to stabilize, with the RSI hovering near 37 and MACD holding in positive territory, but this improvement has yet to translate into a meaningful reclaim of structural levels. On the topside, initial resistance is seen at the horizontal barrier near $2,000, ahead of the 50-day EMA at $1,892, which, together with the 100-day EMA at $2,057 and the 200-day EMA at $2,332, defines a dense supply zone that could cap any recovery attempts. On the downside, the next notable support does not appear until the prior horizontal floor near $1,385, and a daily close below recent lows would expose that area, reinforcing the prevailing bearish structure despite the tentative improvement in momentum indicators. #eth320 #Trendingissue #mr320 #WriteToEarn2026 #100kUser
$ETH
Ethereum price trades at $1,666 on Wednesday, retaining a bearish near-term bias as price holds well below the key EMAs. The 50-day EMA is around $1,892, the 100-day EMA near $2,057 and the 200-day EMA at about $2,332 all sit overhead, suggesting that rebounds remain corrective within a broader downtrend.
Momentum is attempting to stabilize, with the RSI hovering near 37 and MACD holding in positive territory, but this improvement has yet to translate into a meaningful reclaim of structural levels.
On the topside, initial resistance is seen at the horizontal barrier near $2,000, ahead of the 50-day EMA at $1,892, which, together with the 100-day EMA at $2,057 and the 200-day EMA at $2,332, defines a dense supply zone that could cap any recovery attempts.
On the downside, the next notable support does not appear until the prior horizontal floor near $1,385, and a daily close below recent lows would expose that area, reinforcing the prevailing bearish structure despite the tentative improvement in momentum indicators.

#eth320 #Trendingissue #mr320 #WriteToEarn2026 #100kUser
·
--
Bullish
Log in to explore more content
Join global crypto users on Binance Square
⚡️ Get latest and useful information about crypto.
💬 Trusted by the world’s largest crypto exchange.
👍 Discover real insights from verified creators.
Email / Phone number