
#xrp320
xrp320
101,727 views
299 Discussing
Hot
Latest

·
--
Bearish
$XRP
{spot}(XRPUSDT)
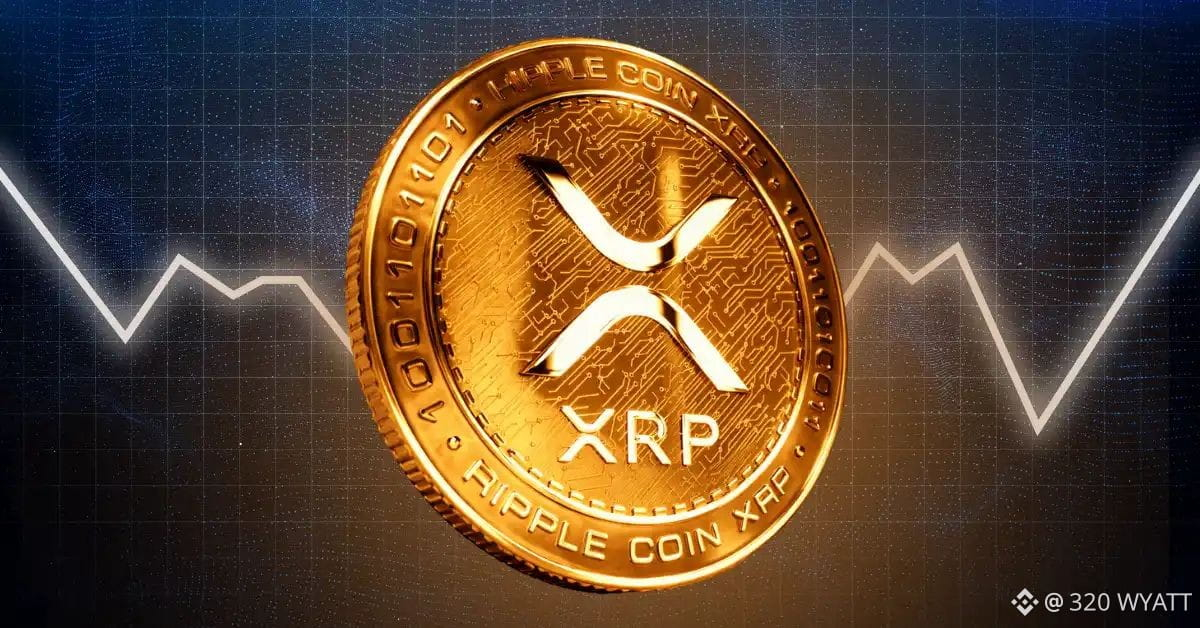
XRP was trading around $1.38 on September 20, according to CoinMarketCap, with the cryptocurrency showing a decline of around 2% over the previous 24 hours. The token moved between approximately $1.37 and $1.45 during the latest trading period, highlighting the volatility that has continued to affect the market. XRP's market capitalisation stood at roughly $86.76 billion, keeping it among the five largest cryptocurrencies by market value.
The latest decline comes after XRP posted a strong recovery during the previous sessions, meaning the token is currently giving back part of those gains rather than moving from a prolonged period of weakness.
XRP's recent price movement has been closely linked to developments across the wider cryptocurrency market. The token fell sharply toward the $1.25-$1.30 area after the CLARITY Act setback but subsequently attracted buying interest as investors looked for lower entry levels. The recovery took XRP back above $1.40, although the cryptocurrency has struggled to maintain momentum near the $1.45-$1.50 resistance zone.
This has created a key technical battle between buyers attempting to extend the rebound and sellers looking to prevent XRP from establishing a sustained move above the recent trading range.
#xrp320 #xrp #mr320 #Trendingissue #WriteToEarn2026
$XRP
XRP was trading around $1.38 on September 20, according to CoinMarketCap, with the cryptocurrency showing a decline of around 2% over the previous 24 hours. The token moved between approximately $1.37 and $1.45 during the latest trading period, highlighting the volatility that has continued to affect the market. XRP's market capitalisation stood at roughly $86.76 billion, keeping it among the five largest cryptocurrencies by market value.
The latest decline comes after XRP posted a strong recovery during the previous sessions, meaning the token is currently giving back part of those gains rather than moving from a prolonged period of weakness.
XRP's recent price movement has been closely linked to developments across the wider cryptocurrency market. The token fell sharply toward the $1.25-$1.30 area after the CLARITY Act setback but subsequently attracted buying interest as investors looked for lower entry levels. The recovery took XRP back above $1.40, although the cryptocurrency has struggled to maintain momentum near the $1.45-$1.50 resistance zone.
This has created a key technical battle between buyers attempting to extend the rebound and sellers looking to prevent XRP from establishing a sustained move above the recent trading range.
#xrp320 #xrp #mr320 #Trendingissue #WriteToEarn2026
XRP was trading around $1.38 on September 20, according to CoinMarketCap, with the cryptocurrency showing a decline of around 2% over the previous 24 hours. The token moved between approximately $1.37 and $1.45 during the latest trading period, highlighting the volatility that has continued to affect the market. XRP's market capitalisation stood at roughly $86.76 billion, keeping it among the five largest cryptocurrencies by market value.
The latest decline comes after XRP posted a strong recovery during the previous sessions, meaning the token is currently giving back part of those gains rather than moving from a prolonged period of weakness.
XRP's recent price movement has been closely linked to developments across the wider cryptocurrency market. The token fell sharply toward the $1.25-$1.30 area after the CLARITY Act setback but subsequently attracted buying interest as investors looked for lower entry levels. The recovery took XRP back above $1.40, although the cryptocurrency has struggled to maintain momentum near the $1.45-$1.50 resistance zone.
This has created a key technical battle between buyers attempting to extend the rebound and sellers looking to prevent XRP from establishing a sustained move above the recent trading range.
#xrp320 #xrp #mr320 #Trendingissue #WriteToEarn2026
28
·
--
Bearish
$XRP
{spot}(XRPUSDT)
From a technical perspective, XRP has now moved back above the $1.40 area that previously acted as resistance.
Traders are watching $1.50 as the next major level. A sustained move above that zone could bring the $1.70 - $2.00 region back into focus.
However, XRP still needs to hold its recent breakout and avoid falling back below the $1.38 - $1.40 area.
For now, the combination of short liquidations, rising XRPL activity and the September 29 Batch upgrade has put XRP back in focus as the token trades above $1.40.
#xrp #xrp320 #Trendingissue #mr320 #WriteToEarn2026
$XRP
From a technical perspective, XRP has now moved back above the $1.40 area that previously acted as resistance.
Traders are watching $1.50 as the next major level. A sustained move above that zone could bring the $1.70 - $2.00 region back into focus.
However, XRP still needs to hold its recent breakout and avoid falling back below the $1.38 - $1.40 area.
For now, the combination of short liquidations, rising XRPL activity and the September 29 Batch upgrade has put XRP back in focus as the token trades above $1.40.
#xrp #xrp320 #Trendingissue #mr320 #WriteToEarn2026
From a technical perspective, XRP has now moved back above the $1.40 area that previously acted as resistance.
Traders are watching $1.50 as the next major level. A sustained move above that zone could bring the $1.70 - $2.00 region back into focus.
However, XRP still needs to hold its recent breakout and avoid falling back below the $1.38 - $1.40 area.
For now, the combination of short liquidations, rising XRPL activity and the September 29 Batch upgrade has put XRP back in focus as the token trades above $1.40.
#xrp #xrp320 #Trendingissue #mr320 #WriteToEarn2026
24
·
--
Bearish
$XRP
{spot}(XRPUSDT)
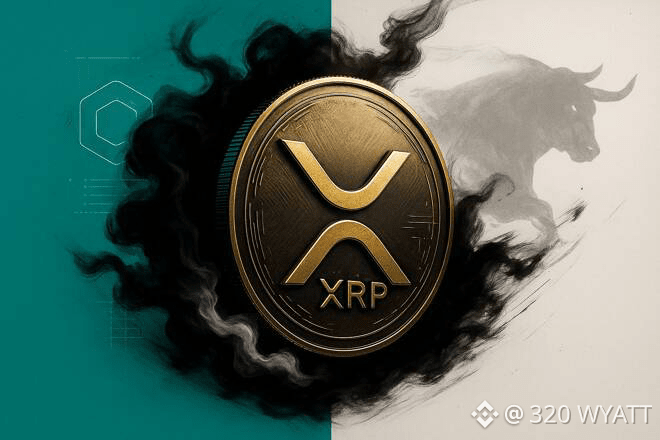
XRP can still reach $2 if regulatory clarity improves, ETF demand strengthens, and key resistance breaks. The target remains possible, but the path needs confirmation. Bulls need stronger volume and a reclaim of the next resistance band before traders can treat $2 as the next obvious target. That keeps the prediction alive, but it does not solve the timing problem for buyers who want faster beta before Q1 2027.
#xrp320 #mr320 #Trendingissue #writetoearn2026 #xrp
$XRP
XRP can still reach $2 if regulatory clarity improves, ETF demand strengthens, and key resistance breaks. The target remains possible, but the path needs confirmation. Bulls need stronger volume and a reclaim of the next resistance band before traders can treat $2 as the next obvious target. That keeps the prediction alive, but it does not solve the timing problem for buyers who want faster beta before Q1 2027.
#xrp320 #mr320 #Trendingissue #writetoearn2026 #xrp
XRP can still reach $2 if regulatory clarity improves, ETF demand strengthens, and key resistance breaks. The target remains possible, but the path needs confirmation. Bulls need stronger volume and a reclaim of the next resistance band before traders can treat $2 as the next obvious target. That keeps the prediction alive, but it does not solve the timing problem for buyers who want faster beta before Q1 2027.
#xrp320 #mr320 #Trendingissue #writetoearn2026 #xrp
56
·
--
Bullish
$XRP
{spot}(XRPUSDT)
XRP leads because the current setup provides a defined chart event while its longer-term narrative concerns transfers and institutional access. The technical signal may draw attention, but payment-related adoption and market structure remain more durable questions. Researchers should track whether momentum holds instead of assuming the crossover itself causes demand.
#xrp320 #xrp #mr320 #Trendingissue #WriteToEarn2026
$XRP
XRP leads because the current setup provides a defined chart event while its longer-term narrative concerns transfers and institutional access. The technical signal may draw attention, but payment-related adoption and market structure remain more durable questions. Researchers should track whether momentum holds instead of assuming the crossover itself causes demand.
#xrp320 #xrp #mr320 #Trendingissue #WriteToEarn2026
XRP leads because the current setup provides a defined chart event while its longer-term narrative concerns transfers and institutional access. The technical signal may draw attention, but payment-related adoption and market structure remain more durable questions. Researchers should track whether momentum holds instead of assuming the crossover itself causes demand.
#xrp320 #xrp #mr320 #Trendingissue #WriteToEarn2026

133
·
--
Bullish
$XRP
{spot}(XRPUSDT)
🚨🚨XRP Position Remains Open Above $1.40
The two screenshots document the sequence from the July accumulation statement to the September leveraged position: XRP near $1.06 on the July chart, a $0.9918 long entry, and a September mark price of $1.4036.
That puts XRP roughly 41.5% above the stated entry price, while the displayed 20x leveraged position shows +830.51%. The position screenshot indicates the trade remained open as of September 19, 2026.
#xrp #mr320 #Trendingissue #WriteToEarn2026 #xrp320
$XRP
🚨🚨XRP Position Remains Open Above $1.40
The two screenshots document the sequence from the July accumulation statement to the September leveraged position: XRP near $1.06 on the July chart, a $0.9918 long entry, and a September mark price of $1.4036.
That puts XRP roughly 41.5% above the stated entry price, while the displayed 20x leveraged position shows +830.51%. The position screenshot indicates the trade remained open as of September 19, 2026.
#xrp #mr320 #Trendingissue #WriteToEarn2026 #xrp320
🚨🚨XRP Position Remains Open Above $1.40
The two screenshots document the sequence from the July accumulation statement to the September leveraged position: XRP near $1.06 on the July chart, a $0.9918 long entry, and a September mark price of $1.4036.
That puts XRP roughly 41.5% above the stated entry price, while the displayed 20x leveraged position shows +830.51%. The position screenshot indicates the trade remained open as of September 19, 2026.
#xrp #mr320 #Trendingissue #WriteToEarn2026 #xrp320
1
74
·
--
Bullish
$XRP
{spot}(XRPUSDT)
🚨XRP Price and Volume Analysis🚨
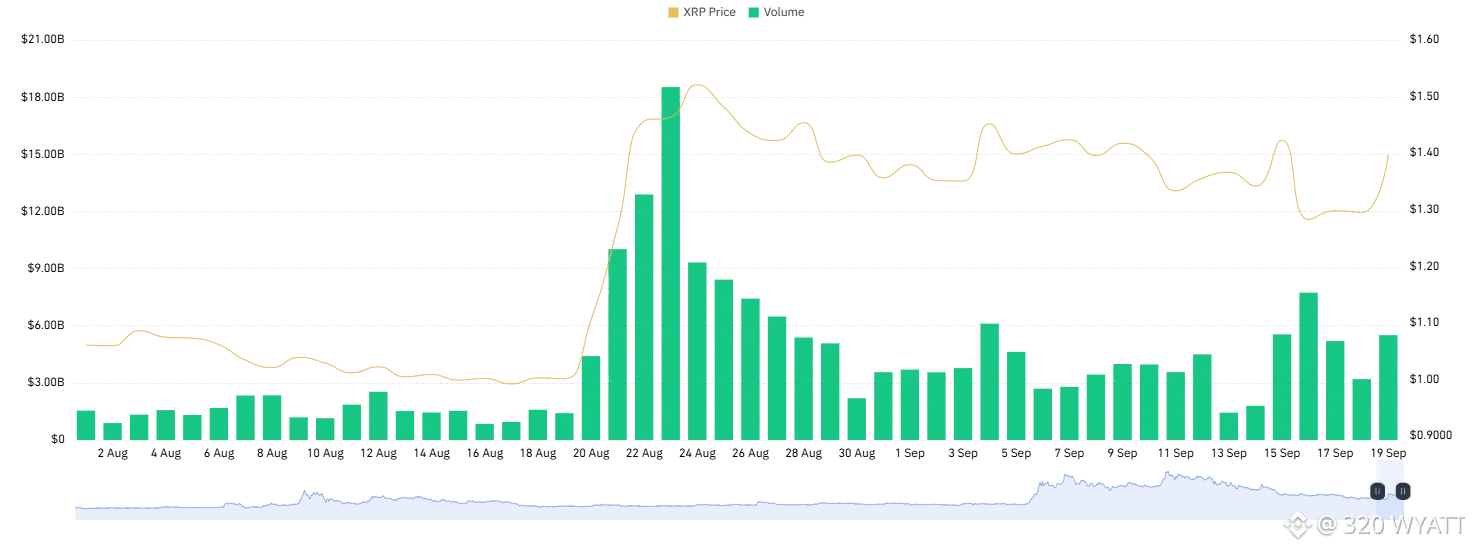
XRP price has spent the past month digesting one of its sharpest rallies of the year. After trading near $1.00 in mid-August, the token surged roughly 50% and touched about $1.52 on 24 August, backed by daily volume that peaked near $18.6 billion. Now trading around $1.40, XRP remains roughly 40% above its pre-rally base, and volume has settled at $1 billion a day, about double its early-August norm. Since the peak, price has moved between $1.25 and $1.55, with resistance at $1.50-$1.70 and support near $1.24-$1.30.
A daily close above $1.47 on rising volume could open a retest of $1.52 and possibly $1.60. If volume stays subdued, sideways trading is likely, while a break below $1.24 could push XRP toward $1.15 and eventually the $1.00-$1.05 base. The next move likely depends on whether buyers clear $1.47 or sellers force a breakdown.
#xrp320 #xrp #WriteToEarn2026 #Trendingissue #mr320
$XRP
🚨XRP Price and Volume Analysis🚨
XRP price has spent the past month digesting one of its sharpest rallies of the year. After trading near $1.00 in mid-August, the token surged roughly 50% and touched about $1.52 on 24 August, backed by daily volume that peaked near $18.6 billion. Now trading around $1.40, XRP remains roughly 40% above its pre-rally base, and volume has settled at $1 billion a day, about double its early-August norm. Since the peak, price has moved between $1.25 and $1.55, with resistance at $1.50-$1.70 and support near $1.24-$1.30.
A daily close above $1.47 on rising volume could open a retest of $1.52 and possibly $1.60. If volume stays subdued, sideways trading is likely, while a break below $1.24 could push XRP toward $1.15 and eventually the $1.00-$1.05 base. The next move likely depends on whether buyers clear $1.47 or sellers force a breakdown.
#xrp320 #xrp #WriteToEarn2026 #Trendingissue #mr320
🚨XRP Price and Volume Analysis🚨
XRP price has spent the past month digesting one of its sharpest rallies of the year. After trading near $1.00 in mid-August, the token surged roughly 50% and touched about $1.52 on 24 August, backed by daily volume that peaked near $18.6 billion. Now trading around $1.40, XRP remains roughly 40% above its pre-rally base, and volume has settled at $1 billion a day, about double its early-August norm. Since the peak, price has moved between $1.25 and $1.55, with resistance at $1.50-$1.70 and support near $1.24-$1.30.
A daily close above $1.47 on rising volume could open a retest of $1.52 and possibly $1.60. If volume stays subdued, sideways trading is likely, while a break below $1.24 could push XRP toward $1.15 and eventually the $1.00-$1.05 base. The next move likely depends on whether buyers clear $1.47 or sellers force a breakdown.
#xrp320 #xrp #WriteToEarn2026 #Trendingissue #mr320
158
·
--
Bullish
Verified
$XRP
{spot}(XRPUSDT)
The Senate voted 49 to 50 on September 15 to block the CLARITY Act. The bill would have tagged XRP as a commodity under U.S. law, per CryptoTimes. XRP fell nearly 10% in hours. Over $300 million in long bets were closed across the market. One day later, the Fed raised rates by 25 basis points to 3.75% to 4%, the first increase since July 2023. Crypto barely flinched.
Bitcoin held above $81,000, and XRP bounced back above $1.30. Grayscale described the increase as a single adjustment, not an opening shot in a longer series, per crypto.news. The bill is not dead, but its odds for 2026 dropped to 5% on Polymarket. For XRP, that leaves the path to $2 without a clear date.
#xrp320 #mr320 #writetoearn2026 #Trendingissue #xrp
$XRP
The Senate voted 49 to 50 on September 15 to block the CLARITY Act. The bill would have tagged XRP as a commodity under U.S. law, per CryptoTimes. XRP fell nearly 10% in hours. Over $300 million in long bets were closed across the market. One day later, the Fed raised rates by 25 basis points to 3.75% to 4%, the first increase since July 2023. Crypto barely flinched.
Bitcoin held above $81,000, and XRP bounced back above $1.30. Grayscale described the increase as a single adjustment, not an opening shot in a longer series, per crypto.news. The bill is not dead, but its odds for 2026 dropped to 5% on Polymarket. For XRP, that leaves the path to $2 without a clear date.
#xrp320 #mr320 #writetoearn2026 #Trendingissue #xrp
The Senate voted 49 to 50 on September 15 to block the CLARITY Act. The bill would have tagged XRP as a commodity under U.S. law, per CryptoTimes. XRP fell nearly 10% in hours. Over $300 million in long bets were closed across the market. One day later, the Fed raised rates by 25 basis points to 3.75% to 4%, the first increase since July 2023. Crypto barely flinched.
Bitcoin held above $81,000, and XRP bounced back above $1.30. Grayscale described the increase as a single adjustment, not an opening shot in a longer series, per crypto.news. The bill is not dead, but its odds for 2026 dropped to 5% on Polymarket. For XRP, that leaves the path to $2 without a clear date.
#xrp320 #mr320 #writetoearn2026 #Trendingissue #xrp
2.4k
·
--
Bullish
$XRP
{spot}(XRPUSDT)
🚨Bullish structure meets two-way risk as technical signals diverge🚨
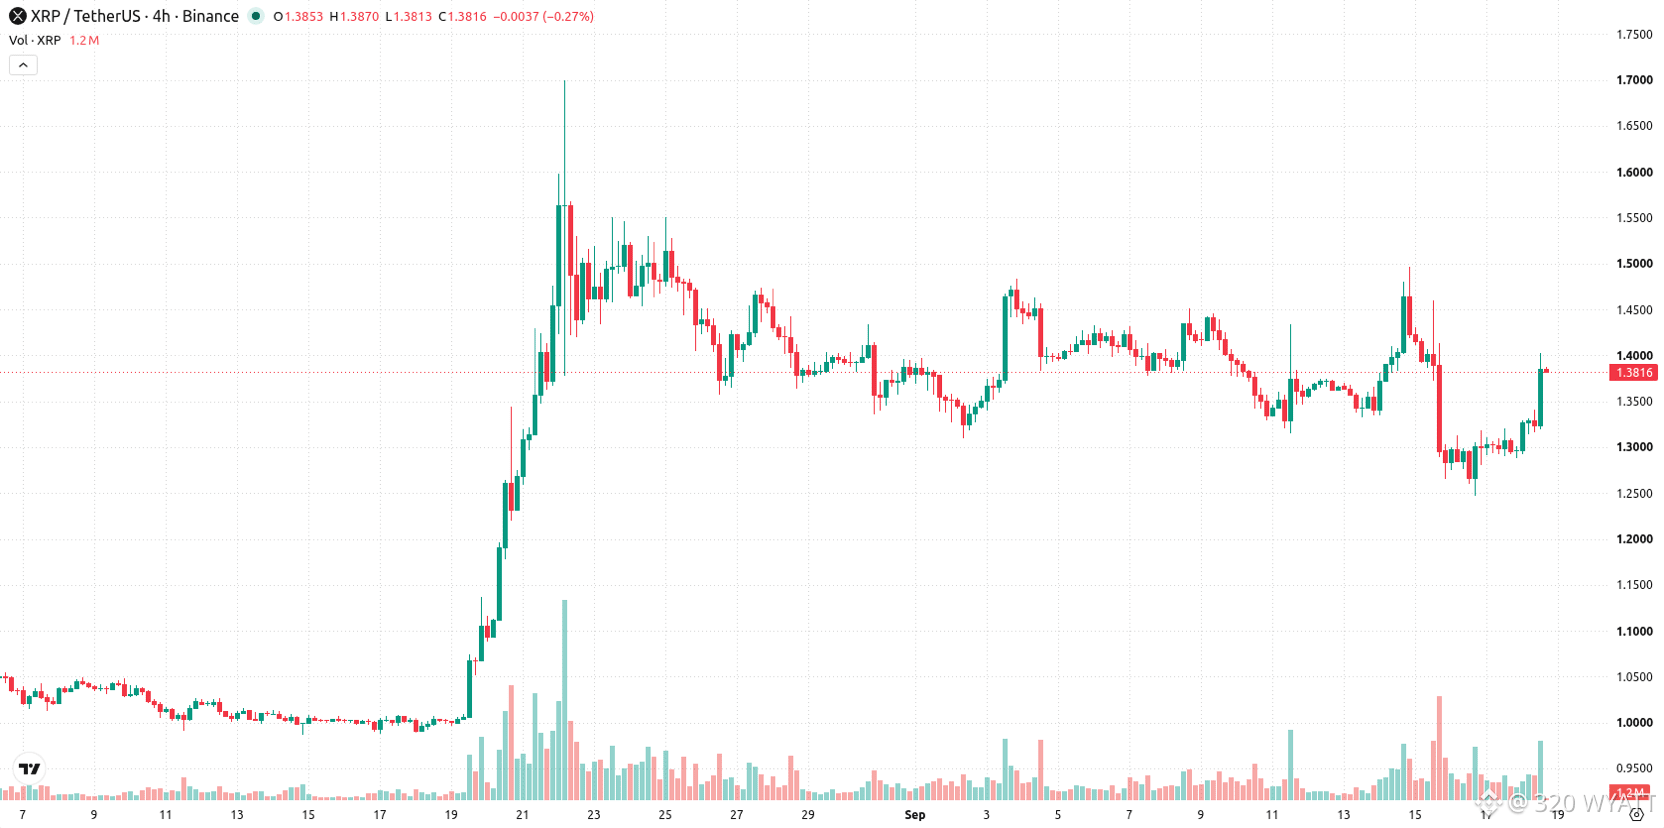
XRP/USD is trading above all key moving averages, with the current price at $1.3856, placing it above the 20-day ($1.3715), 50-day ($1.242), and 200-day ($1.2726) levels. This positioning favors a bullish structure across short-, medium-, and long-term time frames, even as the MA-50 vs MA-200 alignment remains bearish. Immediate levels are defined by support at $1.3715 (20-day MA) and resistance at $1.3988 (Ichimoku Kijun). Momentum indicators present a mixed picture: the Moving Average Convergence Divergence (MACD) signals strong buying interest, and the Average Directional Index (ADX) underscores continued trend strength. However, the Relative Strength Index (RSI), Commodity Channel Index (CCI), and Stochastic RSI all indicate oversold conditions, reflecting selling pressure has recently dominated. Bull/Bear Power (BBP) is negative, confirming that sellers currently have the upper hand intraday. The pair advanced $0.079 or 6.05% today, starting with a downside gap of about $0.01 or -0.78%, and now trades near its daily highs with intraday volatility at 3.82%. Strength toward highs persists, yet divergences between bullish momentum and oversold oscillators highlight increasing two-way risk as XRP/USD attempts to sustain gains.
#xrp320 #mr320 #Trendingissue #writetoearn2026 #xrp
$XRP
🚨Bullish structure meets two-way risk as technical signals diverge🚨
XRP/USD is trading above all key moving averages, with the current price at $1.3856, placing it above the 20-day ($1.3715), 50-day ($1.242), and 200-day ($1.2726) levels. This positioning favors a bullish structure across short-, medium-, and long-term time frames, even as the MA-50 vs MA-200 alignment remains bearish. Immediate levels are defined by support at $1.3715 (20-day MA) and resistance at $1.3988 (Ichimoku Kijun). Momentum indicators present a mixed picture: the Moving Average Convergence Divergence (MACD) signals strong buying interest, and the Average Directional Index (ADX) underscores continued trend strength. However, the Relative Strength Index (RSI), Commodity Channel Index (CCI), and Stochastic RSI all indicate oversold conditions, reflecting selling pressure has recently dominated. Bull/Bear Power (BBP) is negative, confirming that sellers currently have the upper hand intraday. The pair advanced $0.079 or 6.05% today, starting with a downside gap of about $0.01 or -0.78%, and now trades near its daily highs with intraday volatility at 3.82%. Strength toward highs persists, yet divergences between bullish momentum and oversold oscillators highlight increasing two-way risk as XRP/USD attempts to sustain gains.
#xrp320 #mr320 #Trendingissue #writetoearn2026 #xrp
🚨Bullish structure meets two-way risk as technical signals diverge🚨
XRP/USD is trading above all key moving averages, with the current price at $1.3856, placing it above the 20-day ($1.3715), 50-day ($1.242), and 200-day ($1.2726) levels. This positioning favors a bullish structure across short-, medium-, and long-term time frames, even as the MA-50 vs MA-200 alignment remains bearish. Immediate levels are defined by support at $1.3715 (20-day MA) and resistance at $1.3988 (Ichimoku Kijun). Momentum indicators present a mixed picture: the Moving Average Convergence Divergence (MACD) signals strong buying interest, and the Average Directional Index (ADX) underscores continued trend strength. However, the Relative Strength Index (RSI), Commodity Channel Index (CCI), and Stochastic RSI all indicate oversold conditions, reflecting selling pressure has recently dominated. Bull/Bear Power (BBP) is negative, confirming that sellers currently have the upper hand intraday. The pair advanced $0.079 or 6.05% today, starting with a downside gap of about $0.01 or -0.78%, and now trades near its daily highs with intraday volatility at 3.82%. Strength toward highs persists, yet divergences between bullish momentum and oversold oscillators highlight increasing two-way risk as XRP/USD attempts to sustain gains.
#xrp320 #mr320 #Trendingissue #writetoearn2026 #xrp
2
828
·
--
Bullish
$XRP
{spot}(XRPUSDT)
🚨XRP holds key support zone🚨
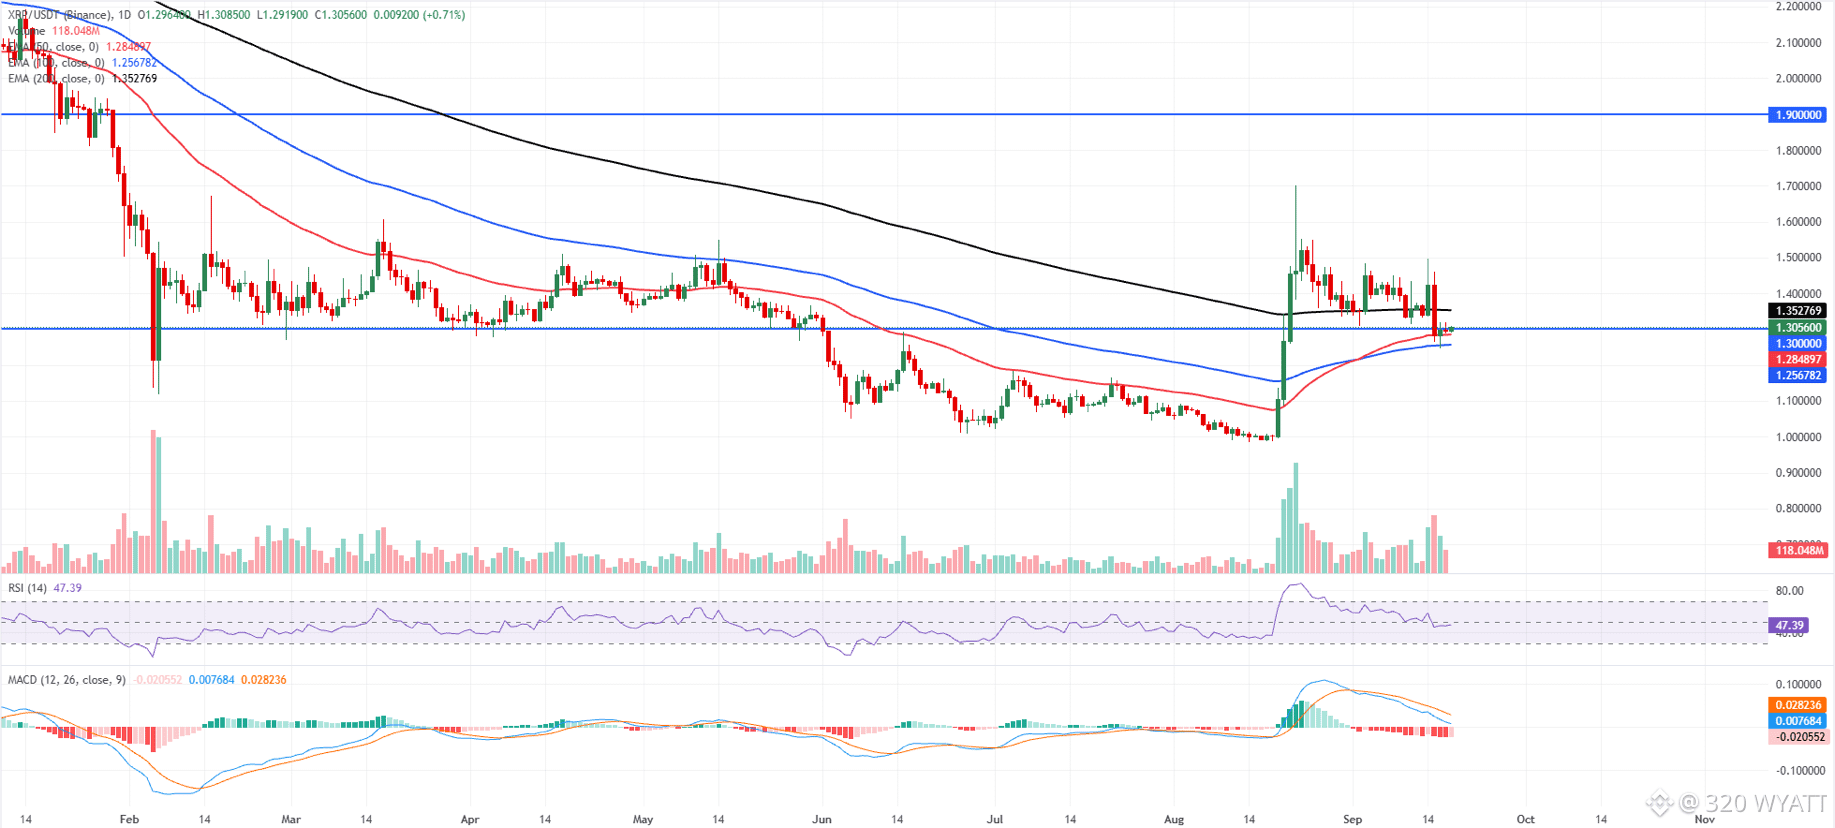
XRP price trades at $1.305 on Friday, hovering just above the $1.300 horizontal support and sitting between its medium- and long-term EMAs.
The 50-day EMA at $1.284 and 100-day EMA at $1.256 sit below price and suggest an underlying constructive tone, but the 200-day EMA at $1.352 overhead caps the upside and keeps the broader bias neutral for now.
The RSI at 47 is near the midline, reinforcing a consolidative backdrop. At the same time, the MACD indicator holds in negative territory with a slightly negative reading, hinting at fading bullish momentum rather than outright selling pressure.
On the downside, immediate support is seen at the $1.300 horizontal level, with the 50-day EMA at $1.284 and the 100-day EMA at $1.256 providing deeper technical cushions if sellers extend the pullback.
On the topside, initial resistance comes at the 200-day EMA at $1.352, and only a sustained break above this barrier would open the way toward the more distant horizontal resistance near $1.900, where a prior supply zone could reassert itself.
#xrp320 #mr320 #Trendingissue #xrp #WriteToEarn2026
$XRP
🚨XRP holds key support zone🚨
XRP price trades at $1.305 on Friday, hovering just above the $1.300 horizontal support and sitting between its medium- and long-term EMAs.
The 50-day EMA at $1.284 and 100-day EMA at $1.256 sit below price and suggest an underlying constructive tone, but the 200-day EMA at $1.352 overhead caps the upside and keeps the broader bias neutral for now.
The RSI at 47 is near the midline, reinforcing a consolidative backdrop. At the same time, the MACD indicator holds in negative territory with a slightly negative reading, hinting at fading bullish momentum rather than outright selling pressure.
On the downside, immediate support is seen at the $1.300 horizontal level, with the 50-day EMA at $1.284 and the 100-day EMA at $1.256 providing deeper technical cushions if sellers extend the pullback.
On the topside, initial resistance comes at the 200-day EMA at $1.352, and only a sustained break above this barrier would open the way toward the more distant horizontal resistance near $1.900, where a prior supply zone could reassert itself.
#xrp320 #mr320 #Trendingissue #xrp #WriteToEarn2026
🚨XRP holds key support zone🚨
XRP price trades at $1.305 on Friday, hovering just above the $1.300 horizontal support and sitting between its medium- and long-term EMAs.
The 50-day EMA at $1.284 and 100-day EMA at $1.256 sit below price and suggest an underlying constructive tone, but the 200-day EMA at $1.352 overhead caps the upside and keeps the broader bias neutral for now.
The RSI at 47 is near the midline, reinforcing a consolidative backdrop. At the same time, the MACD indicator holds in negative territory with a slightly negative reading, hinting at fading bullish momentum rather than outright selling pressure.
On the downside, immediate support is seen at the $1.300 horizontal level, with the 50-day EMA at $1.284 and the 100-day EMA at $1.256 providing deeper technical cushions if sellers extend the pullback.
On the topside, initial resistance comes at the 200-day EMA at $1.352, and only a sustained break above this barrier would open the way toward the more distant horizontal resistance near $1.900, where a prior supply zone could reassert itself.
#xrp320 #mr320 #Trendingissue #xrp #WriteToEarn2026
2
572
·
--
Bullish
$XRP
{spot}(XRPUSDT)
XRP () closed September 2023 at $0.51 and trades at $1.39 today, amounting to a 2.7x gain. XRP returned 2.1x in the window before that, climbing from $0.24 in September 2020 to $0.51. However, neither run saw XRP climb back to its $3.84 record high from January 2018.
The next three years bring a presidential election and another Bitcoin halving event, both already on the calendar. With XRP now 64% below its all-time high, where could the XRP price be in September 2029?
#xrp #mr320 #xrp320 #Trendingissue #writetoearn2026
$XRP
XRP () closed September 2023 at $0.51 and trades at $1.39 today, amounting to a 2.7x gain. XRP returned 2.1x in the window before that, climbing from $0.24 in September 2020 to $0.51. However, neither run saw XRP climb back to its $3.84 record high from January 2018.
The next three years bring a presidential election and another Bitcoin halving event, both already on the calendar. With XRP now 64% below its all-time high, where could the XRP price be in September 2029?
#xrp #mr320 #xrp320 #Trendingissue #writetoearn2026
XRP () closed September 2023 at $0.51 and trades at $1.39 today, amounting to a 2.7x gain. XRP returned 2.1x in the window before that, climbing from $0.24 in September 2020 to $0.51. However, neither run saw XRP climb back to its $3.84 record high from January 2018.
The next three years bring a presidential election and another Bitcoin halving event, both already on the calendar. With XRP now 64% below its all-time high, where could the XRP price be in September 2029?
#xrp #mr320 #xrp320 #Trendingissue #writetoearn2026
142
·
--
Bullish
$XRP
{spot}(XRPUSDT)
XRP price trades at $1.42 on Tuesday after surging over 6% the previous day. XRP holds firmly above the 50-day, 100-day, and 200-day Exponential Moving Averages (EMAs), clustered between roughly $1.26 and $1.36, suggesting a constructive medium-term structure and keeping the near-term bias tilted to the upside.
The Relative Strength Index (RSI) hovers just below 60, indicating positive but not overstretched momentum, while the Moving Average Convergence Divergence (MACD) remains marginally negative, hinting that bullish pressure is moderating rather than accelerating.
On the downside, initial support is seen at the 200-day EMA around $1.35, followed by horizontal support near $1.30 and the 50-day EMA at $1.28, with the 100-day EMA further down at $1.25 before a stronger structural floor near $1.00.
On the topside, the next notable resistance comes at the previously defined horizontal barrier around $1.90, and a daily close above this area would be needed to unlock scope for a renewed bullish extension.
#xrp320 #mr320 #WriteToEarn2026 #xrp #FedHikeOddsRiseTo89%
$XRP
XRP price trades at $1.42 on Tuesday after surging over 6% the previous day. XRP holds firmly above the 50-day, 100-day, and 200-day Exponential Moving Averages (EMAs), clustered between roughly $1.26 and $1.36, suggesting a constructive medium-term structure and keeping the near-term bias tilted to the upside.
The Relative Strength Index (RSI) hovers just below 60, indicating positive but not overstretched momentum, while the Moving Average Convergence Divergence (MACD) remains marginally negative, hinting that bullish pressure is moderating rather than accelerating.
On the downside, initial support is seen at the 200-day EMA around $1.35, followed by horizontal support near $1.30 and the 50-day EMA at $1.28, with the 100-day EMA further down at $1.25 before a stronger structural floor near $1.00.
On the topside, the next notable resistance comes at the previously defined horizontal barrier around $1.90, and a daily close above this area would be needed to unlock scope for a renewed bullish extension.
#xrp320 #mr320 #WriteToEarn2026 #xrp #FedHikeOddsRiseTo89%
XRP price trades at $1.42 on Tuesday after surging over 6% the previous day. XRP holds firmly above the 50-day, 100-day, and 200-day Exponential Moving Averages (EMAs), clustered between roughly $1.26 and $1.36, suggesting a constructive medium-term structure and keeping the near-term bias tilted to the upside.
The Relative Strength Index (RSI) hovers just below 60, indicating positive but not overstretched momentum, while the Moving Average Convergence Divergence (MACD) remains marginally negative, hinting that bullish pressure is moderating rather than accelerating.
On the downside, initial support is seen at the 200-day EMA around $1.35, followed by horizontal support near $1.30 and the 50-day EMA at $1.28, with the 100-day EMA further down at $1.25 before a stronger structural floor near $1.00.
On the topside, the next notable resistance comes at the previously defined horizontal barrier around $1.90, and a daily close above this area would be needed to unlock scope for a renewed bullish extension.
#xrp320 #mr320 #WriteToEarn2026 #xrp #FedHikeOddsRiseTo89%
1
1.1k
·
--
Bullish
$XRP
{spot}(XRPUSDT)
XRP is trading in the low-$1.30s, just below its recent seven-day range in the low-to-high $1.30s. That points to a sideways-to-mildly bearish structure heading into the final stretch of September. Volume has concentrated around the mid-$1.30s, reinforcing that area as an important line in the sand.
Support sits in layers. The first floor is around the low-$1.30s, near the 20-day EMA, while the next major zone sits around $1.25–$1.30 near the 50-day EMA. Resistance builds quickly above the current range.
#xrp320 #mr320 #Trendingissue #writetoearn2026 #xrp
$XRP
XRP is trading in the low-$1.30s, just below its recent seven-day range in the low-to-high $1.30s. That points to a sideways-to-mildly bearish structure heading into the final stretch of September. Volume has concentrated around the mid-$1.30s, reinforcing that area as an important line in the sand.
Support sits in layers. The first floor is around the low-$1.30s, near the 20-day EMA, while the next major zone sits around $1.25–$1.30 near the 50-day EMA. Resistance builds quickly above the current range.
#xrp320 #mr320 #Trendingissue #writetoearn2026 #xrp
XRP is trading in the low-$1.30s, just below its recent seven-day range in the low-to-high $1.30s. That points to a sideways-to-mildly bearish structure heading into the final stretch of September. Volume has concentrated around the mid-$1.30s, reinforcing that area as an important line in the sand.
Support sits in layers. The first floor is around the low-$1.30s, near the 20-day EMA, while the next major zone sits around $1.25–$1.30 near the 50-day EMA. Resistance builds quickly above the current range.
#xrp320 #mr320 #Trendingissue #writetoearn2026 #xrp
1
176
·
--
Bearish
$XRP
{spot}(XRPUSDT)
XRP can still push toward $2 if regulatory clarity improves, resistance breaks, and broader risk appetite returns. The target remains possible, but the path needs confirmation. Bulls want a clean move, not a choppy grind through key levels.
XRP Waits for Confirmation While AlphaPepe's Presale Clock Keeps Moving
XRP near $2 keeps the macro story alive. The question is not which asset is safer. The question is which entry closes first. Listed coins already have the chart. AlphaPepe still has the window before the chart exists.
Every cycle teaches the same lesson: the biggest return stories usually start before the crowd gets the chart. AlphaPepe gives that earlier setup, with a live AI DEX, audits, exchange momentum, and a presale clock that keeps moving while blue chips wait for confirmation.
The crowd only understands the trade after the chart is already public. AlphaPepe buyers are entering before the public chart exists. Stage 20 nearing sellout makes the timing tighter. The bonus drop window adds urgency for buyers who want larger multipliers before the next price tier locks in.
#xrp320 #xrp #Trendingissue #mr320 #WriteToEarn2026
$XRP
XRP can still push toward $2 if regulatory clarity improves, resistance breaks, and broader risk appetite returns. The target remains possible, but the path needs confirmation. Bulls want a clean move, not a choppy grind through key levels.
XRP Waits for Confirmation While AlphaPepe's Presale Clock Keeps Moving
XRP near $2 keeps the macro story alive. The question is not which asset is safer. The question is which entry closes first. Listed coins already have the chart. AlphaPepe still has the window before the chart exists.
Every cycle teaches the same lesson: the biggest return stories usually start before the crowd gets the chart. AlphaPepe gives that earlier setup, with a live AI DEX, audits, exchange momentum, and a presale clock that keeps moving while blue chips wait for confirmation.
The crowd only understands the trade after the chart is already public. AlphaPepe buyers are entering before the public chart exists. Stage 20 nearing sellout makes the timing tighter. The bonus drop window adds urgency for buyers who want larger multipliers before the next price tier locks in.
#xrp320 #xrp #Trendingissue #mr320 #WriteToEarn2026
XRP can still push toward $2 if regulatory clarity improves, resistance breaks, and broader risk appetite returns. The target remains possible, but the path needs confirmation. Bulls want a clean move, not a choppy grind through key levels.
XRP Waits for Confirmation While AlphaPepe's Presale Clock Keeps Moving
XRP near $2 keeps the macro story alive. The question is not which asset is safer. The question is which entry closes first. Listed coins already have the chart. AlphaPepe still has the window before the chart exists.
Every cycle teaches the same lesson: the biggest return stories usually start before the crowd gets the chart. AlphaPepe gives that earlier setup, with a live AI DEX, audits, exchange momentum, and a presale clock that keeps moving while blue chips wait for confirmation.
The crowd only understands the trade after the chart is already public. AlphaPepe buyers are entering before the public chart exists. Stage 20 nearing sellout makes the timing tighter. The bonus drop window adds urgency for buyers who want larger multipliers before the next price tier locks in.
#xrp320 #xrp #Trendingissue #mr320 #WriteToEarn2026
243
·
--
Bullish
$XRP
{spot}(XRPUSDT)
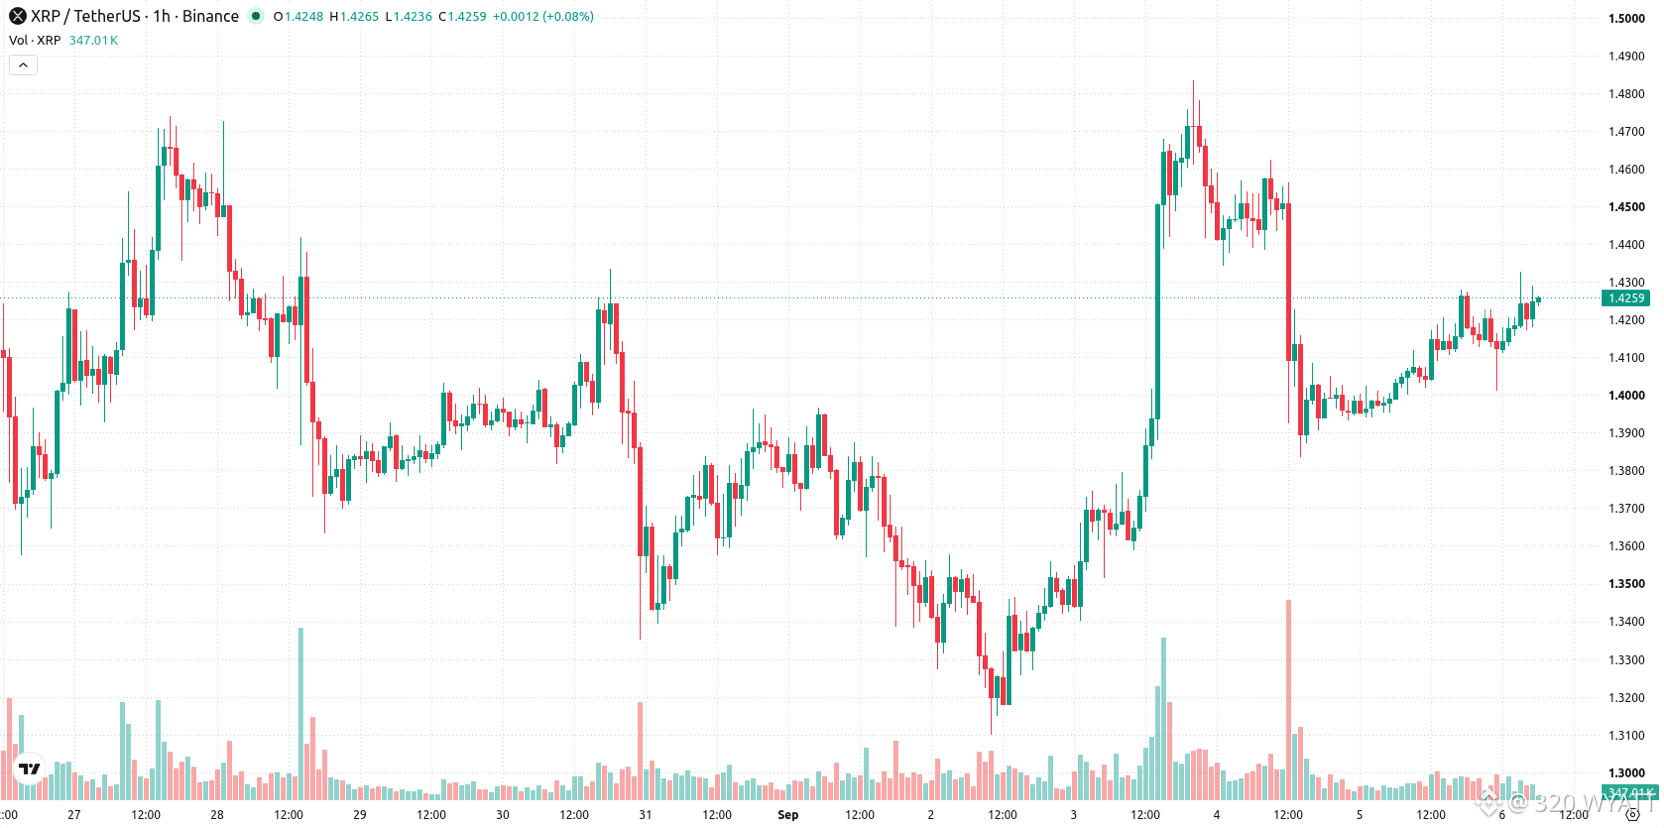
On the technical front, XRP is trading above its MA-20 ($1.4154), MA-50 ($1.415) on the hourly chart, and MA-200 ($1.2745) on the daily, with the Ichimoku Kijun providing immediate support at $1.4141. Momentum indicators produce a mixed picture: while MACD and RSI (59.7, Buy) signal bullish momentum, ADX and Stochastic RSI are neutral, and CCI is in overbought territory, warning of possible short-term exhaustion. Bull/Bear Power indicates buyers remain in control intraday, and the Awesome Oscillator aligns with the existing uptrend, though overbought signals point to the risk of some divergence.
#xrp320 #xrp #WriteToEarn2026 #Trendingissue #mr320
$XRP
On the technical front, XRP is trading above its MA-20 ($1.4154), MA-50 ($1.415) on the hourly chart, and MA-200 ($1.2745) on the daily, with the Ichimoku Kijun providing immediate support at $1.4141. Momentum indicators produce a mixed picture: while MACD and RSI (59.7, Buy) signal bullish momentum, ADX and Stochastic RSI are neutral, and CCI is in overbought territory, warning of possible short-term exhaustion. Bull/Bear Power indicates buyers remain in control intraday, and the Awesome Oscillator aligns with the existing uptrend, though overbought signals point to the risk of some divergence.
#xrp320 #xrp #WriteToEarn2026 #Trendingissue #mr320
On the technical front, XRP is trading above its MA-20 ($1.4154), MA-50 ($1.415) on the hourly chart, and MA-200 ($1.2745) on the daily, with the Ichimoku Kijun providing immediate support at $1.4141. Momentum indicators produce a mixed picture: while MACD and RSI (59.7, Buy) signal bullish momentum, ADX and Stochastic RSI are neutral, and CCI is in overbought territory, warning of possible short-term exhaustion. Bull/Bear Power indicates buyers remain in control intraday, and the Awesome Oscillator aligns with the existing uptrend, though overbought signals point to the risk of some divergence.
#xrp320 #xrp #WriteToEarn2026 #Trendingissue #mr320
196
·
--
Bearish
$XRP
{spot}(XRPUSDT)
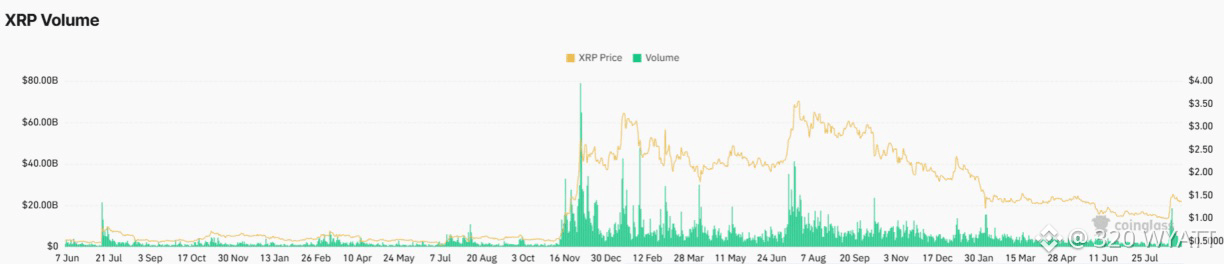
🚨XRP Derivatives Volume Jumps 20% as Open Interest Declines🚨
The volume of XRP derivatives transactions rose by 20.53% to $3.85 billion in the latest reporting period. Open interest, however, dipped 3.05% to $3.03 billion, indicating traders decreased their leveraged position.
The options volume rose by 119.68% to $2.75 million, showing a significant rise in demand for XRP-related options. Options open interest increased 3.57% to $78.15 million, representing a slight increase in positioning across the markets.
#xrp320 #xrp #mr320 #Trendingissue #WriteToEarn2026
$XRP
🚨XRP Derivatives Volume Jumps 20% as Open Interest Declines🚨
The volume of XRP derivatives transactions rose by 20.53% to $3.85 billion in the latest reporting period. Open interest, however, dipped 3.05% to $3.03 billion, indicating traders decreased their leveraged position.
The options volume rose by 119.68% to $2.75 million, showing a significant rise in demand for XRP-related options. Options open interest increased 3.57% to $78.15 million, representing a slight increase in positioning across the markets.
#xrp320 #xrp #mr320 #Trendingissue #WriteToEarn2026
🚨XRP Derivatives Volume Jumps 20% as Open Interest Declines🚨
The volume of XRP derivatives transactions rose by 20.53% to $3.85 billion in the latest reporting period. Open interest, however, dipped 3.05% to $3.03 billion, indicating traders decreased their leveraged position.
The options volume rose by 119.68% to $2.75 million, showing a significant rise in demand for XRP-related options. Options open interest increased 3.57% to $78.15 million, representing a slight increase in positioning across the markets.
#xrp320 #xrp #mr320 #Trendingissue #WriteToEarn2026
202
·
--
Bullish
$SOL
{spot}(SOLUSDT)
🚨Solana Price Reclaims $100, But $115 is the Real Test🚨
Solana’s price is displaying a significant shift in its structure, but the rally is now approaching a critical resistance. After rebounding sharply from the June low close to $60, the price has climbed above its key MA levels. Currently, the price is chopping around a pivotal resistance zone, while the MACD is signaling caution.
The MACD shows a drop in the buying pressure, with bullish momentum losing strength and a potential bearish crossover developing. Interestingly, this comes as the 50-day and 200-day MA move toward a potential golden cross. This creates a divergence: MACD points to the rally losing momentum, while the MAs suggest the underlying trend may turn bullish. Therefore, even if MACD undergoes a bearish crossover, if price continues to hold $100, the ‘golden cross’ may absorb selling volume, paving the way for an extended ascending trend.
Meanwhile, the price, which is sitting around the 0.5 FIB level at $104.50, may face another rejection to $100 or below. For now, SOL’s price action suggests that the key question is not whether momentum has slowed, but whether buyers can absorb the selling pressure without surrendering the recent breakout.
#xrp320 #Trendingissue #mr320 #writetoearn2026 #xrp
$SOL
🚨Solana Price Reclaims $100, But $115 is the Real Test🚨
Solana’s price is displaying a significant shift in its structure, but the rally is now approaching a critical resistance. After rebounding sharply from the June low close to $60, the price has climbed above its key MA levels. Currently, the price is chopping around a pivotal resistance zone, while the MACD is signaling caution.
The MACD shows a drop in the buying pressure, with bullish momentum losing strength and a potential bearish crossover developing. Interestingly, this comes as the 50-day and 200-day MA move toward a potential golden cross. This creates a divergence: MACD points to the rally losing momentum, while the MAs suggest the underlying trend may turn bullish. Therefore, even if MACD undergoes a bearish crossover, if price continues to hold $100, the ‘golden cross’ may absorb selling volume, paving the way for an extended ascending trend.
Meanwhile, the price, which is sitting around the 0.5 FIB level at $104.50, may face another rejection to $100 or below. For now, SOL’s price action suggests that the key question is not whether momentum has slowed, but whether buyers can absorb the selling pressure without surrendering the recent breakout.
#xrp320 #Trendingissue #mr320 #writetoearn2026 #xrp
🚨Solana Price Reclaims $100, But $115 is the Real Test🚨
Solana’s price is displaying a significant shift in its structure, but the rally is now approaching a critical resistance. After rebounding sharply from the June low close to $60, the price has climbed above its key MA levels. Currently, the price is chopping around a pivotal resistance zone, while the MACD is signaling caution.
The MACD shows a drop in the buying pressure, with bullish momentum losing strength and a potential bearish crossover developing. Interestingly, this comes as the 50-day and 200-day MA move toward a potential golden cross. This creates a divergence: MACD points to the rally losing momentum, while the MAs suggest the underlying trend may turn bullish. Therefore, even if MACD undergoes a bearish crossover, if price continues to hold $100, the ‘golden cross’ may absorb selling volume, paving the way for an extended ascending trend.
Meanwhile, the price, which is sitting around the 0.5 FIB level at $104.50, may face another rejection to $100 or below. For now, SOL’s price action suggests that the key question is not whether momentum has slowed, but whether buyers can absorb the selling pressure without surrendering the recent breakout.
#xrp320 #Trendingissue #mr320 #writetoearn2026 #xrp

523
·
--
Bearish
$XRP
{spot}(XRPUSDT)
XRP trades at $1.37, extending its advance above the key Exponential Moving Averages (EMAs) and maintaining a bullish near-term bias. The spot price holds firmly over the 200-day EMA at $1.35, while the 100-day and 50-day EMAs at $1.21 sit well below, reinforcing a supportive structure after the recent breakout.
Momentum remains constructive, with the Moving Average Convergence Divergence (MACD) histogram positive and the Relative Strength Index (RSI) hovering around 62, hinting that buyers still control the tape, though conditions are no longer overbought.
On the downside, immediate support is at $1.35, where the 200-day EMA aligns as the first structural floor, followed by deeper demand around $1.21, marked by the 100-day and 50-day EMAs. As long as the pair holds above these moving averages, the technical tone should remain constructive, with any pullback toward the 200-day EMA likely to be viewed as a dip within a broader bullish phase rather than a trend reversal.
#xrp #xrp320 #mr320 #Trendingissue #WriteToEarn2026
$XRP
XRP trades at $1.37, extending its advance above the key Exponential Moving Averages (EMAs) and maintaining a bullish near-term bias. The spot price holds firmly over the 200-day EMA at $1.35, while the 100-day and 50-day EMAs at $1.21 sit well below, reinforcing a supportive structure after the recent breakout.
Momentum remains constructive, with the Moving Average Convergence Divergence (MACD) histogram positive and the Relative Strength Index (RSI) hovering around 62, hinting that buyers still control the tape, though conditions are no longer overbought.
On the downside, immediate support is at $1.35, where the 200-day EMA aligns as the first structural floor, followed by deeper demand around $1.21, marked by the 100-day and 50-day EMAs. As long as the pair holds above these moving averages, the technical tone should remain constructive, with any pullback toward the 200-day EMA likely to be viewed as a dip within a broader bullish phase rather than a trend reversal.
#xrp #xrp320 #mr320 #Trendingissue #WriteToEarn2026
XRP trades at $1.37, extending its advance above the key Exponential Moving Averages (EMAs) and maintaining a bullish near-term bias. The spot price holds firmly over the 200-day EMA at $1.35, while the 100-day and 50-day EMAs at $1.21 sit well below, reinforcing a supportive structure after the recent breakout.
Momentum remains constructive, with the Moving Average Convergence Divergence (MACD) histogram positive and the Relative Strength Index (RSI) hovering around 62, hinting that buyers still control the tape, though conditions are no longer overbought.
On the downside, immediate support is at $1.35, where the 200-day EMA aligns as the first structural floor, followed by deeper demand around $1.21, marked by the 100-day and 50-day EMAs. As long as the pair holds above these moving averages, the technical tone should remain constructive, with any pullback toward the 200-day EMA likely to be viewed as a dip within a broader bullish phase rather than a trend reversal.
#xrp #xrp320 #mr320 #Trendingissue #WriteToEarn2026

64
·
--
Bearish
$XRP
{spot}(XRPUSDT)
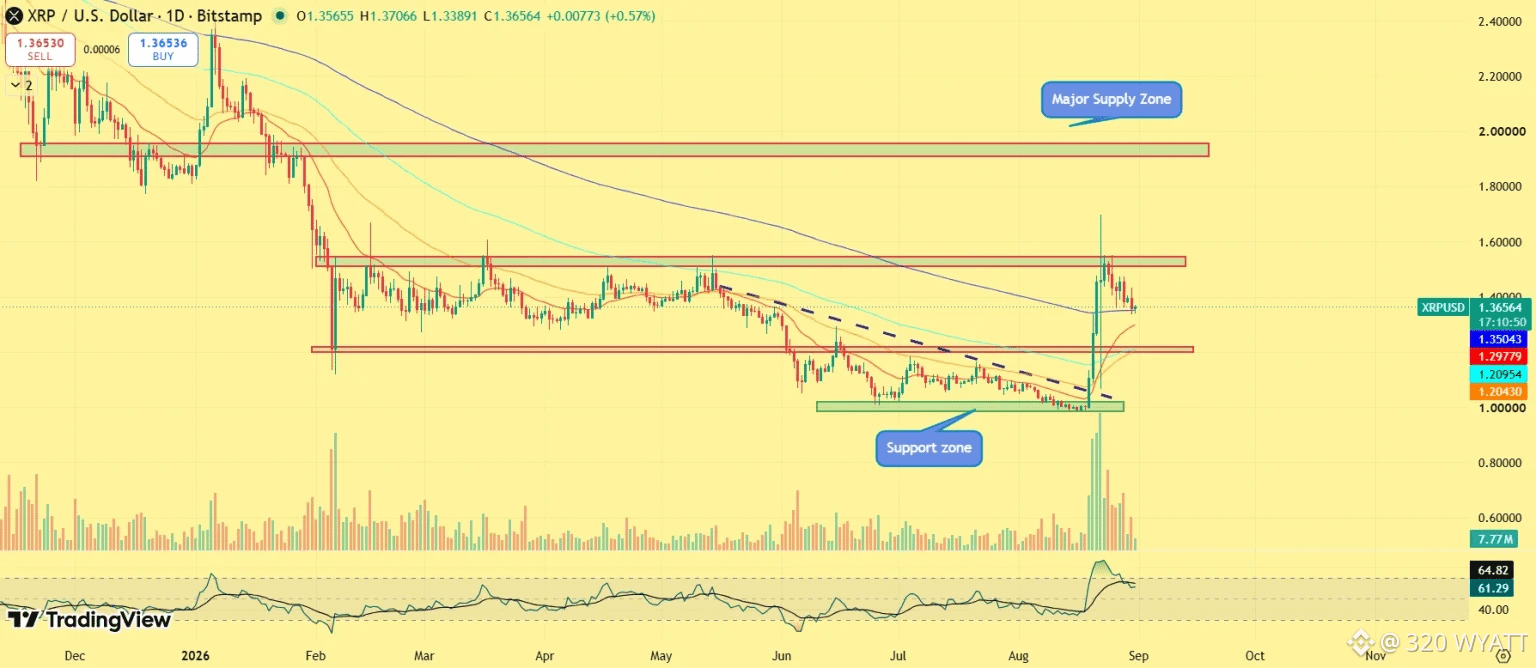
Xrp price is pulling back toward the $1.30–$1.40 support zone after becoming overbought during its recent rally.
Holding this area will be important for maintaining the current structure. A confirmed break below $1.30 could expose XRP to further downside, with the next potential support around $1.13.
The daily chart shows XRP continuing to reset from overbought conditions. Continued sideways movement or a modest pullback could allow the RSI to return to more neutral levels before.
#xrp320 #Trendingissue #mr320 #writetoearn2026 #xrp
$XRP
Xrp price is pulling back toward the $1.30–$1.40 support zone after becoming overbought during its recent rally.
Holding this area will be important for maintaining the current structure. A confirmed break below $1.30 could expose XRP to further downside, with the next potential support around $1.13.
The daily chart shows XRP continuing to reset from overbought conditions. Continued sideways movement or a modest pullback could allow the RSI to return to more neutral levels before.
#xrp320 #Trendingissue #mr320 #writetoearn2026 #xrp
Xrp price is pulling back toward the $1.30–$1.40 support zone after becoming overbought during its recent rally.
Holding this area will be important for maintaining the current structure. A confirmed break below $1.30 could expose XRP to further downside, with the next potential support around $1.13.
The daily chart shows XRP continuing to reset from overbought conditions. Continued sideways movement or a modest pullback could allow the RSI to return to more neutral levels before.
#xrp320 #Trendingissue #mr320 #writetoearn2026 #xrp
106
·
--
Bullish
$XRP
{spot}(XRPUSDT)
XRP’s remaining 2026 price range is projected at $1.35-$1.95, with the upper end dependent on the market holding its recovery rather than fading it. The 200-day EMA at $1.3476 is the key bull/bear line, holding above it keeps the path toward $1.95 open, while losing it risks a return to $1.18. The daily MACD has extended to 0.10288 while the RSI has cooled from 86.82 to 73.85, so the overbought condition is unwinding without the trend signal breaking.
#xrp320 #xrp #Trendingissue #WriteToEarn2026 #mr320
$XRP
XRP’s remaining 2026 price range is projected at $1.35-$1.95, with the upper end dependent on the market holding its recovery rather than fading it. The 200-day EMA at $1.3476 is the key bull/bear line, holding above it keeps the path toward $1.95 open, while losing it risks a return to $1.18. The daily MACD has extended to 0.10288 while the RSI has cooled from 86.82 to 73.85, so the overbought condition is unwinding without the trend signal breaking.
#xrp320 #xrp #Trendingissue #WriteToEarn2026 #mr320
XRP’s remaining 2026 price range is projected at $1.35-$1.95, with the upper end dependent on the market holding its recovery rather than fading it. The 200-day EMA at $1.3476 is the key bull/bear line, holding above it keeps the path toward $1.95 open, while losing it risks a return to $1.18. The daily MACD has extended to 0.10288 while the RSI has cooled from 86.82 to 73.85, so the overbought condition is unwinding without the trend signal breaking.
#xrp320 #xrp #Trendingissue #WriteToEarn2026 #mr320
54
·
--
Bearish
$XRP
{spot}(XRPUSDT)
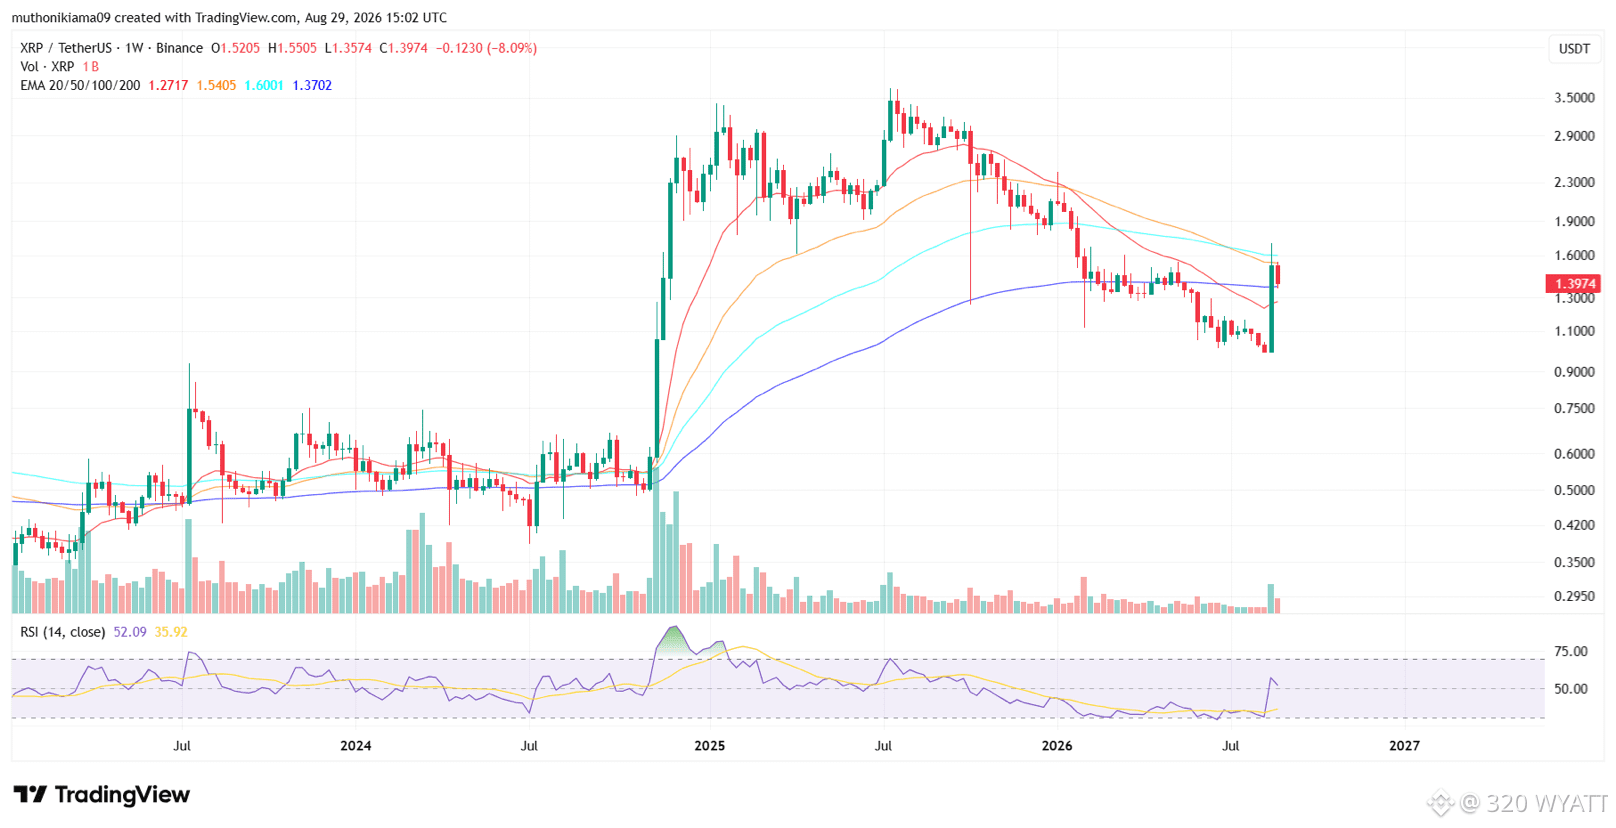
The one-week chart for XRP shows that the price has dropped to the support at the 200-week EMA of $1.37. If XRP moves below this EMA, it will suggest that the long-term outlook is now bearish.
XRP’s move to this 200-week EMA also comes as the traders who made profits after the price moved from $1 to $1.66 begin to sell. If these traders continue to book profits, the price could drop to the 20-week EMA of $1.27.
However, if the selling pressure eases and buyers return, XRP could remain above this EMA of $1.37 before making another gain to the 100-week EMA of $1.569.
#xrp320 #xrp #mr320 #Trendingissue #WriteToEarn2026
$XRP
The one-week chart for XRP shows that the price has dropped to the support at the 200-week EMA of $1.37. If XRP moves below this EMA, it will suggest that the long-term outlook is now bearish.
XRP’s move to this 200-week EMA also comes as the traders who made profits after the price moved from $1 to $1.66 begin to sell. If these traders continue to book profits, the price could drop to the 20-week EMA of $1.27.
However, if the selling pressure eases and buyers return, XRP could remain above this EMA of $1.37 before making another gain to the 100-week EMA of $1.569.
#xrp320 #xrp #mr320 #Trendingissue #WriteToEarn2026
The one-week chart for XRP shows that the price has dropped to the support at the 200-week EMA of $1.37. If XRP moves below this EMA, it will suggest that the long-term outlook is now bearish.
XRP’s move to this 200-week EMA also comes as the traders who made profits after the price moved from $1 to $1.66 begin to sell. If these traders continue to book profits, the price could drop to the 20-week EMA of $1.27.
However, if the selling pressure eases and buyers return, XRP could remain above this EMA of $1.37 before making another gain to the 100-week EMA of $1.569.
#xrp320 #xrp #mr320 #Trendingissue #WriteToEarn2026
46
Log in to explore more content
Join global crypto users on Binance Square
⚡️ Get latest and useful information about crypto.
💬 Trusted by the world’s largest crypto exchange.
👍 Discover real insights from verified creators.
Email / Phone number
Trending Topics
1
#SaylorHintsStrategyBitcoinBuy
2.3M views
12,408 Discussing
2
#BOJRaisesRatesTo31YearHigh
250,356 views
3,265 Discussing
3
#BuffettStepsDownAsBerkshireChairman
121,946 views
1,748 Discussing
4
#XRPExchangeReservesHitSevenYearLow
134,008 views
1,537 Discussing
5
#HKCompletesFirstHKDStablecoinUseCase
154,842 views
1,904 Discussing
6
#VietnamPlansFirstCryptoLicensesIn2026
97,416 views
1,289 Discussing
7
#BTCBreaks80K
537,360 views
5,773 Discussing
8
#BitcoinMarketCapTopsTesla
131,940 views
1,424 Discussing
9
#SOLJumpsAbout10%
132,617 views
1,276 Discussing
10
#EthereumReclaims$2600
12,060 views
140 Discussing