
#100kuser
100kuser
21,025 views
131 Discussing
Hot
Latest

·
--
Bearish
$BTC
{spot}(BTCUSDT)
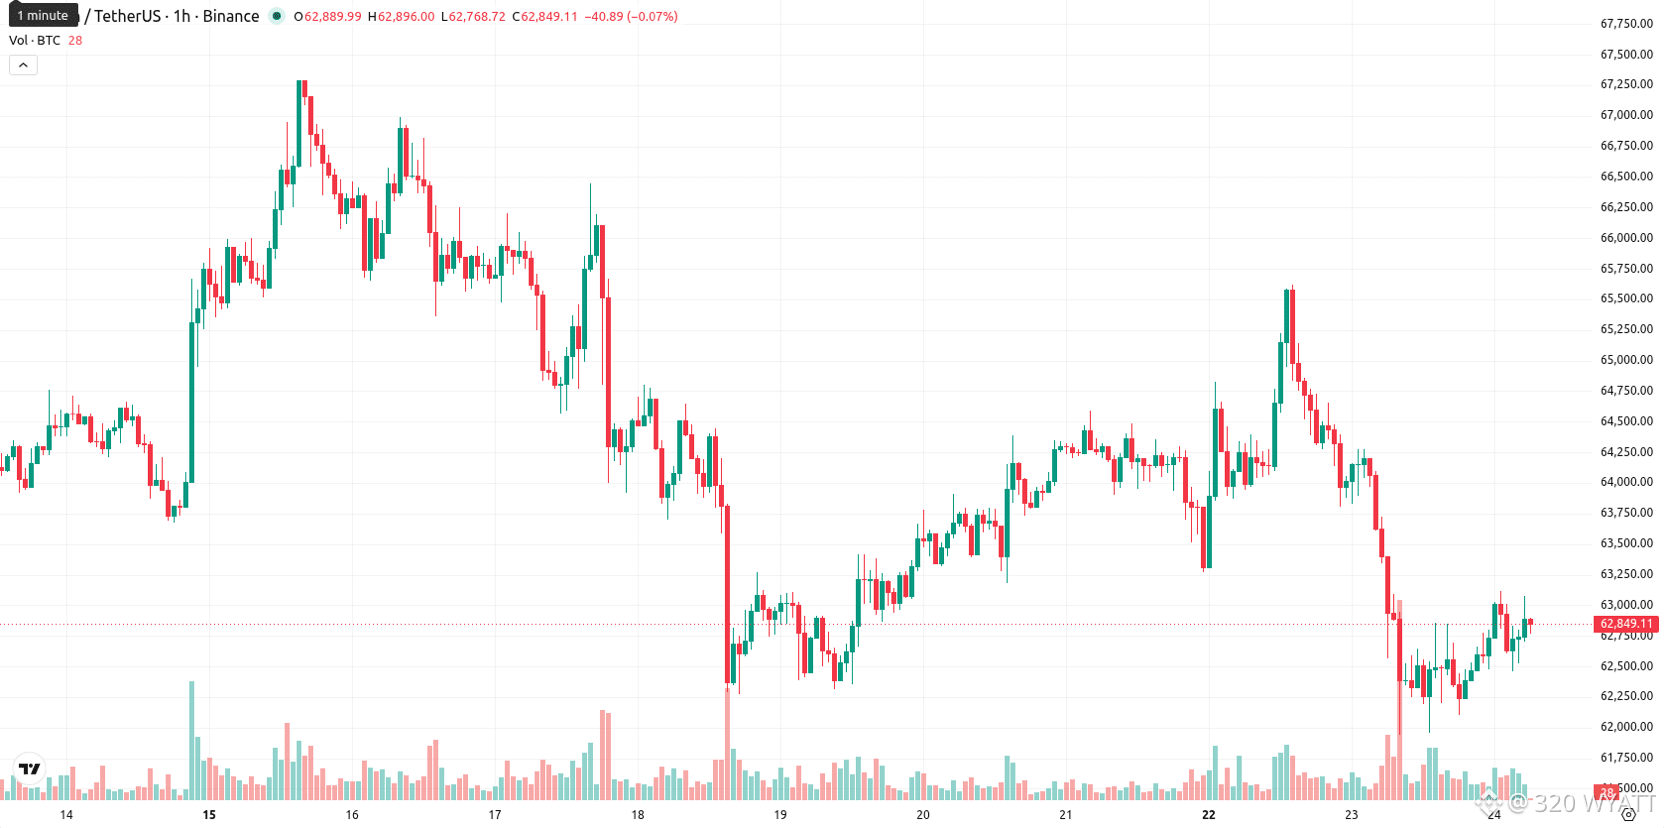
BTC/USD is trading above the MA-20 but remains below the MA-50 on the hourly chart and is significantly under the MA-200 on the daily timeframe. Immediate resistance is defined by the Ichimoku Kijun at $63,071, while support levels are observed near $61,219. Momentum indicators point to a bearish technical setup: MACD signals strong sell, ADX confirms persistent selling pressure, and RSI registers at 44.83 (sell). Stoch RSI and CCI both read neutral, suggesting indecision in the oversold/overbought dynamic. Bull/Bear Power (BBP) flags an overbought condition, indicating recent session buyer dominance despite the mixed intraday tone. The Awesome Oscillator (AO) remains neutral, offering no additional directional confirmation. Oscillators present a divided picture, with short-term buyers contrasted by sustained downward momentum signals.
#BTC320 #Trendingissue #mr320 #WriteToEarn2026 #100kUser
$BTC
BTC/USD is trading above the MA-20 but remains below the MA-50 on the hourly chart and is significantly under the MA-200 on the daily timeframe. Immediate resistance is defined by the Ichimoku Kijun at $63,071, while support levels are observed near $61,219. Momentum indicators point to a bearish technical setup: MACD signals strong sell, ADX confirms persistent selling pressure, and RSI registers at 44.83 (sell). Stoch RSI and CCI both read neutral, suggesting indecision in the oversold/overbought dynamic. Bull/Bear Power (BBP) flags an overbought condition, indicating recent session buyer dominance despite the mixed intraday tone. The Awesome Oscillator (AO) remains neutral, offering no additional directional confirmation. Oscillators present a divided picture, with short-term buyers contrasted by sustained downward momentum signals.
#BTC320 #Trendingissue #mr320 #WriteToEarn2026 #100kUser
BTC/USD is trading above the MA-20 but remains below the MA-50 on the hourly chart and is significantly under the MA-200 on the daily timeframe. Immediate resistance is defined by the Ichimoku Kijun at $63,071, while support levels are observed near $61,219. Momentum indicators point to a bearish technical setup: MACD signals strong sell, ADX confirms persistent selling pressure, and RSI registers at 44.83 (sell). Stoch RSI and CCI both read neutral, suggesting indecision in the oversold/overbought dynamic. Bull/Bear Power (BBP) flags an overbought condition, indicating recent session buyer dominance despite the mixed intraday tone. The Awesome Oscillator (AO) remains neutral, offering no additional directional confirmation. Oscillators present a divided picture, with short-term buyers contrasted by sustained downward momentum signals.
#BTC320 #Trendingissue #mr320 #WriteToEarn2026 #100kUser
106
·
--
Bearish
$XRP
{spot}(XRPUSDT)
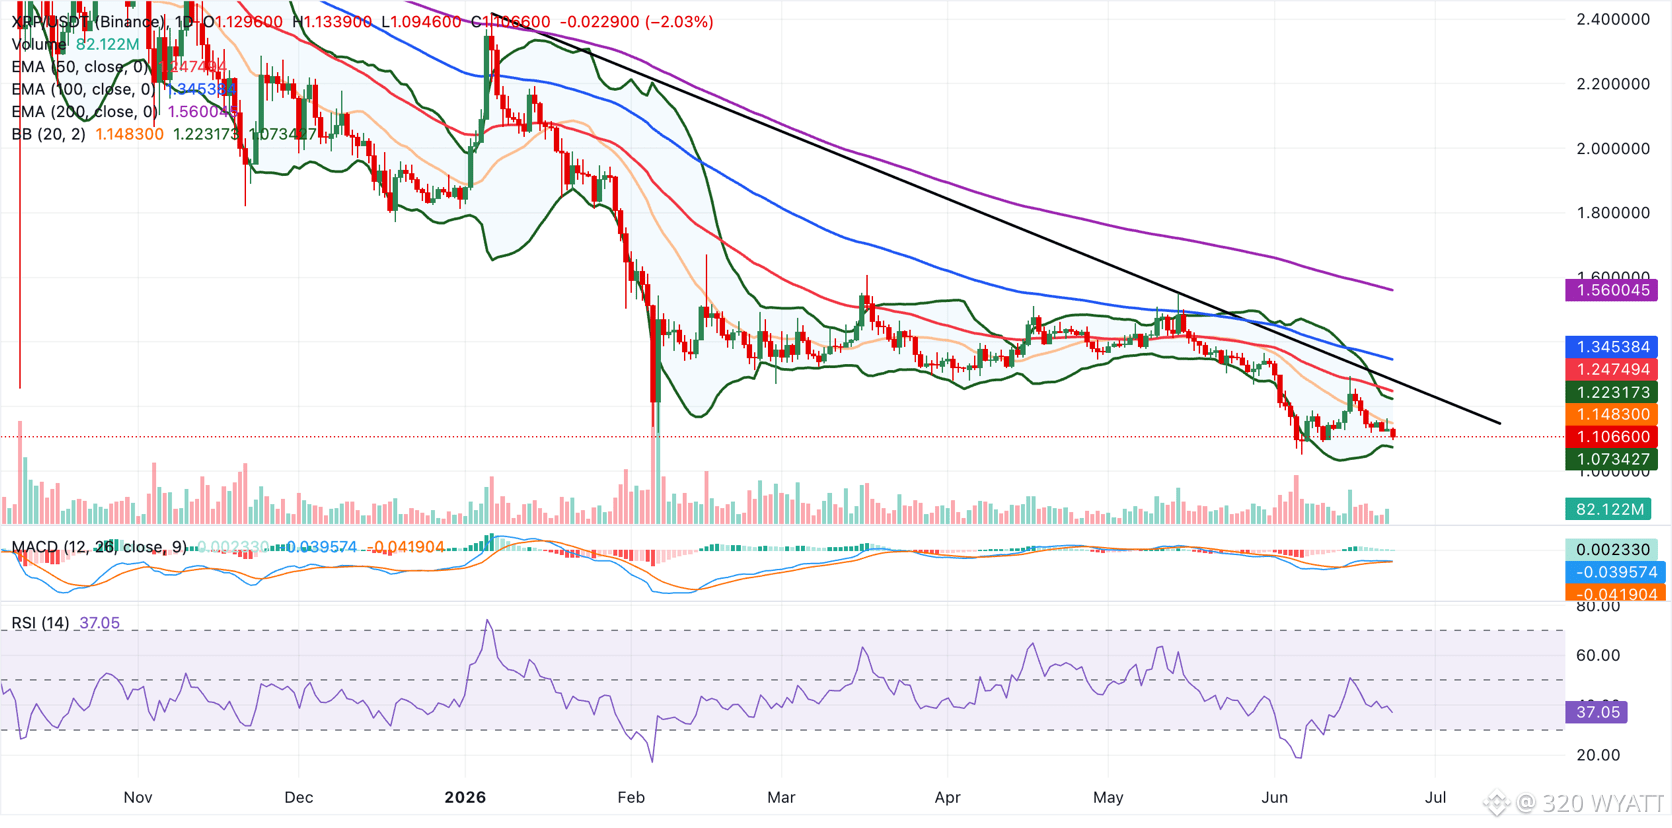
XRP trades above $1.10, keeping a bearish near-term bias as price holds well below the 50-day, 100-day and 200-day Exponential Moving Averages (EMAs) at $1.25, $1.35 and $1.56 respectively.
The pair is also trading under the middle Bollinger Bands $1.15 on the daily chart, while the Relative Strength Index (RSI) at 37 leans toward weak bearish momentum. Meanwhile, a mildly positive Moving Average Convergence Divergence (MACD) histogram around zero only hints at tentative stabilization rather than a sustained recovery.
Initial resistance lies at the Bollinger Band midline near $1.15, followed by the upper band at $1.22. Above that, the 50-day EMA at $1.25 and the downward-sloping resistance trendline intersecting around $1.28 form a more substantial supply zone, ahead of the 100-day EMA at $1.35 and the 200-day EMA at $1.56. On the downside, the lower Bollinger band at $1.07 offers the first notable support, and a clear break beneath this floor would expose the pair to further downside pressure toward the recent $1.05 support and the psychological demand area at $1.00.
#xrp320 #Trendingissue #mr320 #WriteToEarn2026 #100kUser
$XRP
XRP trades above $1.10, keeping a bearish near-term bias as price holds well below the 50-day, 100-day and 200-day Exponential Moving Averages (EMAs) at $1.25, $1.35 and $1.56 respectively.
The pair is also trading under the middle Bollinger Bands $1.15 on the daily chart, while the Relative Strength Index (RSI) at 37 leans toward weak bearish momentum. Meanwhile, a mildly positive Moving Average Convergence Divergence (MACD) histogram around zero only hints at tentative stabilization rather than a sustained recovery.
Initial resistance lies at the Bollinger Band midline near $1.15, followed by the upper band at $1.22. Above that, the 50-day EMA at $1.25 and the downward-sloping resistance trendline intersecting around $1.28 form a more substantial supply zone, ahead of the 100-day EMA at $1.35 and the 200-day EMA at $1.56. On the downside, the lower Bollinger band at $1.07 offers the first notable support, and a clear break beneath this floor would expose the pair to further downside pressure toward the recent $1.05 support and the psychological demand area at $1.00.
#xrp320 #Trendingissue #mr320 #WriteToEarn2026 #100kUser
XRP trades above $1.10, keeping a bearish near-term bias as price holds well below the 50-day, 100-day and 200-day Exponential Moving Averages (EMAs) at $1.25, $1.35 and $1.56 respectively.
The pair is also trading under the middle Bollinger Bands $1.15 on the daily chart, while the Relative Strength Index (RSI) at 37 leans toward weak bearish momentum. Meanwhile, a mildly positive Moving Average Convergence Divergence (MACD) histogram around zero only hints at tentative stabilization rather than a sustained recovery.
Initial resistance lies at the Bollinger Band midline near $1.15, followed by the upper band at $1.22. Above that, the 50-day EMA at $1.25 and the downward-sloping resistance trendline intersecting around $1.28 form a more substantial supply zone, ahead of the 100-day EMA at $1.35 and the 200-day EMA at $1.56. On the downside, the lower Bollinger band at $1.07 offers the first notable support, and a clear break beneath this floor would expose the pair to further downside pressure toward the recent $1.05 support and the psychological demand area at $1.00.
#xrp320 #Trendingissue #mr320 #WriteToEarn2026 #100kUser
1
139
·
--
Bullish
$RENDER
{spot}(RENDERUSDT)
🚨RENDER/USDT Market Snapshot🚨
24-Hour Range: The token traded between a local support floor of 1.54 USDT and a peak of 1.59 USDT.
Trading Volume: 24-hour global trading volume is hovering around 15.50 Million USDT.
Market Capitalization: Render commands a network valuation of 822.30 Million USDT, ranking as the 63rd largest crypto network.
Circulating Supply: There are 518.80 Million RENDER coins in active market circulation.
#Render #Trendingissue #mr320 #WriteToEarn2026 #100kUser
$RENDER
🚨RENDER/USDT Market Snapshot🚨
24-Hour Range: The token traded between a local support floor of 1.54 USDT and a peak of 1.59 USDT.
Trading Volume: 24-hour global trading volume is hovering around 15.50 Million USDT.
Market Capitalization: Render commands a network valuation of 822.30 Million USDT, ranking as the 63rd largest crypto network.
Circulating Supply: There are 518.80 Million RENDER coins in active market circulation.
#Render #Trendingissue #mr320 #WriteToEarn2026 #100kUser
🚨RENDER/USDT Market Snapshot🚨
24-Hour Range: The token traded between a local support floor of 1.54 USDT and a peak of 1.59 USDT.
Trading Volume: 24-hour global trading volume is hovering around 15.50 Million USDT.
Market Capitalization: Render commands a network valuation of 822.30 Million USDT, ranking as the 63rd largest crypto network.
Circulating Supply: There are 518.80 Million RENDER coins in active market circulation.
#Render #Trendingissue #mr320 #WriteToEarn2026 #100kUser

32
·
--
Bullish
$XRP
XRP is trading around $1.36, struggling to break above key resistance levels despite strong institutional interest. Spot XRP ETFs have seen $12.57 million inflows this week, pushing total inflows to $1.39 billion and assets under management to $1.15 billion. Meanwhile, XRP reserves on Binance are declining, indicating accumulation, and the XRP Ledger saw a surge of 4,300 new wallets in one day, signaling growing network participation. However, XRP remains 62% below its July 2025 peak and faces significant resistance between $1.40 and $1.55, which it must overcome to trigger a bullish breakout.
#xrp320 #Trendingissue #mr320 #WriteToEarn2026 #100kUser
$XRP
XRP is trading around $1.36, struggling to break above key resistance levels despite strong institutional interest. Spot XRP ETFs have seen $12.57 million inflows this week, pushing total inflows to $1.39 billion and assets under management to $1.15 billion. Meanwhile, XRP reserves on Binance are declining, indicating accumulation, and the XRP Ledger saw a surge of 4,300 new wallets in one day, signaling growing network participation. However, XRP remains 62% below its July 2025 peak and faces significant resistance between $1.40 and $1.55, which it must overcome to trigger a bullish breakout.
#xrp320 #Trendingissue #mr320 #WriteToEarn2026 #100kUser
XRP is trading around $1.36, struggling to break above key resistance levels despite strong institutional interest. Spot XRP ETFs have seen $12.57 million inflows this week, pushing total inflows to $1.39 billion and assets under management to $1.15 billion. Meanwhile, XRP reserves on Binance are declining, indicating accumulation, and the XRP Ledger saw a surge of 4,300 new wallets in one day, signaling growing network participation. However, XRP remains 62% below its July 2025 peak and faces significant resistance between $1.40 and $1.55, which it must overcome to trigger a bullish breakout.
#xrp320 #Trendingissue #mr320 #WriteToEarn2026 #100kUser
1
156
·
--
Bullish
$XRP
{spot}(XRPUSDT)
Patience remains the operative word for anyone watching XRP with a longer time horizon. The immediate support at $1.13 needs to hold cleanly on a weekly closing basis to maintain credibility. If the price eventually breaks below that level with conviction, the next meaningful support sits in the $0.90 to $1.00 range, and a break below $0.90 would open the door toward $0.70, a level carrying significant long-term historical significance as a major resistance zone that flipped to support.
For now, none of those scenarios are in play. XRP is above $1.13, the weekly candle held, and the short-term pressure has eased enough to allow for at least a temporary recovery in line with what Bitcoin does over the coming sessions.
It is a small but genuine improvement in a chart that has offered very little good news for several months.
#xrp320 #Trendingissue #mr320 #WriteToEarn2026 #100kUser
$XRP
Patience remains the operative word for anyone watching XRP with a longer time horizon. The immediate support at $1.13 needs to hold cleanly on a weekly closing basis to maintain credibility. If the price eventually breaks below that level with conviction, the next meaningful support sits in the $0.90 to $1.00 range, and a break below $0.90 would open the door toward $0.70, a level carrying significant long-term historical significance as a major resistance zone that flipped to support.
For now, none of those scenarios are in play. XRP is above $1.13, the weekly candle held, and the short-term pressure has eased enough to allow for at least a temporary recovery in line with what Bitcoin does over the coming sessions.
It is a small but genuine improvement in a chart that has offered very little good news for several months.
#xrp320 #Trendingissue #mr320 #WriteToEarn2026 #100kUser
Patience remains the operative word for anyone watching XRP with a longer time horizon. The immediate support at $1.13 needs to hold cleanly on a weekly closing basis to maintain credibility. If the price eventually breaks below that level with conviction, the next meaningful support sits in the $0.90 to $1.00 range, and a break below $0.90 would open the door toward $0.70, a level carrying significant long-term historical significance as a major resistance zone that flipped to support.
For now, none of those scenarios are in play. XRP is above $1.13, the weekly candle held, and the short-term pressure has eased enough to allow for at least a temporary recovery in line with what Bitcoin does over the coming sessions.
It is a small but genuine improvement in a chart that has offered very little good news for several months.
#xrp320 #Trendingissue #mr320 #WriteToEarn2026 #100kUser

1
183
·
--
Bearish
$XRP
{spot}(XRPUSDT)
🚨Bearish momentum persists as XRP fails to reclaim resistance🚨
On the technical front, XRP is positioned above its MA-20 at $1.104 but remains capped below the MA-50 at $1.121 and firmly beneath the MA-200 at $1.5343. The immediate resistance is defined by the Ichimoku Kijun at $1.1109. Key momentum indicators are negative: MACD signals a strong sell and ADX also points to a sell, while RSI sits at 37.64 and CCI continues to indicate selling pressure. Stoch RSI remains neutral, BBP highlights seller dominance intraday, and the Awesome Oscillator aligns with broad downside momentum.
#xrp320 #Trendingissue #mr320 #100kUser #WriteToEarn2026
$XRP
🚨Bearish momentum persists as XRP fails to reclaim resistance🚨
On the technical front, XRP is positioned above its MA-20 at $1.104 but remains capped below the MA-50 at $1.121 and firmly beneath the MA-200 at $1.5343. The immediate resistance is defined by the Ichimoku Kijun at $1.1109. Key momentum indicators are negative: MACD signals a strong sell and ADX also points to a sell, while RSI sits at 37.64 and CCI continues to indicate selling pressure. Stoch RSI remains neutral, BBP highlights seller dominance intraday, and the Awesome Oscillator aligns with broad downside momentum.
#xrp320 #Trendingissue #mr320 #100kUser #WriteToEarn2026
🚨Bearish momentum persists as XRP fails to reclaim resistance🚨
On the technical front, XRP is positioned above its MA-20 at $1.104 but remains capped below the MA-50 at $1.121 and firmly beneath the MA-200 at $1.5343. The immediate resistance is defined by the Ichimoku Kijun at $1.1109. Key momentum indicators are negative: MACD signals a strong sell and ADX also points to a sell, while RSI sits at 37.64 and CCI continues to indicate selling pressure. Stoch RSI remains neutral, BBP highlights seller dominance intraday, and the Awesome Oscillator aligns with broad downside momentum.
#xrp320 #Trendingissue #mr320 #100kUser #WriteToEarn2026

3
210
·
--
Bearish
$HBAR
{spot}(HBARUSDT)
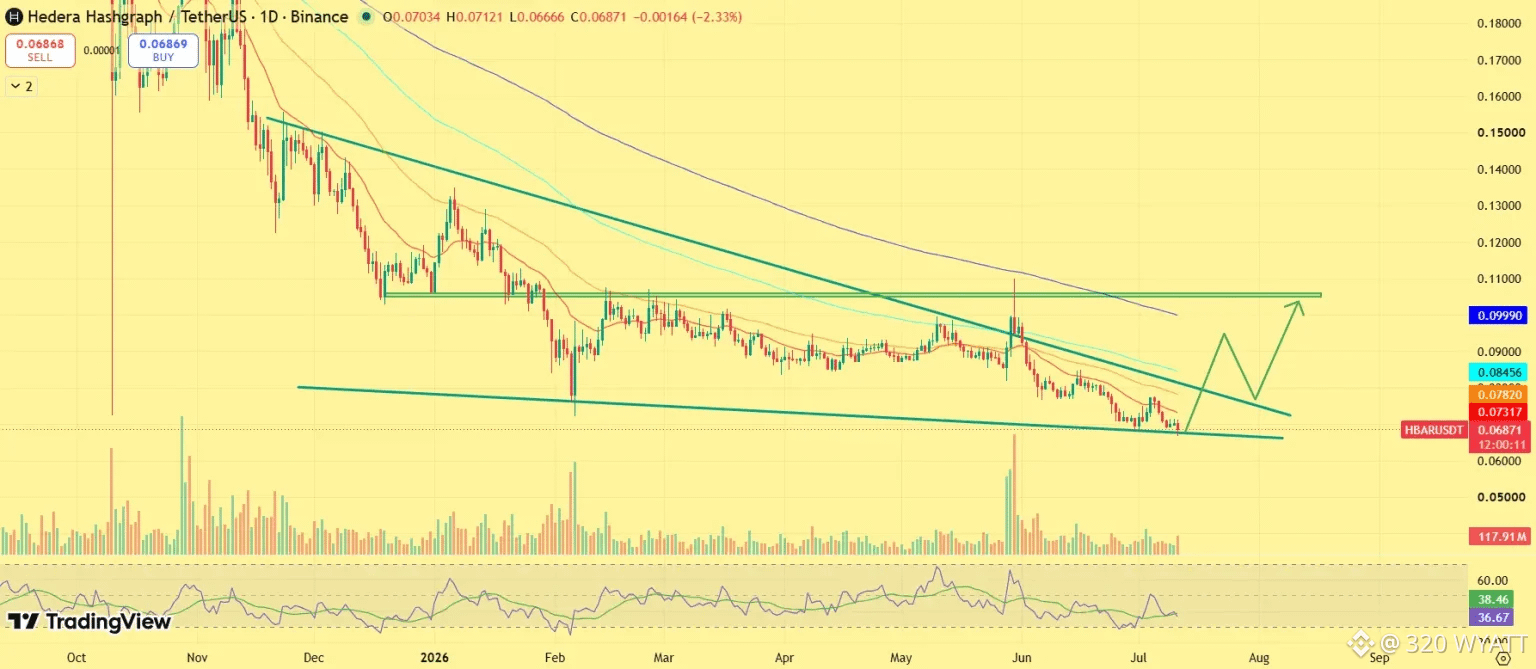
🚨Coinpedia’s Hedera (HBAR) Price Prediction 2026🚨
Heading deeper into 2026, Hedera is likely to move through a recovery cycle rather than an immediate breakout phase. The current structure suggests that the market is gradually shifting from accumulation toward early expansion.
The first important level to watch is the $0.20–$0.25 range, which previously acted as a major resistance zone. Reclaiming this level would signal that HBAR has moved beyond its base formation and entered a recovery phase. Once this level is secured, the price could move toward $0.40–$0.50, where stronger selling pressure may appear. This zone will act as a key test of whether the recovery has enough strength to continue.
If the broader market enters a bullish phase and enterprise adoption within the Hedera ecosystem continues to expand, HBAR could gradually build momentum. In a favorable scenario, HBAR could reach around $0.65 by 2026, reflecting a structured recovery rather than a sharp rally.
#HBARUSD #Trendingissue #mr320 #writetoearn2026 #100kUser
$HBAR
🚨Coinpedia’s Hedera (HBAR) Price Prediction 2026🚨
Heading deeper into 2026, Hedera is likely to move through a recovery cycle rather than an immediate breakout phase. The current structure suggests that the market is gradually shifting from accumulation toward early expansion.
The first important level to watch is the $0.20–$0.25 range, which previously acted as a major resistance zone. Reclaiming this level would signal that HBAR has moved beyond its base formation and entered a recovery phase. Once this level is secured, the price could move toward $0.40–$0.50, where stronger selling pressure may appear. This zone will act as a key test of whether the recovery has enough strength to continue.
If the broader market enters a bullish phase and enterprise adoption within the Hedera ecosystem continues to expand, HBAR could gradually build momentum. In a favorable scenario, HBAR could reach around $0.65 by 2026, reflecting a structured recovery rather than a sharp rally.
#HBARUSD #Trendingissue #mr320 #writetoearn2026 #100kUser
🚨Coinpedia’s Hedera (HBAR) Price Prediction 2026🚨
Heading deeper into 2026, Hedera is likely to move through a recovery cycle rather than an immediate breakout phase. The current structure suggests that the market is gradually shifting from accumulation toward early expansion.
The first important level to watch is the $0.20–$0.25 range, which previously acted as a major resistance zone. Reclaiming this level would signal that HBAR has moved beyond its base formation and entered a recovery phase. Once this level is secured, the price could move toward $0.40–$0.50, where stronger selling pressure may appear. This zone will act as a key test of whether the recovery has enough strength to continue.
If the broader market enters a bullish phase and enterprise adoption within the Hedera ecosystem continues to expand, HBAR could gradually build momentum. In a favorable scenario, HBAR could reach around $0.65 by 2026, reflecting a structured recovery rather than a sharp rally.
#HBARUSD #Trendingissue #mr320 #writetoearn2026 #100kUser
219
·
--
Bullish
$HYPE
{future}(HYPEUSDT)
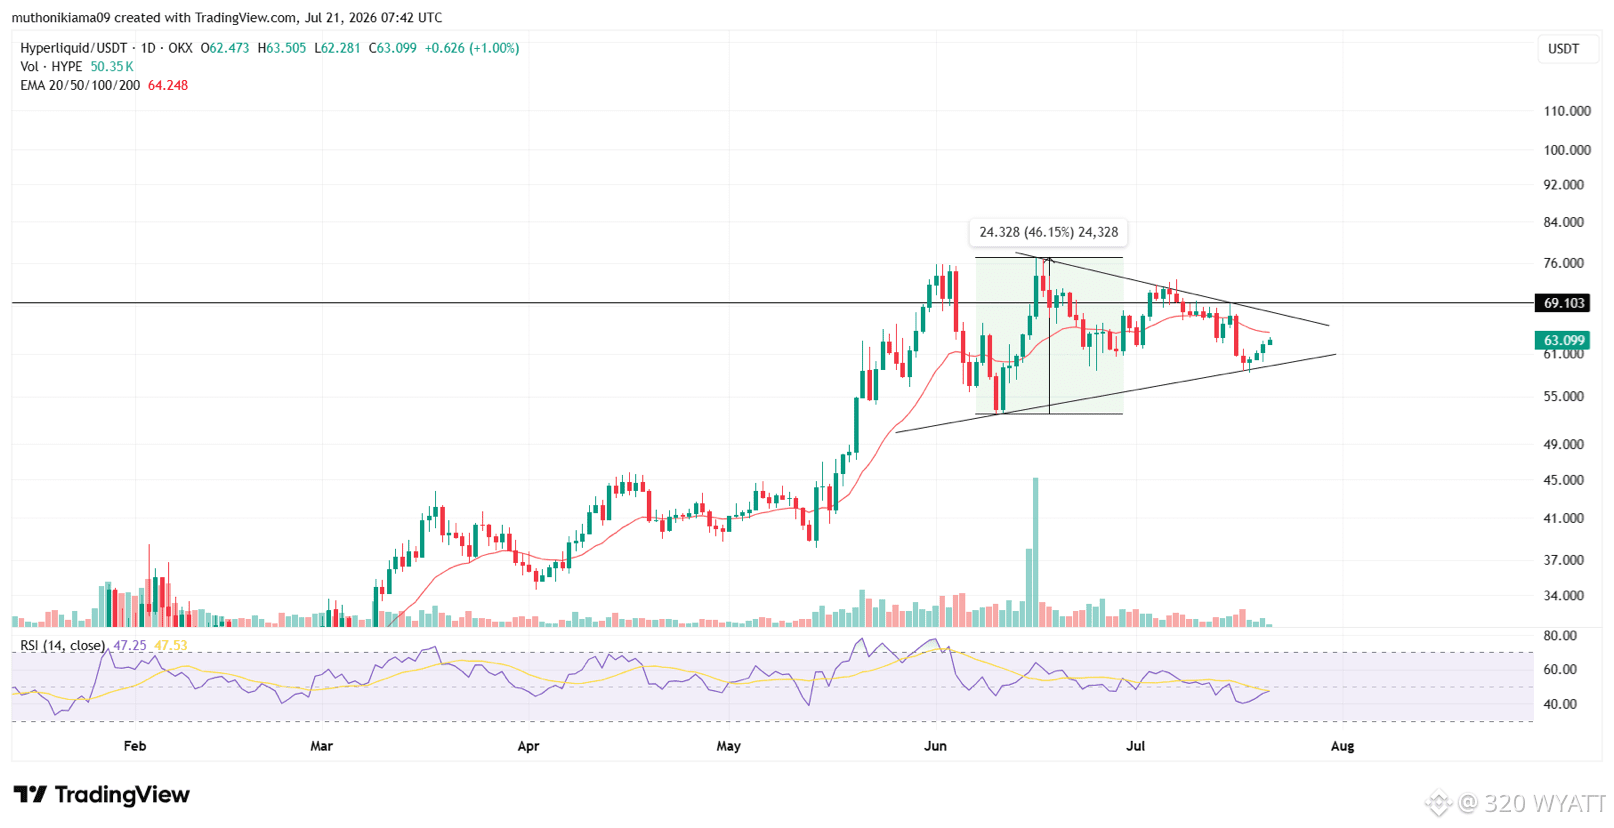
HYPE price is testing resistance at the 20-day EMA of $64. Closing above this obstacle could push HYPE to the psychological price of $70.
This 20-day EMA of $64 also lies within a symmetrical triangle pattern. The pattern has been forming since June 20 as the price of HYPE made higher lows and lower highs.
Past trends show that HYPE touched the upper boundary of the symmetrical triangle after closing above the 20-day EMA. This occurred on June 13 and July 12.
If history rhymes and HYPE closes above $64, the price might gain by 46%, which is equivalent to the height of the symmetrical triangle.
But if Hyperliquid does not close above the 20-day EMA, it might move to the lower boundary of this triangle pattern at $58.
#hype #WriteToEarn2026 #mr320 #Trendingissue #100kUser
$HYPE
HYPE price is testing resistance at the 20-day EMA of $64. Closing above this obstacle could push HYPE to the psychological price of $70.
This 20-day EMA of $64 also lies within a symmetrical triangle pattern. The pattern has been forming since June 20 as the price of HYPE made higher lows and lower highs.
Past trends show that HYPE touched the upper boundary of the symmetrical triangle after closing above the 20-day EMA. This occurred on June 13 and July 12.
If history rhymes and HYPE closes above $64, the price might gain by 46%, which is equivalent to the height of the symmetrical triangle.
But if Hyperliquid does not close above the 20-day EMA, it might move to the lower boundary of this triangle pattern at $58.
#hype #WriteToEarn2026 #mr320 #Trendingissue #100kUser
HYPE price is testing resistance at the 20-day EMA of $64. Closing above this obstacle could push HYPE to the psychological price of $70.
This 20-day EMA of $64 also lies within a symmetrical triangle pattern. The pattern has been forming since June 20 as the price of HYPE made higher lows and lower highs.
Past trends show that HYPE touched the upper boundary of the symmetrical triangle after closing above the 20-day EMA. This occurred on June 13 and July 12.
If history rhymes and HYPE closes above $64, the price might gain by 46%, which is equivalent to the height of the symmetrical triangle.
But if Hyperliquid does not close above the 20-day EMA, it might move to the lower boundary of this triangle pattern at $58.
#hype #WriteToEarn2026 #mr320 #Trendingissue #100kUser
142
·
--
Bearish
$BTC
{spot}(BTCUSDT)
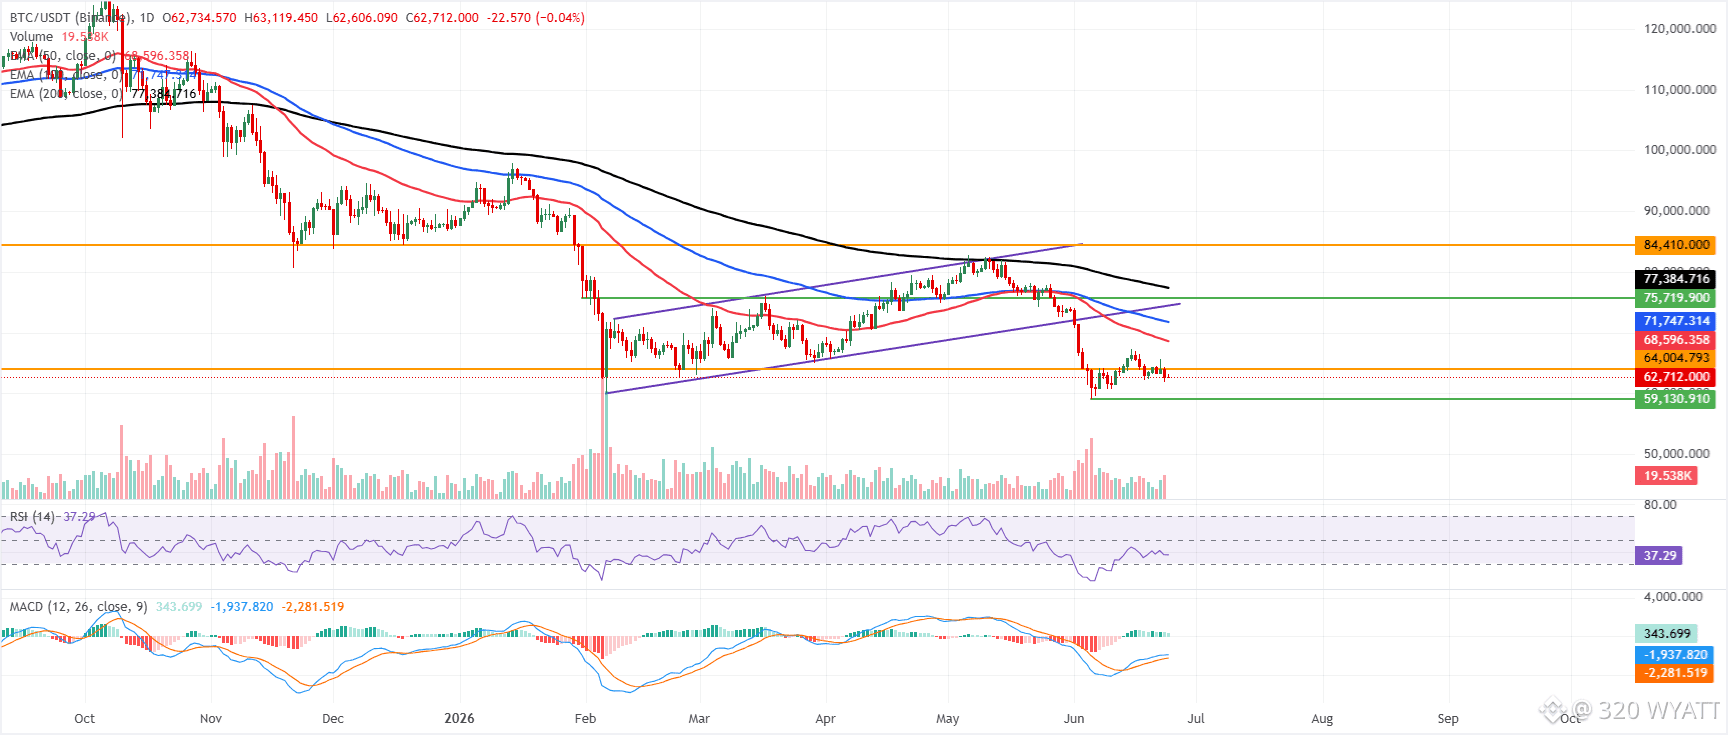
Bitcoin price trades at $62,700 on Wednesday, maintaining a bearish near-term bias as it remains well below the 50-day, 100-day, and 200-day Exponential Moving Averages (EMAs) at roughly $68,596, $71,747, and $77,384, respectively.
The dense cap formed by these overhead EMAs suggests that bounces are likely to be sold into, even as the Relative Strength Index (RSI) stabilizes in mildly oversold territory near 37 and the Moving Average Convergence Divergence (MACD) indicator remains in positive territory, hinting at fading downside momentum rather than a clear bullish reversal.
On the topside, initial resistance is seen at the horizontal level around $64,004, with further barriers at the 50-day EMA near $68,596 and then the 100-day EMA at $71,747; a sustained break above this EMA cluster would be needed to ease the prevailing downside pressure, while the 200-day EMA near $77,384 and the prior horizontal resistance at $84,410 remain medium-term caps.
On the downside, the next notable support is the rising trendline base drawn from around $60,000, and a daily close below this area would expose additional weakness toward lower psychological levels, keeping the broader structure under bearish control.
#BTC320 #Trendingissue #mr320 #WriteToEarn2026 #100kUser
$BTC
Bitcoin price trades at $62,700 on Wednesday, maintaining a bearish near-term bias as it remains well below the 50-day, 100-day, and 200-day Exponential Moving Averages (EMAs) at roughly $68,596, $71,747, and $77,384, respectively.
The dense cap formed by these overhead EMAs suggests that bounces are likely to be sold into, even as the Relative Strength Index (RSI) stabilizes in mildly oversold territory near 37 and the Moving Average Convergence Divergence (MACD) indicator remains in positive territory, hinting at fading downside momentum rather than a clear bullish reversal.
On the topside, initial resistance is seen at the horizontal level around $64,004, with further barriers at the 50-day EMA near $68,596 and then the 100-day EMA at $71,747; a sustained break above this EMA cluster would be needed to ease the prevailing downside pressure, while the 200-day EMA near $77,384 and the prior horizontal resistance at $84,410 remain medium-term caps.
On the downside, the next notable support is the rising trendline base drawn from around $60,000, and a daily close below this area would expose additional weakness toward lower psychological levels, keeping the broader structure under bearish control.
#BTC320 #Trendingissue #mr320 #WriteToEarn2026 #100kUser
Bitcoin price trades at $62,700 on Wednesday, maintaining a bearish near-term bias as it remains well below the 50-day, 100-day, and 200-day Exponential Moving Averages (EMAs) at roughly $68,596, $71,747, and $77,384, respectively.
The dense cap formed by these overhead EMAs suggests that bounces are likely to be sold into, even as the Relative Strength Index (RSI) stabilizes in mildly oversold territory near 37 and the Moving Average Convergence Divergence (MACD) indicator remains in positive territory, hinting at fading downside momentum rather than a clear bullish reversal.
On the topside, initial resistance is seen at the horizontal level around $64,004, with further barriers at the 50-day EMA near $68,596 and then the 100-day EMA at $71,747; a sustained break above this EMA cluster would be needed to ease the prevailing downside pressure, while the 200-day EMA near $77,384 and the prior horizontal resistance at $84,410 remain medium-term caps.
On the downside, the next notable support is the rising trendline base drawn from around $60,000, and a daily close below this area would expose additional weakness toward lower psychological levels, keeping the broader structure under bearish control.
#BTC320 #Trendingissue #mr320 #WriteToEarn2026 #100kUser
86
·
--
Bearish
$XRP
{spot}(XRPUSDT)
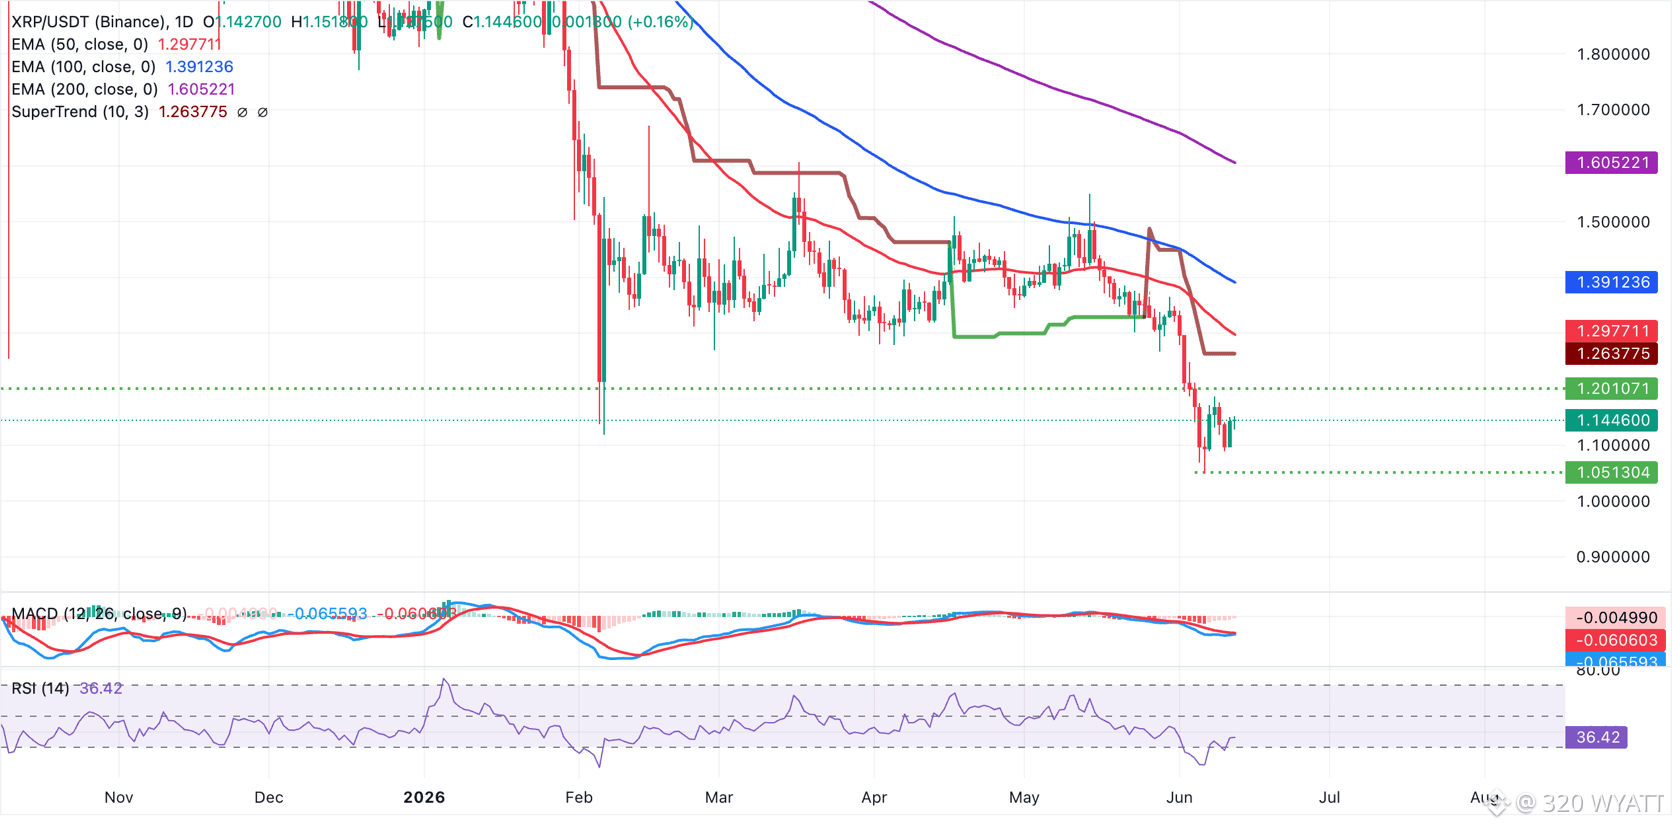
XRP trades above $1.14, extending a bearish bias as price holds well beneath the 50-day, 100-day and 200-day Exponential Moving Averages (EMAs). The short-term tone remains pressured while the SuperTrend line at $1.26 tracks above spot, keeping the downside exposed.
Momentum indicators stay subdued, with the Relative Strength Index (RSI) near 36 on the daily chart and Moving Average Convergence Divergence (MACD) histogram still negative, which together hint that sellers retain control despite the recent stabilization off the lows.
On the topside, initial resistance lies at the SuperTrend barrier around 1.26, ahead of the 50-day EMA near $1.30, which caps the next recovery attempt. Further up, the 100-day EMA at $1.39 and the 200-day EMA close to $1.61 build a broader supply zone that would need to be reclaimed to ease the prevailing bearish structure.
If selling activity continues and headwinds intensify, buyers may seek to re-engage at lower lows and psychological support zones, including $1.05 and $1.00. Renewed dips would leave XRP vulnerable to pressure until buyers can force a sustained move back above the first EMA layer.
#xrp320 #Trendingissue #mr320 #writetoearn2026 #100kUser
$XRP
XRP trades above $1.14, extending a bearish bias as price holds well beneath the 50-day, 100-day and 200-day Exponential Moving Averages (EMAs). The short-term tone remains pressured while the SuperTrend line at $1.26 tracks above spot, keeping the downside exposed.
Momentum indicators stay subdued, with the Relative Strength Index (RSI) near 36 on the daily chart and Moving Average Convergence Divergence (MACD) histogram still negative, which together hint that sellers retain control despite the recent stabilization off the lows.
On the topside, initial resistance lies at the SuperTrend barrier around 1.26, ahead of the 50-day EMA near $1.30, which caps the next recovery attempt. Further up, the 100-day EMA at $1.39 and the 200-day EMA close to $1.61 build a broader supply zone that would need to be reclaimed to ease the prevailing bearish structure.
If selling activity continues and headwinds intensify, buyers may seek to re-engage at lower lows and psychological support zones, including $1.05 and $1.00. Renewed dips would leave XRP vulnerable to pressure until buyers can force a sustained move back above the first EMA layer.
#xrp320 #Trendingissue #mr320 #writetoearn2026 #100kUser
XRP trades above $1.14, extending a bearish bias as price holds well beneath the 50-day, 100-day and 200-day Exponential Moving Averages (EMAs). The short-term tone remains pressured while the SuperTrend line at $1.26 tracks above spot, keeping the downside exposed.
Momentum indicators stay subdued, with the Relative Strength Index (RSI) near 36 on the daily chart and Moving Average Convergence Divergence (MACD) histogram still negative, which together hint that sellers retain control despite the recent stabilization off the lows.
On the topside, initial resistance lies at the SuperTrend barrier around 1.26, ahead of the 50-day EMA near $1.30, which caps the next recovery attempt. Further up, the 100-day EMA at $1.39 and the 200-day EMA close to $1.61 build a broader supply zone that would need to be reclaimed to ease the prevailing bearish structure.
If selling activity continues and headwinds intensify, buyers may seek to re-engage at lower lows and psychological support zones, including $1.05 and $1.00. Renewed dips would leave XRP vulnerable to pressure until buyers can force a sustained move back above the first EMA layer.
#xrp320 #Trendingissue #mr320 #writetoearn2026 #100kUser
2
342
·
--
Bullish
$XRP
{spot}(XRPUSDT)
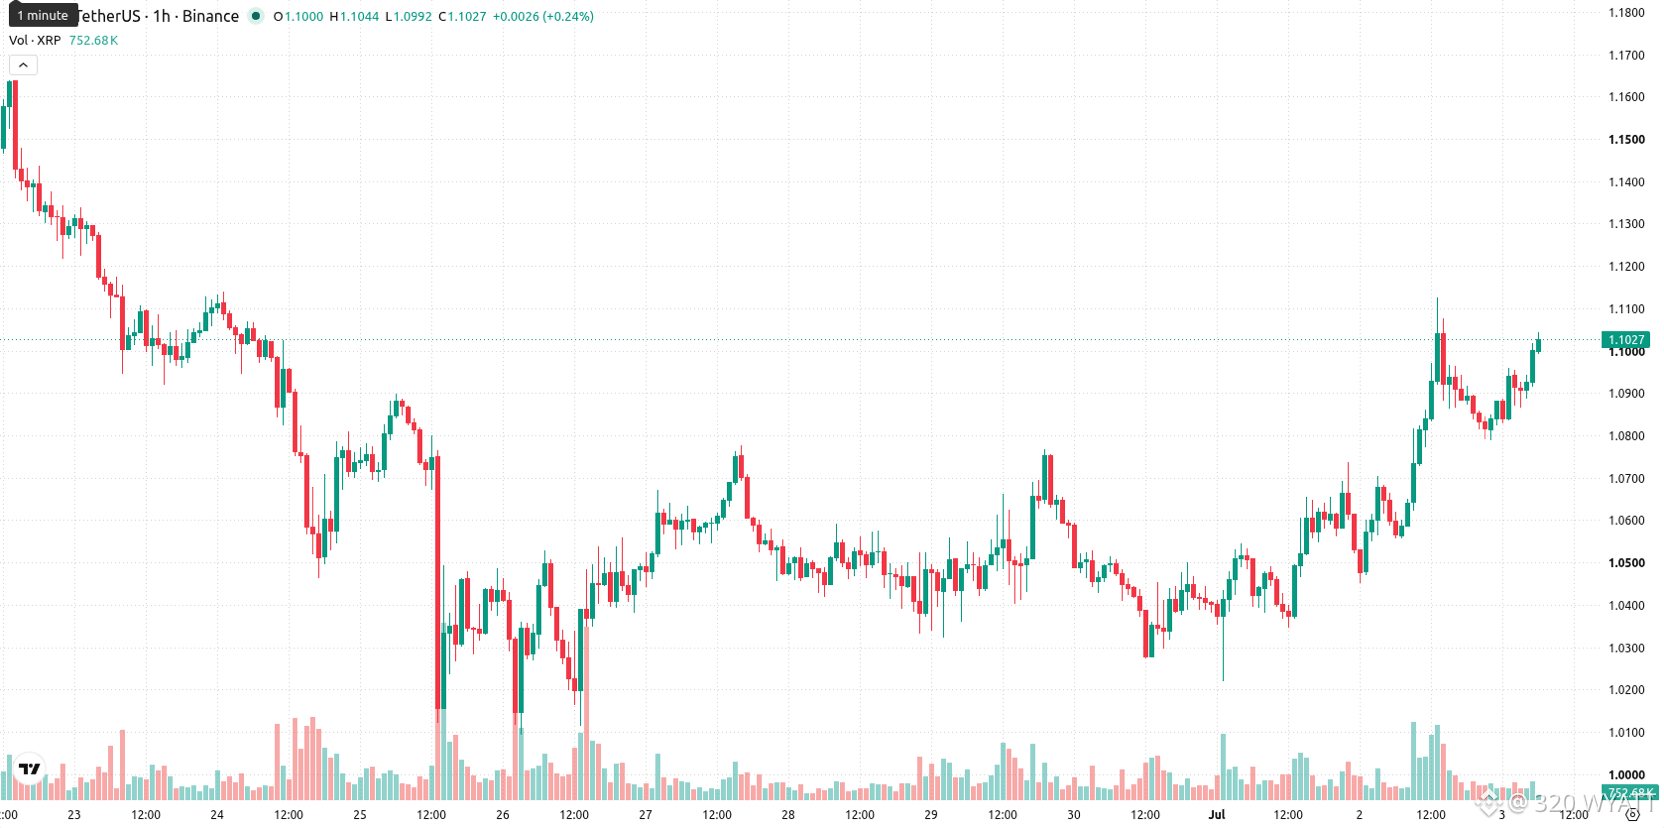
On the technical front, XRP is trading just below the 20-day moving average but above the 50-day, while remaining well beneath the 200-day average on the daily chart. The Ichimoku Kijun level at $1.0841 acts as immediate support. The Moving Average Convergence Divergence (MACD) shows strong buy momentum, and the Average Directional Index (ADX) confirms this buy signal. The Relative Strength Index (RSI) stands at 61.31, indicating bullish conditions, and the Commodity Channel Index (CCI) also points to buyer strength. The Stochastic RSI is neutral. Bull/Bear Power highlights intraday buyer dominance, with the Awesome Oscillator providing further positive confirmation. Despite these signals, intraday price action has drifted toward the lower part of the daily range, with no notable indicator divergences.
#xrp320 #Trendingissue #mr320 #WriteToEarn2026 #100kUser
$XRP
On the technical front, XRP is trading just below the 20-day moving average but above the 50-day, while remaining well beneath the 200-day average on the daily chart. The Ichimoku Kijun level at $1.0841 acts as immediate support. The Moving Average Convergence Divergence (MACD) shows strong buy momentum, and the Average Directional Index (ADX) confirms this buy signal. The Relative Strength Index (RSI) stands at 61.31, indicating bullish conditions, and the Commodity Channel Index (CCI) also points to buyer strength. The Stochastic RSI is neutral. Bull/Bear Power highlights intraday buyer dominance, with the Awesome Oscillator providing further positive confirmation. Despite these signals, intraday price action has drifted toward the lower part of the daily range, with no notable indicator divergences.
#xrp320 #Trendingissue #mr320 #WriteToEarn2026 #100kUser
On the technical front, XRP is trading just below the 20-day moving average but above the 50-day, while remaining well beneath the 200-day average on the daily chart. The Ichimoku Kijun level at $1.0841 acts as immediate support. The Moving Average Convergence Divergence (MACD) shows strong buy momentum, and the Average Directional Index (ADX) confirms this buy signal. The Relative Strength Index (RSI) stands at 61.31, indicating bullish conditions, and the Commodity Channel Index (CCI) also points to buyer strength. The Stochastic RSI is neutral. Bull/Bear Power highlights intraday buyer dominance, with the Awesome Oscillator providing further positive confirmation. Despite these signals, intraday price action has drifted toward the lower part of the daily range, with no notable indicator divergences.
#xrp320 #Trendingissue #mr320 #WriteToEarn2026 #100kUser
157
·
--
Bearish
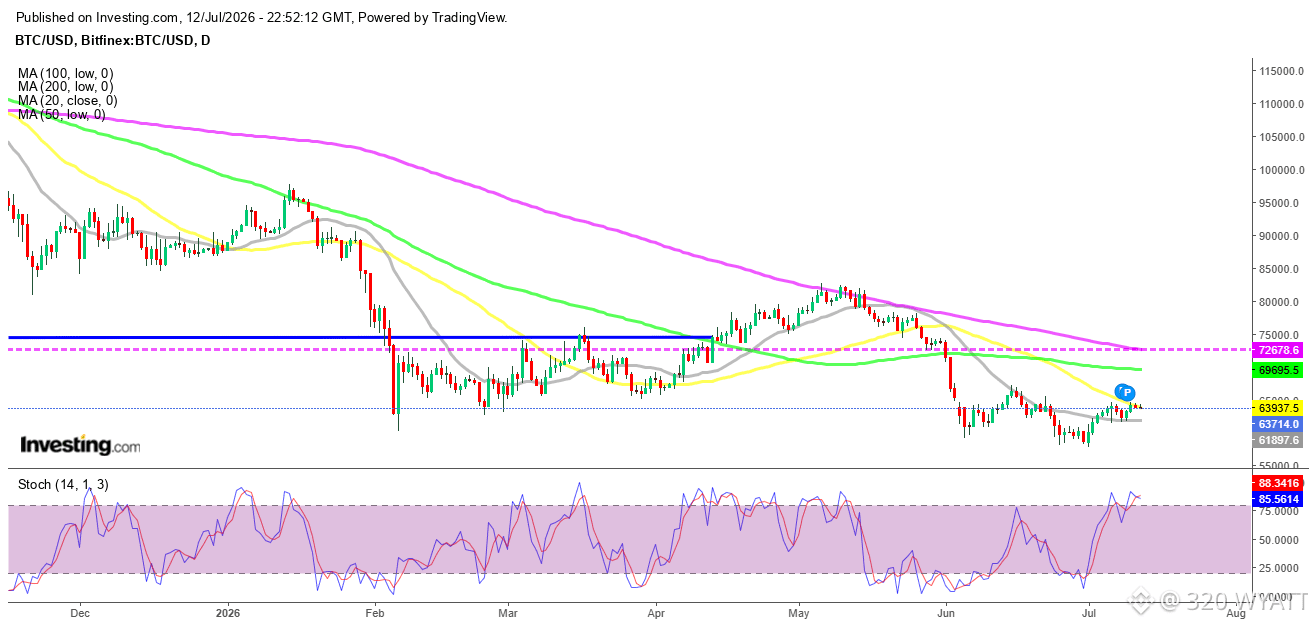
$BTC
{spot}(BTCUSDT)
🚨Outlook Improving but Resistance Remains🚨
Despite the improving backdrop, Bitcoin still faces important technical hurdles.
Maintaining support above $58,000 remains essential for preserving the current recovery, while a sustained move above recent resistance levels would be needed to confirm a broader bullish reversal.
Investors will continue monitoring inflation data, Federal Reserve communication and regulatory developments for clues about liquidity conditions and institutional participation.
For now, stronger ETF demand, improving legislative prospects and resilient technical support are providing Bitcoin with a more constructive outlook heading into the second half of 2026.
#BTC320 #Trendingissue #mr320 #writetoearn2026 #100kUser
$BTC
🚨Outlook Improving but Resistance Remains🚨
Despite the improving backdrop, Bitcoin still faces important technical hurdles.
Maintaining support above $58,000 remains essential for preserving the current recovery, while a sustained move above recent resistance levels would be needed to confirm a broader bullish reversal.
Investors will continue monitoring inflation data, Federal Reserve communication and regulatory developments for clues about liquidity conditions and institutional participation.
For now, stronger ETF demand, improving legislative prospects and resilient technical support are providing Bitcoin with a more constructive outlook heading into the second half of 2026.
#BTC320 #Trendingissue #mr320 #writetoearn2026 #100kUser
🚨Outlook Improving but Resistance Remains🚨
Despite the improving backdrop, Bitcoin still faces important technical hurdles.
Maintaining support above $58,000 remains essential for preserving the current recovery, while a sustained move above recent resistance levels would be needed to confirm a broader bullish reversal.
Investors will continue monitoring inflation data, Federal Reserve communication and regulatory developments for clues about liquidity conditions and institutional participation.
For now, stronger ETF demand, improving legislative prospects and resilient technical support are providing Bitcoin with a more constructive outlook heading into the second half of 2026.
#BTC320 #Trendingissue #mr320 #writetoearn2026 #100kUser
70
·
--
Bullish
$PEPE
{spot}(PEPEUSDT)
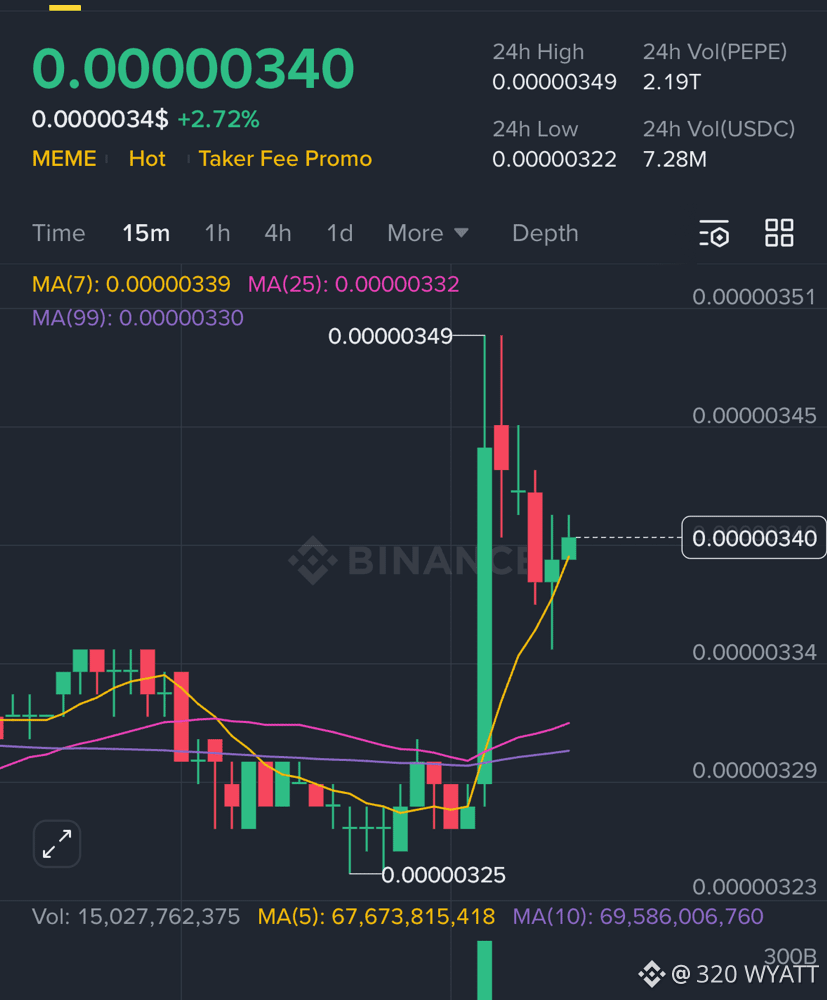
PEPE trades near $0.0000034 as of March 23, down 85% from its all time high of $0.000028, according to CoinMarketCap. The original meme coin proved that 420 trillion tokens and community energy can build $11 billion with zero products.
But from $0.0000034, a 10x requires levels it held only briefly. Pepeto has the same supply, the same cofounder, and the exchange Pepe never built.
#pepe320 #Trendingissue #WriteToEarn2026 #100kUser #mr320
$PEPE
PEPE trades near $0.0000034 as of March 23, down 85% from its all time high of $0.000028, according to CoinMarketCap. The original meme coin proved that 420 trillion tokens and community energy can build $11 billion with zero products.
But from $0.0000034, a 10x requires levels it held only briefly. Pepeto has the same supply, the same cofounder, and the exchange Pepe never built.
#pepe320 #Trendingissue #WriteToEarn2026 #100kUser #mr320
PEPE trades near $0.0000034 as of March 23, down 85% from its all time high of $0.000028, according to CoinMarketCap. The original meme coin proved that 420 trillion tokens and community energy can build $11 billion with zero products.
But from $0.0000034, a 10x requires levels it held only briefly. Pepeto has the same supply, the same cofounder, and the exchange Pepe never built.
#pepe320 #Trendingissue #WriteToEarn2026 #100kUser #mr320
1
8
1.6k
·
--
Bullish
$XRP
{spot}(XRPUSDT)
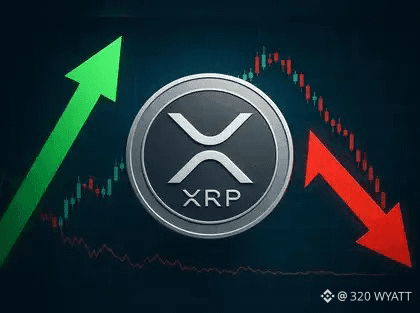
XRP’s May 2026 price prediction targets $1.55, with a range of $1.35–$1.60. XRP is below its 200-day MA at $1.4238, and the monthly RSI at 45 signals neutral conditions. A monthly close above $1.60 would confirm bullish momentum heading into Q2 2026.
#xrp320 #TrendIsStrong #mr320 #100kUser #WriteToEarn2026
$XRP
XRP’s May 2026 price prediction targets $1.55, with a range of $1.35–$1.60. XRP is below its 200-day MA at $1.4238, and the monthly RSI at 45 signals neutral conditions. A monthly close above $1.60 would confirm bullish momentum heading into Q2 2026.
#xrp320 #TrendIsStrong #mr320 #100kUser #WriteToEarn2026
XRP’s May 2026 price prediction targets $1.55, with a range of $1.35–$1.60. XRP is below its 200-day MA at $1.4238, and the monthly RSI at 45 signals neutral conditions. A monthly close above $1.60 would confirm bullish momentum heading into Q2 2026.
#xrp320 #TrendIsStrong #mr320 #100kUser #WriteToEarn2026
3
134
·
--
Bullish
$BTC
{spot}(BTCUSDT)
On the technical front, BTC is trading below the MA-20 and MA-50 on the hourly chart, and significantly below the MA-200 on the daily chart. The Ichimoku Kijun is positioned at $62,151 and acts as immediate resistance. Oscillator signals are mixed: the Moving Average Convergence Divergence (MACD) and Average Directional Index (ADX) both show a strong buy tone, while the Relative Strength Index (RSI) and Commodity Channel Index (CCI) also indicate continued buying pressure. Meanwhile, Bull/Bear Power is overbought, Stochastic RSI remains neutral, and the Awesome Oscillator does not confirm the prevailing trend, which suggests buyers dominate the short-term flow but the risk of exhaustion is rising.
#BTC320 #Trendingissue #mr320 #WriteToEarn2026 #100kUser
$BTC
On the technical front, BTC is trading below the MA-20 and MA-50 on the hourly chart, and significantly below the MA-200 on the daily chart. The Ichimoku Kijun is positioned at $62,151 and acts as immediate resistance. Oscillator signals are mixed: the Moving Average Convergence Divergence (MACD) and Average Directional Index (ADX) both show a strong buy tone, while the Relative Strength Index (RSI) and Commodity Channel Index (CCI) also indicate continued buying pressure. Meanwhile, Bull/Bear Power is overbought, Stochastic RSI remains neutral, and the Awesome Oscillator does not confirm the prevailing trend, which suggests buyers dominate the short-term flow but the risk of exhaustion is rising.
#BTC320 #Trendingissue #mr320 #WriteToEarn2026 #100kUser
On the technical front, BTC is trading below the MA-20 and MA-50 on the hourly chart, and significantly below the MA-200 on the daily chart. The Ichimoku Kijun is positioned at $62,151 and acts as immediate resistance. Oscillator signals are mixed: the Moving Average Convergence Divergence (MACD) and Average Directional Index (ADX) both show a strong buy tone, while the Relative Strength Index (RSI) and Commodity Channel Index (CCI) also indicate continued buying pressure. Meanwhile, Bull/Bear Power is overbought, Stochastic RSI remains neutral, and the Awesome Oscillator does not confirm the prevailing trend, which suggests buyers dominate the short-term flow but the risk of exhaustion is rising.
#BTC320 #Trendingissue #mr320 #WriteToEarn2026 #100kUser

1
113
·
--
Bearish
$ADA
{spot}(ADAUSDT)
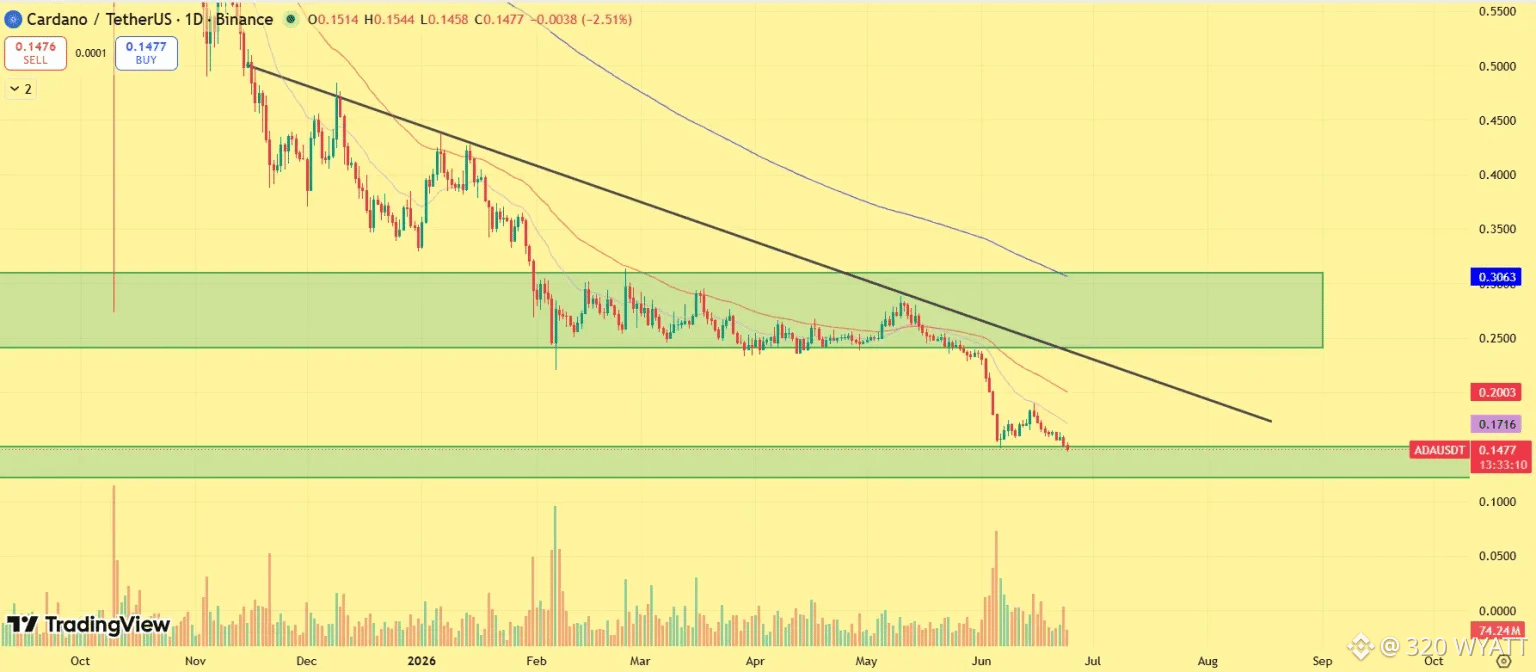
ADA price is currently trading near $0.15, down nearly 50% from its late-2025 highs. Cardano price continued to trade below its 20-day, 50-day, and 200-day moving averages, confirming strong bearish momentum. A long-term descending trendline continues to reject every recovery attempt, while the major supply zone between $0.25 and $0.30 remains far above current prices.
The $0.15 area now serves as the final major support zone. If buyers fail to defend this level, additional downside could emerge toward lower psychological support levels. However, reclaiming $0.17 would be the first sign that selling pressure is beginning to weaken.
#Ada320 #Trendingissue #mr320 #WriteToEarn2026 #100kUser
$ADA
ADA price is currently trading near $0.15, down nearly 50% from its late-2025 highs. Cardano price continued to trade below its 20-day, 50-day, and 200-day moving averages, confirming strong bearish momentum. A long-term descending trendline continues to reject every recovery attempt, while the major supply zone between $0.25 and $0.30 remains far above current prices.
The $0.15 area now serves as the final major support zone. If buyers fail to defend this level, additional downside could emerge toward lower psychological support levels. However, reclaiming $0.17 would be the first sign that selling pressure is beginning to weaken.
#Ada320 #Trendingissue #mr320 #WriteToEarn2026 #100kUser
ADA price is currently trading near $0.15, down nearly 50% from its late-2025 highs. Cardano price continued to trade below its 20-day, 50-day, and 200-day moving averages, confirming strong bearish momentum. A long-term descending trendline continues to reject every recovery attempt, while the major supply zone between $0.25 and $0.30 remains far above current prices.
The $0.15 area now serves as the final major support zone. If buyers fail to defend this level, additional downside could emerge toward lower psychological support levels. However, reclaiming $0.17 would be the first sign that selling pressure is beginning to weaken.
#Ada320 #Trendingissue #mr320 #WriteToEarn2026 #100kUser
1
198
·
--
Bullish
$XRP
{spot}(XRPUSDT)
In previous years, the XRP price was suppressed by the "litigation discount." Major exchanges delisted the token, and institutional partners were hesitant to integrate a technology under legal fire. By 2026, those barriers have been completely dismantled.
Today, XRP is integrated into the core liquidity stacks of several global Tier-1 banks. The transition from "Ripple the company" to "XRP the global utility asset" is nearly complete. Institutional utility is no longer a theoretical "use case" found in a whitepaper; it is a daily reality for trillions of dollars in cross-border settlements. This shift from retail speculation to institutional necessity is why the quest for XRP Reach $4 in 2026 is backed by far stronger fundamentals than the 2018 rally.
#xrp320 #Trendingissue #mr320 #WriteToEarn2026 #100kUser
$XRP
In previous years, the XRP price was suppressed by the "litigation discount." Major exchanges delisted the token, and institutional partners were hesitant to integrate a technology under legal fire. By 2026, those barriers have been completely dismantled.
Today, XRP is integrated into the core liquidity stacks of several global Tier-1 banks. The transition from "Ripple the company" to "XRP the global utility asset" is nearly complete. Institutional utility is no longer a theoretical "use case" found in a whitepaper; it is a daily reality for trillions of dollars in cross-border settlements. This shift from retail speculation to institutional necessity is why the quest for XRP Reach $4 in 2026 is backed by far stronger fundamentals than the 2018 rally.
#xrp320 #Trendingissue #mr320 #WriteToEarn2026 #100kUser
In previous years, the XRP price was suppressed by the "litigation discount." Major exchanges delisted the token, and institutional partners were hesitant to integrate a technology under legal fire. By 2026, those barriers have been completely dismantled.
Today, XRP is integrated into the core liquidity stacks of several global Tier-1 banks. The transition from "Ripple the company" to "XRP the global utility asset" is nearly complete. Institutional utility is no longer a theoretical "use case" found in a whitepaper; it is a daily reality for trillions of dollars in cross-border settlements. This shift from retail speculation to institutional necessity is why the quest for XRP Reach $4 in 2026 is backed by far stronger fundamentals than the 2018 rally.
#xrp320 #Trendingissue #mr320 #WriteToEarn2026 #100kUser
3
3
676
·
--
Bearish
$ETH
{spot}(ETHUSDT)
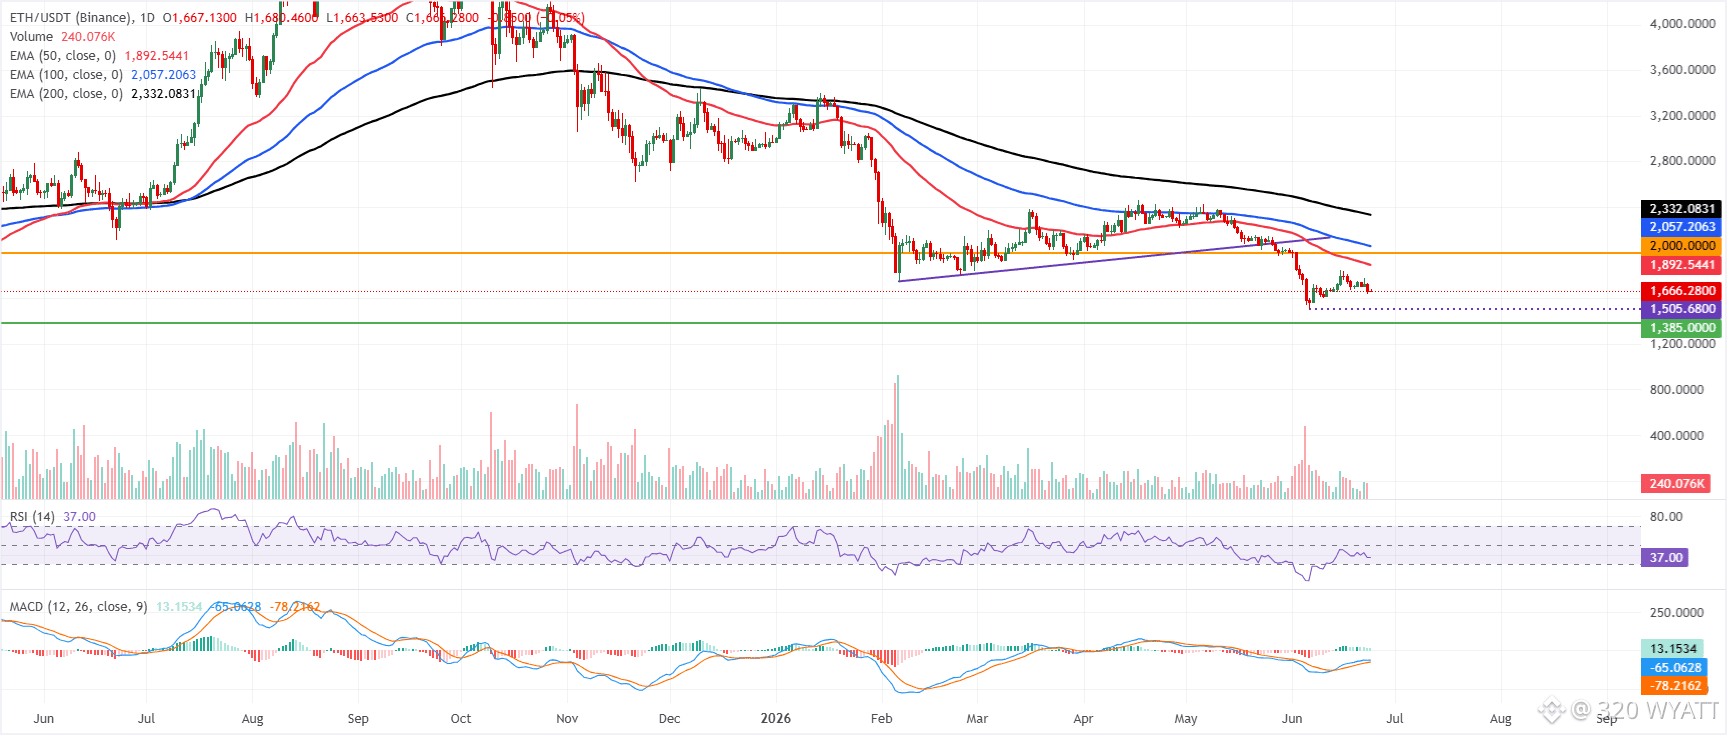
Ethereum price trades at $1,666 on Wednesday, retaining a bearish near-term bias as price holds well below the key EMAs. The 50-day EMA is around $1,892, the 100-day EMA near $2,057 and the 200-day EMA at about $2,332 all sit overhead, suggesting that rebounds remain corrective within a broader downtrend.
Momentum is attempting to stabilize, with the RSI hovering near 37 and MACD holding in positive territory, but this improvement has yet to translate into a meaningful reclaim of structural levels.
On the topside, initial resistance is seen at the horizontal barrier near $2,000, ahead of the 50-day EMA at $1,892, which, together with the 100-day EMA at $2,057 and the 200-day EMA at $2,332, defines a dense supply zone that could cap any recovery attempts.
On the downside, the next notable support does not appear until the prior horizontal floor near $1,385, and a daily close below recent lows would expose that area, reinforcing the prevailing bearish structure despite the tentative improvement in momentum indicators.
#eth320 #Trendingissue #mr320 #WriteToEarn2026 #100kUser
$ETH
Ethereum price trades at $1,666 on Wednesday, retaining a bearish near-term bias as price holds well below the key EMAs. The 50-day EMA is around $1,892, the 100-day EMA near $2,057 and the 200-day EMA at about $2,332 all sit overhead, suggesting that rebounds remain corrective within a broader downtrend.
Momentum is attempting to stabilize, with the RSI hovering near 37 and MACD holding in positive territory, but this improvement has yet to translate into a meaningful reclaim of structural levels.
On the topside, initial resistance is seen at the horizontal barrier near $2,000, ahead of the 50-day EMA at $1,892, which, together with the 100-day EMA at $2,057 and the 200-day EMA at $2,332, defines a dense supply zone that could cap any recovery attempts.
On the downside, the next notable support does not appear until the prior horizontal floor near $1,385, and a daily close below recent lows would expose that area, reinforcing the prevailing bearish structure despite the tentative improvement in momentum indicators.
#eth320 #Trendingissue #mr320 #WriteToEarn2026 #100kUser
Ethereum price trades at $1,666 on Wednesday, retaining a bearish near-term bias as price holds well below the key EMAs. The 50-day EMA is around $1,892, the 100-day EMA near $2,057 and the 200-day EMA at about $2,332 all sit overhead, suggesting that rebounds remain corrective within a broader downtrend.
Momentum is attempting to stabilize, with the RSI hovering near 37 and MACD holding in positive territory, but this improvement has yet to translate into a meaningful reclaim of structural levels.
On the topside, initial resistance is seen at the horizontal barrier near $2,000, ahead of the 50-day EMA at $1,892, which, together with the 100-day EMA at $2,057 and the 200-day EMA at $2,332, defines a dense supply zone that could cap any recovery attempts.
On the downside, the next notable support does not appear until the prior horizontal floor near $1,385, and a daily close below recent lows would expose that area, reinforcing the prevailing bearish structure despite the tentative improvement in momentum indicators.
#eth320 #Trendingissue #mr320 #WriteToEarn2026 #100kUser
123
·
--
Cheers to 10000 of you! Thrilled with the support and excited for what's next. ❤️
#Trendingissue #mr320 #WriteToEarn2026 #100kUser #Binance320
Cheers to 10000 of you! Thrilled with the support and excited for what's next. ❤️
#Trendingissue #mr320 #WriteToEarn2026 #100kUser #Binance320
#Trendingissue #mr320 #WriteToEarn2026 #100kUser #Binance320

ابوالعز1123:
مبروك الـ 10K يا Wyatt ❤️ واحترمت فيك انك مش متابع ولا واحد ومركز في شغلك وبس، وده سر نجاحك وتحليلاتك المظبوطة لـ $BTC$ من 85K. الناس بتحب اللي مركز مش اللي بيلف ورا الناس. تستاهل 100K مش 10K بس، وأنا أول واحد باركلك ومتابعك من زمان.
2
6
140
·
--
Bearish
$SOL
{spot}(SOLUSDT)
The trading volume of Solana (SOL) is $2,079,461,206 in the last 24 hours, representing a -37.30% decrease from one day ago and signalling a recent fall in market activity.
#solana320 #Trendingissue #mr320 #WriteToEarn2026 #100kUser
$SOL
The trading volume of Solana (SOL) is $2,079,461,206 in the last 24 hours, representing a -37.30% decrease from one day ago and signalling a recent fall in market activity.
#solana320 #Trendingissue #mr320 #WriteToEarn2026 #100kUser
The trading volume of Solana (SOL) is $2,079,461,206 in the last 24 hours, representing a -37.30% decrease from one day ago and signalling a recent fall in market activity.
#solana320 #Trendingissue #mr320 #WriteToEarn2026 #100kUser

FXRonin:
Thanks for this. I just added you to my list. Interaction is the key so I will be active on your feed daily. Let me know if I missed our connection. Sorry for the bother.
7
1
6
963
Log in to explore more content
Join global crypto users on Binance Square
⚡️ Get latest and useful information about crypto.
💬 Trusted by the world’s largest crypto exchange.
👍 Discover real insights from verified creators.
Email / Phone number
Trending Topics
1
#AIStocksWhatNext
238,411 views
2,472 Discussing
2
#BitcoinBreaksAboveMayHighNears$86K
8,614 views
145 Discussing
3
#DogecoinRises15%
22,106 views
771 Discussing
4
#$14BBitcoinOptionsExpireFriday
1,566 views
64 Discussing
5
#BNBMarketCapPassesBNYMellon
15,571 views
579 Discussing
6
#CryptoMarketCapReclaims$3Trillion
2,056 views
58 Discussing
7
#MuseOvertakesChatGPTAsTopFreeIOSApp
10,383 views
454 Discussing
8
#TokenizedStockPlatformsCouldLaunchNextQuarter
16,328 views
513 Discussing
9
#StrategyAdds950Bitcoin
21,644 views
573 Discussing
10
#CardanoAddedToX402KitForADAPayments
22,354 views
606 Discussing