
#gamerxero
gamerxero
846,953 views
3,445 Discussing
Hot
Latest

$BTC is sitting at $79 823.99, barely nudging above its 24‑hour midpoint. The candle’s 0.01 % move and a tight band between $79 233.00 and $80 107.99 feel more like a pause than a breakout. I’ve been watching the order‑book depth on Binance Spot and see roughly equal buy and sell walls near the current price, which suggests market participants are waiting for a clear trigger before committing larger positions.
On the other side, $ETH managed a modest 0.73 % gain to $2 498.90, hugging the upper half of its range ($2 460.92 – $2 523.97). The recent uptick in activity around DeFi token swaps on Binance seems to be feeding that slight bullish bias, but the overall volatility remains low.
Do you think the current consolidation is simply a “wait‑and‑see” phase before a news‑driven move, or are we looking at a longer‑term equilibrium where traders fine‑tune their exposure? Share your observations on order‑book signals, volume patterns, or any upcoming events you think could tip the balance.
#CryptoTalk #BinanceInsights #MarketStructure #GAMERXERO
On the other side, $ETH managed a modest 0.73 % gain to $2 498.90, hugging the upper half of its range ($2 460.92 – $2 523.97). The recent uptick in activity around DeFi token swaps on Binance seems to be feeding that slight bullish bias, but the overall volatility remains low.
Do you think the current consolidation is simply a “wait‑and‑see” phase before a news‑driven move, or are we looking at a longer‑term equilibrium where traders fine‑tune their exposure? Share your observations on order‑book signals, volume patterns, or any upcoming events you think could tip the balance.
#CryptoTalk #BinanceInsights #MarketStructure #GAMERXERO
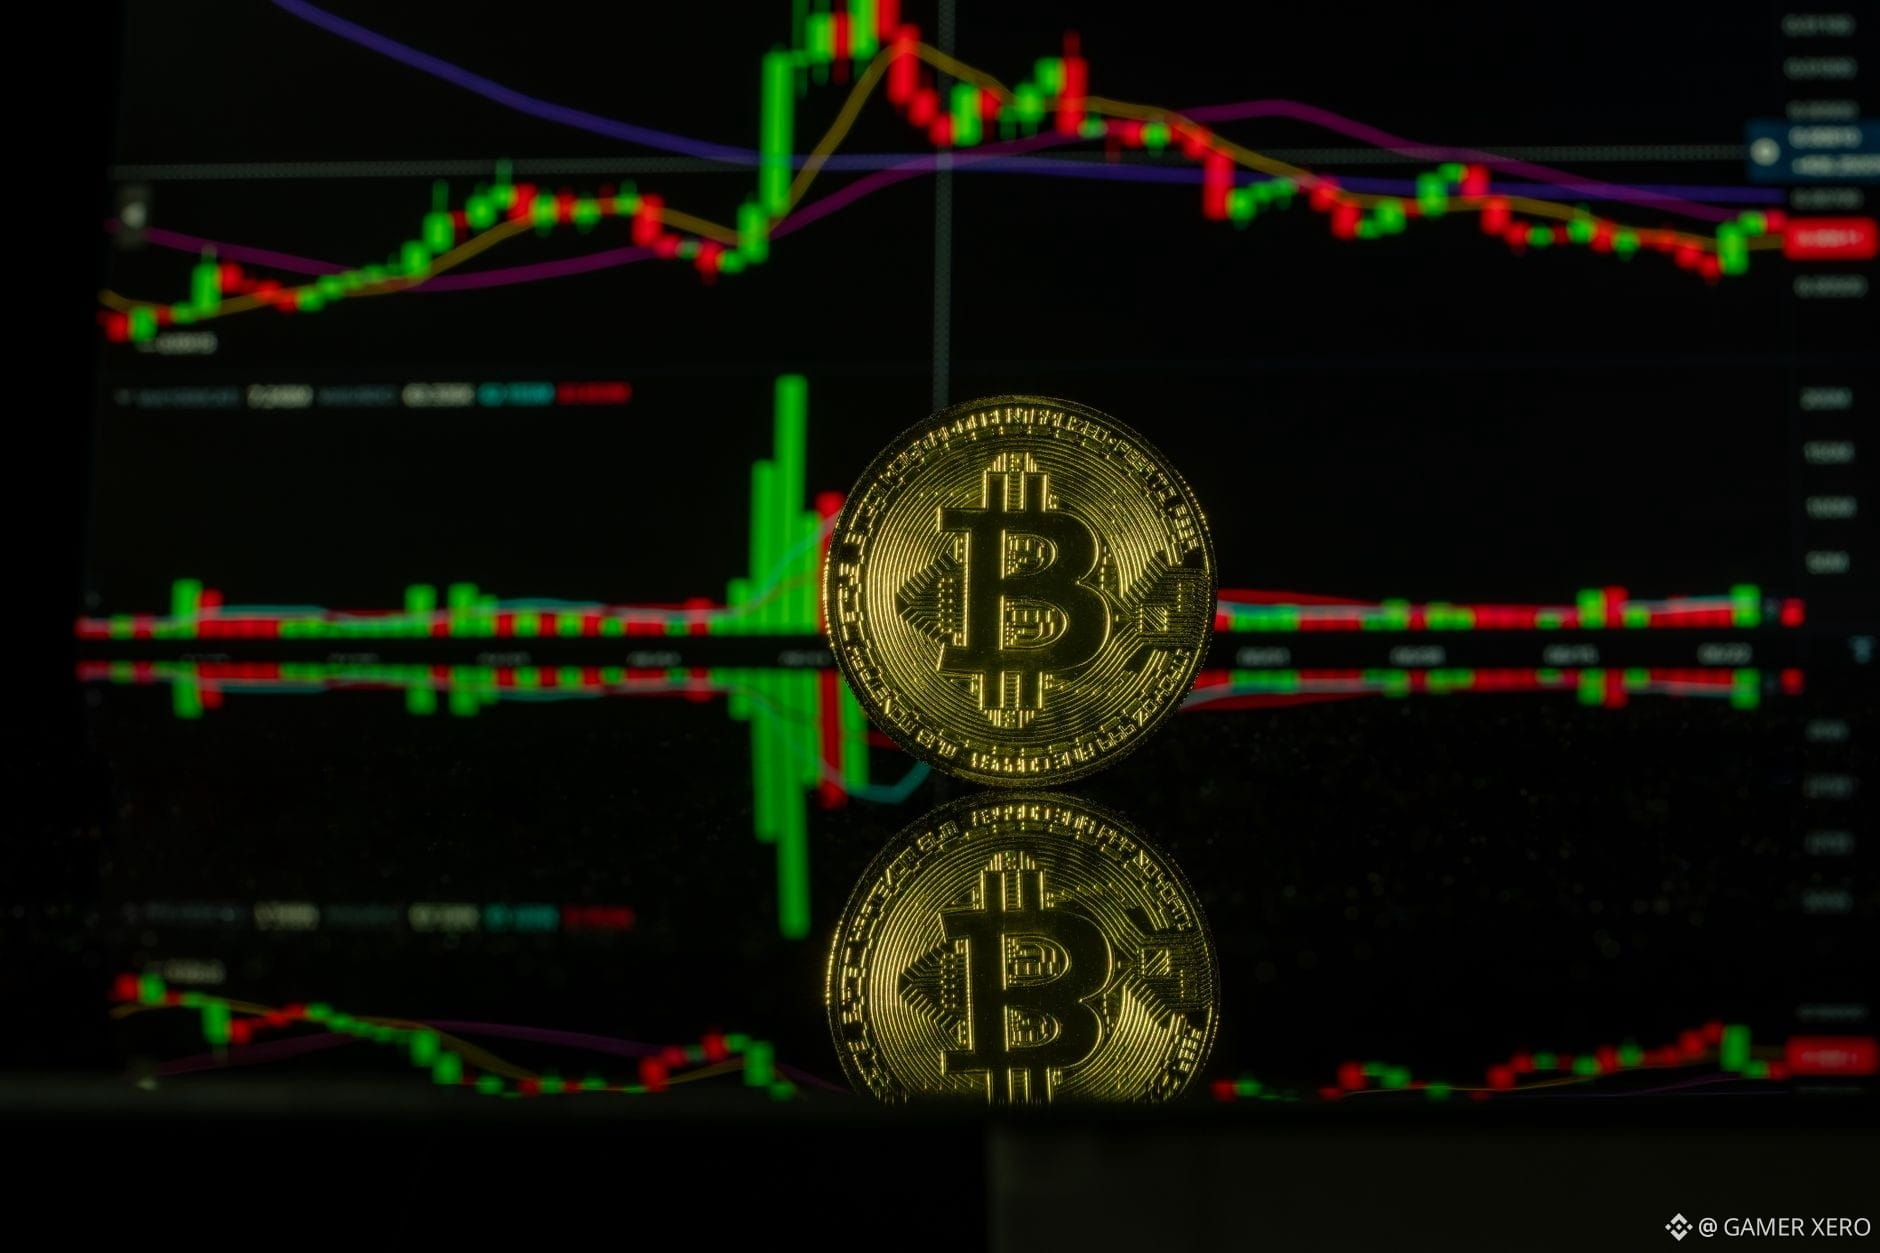
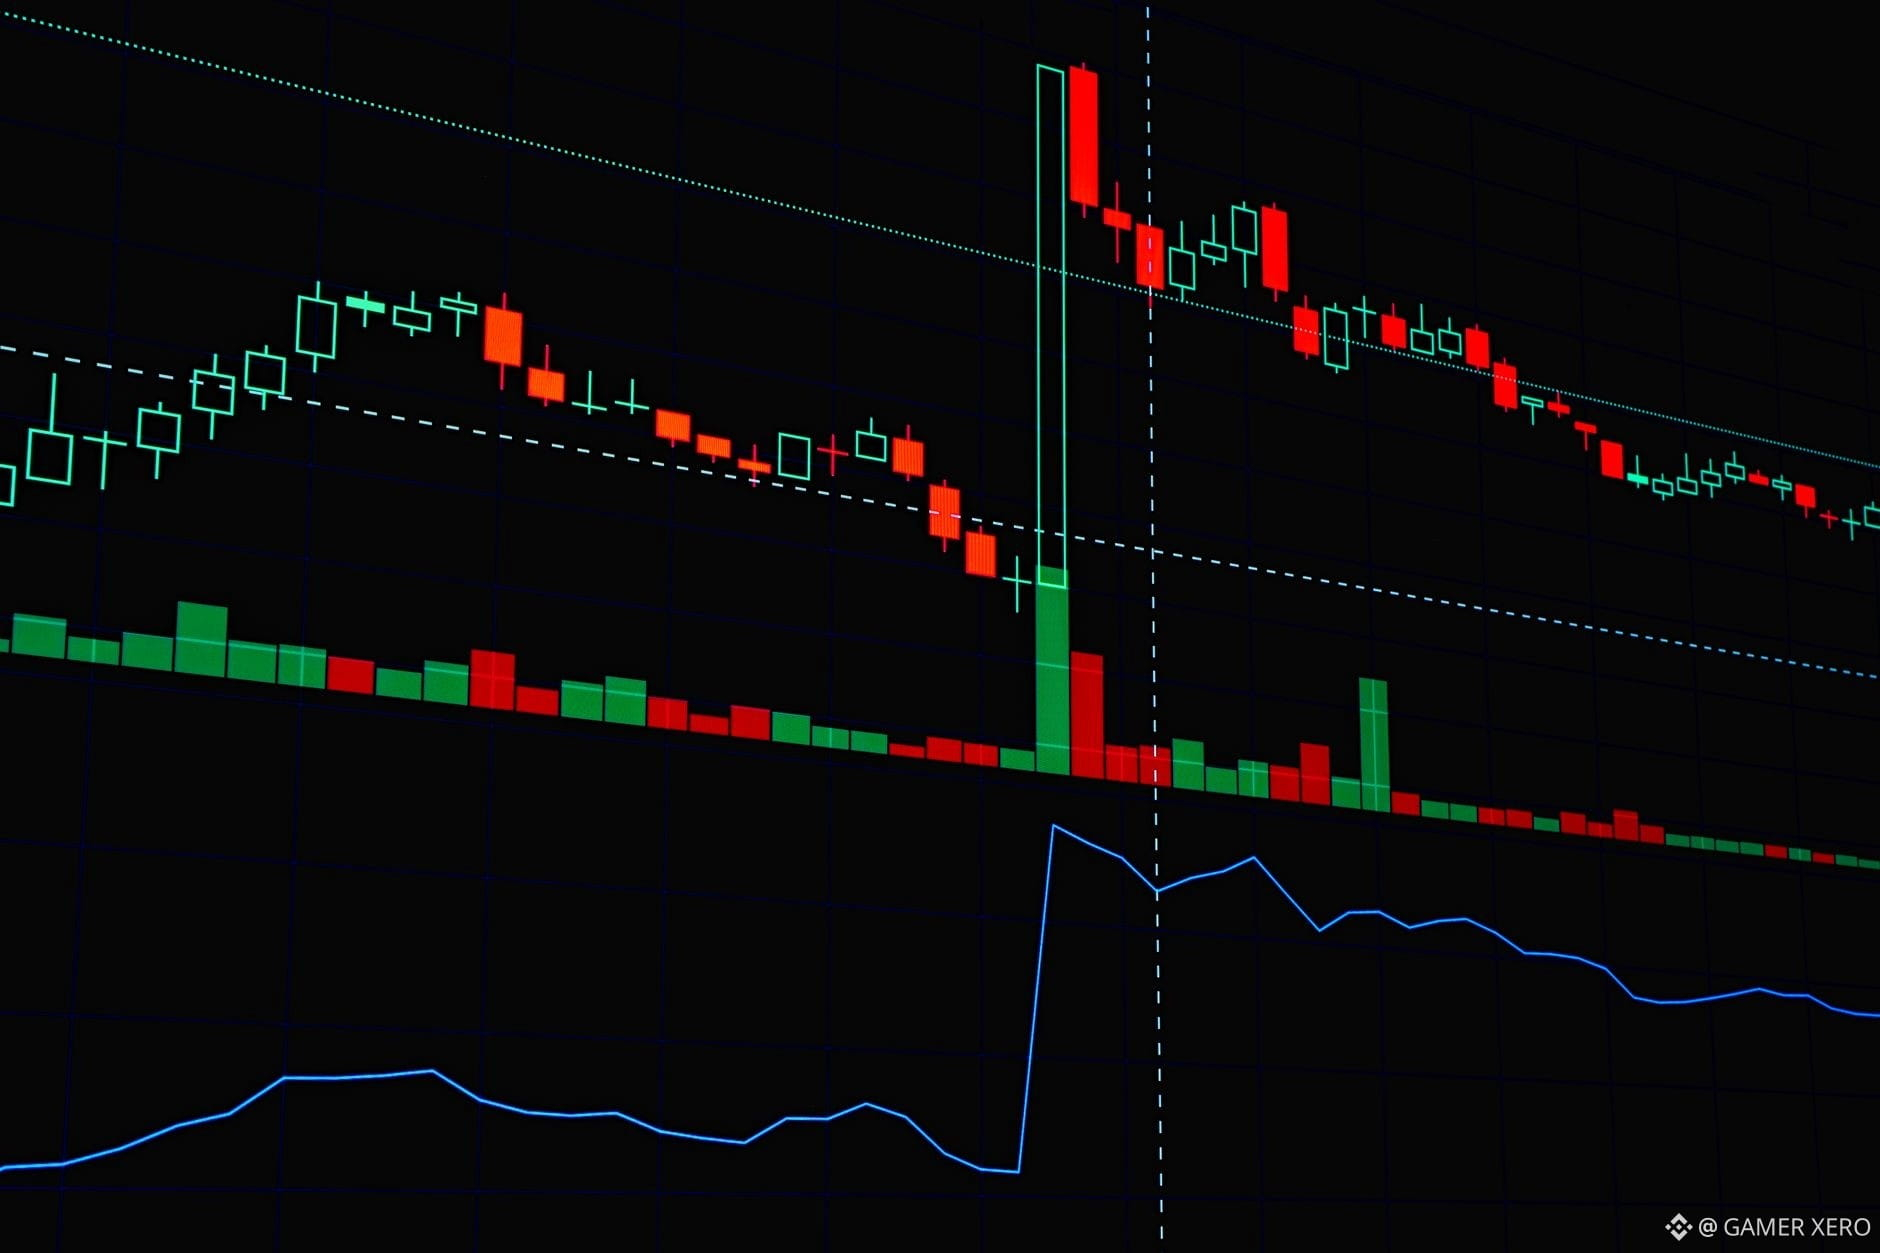
$BTC is trading just under $79,900, barely moving beyond its 24‑hour band of $79,233‑$80,560. That tight range is a perfect classroom for risk control. I start every trade by defining how much of my account I’m willing to lose if the market turns – usually 1 % of total capital. With a $10,000 portfolio that’s $100. If I place a stop‑loss $300 below entry, the maximum loss per coin is $300 × quantity = $100, so the position size works out to 0.33 BTC. That tiny stake keeps my account safe while still letting me stay in the game when the price resumes its swing.
Emotional discipline is the other half. When price nudges the lower edge of the band, I resist the urge to add more just because the market feels “cheap.” Instead, I wait for the price to respect a clear support level or for a candle to close above the midpoint before re‑evaluating. This prevents the common mistake of doubling‑down into a losing trade and protects the capital needed for future setups.
Do you use a fixed‑percentage rule for stop‑loss sizing, or do you adapt it to volatility?
#CryptoRisk #TradingTips #CapitalPreservation #GAMERXERO
Emotional discipline is the other half. When price nudges the lower edge of the band, I resist the urge to add more just because the market feels “cheap.” Instead, I wait for the price to respect a clear support level or for a candle to close above the midpoint before re‑evaluating. This prevents the common mistake of doubling‑down into a losing trade and protects the capital needed for future setups.
Do you use a fixed‑percentage rule for stop‑loss sizing, or do you adapt it to volatility?
#CryptoRisk #TradingTips #CapitalPreservation #GAMERXERO
$BTC is holding just under $79,200, snug between a low of $78,680 and a high of $80,560 in the last 24 hours. The price has nudged the lower half of that band, which suggests sellers are exhausted while buyers are testing the next resistance around $80,000. On the flip side, the 24‑hour low at $78,680 still acts as a solid floor; a breach there could reopen a broader down‑trend toward the $77,000 zone that held earlier in the week.
On the other side of the market, $ETH is barely above $2,490, trading in a narrow $2466‑$2536 range. The modest 0.16 % uptick hints at a balancing act between short‑term profit‑taking and the pull of the next resistance near $2,530. With both majors stuck in tight corridors, volume has shifted toward stablecoins and alt‑coins that offer higher yields, reinforcing a risk‑off sentiment despite the overall market staying relatively flat.
What do you think is the most reliable signal to watch for a breakout—price action at the $79,200 level for $BTC , or a decisive move above $2,530 for $ETH ?
#CryptoAnalysis #Binance #MarketStructure #GAMERXERO
On the other side of the market, $ETH is barely above $2,490, trading in a narrow $2466‑$2536 range. The modest 0.16 % uptick hints at a balancing act between short‑term profit‑taking and the pull of the next resistance near $2,530. With both majors stuck in tight corridors, volume has shifted toward stablecoins and alt‑coins that offer higher yields, reinforcing a risk‑off sentiment despite the overall market staying relatively flat.
What do you think is the most reliable signal to watch for a breakout—price action at the $79,200 level for $BTC , or a decisive move above $2,530 for $ETH ?
#CryptoAnalysis #Binance #MarketStructure #GAMERXERO
I’ve been watching $BTC linger around $78,830 while the 24‑hour band stays tight between $78,680 and $80,560. The price has slipped a bit today, but the range‑bound action feels more like a pause than a breakdown. On the flip side, $ETH is sitting near $2,471, slipping just under its recent high of $2,536. Both assets are showing modest negative momentum, yet the lows are holding close to the day’s floor, suggesting that sellers have exhausted some of their pressure.
What I find useful in these moments is looking at the order‑book depth on Binance Spot. When the bid side starts to thicken near the lower half of the range, it often signals that the market is absorbing the sell‑side flow and could be ready for a small rebound. Conversely, a thin bid wall can hint at a longer consolidation stretch.
Given the current tight bands, do you prefer tightening your stop‑losses tighter to protect capital, or do you hold a wider buffer hoping for a breakout? Share your risk‑management tweaks that work best in range‑bound markets.
#CryptoTrading #Binance #MarketStructure #GAMERXERO
What I find useful in these moments is looking at the order‑book depth on Binance Spot. When the bid side starts to thicken near the lower half of the range, it often signals that the market is absorbing the sell‑side flow and could be ready for a small rebound. Conversely, a thin bid wall can hint at a longer consolidation stretch.
Given the current tight bands, do you prefer tightening your stop‑losses tighter to protect capital, or do you hold a wider buffer hoping for a breakout? Share your risk‑management tweaks that work best in range‑bound markets.
#CryptoTrading #Binance #MarketStructure #GAMERXERO
$BTC is still perched just under $79,200, barely nudging above the midpoint of its 24‑hour band ($79,233‑$80,560). The candle’s movement has been flat‑lined, with a 0.44 % dip and a high‑low spread of roughly $1,600. That tight range suggests liquidity is holding at the low‑mid zone, and many traders are eyeing the $79,000‑$79,300 support cluster as a potential floor before any breakout attempt. On the flip side, the $80,000‑$80,300 resistance area remains the next hurdle if buying pressure resurfaces.
Both pairs are demonstrating low volatility, making range‑bound strategies like tight limit orders more appealing than chasing momentum. With the market’s patience being tested, do you think the next move will come from a breakout above the resistance zones or a deeper pullback into the support levels?
#CryptoAnalysis #Binance #RangeTrading #GAMERXERO
Both pairs are demonstrating low volatility, making range‑bound strategies like tight limit orders more appealing than chasing momentum. With the market’s patience being tested, do you think the next move will come from a breakout above the resistance zones or a deeper pullback into the support levels?
#CryptoAnalysis #Binance #RangeTrading #GAMERXERO
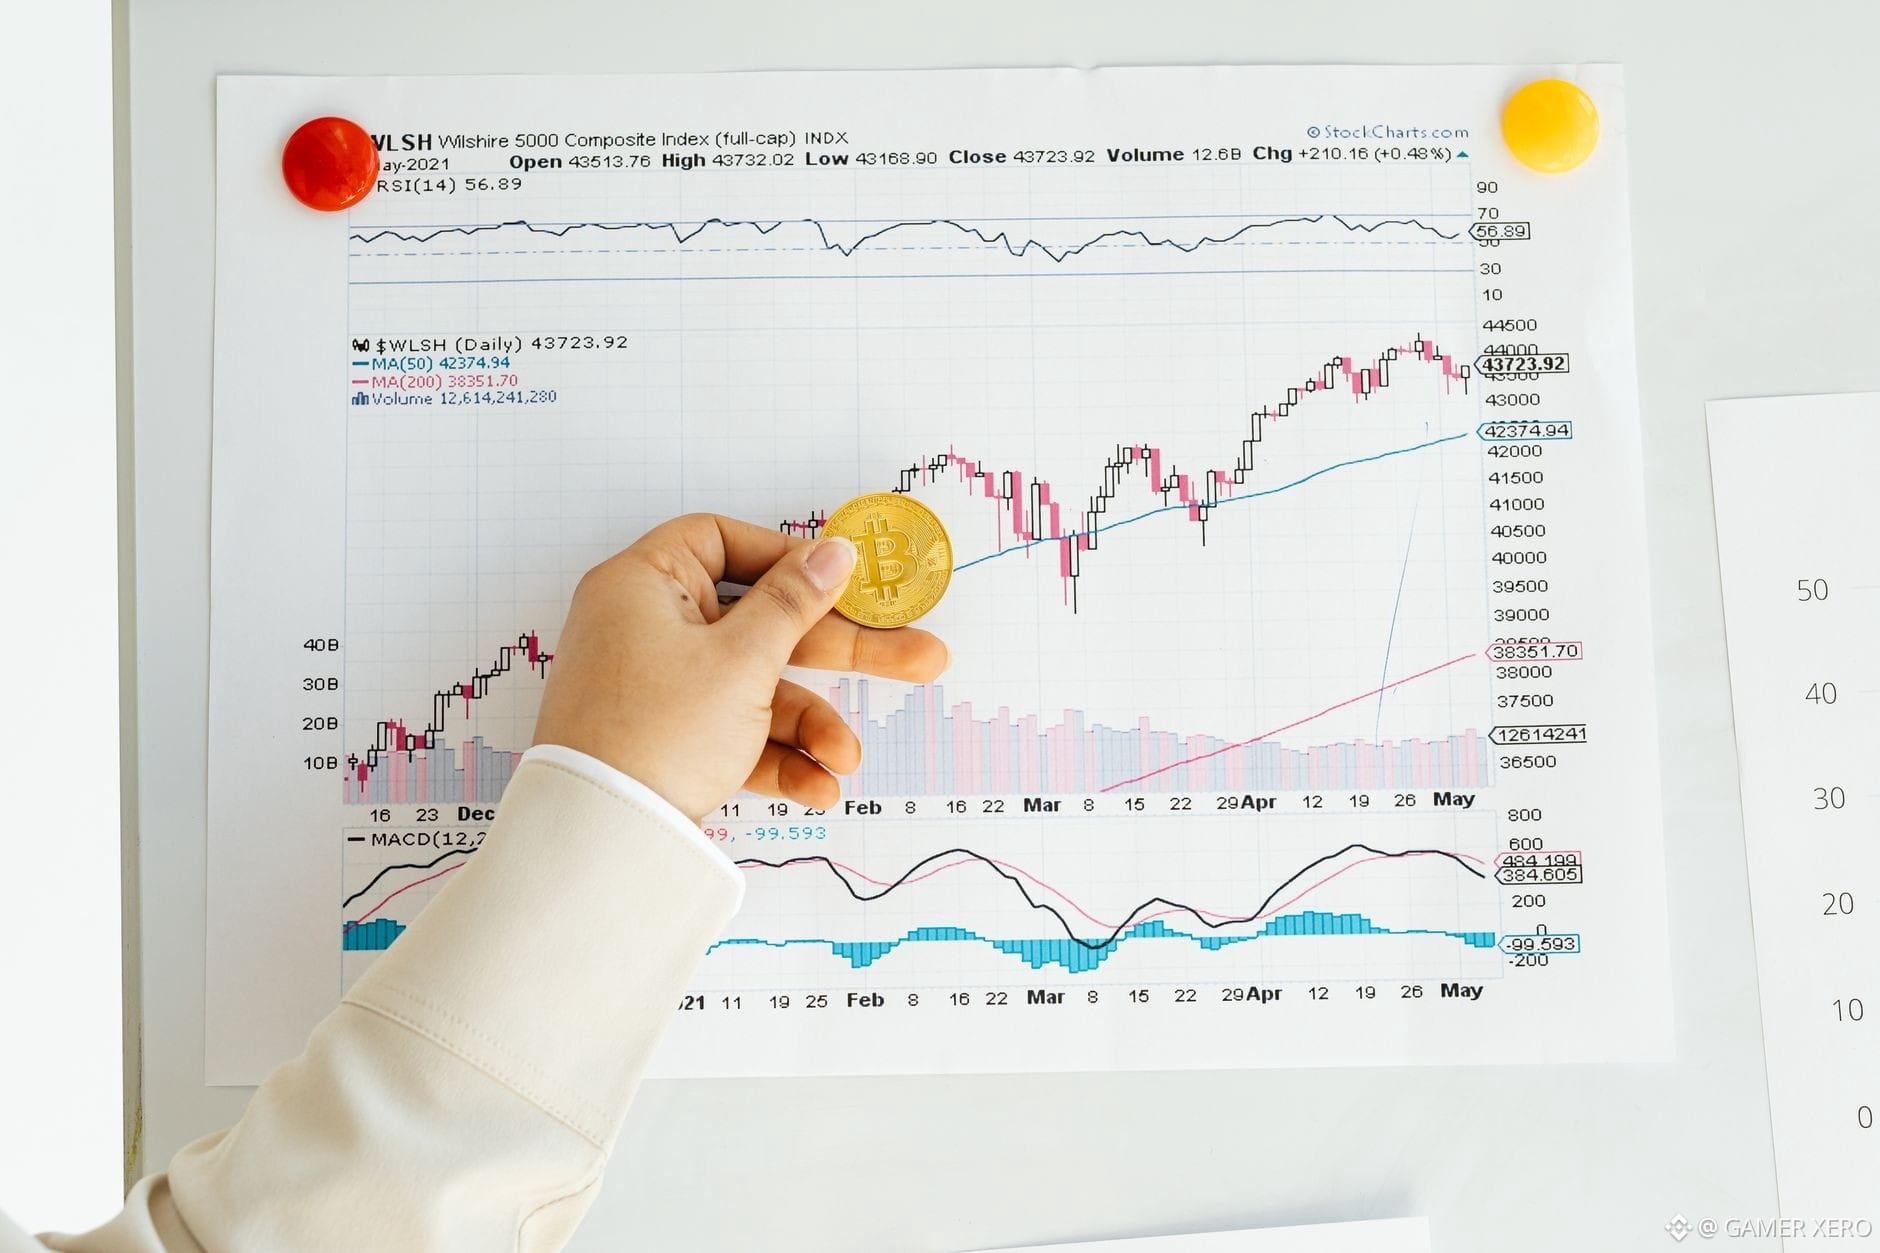
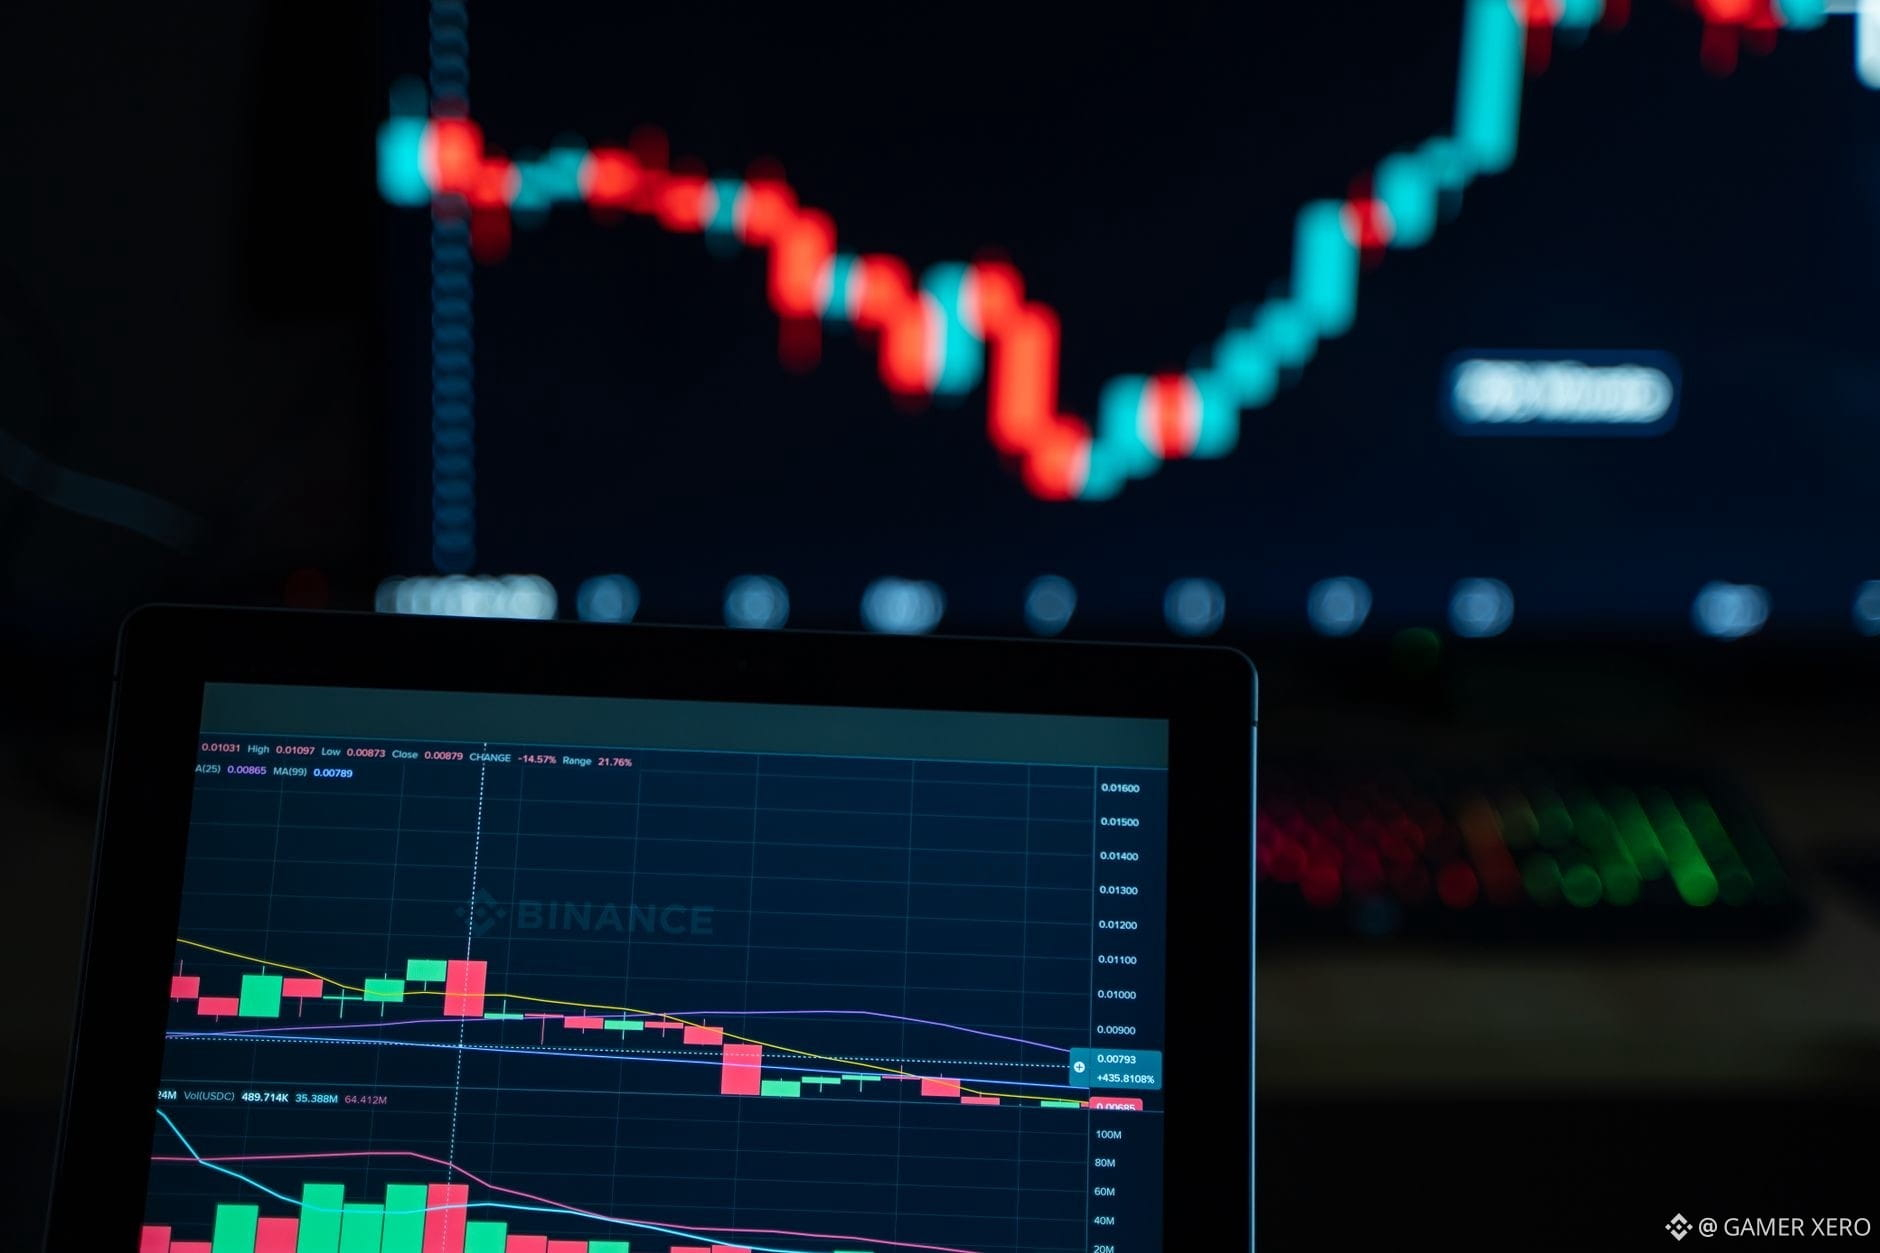
USDC’s week‑long surge of $584 million is more than a headline – it’s a signal that stablecoin liquidity is tightening around a few dominant players. On Binance, $USDC continues to anchor a growing share of spot‑margin collateral, meaning traders can lock in lower‑cost funding without chasing multiple peg tokens. The effect ripples into the broader market: when a stablecoin’s supply expands quickly, the underlying fiat inflow often supports higher‑volume order books, especially for the flagship pair $BTC /USDC that’s hovering just under $79,700. This extra depth can dampen short‑term slippage, making it easier to execute larger positions without moving the market.
At the same time, the $USDC influx puts pressure on other stablecoins to prove utility or competitive yields, which could reshape fee structures on Binance’s lending platform. For traders who rely on stablecoins for hedging or arbitrage, the growing dominance of USDC may mean tighter spreads but also a need to monitor reserve ratios and on‑chain activity for signs of stress.
How are you adjusting your stablecoin strategy as USDC tightens its grip on the market?
#CryptoInsights #Stablecoins #Binance #GAMERXERO
At the same time, the $USDC influx puts pressure on other stablecoins to prove utility or competitive yields, which could reshape fee structures on Binance’s lending platform. For traders who rely on stablecoins for hedging or arbitrage, the growing dominance of USDC may mean tighter spreads but also a need to monitor reserve ratios and on‑chain activity for signs of stress.
How are you adjusting your stablecoin strategy as USDC tightens its grip on the market?
#CryptoInsights #Stablecoins #Binance #GAMERXERO
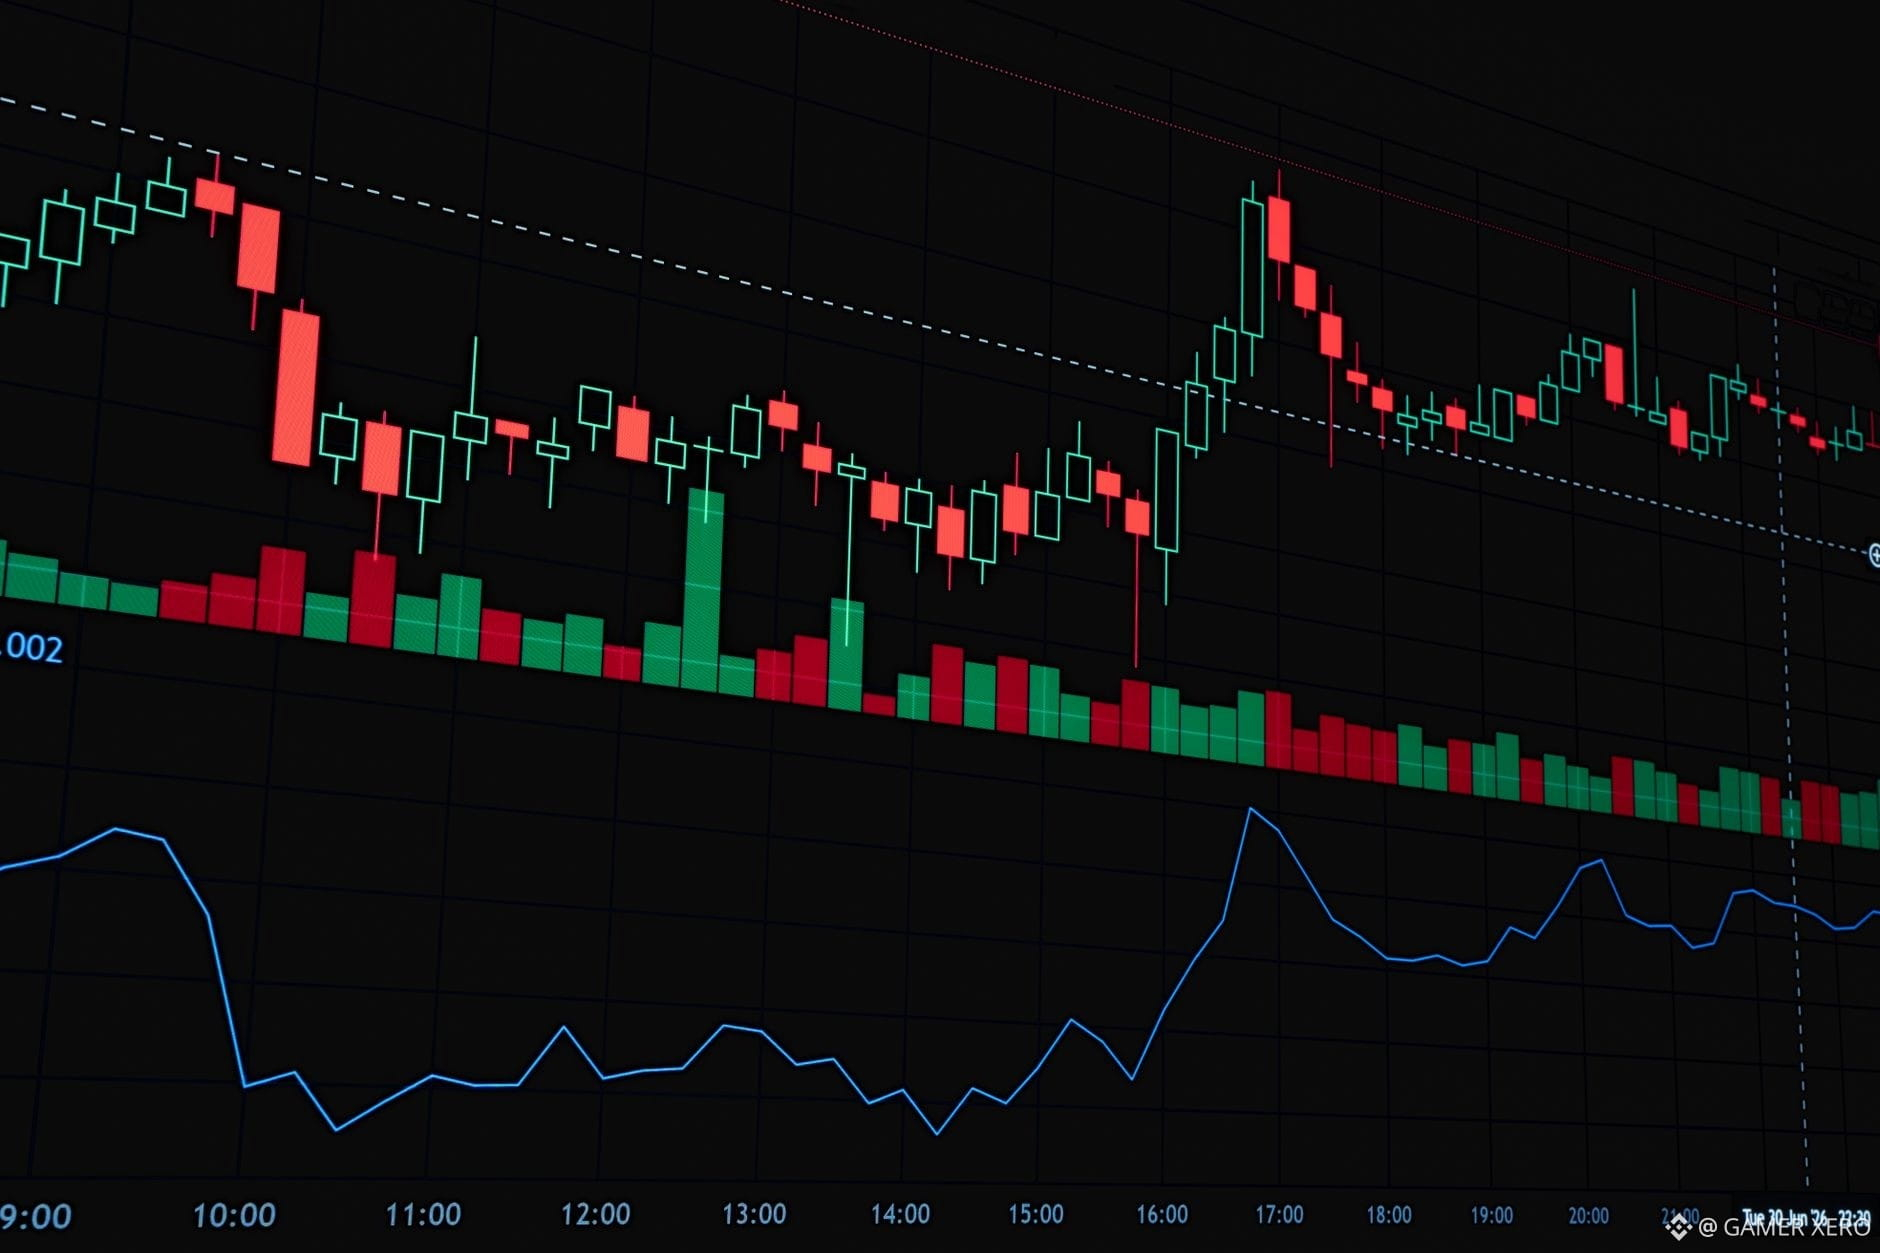
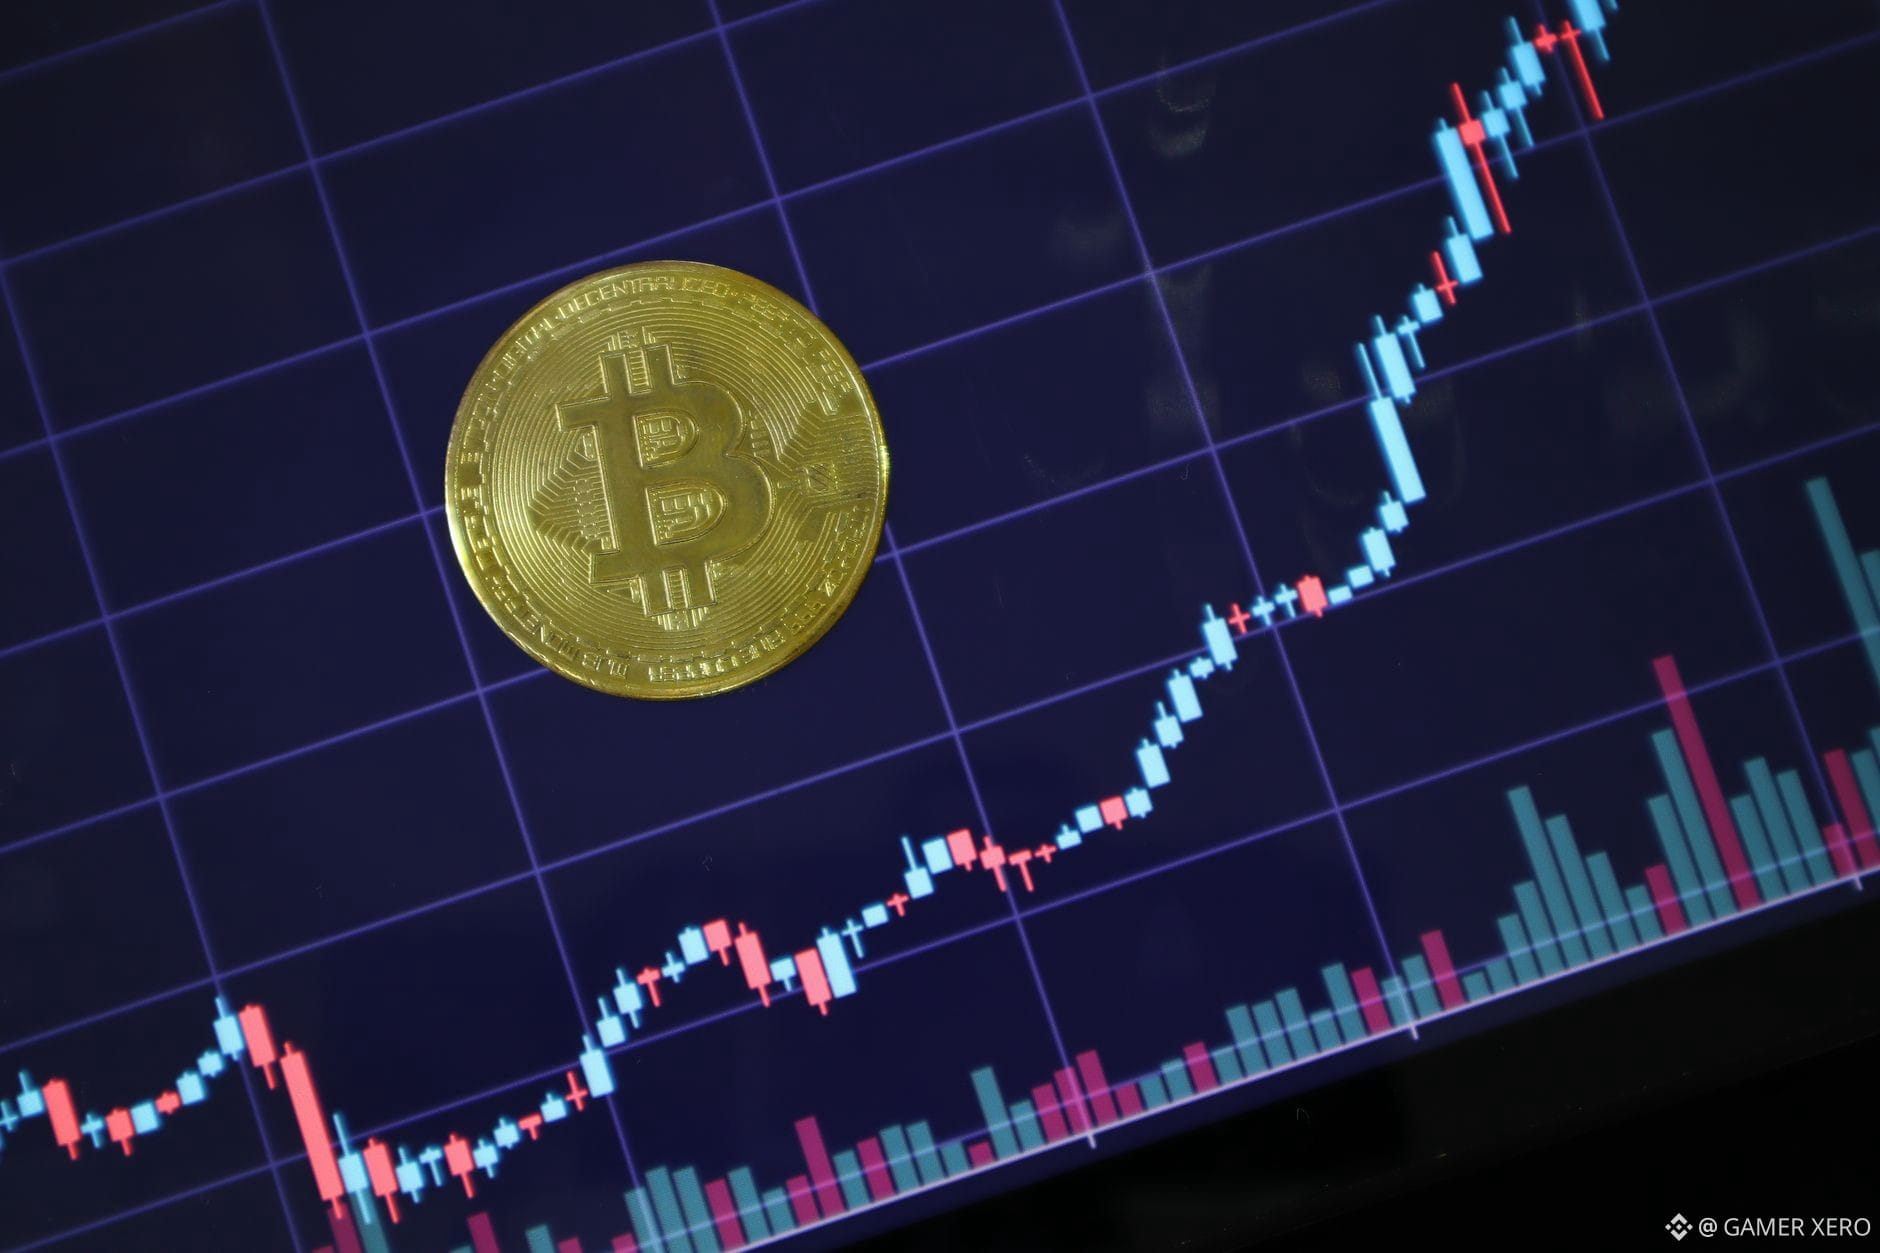
I watched $BTC wobble around $79,420 all morning, then dip a few hundred points before clawing back up. The swing felt harmless, but the moment the price slipped past my entry I felt that familiar sting: “I’m not letting this trade win.” I doubled my position, added a tighter stop, and chased the next green candle. Within minutes the market turned flat again, and the extra exposure sat in the red, amplifying the stress.
Revenge trading isn’t about the numbers; it’s a subconscious need to “win back” a loss. The brain treats the loss as a personal slight, so you chase the next move hoping to erase the feeling. The problem is that each added trade increases position size, risk, and emotional volatility, which often leads to a bigger loss than the original one.
What mental cue has helped you break the revenge‑trade cycle?
#TradingPsychology #CryptoMindset #RiskManagement #GAMERXERO
Revenge trading isn’t about the numbers; it’s a subconscious need to “win back” a loss. The brain treats the loss as a personal slight, so you chase the next move hoping to erase the feeling. The problem is that each added trade increases position size, risk, and emotional volatility, which often leads to a bigger loss than the original one.
What mental cue has helped you break the revenge‑trade cycle?
#TradingPsychology #CryptoMindset #RiskManagement #GAMERXERO
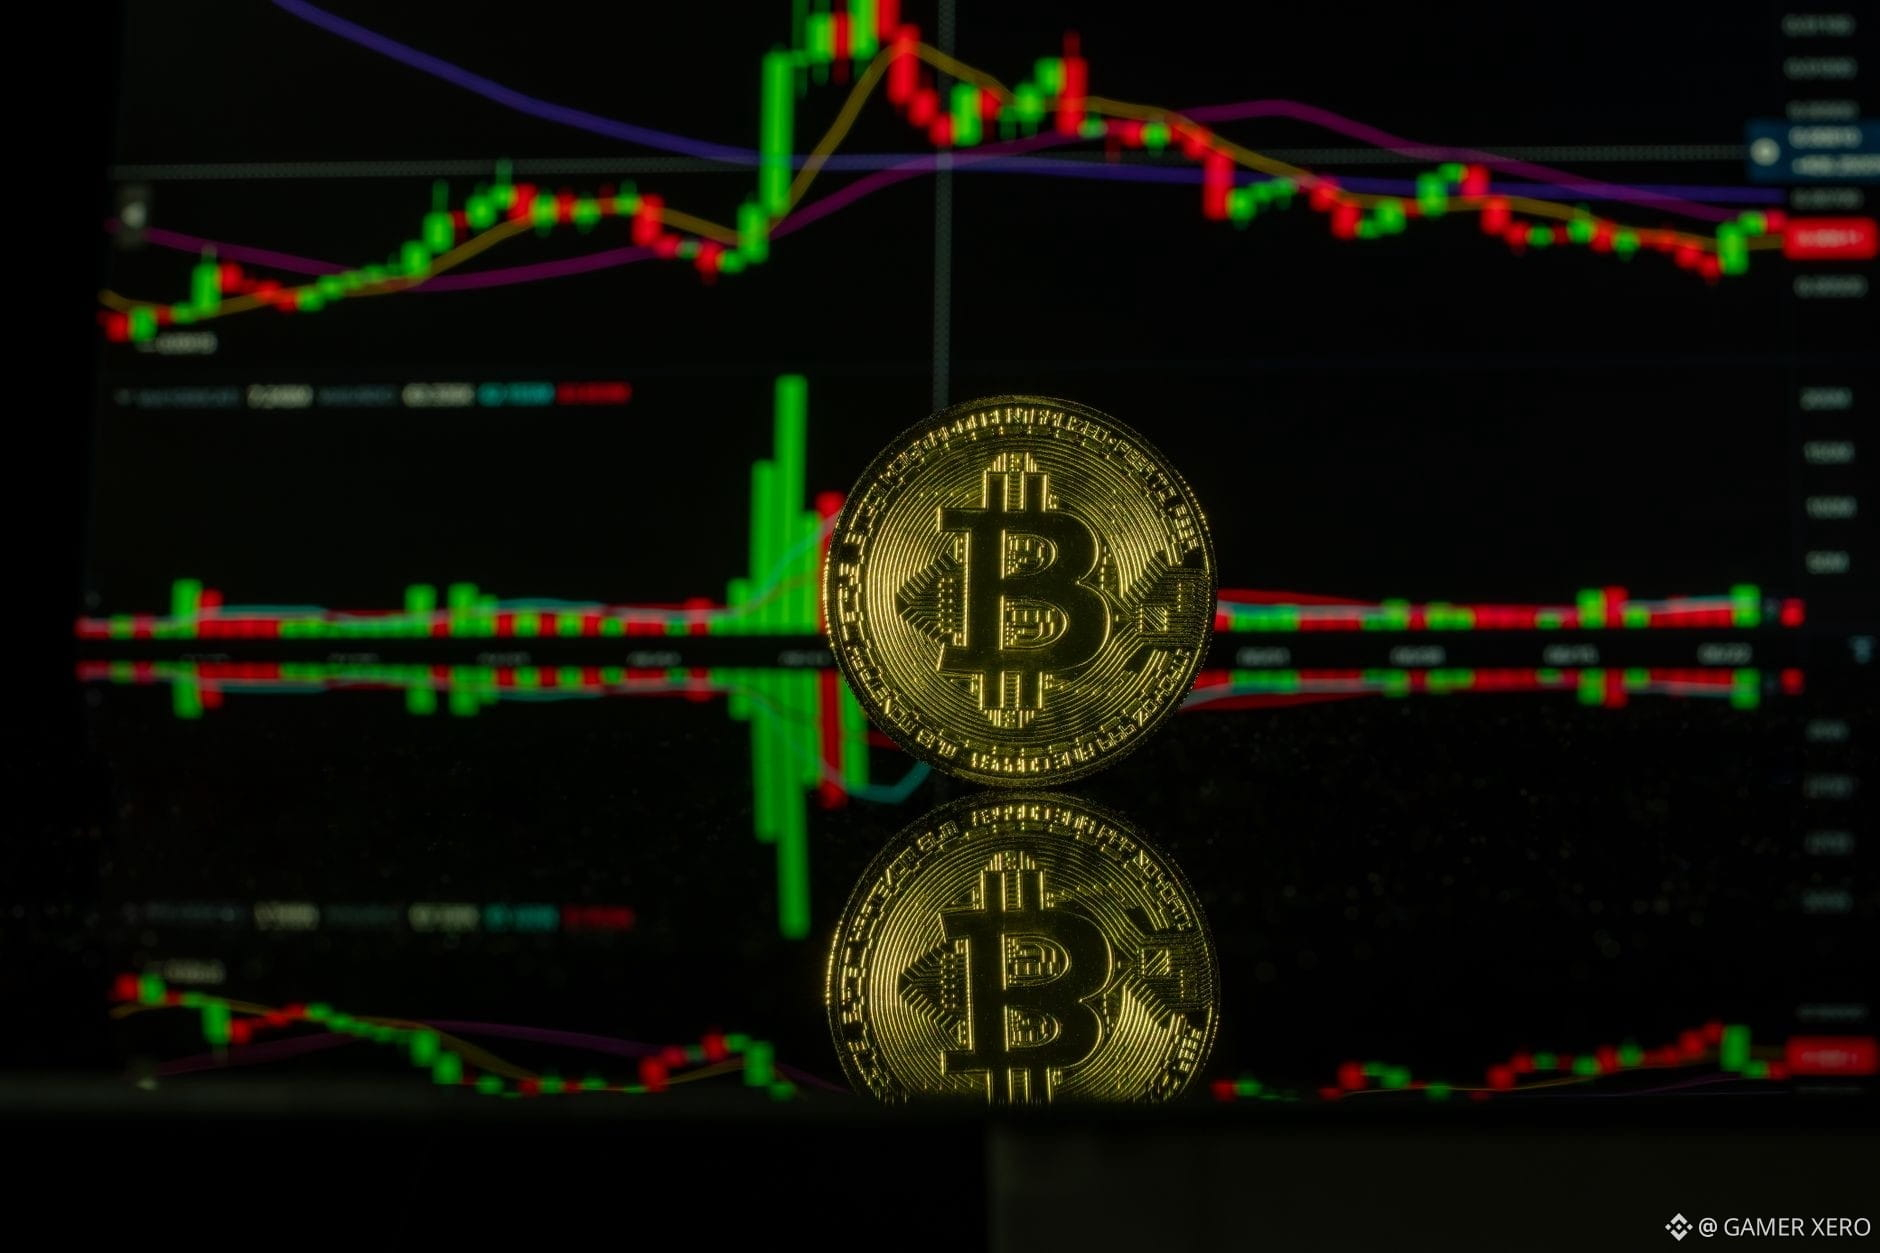
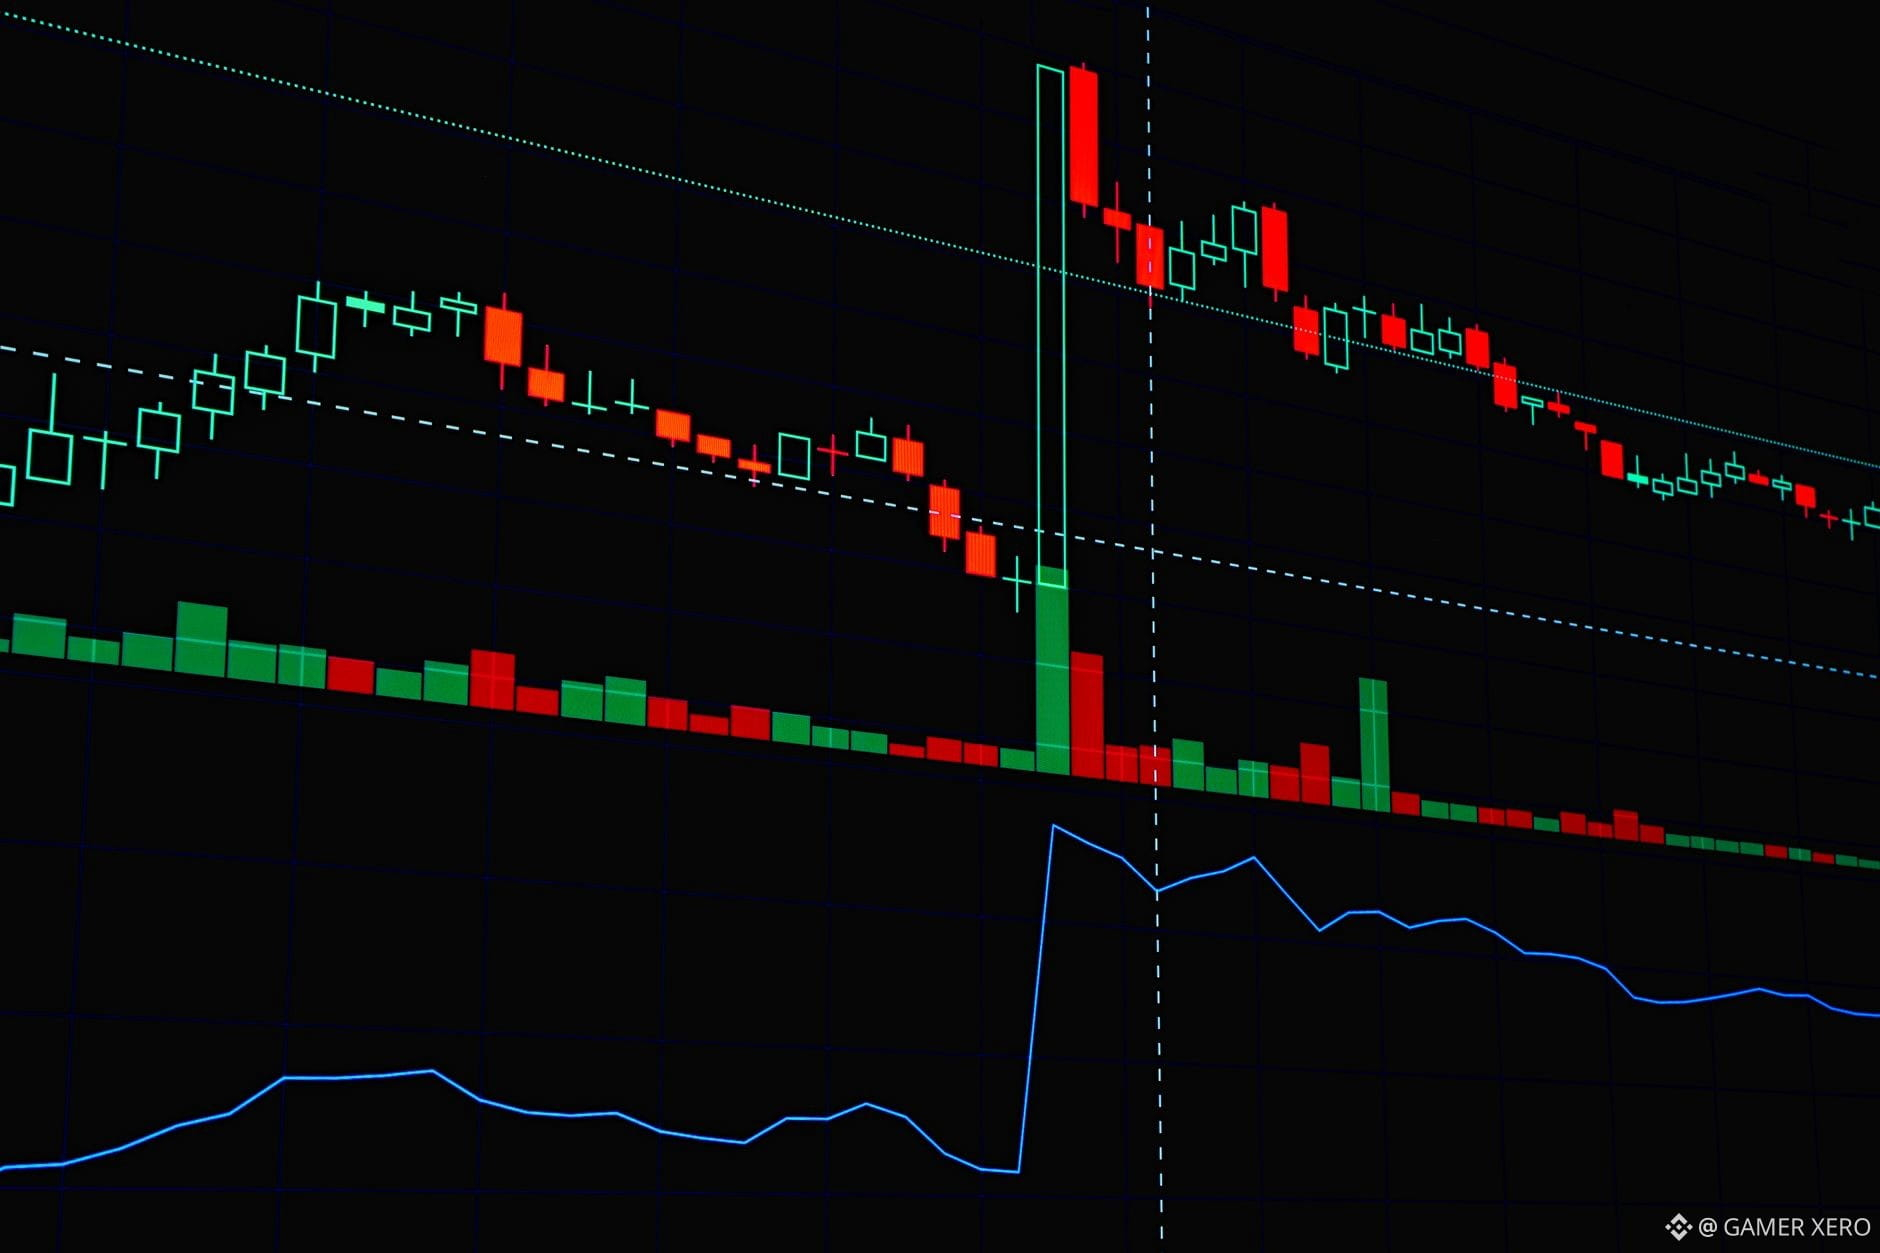
Seeing $BTC hug the $79,200‑$80,500 band today reminded me why I keep a hard cap on any single crypto’s weight. I peg the max exposure for $BTC at 20 % of my total equity; the same rule applies to $ETH . That way, even if one asset drops 30 % the portfolio‑wide hit stays around 6 %, which I can tolerate without touching the next drawdown tier.
Diversification across non‑correlated tokens and a stable‑coin buffer (e.g., 15 % in USDC) adds a cushion when the broader market slides. When I hit a 10 % portfolio drawdown, I use the simple recovery factor = 1 / (1 – drawdown). A 10 % loss requires a 11.1 % gain to break even, so I scale back position sizes until the risk‑to‑reward ratio improves, then re‑enter with a tighter volatility stop.
For volatility‑adjusted sizing, I look at the 24 h high/low range. $BTC ’s swing of about $1,560 translates to roughly 2 % of its price, while $ETH ’s $76 range is just over 3 %. I shrink my target allocation by the same percentage, keeping the absolute risk per trade under 1 % of the portfolio.
How do you set your volatility‑adjusted position size when the market is range‑bound?
#RiskManagement #CryptoPortfolio #GAMERXERO #BinanceSquare
Diversification across non‑correlated tokens and a stable‑coin buffer (e.g., 15 % in USDC) adds a cushion when the broader market slides. When I hit a 10 % portfolio drawdown, I use the simple recovery factor = 1 / (1 – drawdown). A 10 % loss requires a 11.1 % gain to break even, so I scale back position sizes until the risk‑to‑reward ratio improves, then re‑enter with a tighter volatility stop.
For volatility‑adjusted sizing, I look at the 24 h high/low range. $BTC ’s swing of about $1,560 translates to roughly 2 % of its price, while $ETH ’s $76 range is just over 3 %. I shrink my target allocation by the same percentage, keeping the absolute risk per trade under 1 % of the portfolio.
How do you set your volatility‑adjusted position size when the market is range‑bound?
#RiskManagement #CryptoPortfolio #GAMERXERO #BinanceSquare
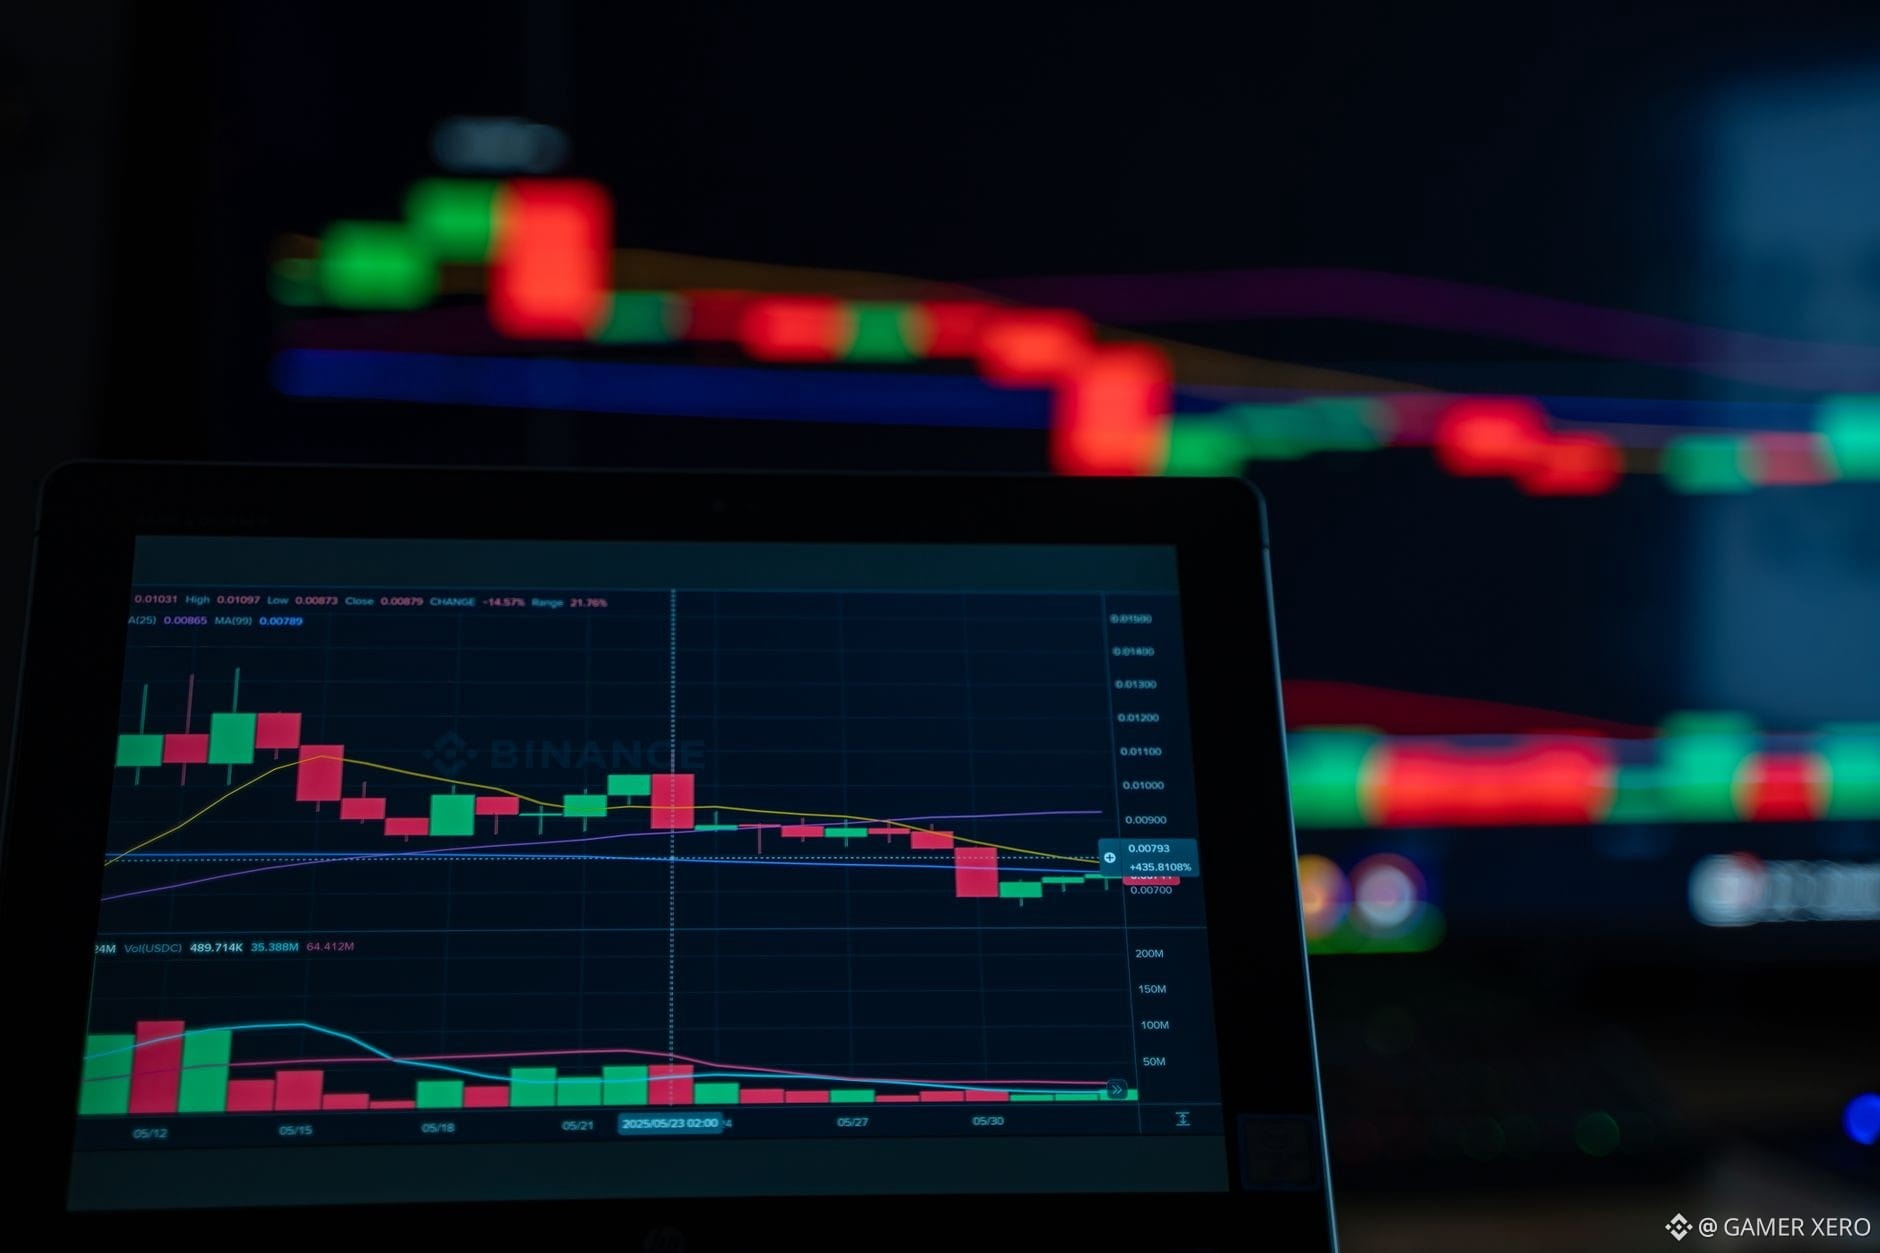
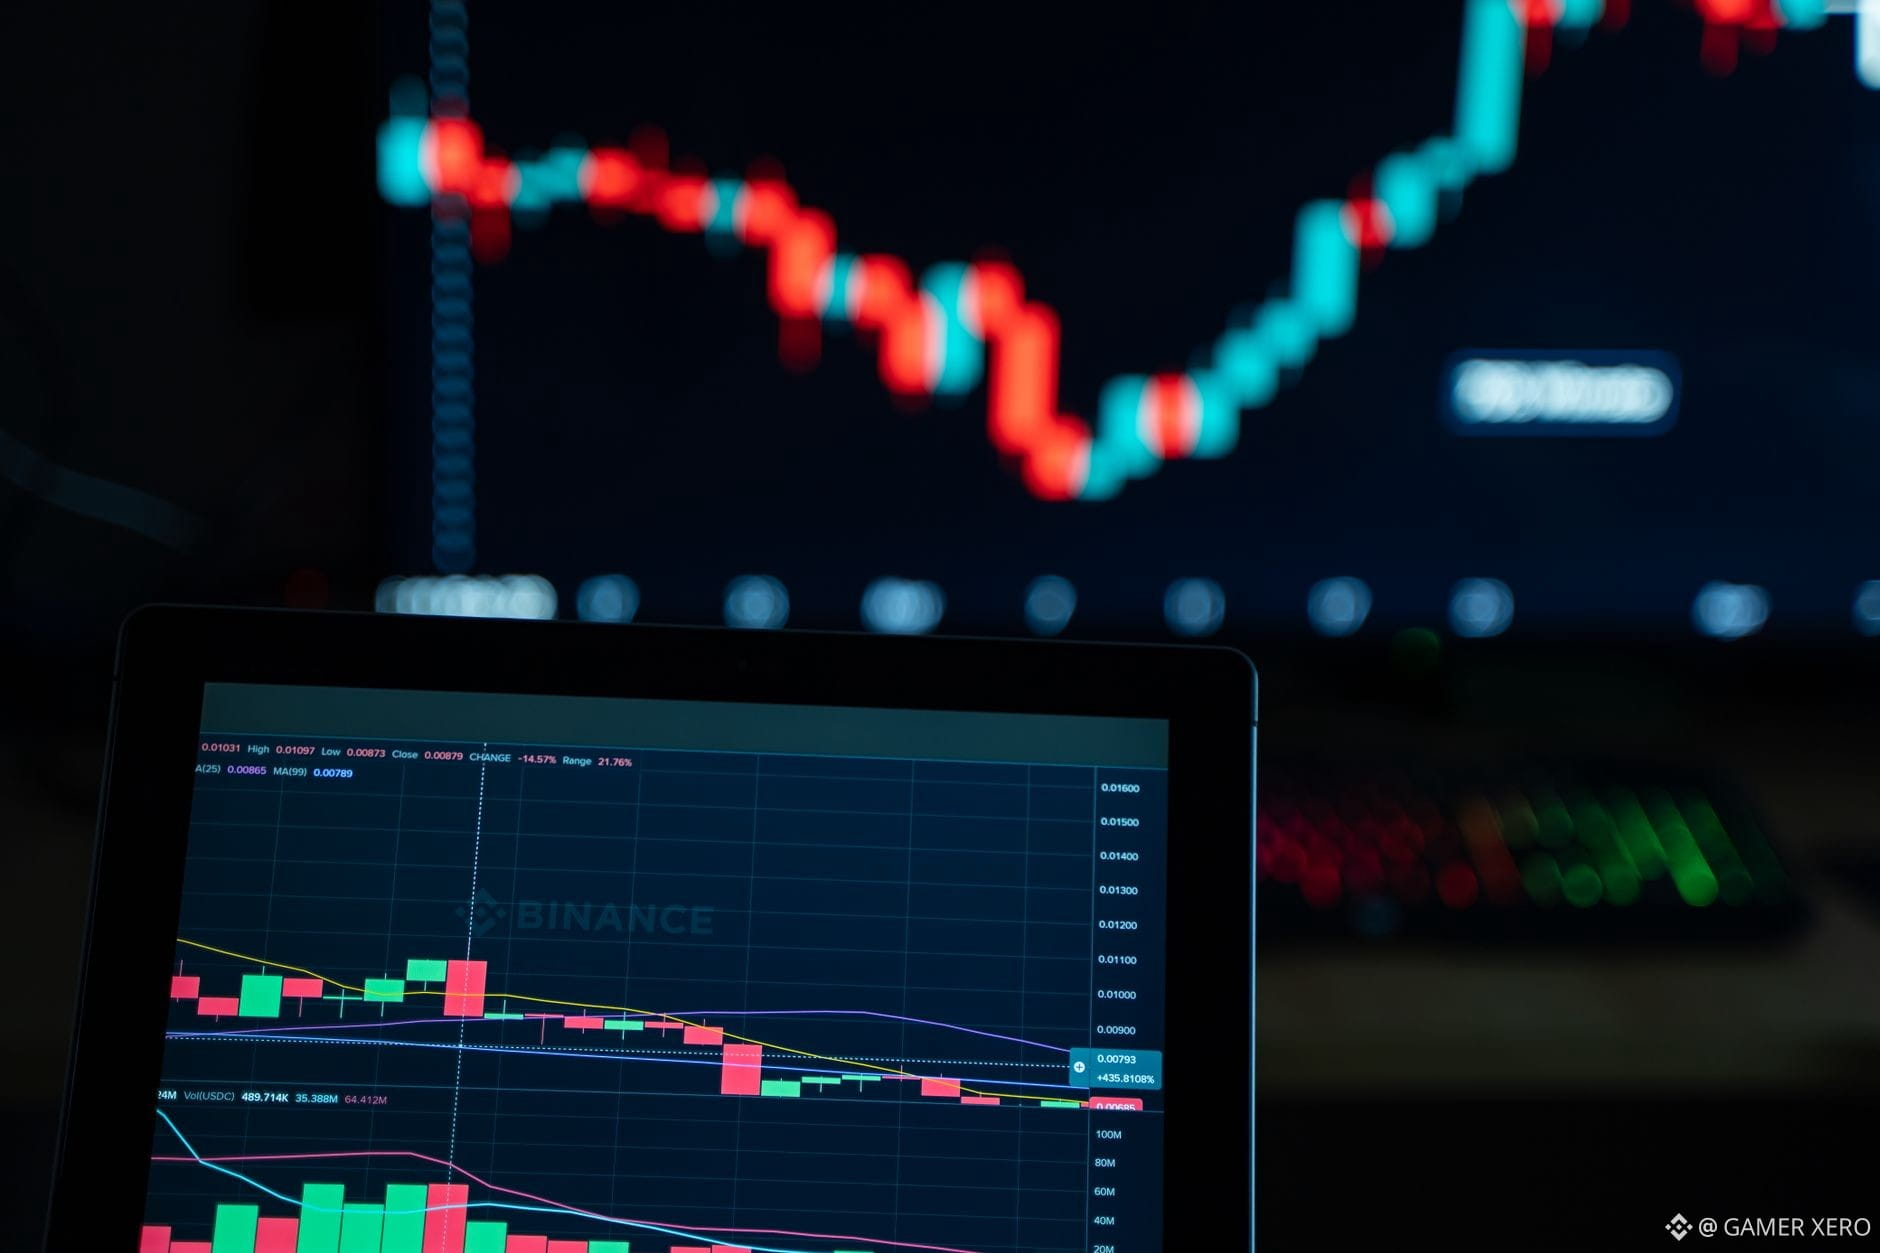
Seeing $BTC sit at $79,437 while the 24‑hour band narrows between $79,001 and $80,560 tells me the market’s patience is being tested. One way to read that patience is the order‑book imbalance metric. Binance Spot shows the total bid volume versus ask volume at each price level; a simple imbalance = (Bid – Ask) / (Bid + Ask). When the value is positive, buying pressure dominates; a negative reading signals sellers in control.
Right now the top 5 % of the book for $BTC has roughly $12 M on the bid side and $10 M on the ask side, giving an imbalance of +0.09. That modest bullish tilt aligns with the price hovering just above the lower half of its range. If the imbalance flips to –0.1, you’d expect the price to drift toward the lower bound, prompting tighter risk controls.
Applying the same lens to $ETH , the imbalance sits near zero, reflecting its flat 24‑hour movement. Monitoring these shifts in real time can help you decide when to tighten stops or add to a position without chasing price.
How do you incorporate order‑book imbalance into your own routine? #CryptoEducation #BinanceTips #OrderBook #GAMERXERO
Right now the top 5 % of the book for $BTC has roughly $12 M on the bid side and $10 M on the ask side, giving an imbalance of +0.09. That modest bullish tilt aligns with the price hovering just above the lower half of its range. If the imbalance flips to –0.1, you’d expect the price to drift toward the lower bound, prompting tighter risk controls.
Applying the same lens to $ETH , the imbalance sits near zero, reflecting its flat 24‑hour movement. Monitoring these shifts in real time can help you decide when to tighten stops or add to a position without chasing price.
How do you incorporate order‑book imbalance into your own routine? #CryptoEducation #BinanceTips #OrderBook #GAMERXERO
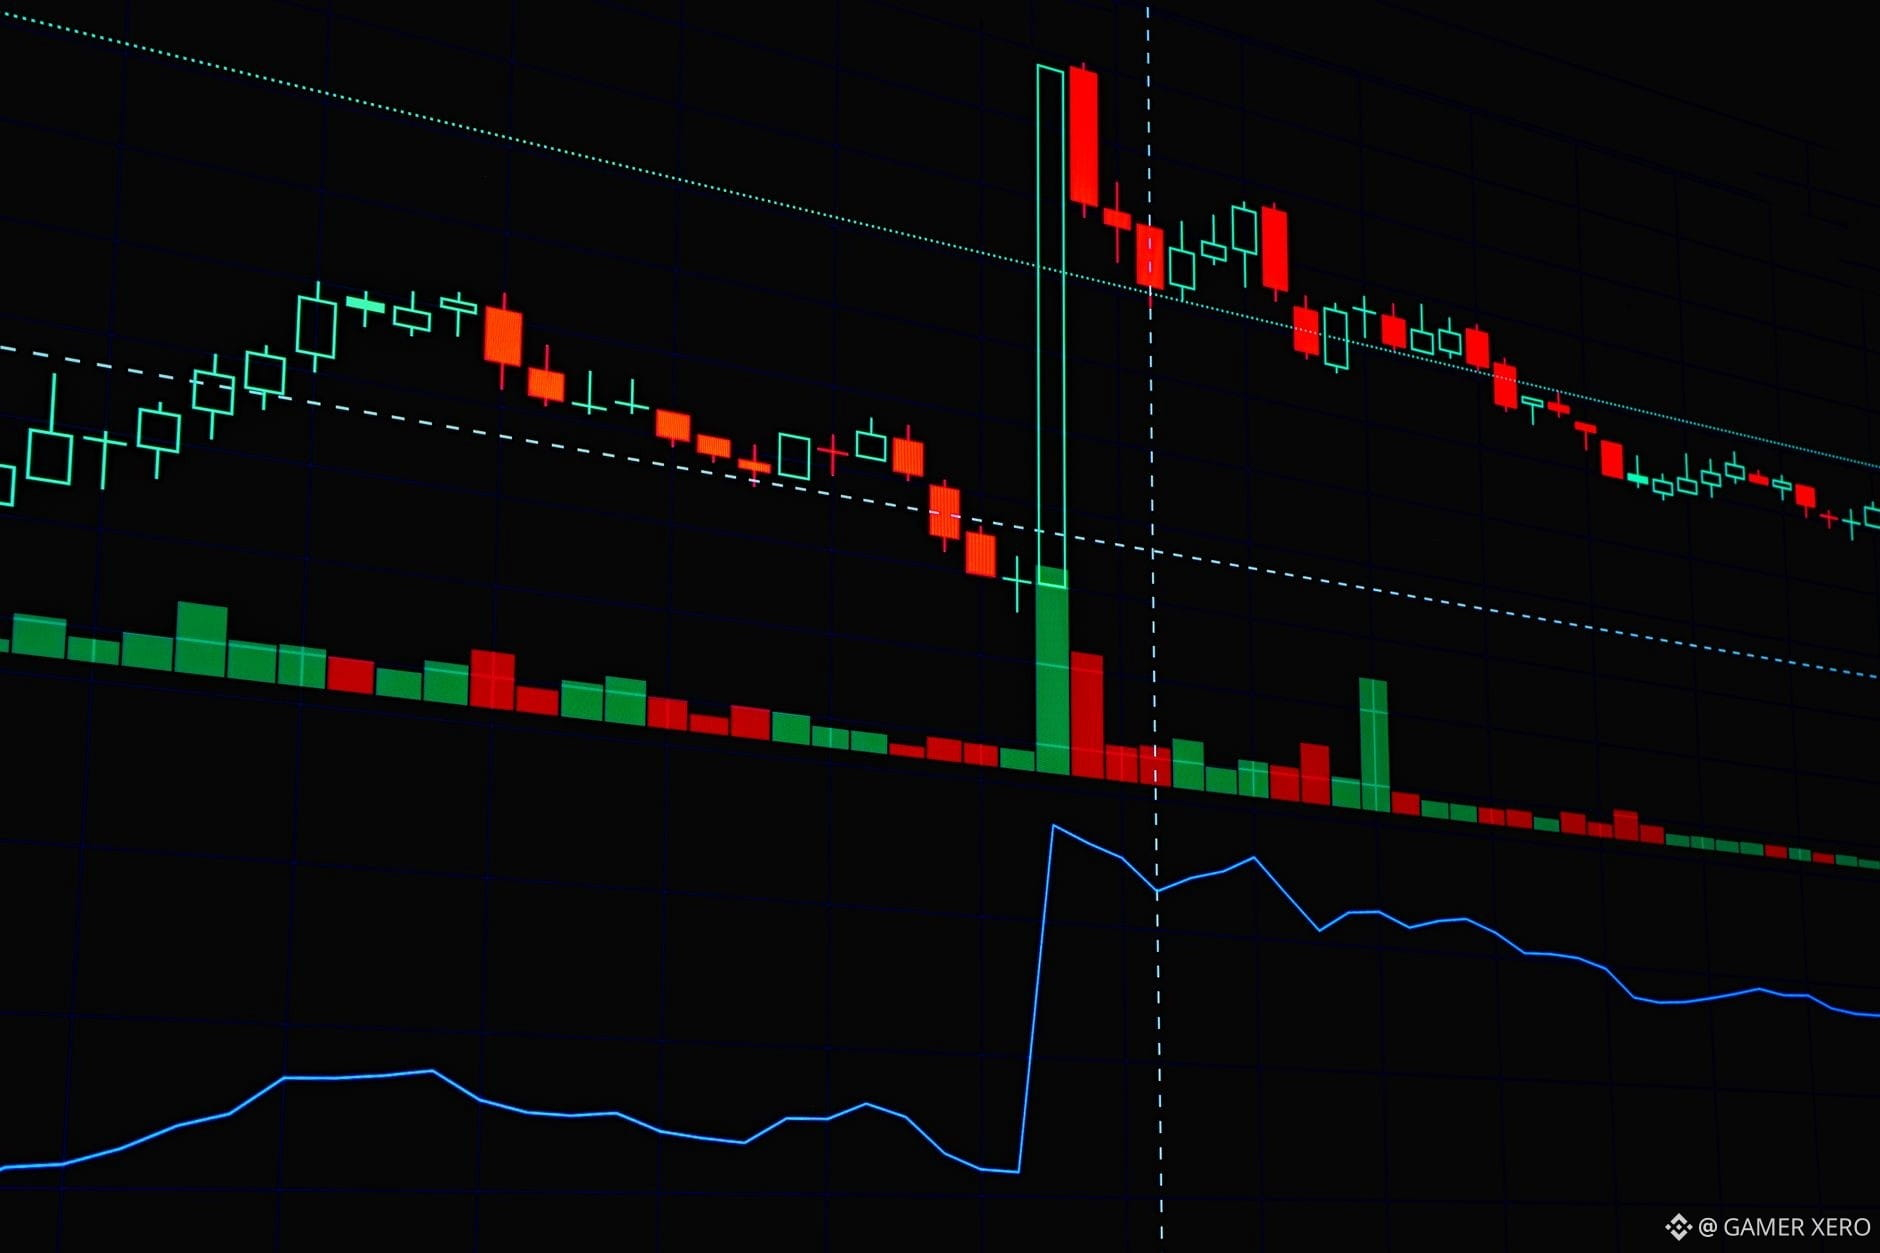
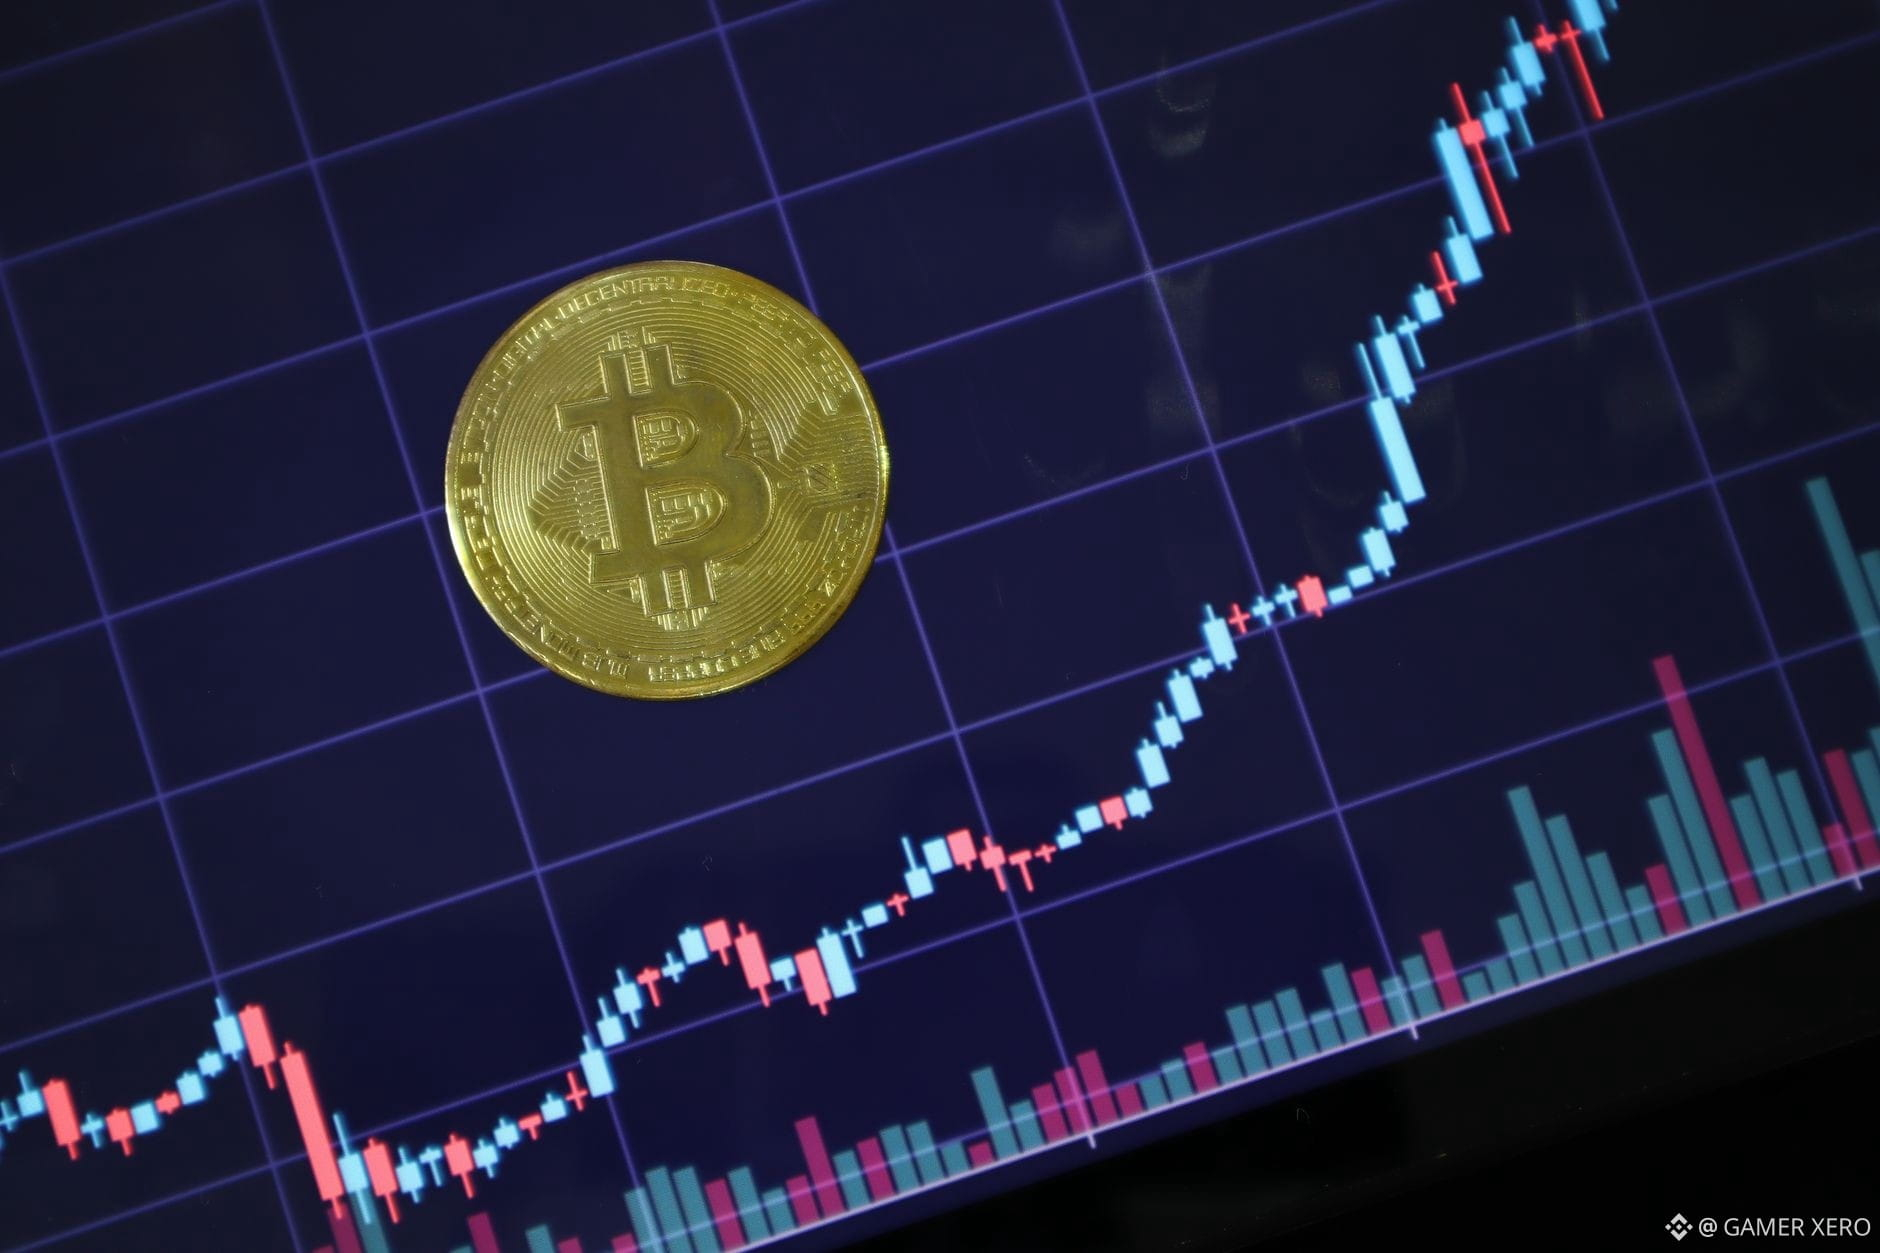
SOL’s 24‑hour range has tightened dramatically, slipping from a high of $107.36 to a low barely above $104.75. The current quote sits at $104.78, just a hair above the recent trough, indicating sellers have largely exhausted their pressure. Volume on Binance Spot has also shown a modest dip, suggesting fewer aggressive hands are pushing the market lower. When an altcoin’s price band compresses like this, liquidity tends to pool around the midpoint, creating a “liquidity well” where market makers place balanced orders. Traders who watch order‑book depth often see tighter spreads and can use limit orders near the midpoint to capture small, consistent fills without chasing volatility.
If you’re tracking the next possible catalyst—whether it’s a macro data release or a protocol update—how do you adjust your order‑book strategy to stay effective in a narrow‑range market?
#CryptoAnalysis #Altcoins #Liquidity #GAMERXERO
If you’re tracking the next possible catalyst—whether it’s a macro data release or a protocol update—how do you adjust your order‑book strategy to stay effective in a narrow‑range market?
#CryptoAnalysis #Altcoins #Liquidity #GAMERXERO


The UAE’s new VAT framework now treats crypto‑based payments like any other taxable service, meaning merchants must calculate and remit 5 % VAT on the value of the transaction at the point of sale. For platforms that already handle fiat VAT reporting, the shift adds a layer of compliance work: they need to capture the USD‑ or AED‑equivalent value of each crypto trade, store the tax‑relevant data, and issue proper invoices.
From a market perspective, the rule could encourage higher‑quality on‑ramping services that can prove they’re VAT‑compliant, potentially narrowing the gap between regulated exchanges and decentralized protocols. Traders may see a modest uptick in activity on Binance Spot for pairs like $BTC /$USDT and ETH/$USDT as users favour familiar, audit‑ready venues. At the same time, some DeFi‑only participants might look for jurisdictions with lighter tax treatment, reinforcing the split between centralized and permissionless liquidity sources.
How are you adjusting your tax workflow or exchange choice in response to the UAE’s new requirements?
#CryptoTax #UAE #Binance #GAMERXERO
From a market perspective, the rule could encourage higher‑quality on‑ramping services that can prove they’re VAT‑compliant, potentially narrowing the gap between regulated exchanges and decentralized protocols. Traders may see a modest uptick in activity on Binance Spot for pairs like $BTC /$USDT and ETH/$USDT as users favour familiar, audit‑ready venues. At the same time, some DeFi‑only participants might look for jurisdictions with lighter tax treatment, reinforcing the split between centralized and permissionless liquidity sources.
How are you adjusting your tax workflow or exchange choice in response to the UAE’s new requirements?
#CryptoTax #UAE #Binance #GAMERXERO
I was watching $BTC drift around $79,600 all morning, then slip to $79,300 before climbing back to $79,800 as the 24‑hour band tightened between $79,233 and $80,560. Every tick felt like a nudge to jump in, but the candle kept bouncing inside the same range for hours. I caught myself reaching for the mouse each time the price brushed the upper edge, only to watch it retreat a few minutes later.
Instead of reacting, I pulled out my notebook, wrote down the exact entry and stop‑loss I’d planned before the session opened, and reminded myself why I set those levels – to protect capital if the range broke down. I let the market run, kept my position size small, and used the pause to review the order‑book depth on Binance Spot. The depth showed more sell pressure near the top of the band, confirming the price was likely to test the lower side again before any breakout.
How do you keep your trading plan intact when the price hovers near a tempting level?
#CryptoPsychology #TradingMindset #GAMERXERO
Instead of reacting, I pulled out my notebook, wrote down the exact entry and stop‑loss I’d planned before the session opened, and reminded myself why I set those levels – to protect capital if the range broke down. I let the market run, kept my position size small, and used the pause to review the order‑book depth on Binance Spot. The depth showed more sell pressure near the top of the band, confirming the price was likely to test the lower side again before any breakout.
How do you keep your trading plan intact when the price hovers near a tempting level?
#CryptoPsychology #TradingMindset #GAMERXERO
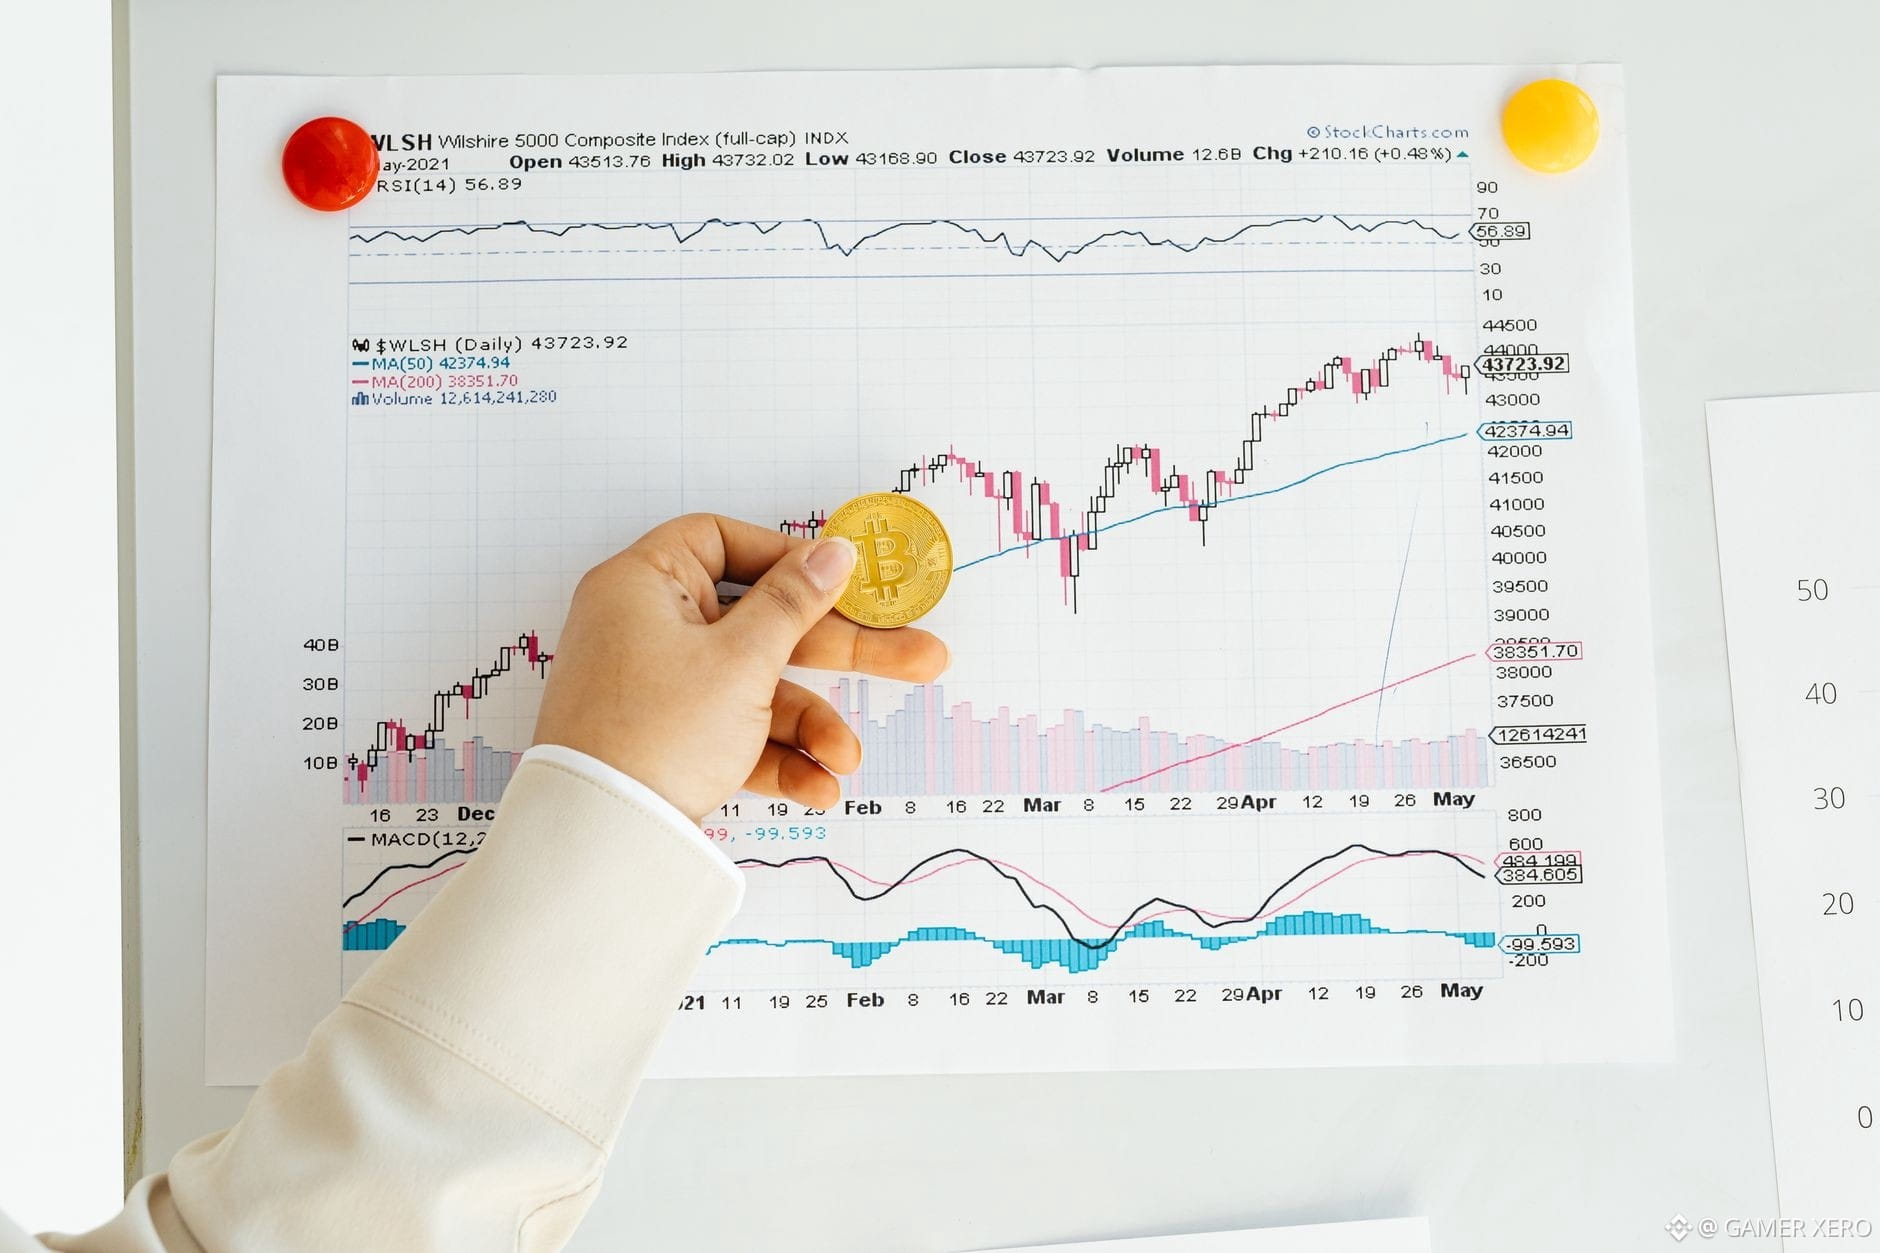
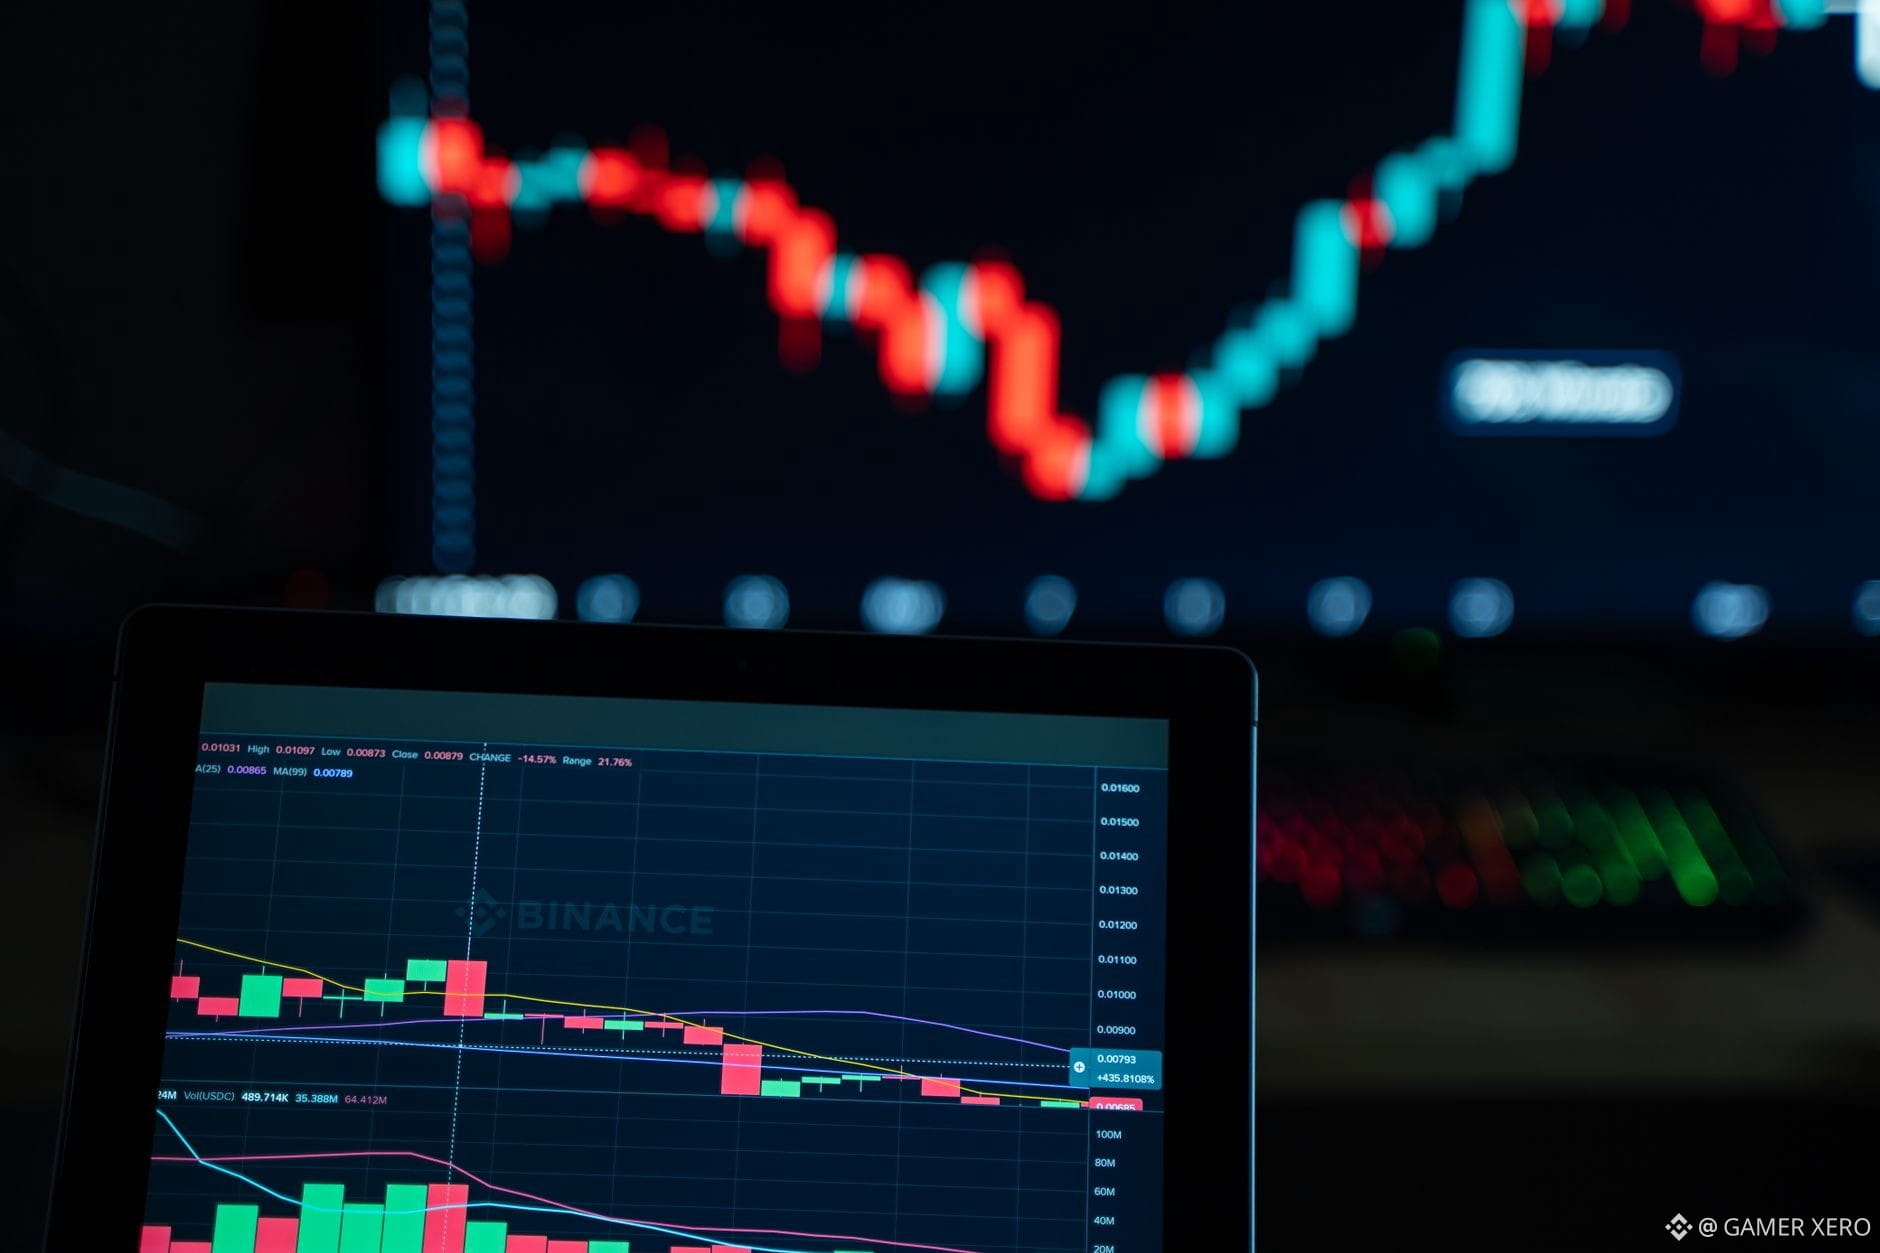
$BTC is nudging just above the middle of its 24‑hour range, holding around $80,336 while the band sits between $79,233 and $80,560. The price has respected the lower half for most of the session, suggesting buyers are stepping in near the $79,500‑$80,000 zone. On the sell side, the $80,560 high acts as an immediate ceiling; each test has been met with modest buying pressure, keeping the candle tight. This behavior lines up with a broader “pause” pattern we’ve seen after several days of sideways movement, where market participants wait for clearer macro cues—think the upcoming AI‑related earnings chatter and the latest Ethereum scaling upgrade.
With both majors showing constrained swings, do you think the market is consolidating for a bigger catalyst, or is it simply digesting recent news before a longer trend resumes?
#CryptoAnalysis #Binance #BTC #ETH #GAMERXERO
With both majors showing constrained swings, do you think the market is consolidating for a bigger catalyst, or is it simply digesting recent news before a longer trend resumes?
#CryptoAnalysis #Binance #BTC #ETH #GAMERXERO
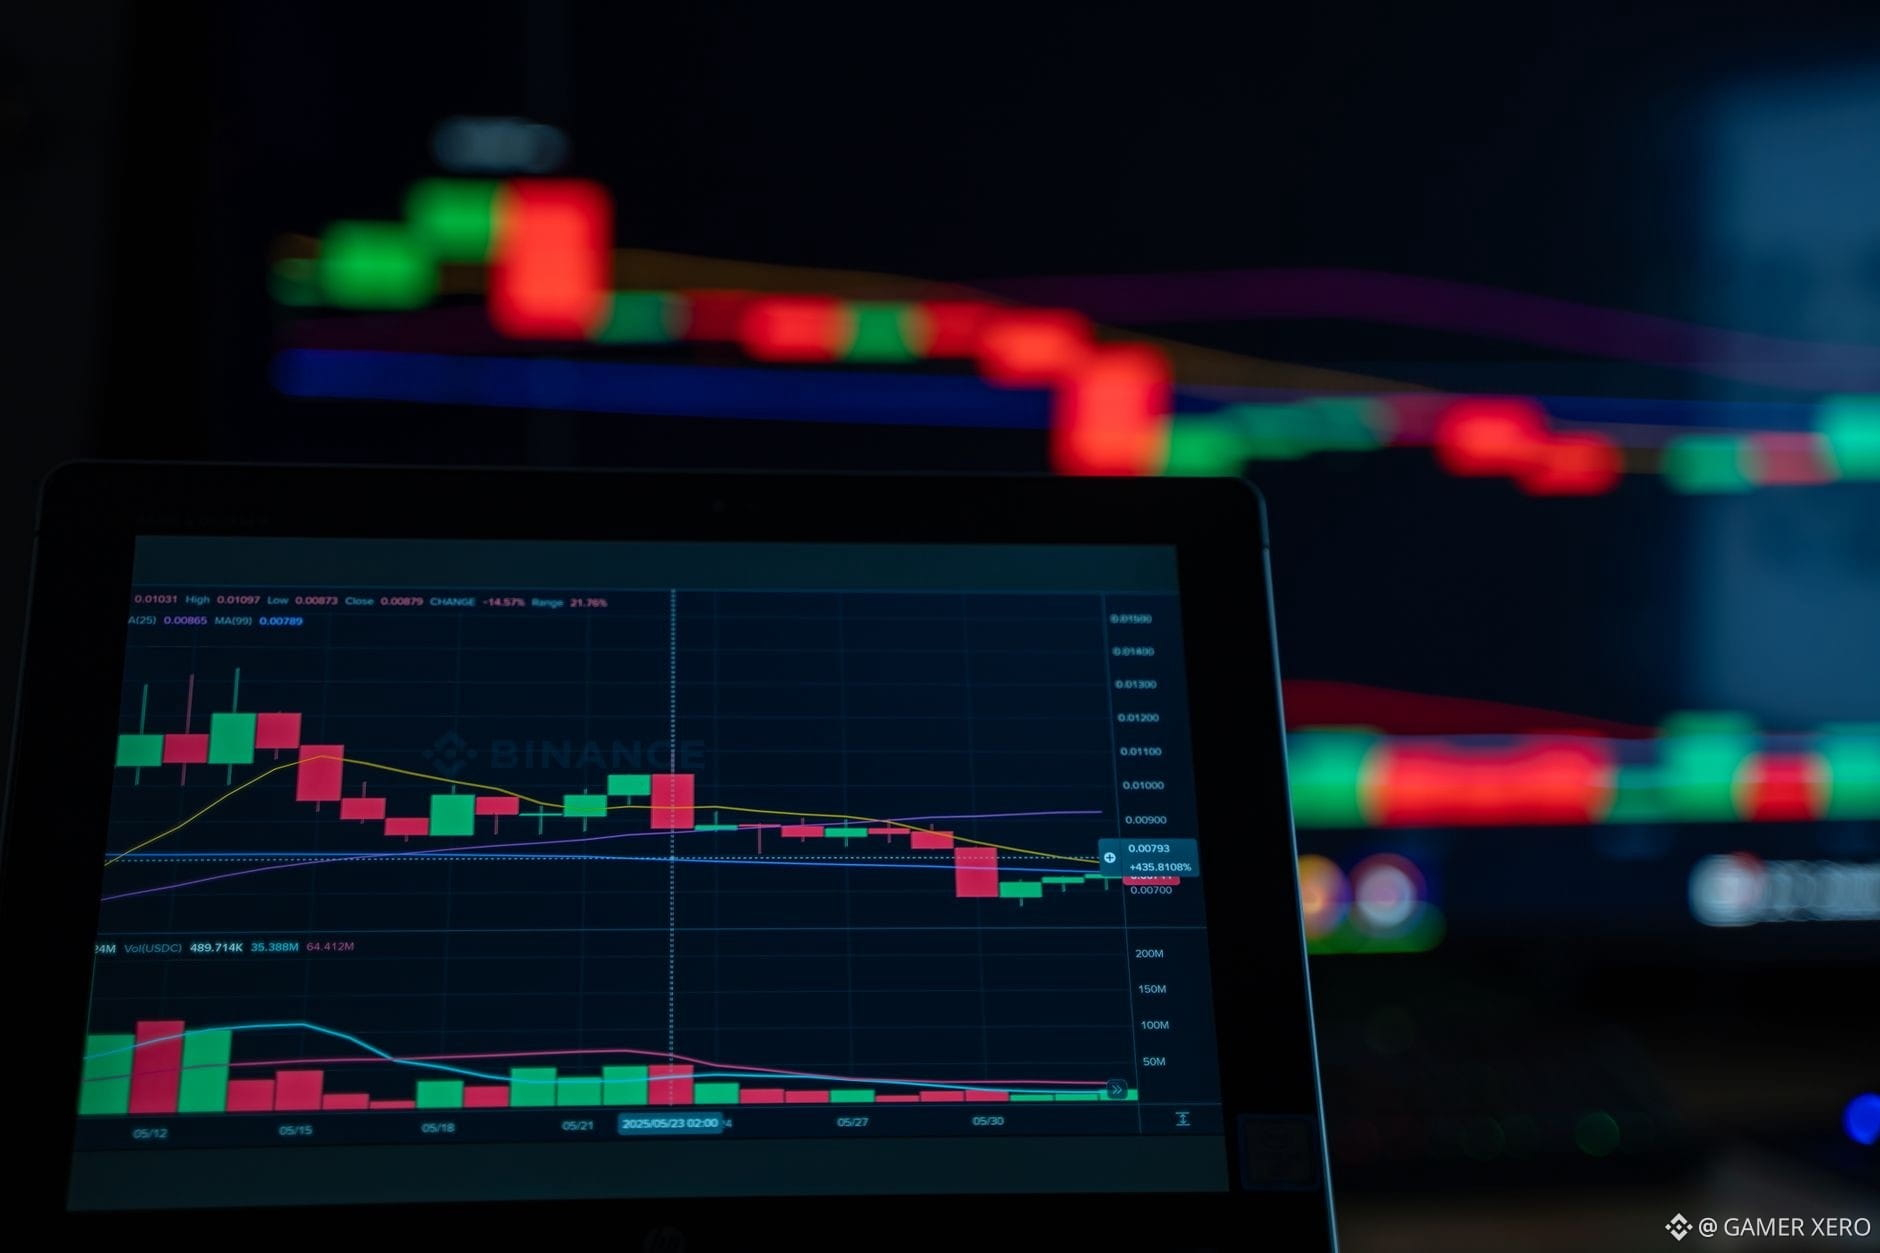
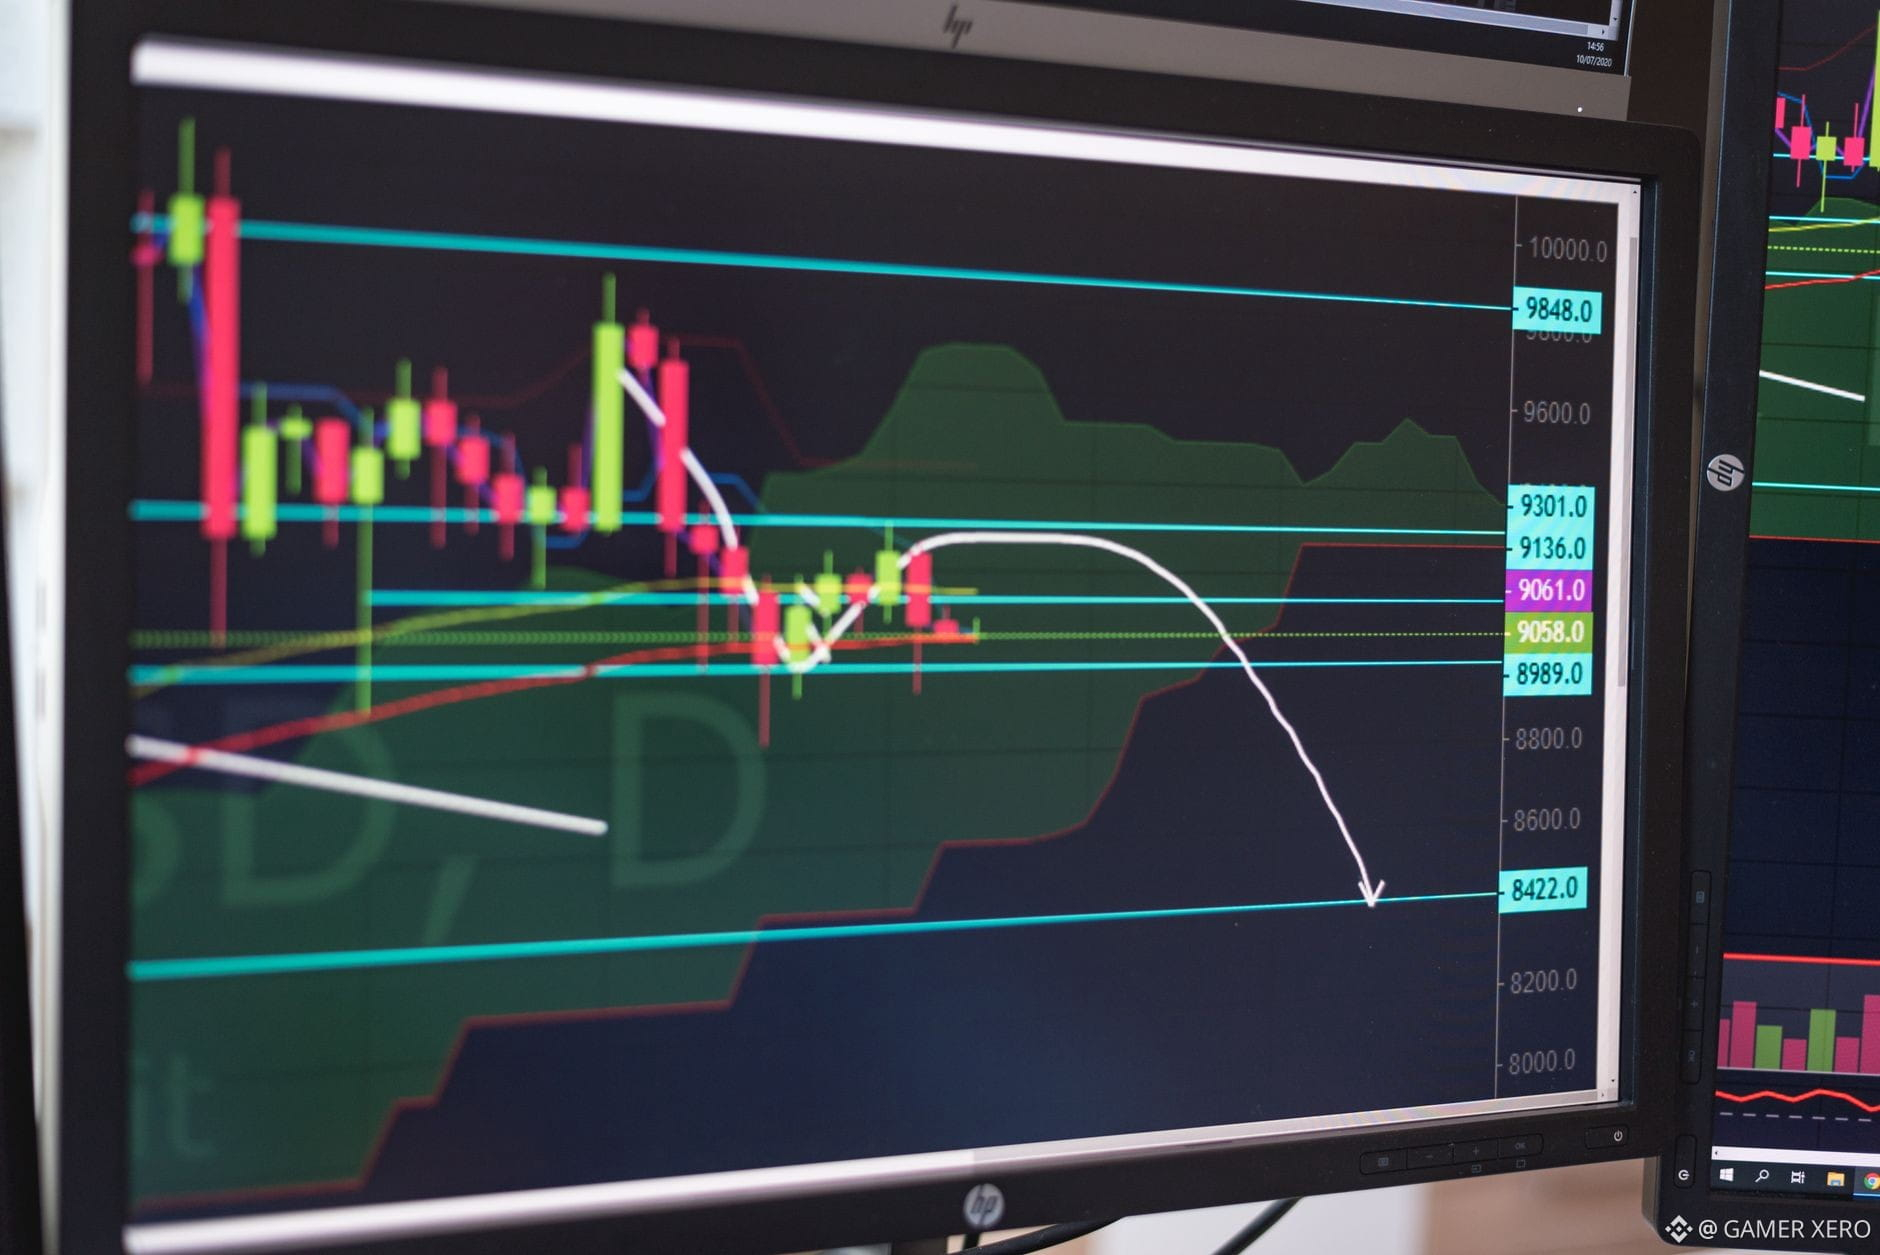
$BTC has been trading inside a tight 24 hour band of $79,233 – $80,108, with the current price at $79,924. The candle’s 0.23 % move suggests low volatility and a market that’s waiting for a catalyst. Order‑book depth on Binance shows a modest sell wall near the high, while buyers are clustered just below $79,800. That structure often forces price to bounce between the wall and the support zone, giving scalpers a chance to capture small moves on volume spikes. Keep an eye on the $79,900 level – a break below could attract stop‑loss hunting and a short‑term dip, whereas a hold above the $80,000 round number may reinforce the current range.
On the alt side, $ETH is edging higher at $2,499.89, up 0.90 % and testing the $2,523 ceiling. The recent pull‑back to $2,460 created a classic “cup‑handle” shape, and the next swing could test the upper band if buying pressure holds. Watch the $2,500‑$2,520 window for potential liquidity sweeps; a refill of buy orders there often precedes a short‑term rally.
Given the narrow bands, how are you adjusting your entry or exit strategy within these ranges?
#CryptoAnalysis #Binance #Trading #GAMERXERO
On the alt side, $ETH is edging higher at $2,499.89, up 0.90 % and testing the $2,523 ceiling. The recent pull‑back to $2,460 created a classic “cup‑handle” shape, and the next swing could test the upper band if buying pressure holds. Watch the $2,500‑$2,520 window for potential liquidity sweeps; a refill of buy orders there often precedes a short‑term rally.
Given the narrow bands, how are you adjusting your entry or exit strategy within these ranges?
#CryptoAnalysis #Binance #Trading #GAMERXERO
A recent deep‑dive into the Trezor incident shows the breach impact was far larger than initially reported. The discovery of previously “deleted” shipping logs pushed the exposure from a few thousand users to roughly 80,000 wallets, a six‑fold increase. For hardware‑wallet holders this is a reminder that physical‑device security is only one piece of the puzzle – the data chain around the device can be just as vulnerable.
What does this mean for the broader market? Even though the breach didn’t involve on‑chain theft, the loss of privacy can erode confidence in custodial‑free solutions. Traders who keep sizable positions in $BTC or $ETH often rely on hardware wallets for long‑term storage; any hint of data leakage may prompt a shift toward multi‑signature setups or layer‑2 vaults that add redundancy.
Do you think the Trezor findings will accelerate adoption of multi‑signature wallets among retail investors?
#crypto #security #hardwarewallet #GAMERXERO
What does this mean for the broader market? Even though the breach didn’t involve on‑chain theft, the loss of privacy can erode confidence in custodial‑free solutions. Traders who keep sizable positions in $BTC or $ETH often rely on hardware wallets for long‑term storage; any hint of data leakage may prompt a shift toward multi‑signature setups or layer‑2 vaults that add redundancy.
Do you think the Trezor findings will accelerate adoption of multi‑signature wallets among retail investors?
#crypto #security #hardwarewallet #GAMERXERO
When a swing takes $BTC from the $79,800 low back up to $79,745 in minutes, the urge to “get even” can hit hard. I’ve seen traders who lost a few hundred dollars on a pull‑back and then pile on a larger position the moment the price nudges higher, convinced the next candle will revenge the earlier loss. The trap is subtle: the brain treats the loss as a personal failure, not a market event, and the next entry feels like redemption.
A simple reset helps. First, pause and write down the original trade rationale—was the entry based on a support zone, a candle pattern, or a clear imbalance? If that reason still holds, you can consider a fresh trade; if not, walk away. Second, limit the size of any “revenge” position to a fraction of your usual risk, e.g., 50 % of the normal 1 % account risk. That cuts the emotional stakes and makes the move a test of strategy, not ego.
Finally, use a quick “cool‑down” timer. Even five minutes away from the screen can break the immediate impulse and let the market context speak for itself. Have you ever caught yourself in a revenge trade, and what reset step saved you?
#CryptoPsychology #TradingMindset #GAMERXERO #Binance #TraderTips
A simple reset helps. First, pause and write down the original trade rationale—was the entry based on a support zone, a candle pattern, or a clear imbalance? If that reason still holds, you can consider a fresh trade; if not, walk away. Second, limit the size of any “revenge” position to a fraction of your usual risk, e.g., 50 % of the normal 1 % account risk. That cuts the emotional stakes and makes the move a test of strategy, not ego.
Finally, use a quick “cool‑down” timer. Even five minutes away from the screen can break the immediate impulse and let the market context speak for itself. Have you ever caught yourself in a revenge trade, and what reset step saved you?
#CryptoPsychology #TradingMindset #GAMERXERO #Binance #TraderTips
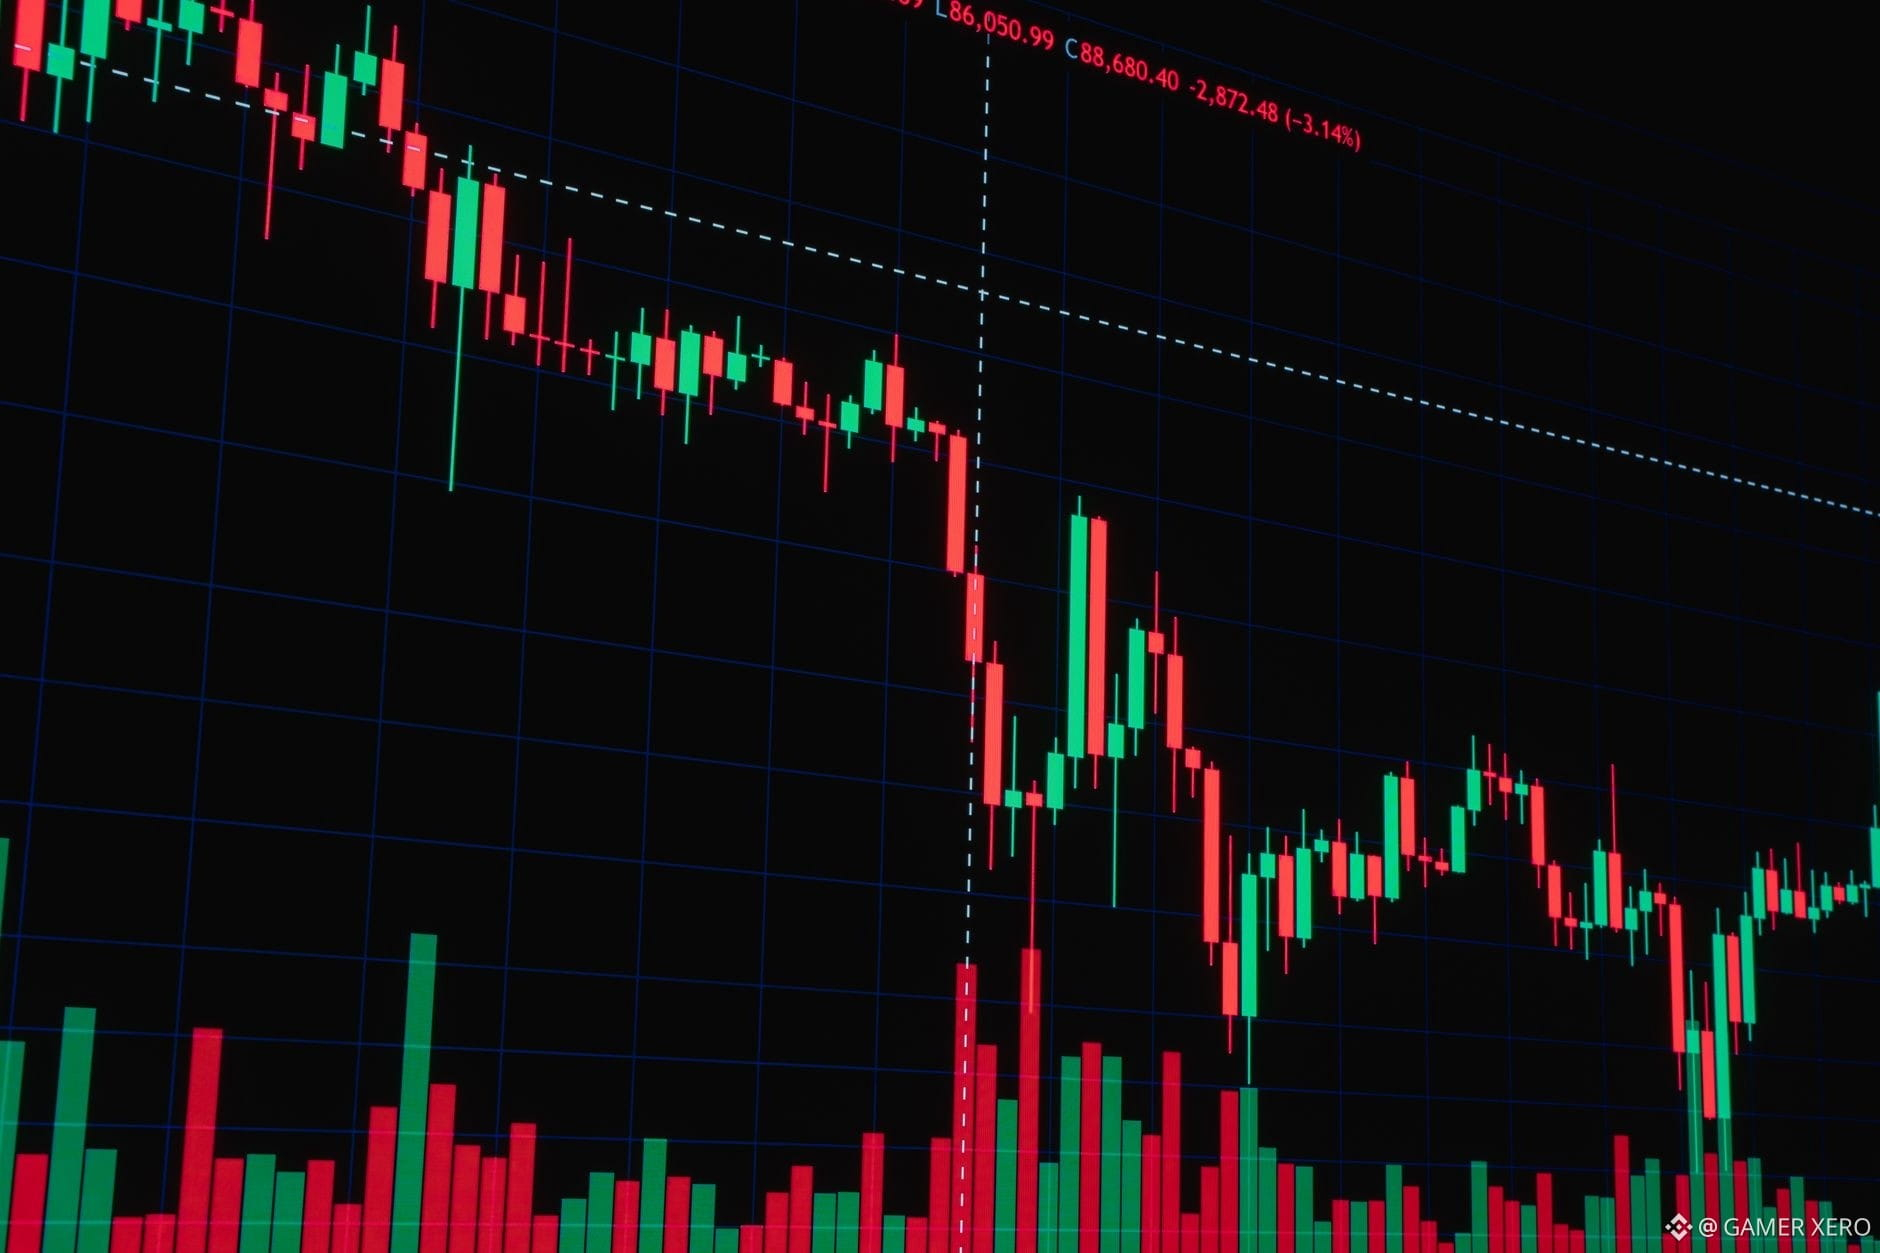
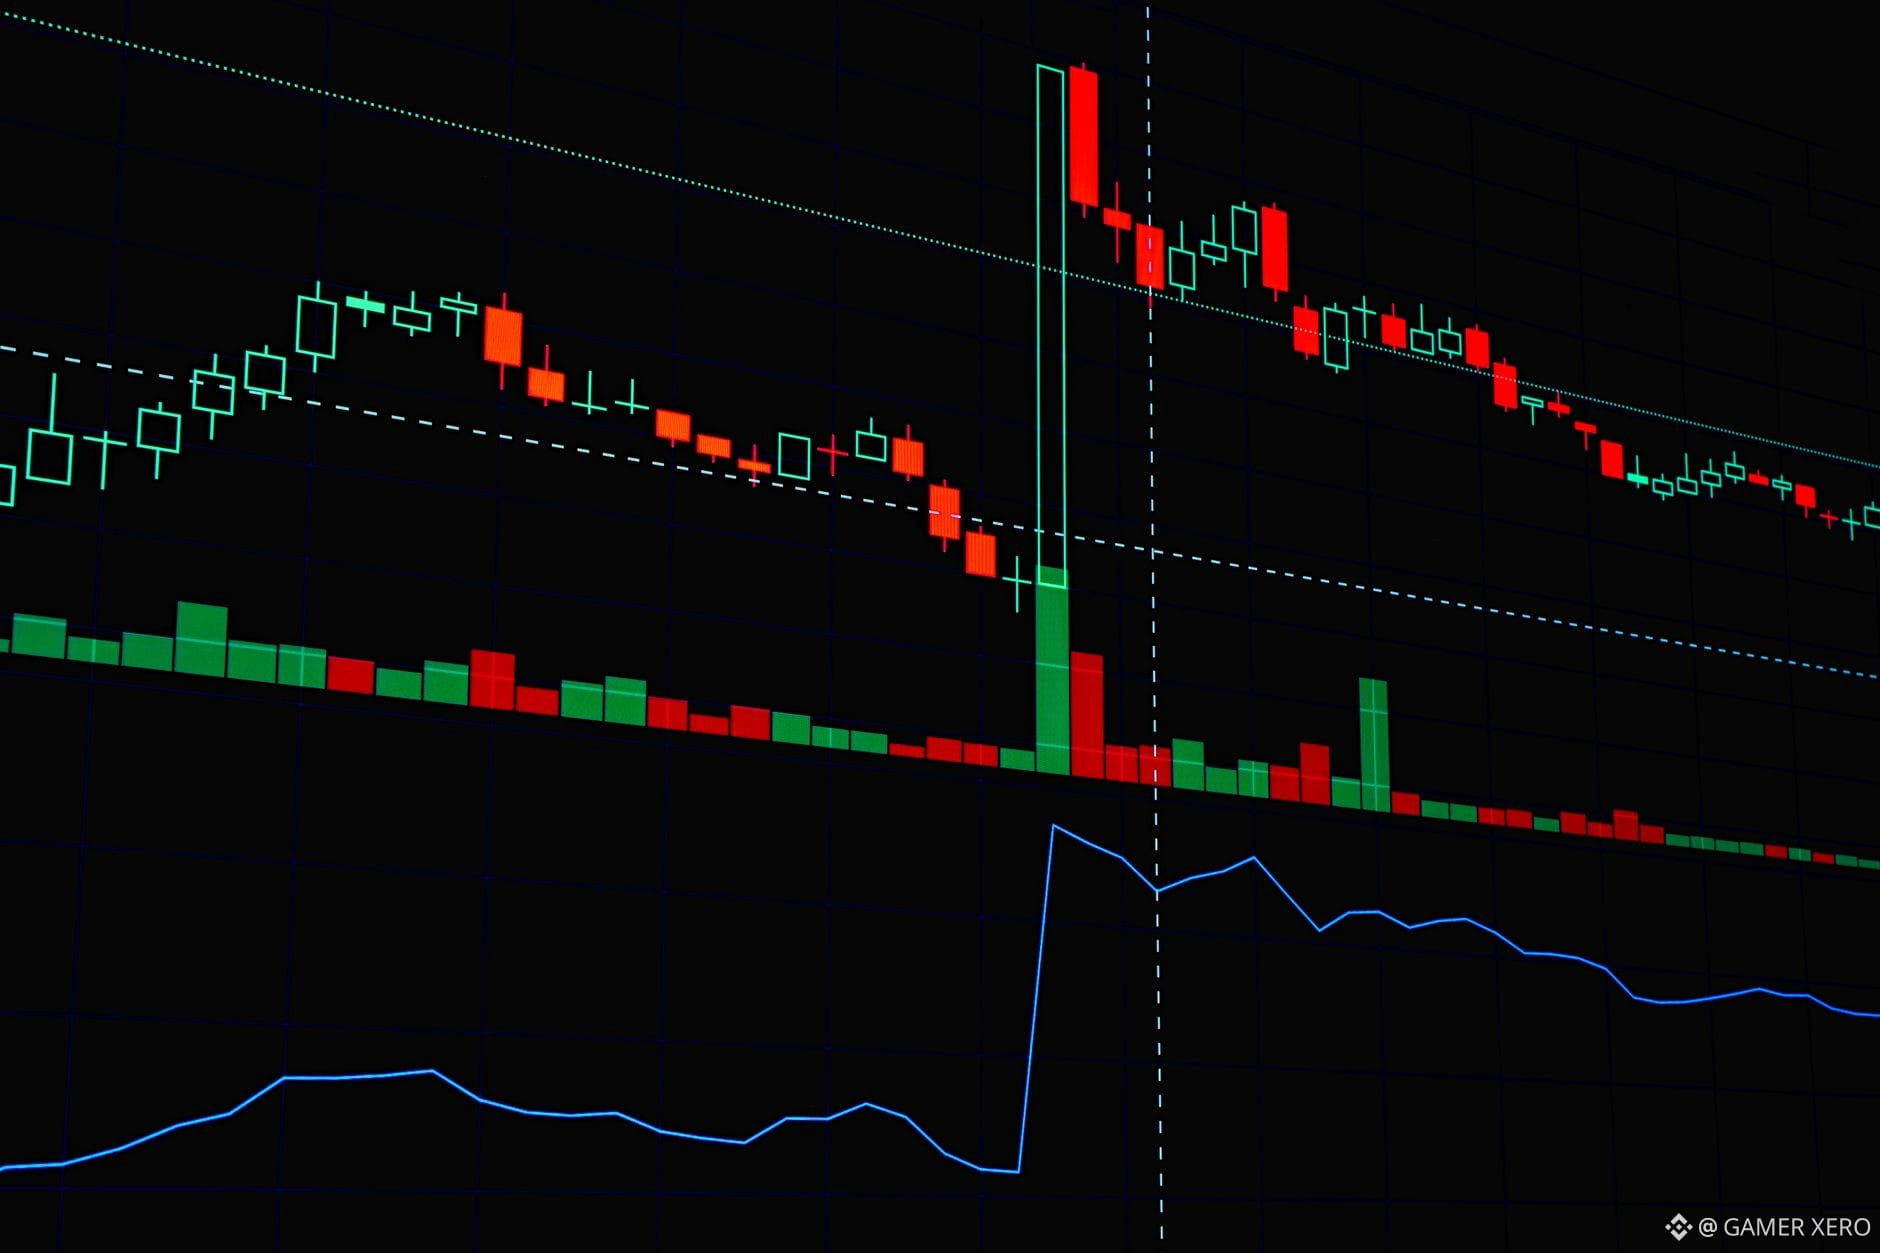
$BTC is trading just under $80 k, hugging a tight 24‑hour range between $79,233 and $80,200. That stability makes it a good reference point for setting portfolio exposure limits. A simple rule I keep: no more than 20 % of total crypto allocation in any single asset. With $BTC at roughly $79,700, a $10 k crypto budget would cap a $BTC position at $2 k, leaving room for a secondary play like $ETH , which sits at $2,482. Using the same 20 % cap, $ETH would be limited to $2 k as well.
Diversification beyond two assets can further cushion drawdowns. Allocate the remaining 60 % across low‑correlation tokens or stablecoins, balancing between growth potential and risk mitigation. When a position hits a 10 % loss, consider scaling back rather than adding – it protects capital and reduces the chance of large‑scale drawdowns.
To estimate recovery, apply the “double‑up” rule: a 20 % drop requires a 25 % gain to break even. Knowing this math helps set realistic expectations and avoid chasing losses.
How do you structure your exposure limits to stay comfortable during sideways markets?
#RiskManagement #CryptoPortfolio #Diversification #GAMERXERO
Diversification beyond two assets can further cushion drawdowns. Allocate the remaining 60 % across low‑correlation tokens or stablecoins, balancing between growth potential and risk mitigation. When a position hits a 10 % loss, consider scaling back rather than adding – it protects capital and reduces the chance of large‑scale drawdowns.
To estimate recovery, apply the “double‑up” rule: a 20 % drop requires a 25 % gain to break even. Knowing this math helps set realistic expectations and avoid chasing losses.
How do you structure your exposure limits to stay comfortable during sideways markets?
#RiskManagement #CryptoPortfolio #Diversification #GAMERXERO
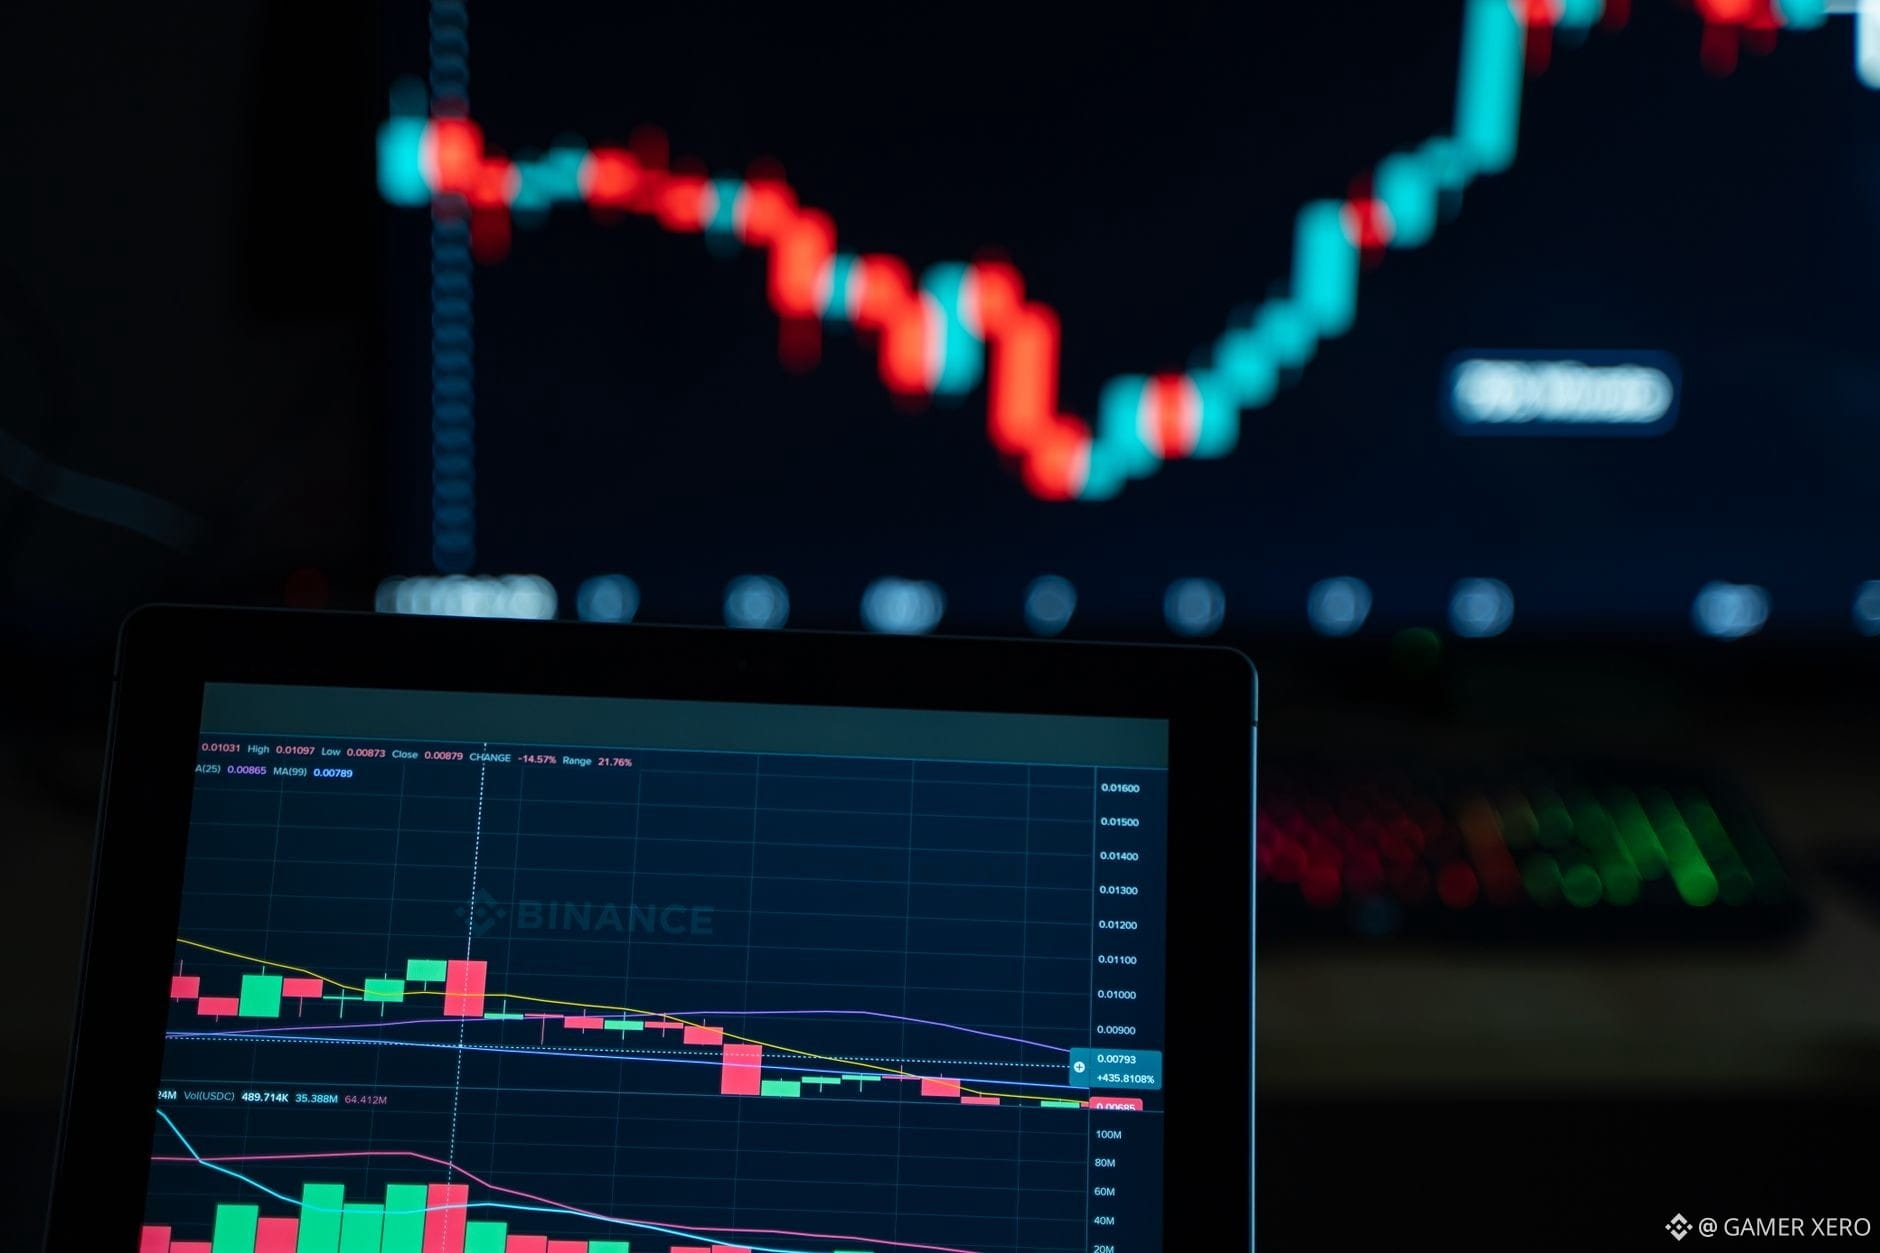
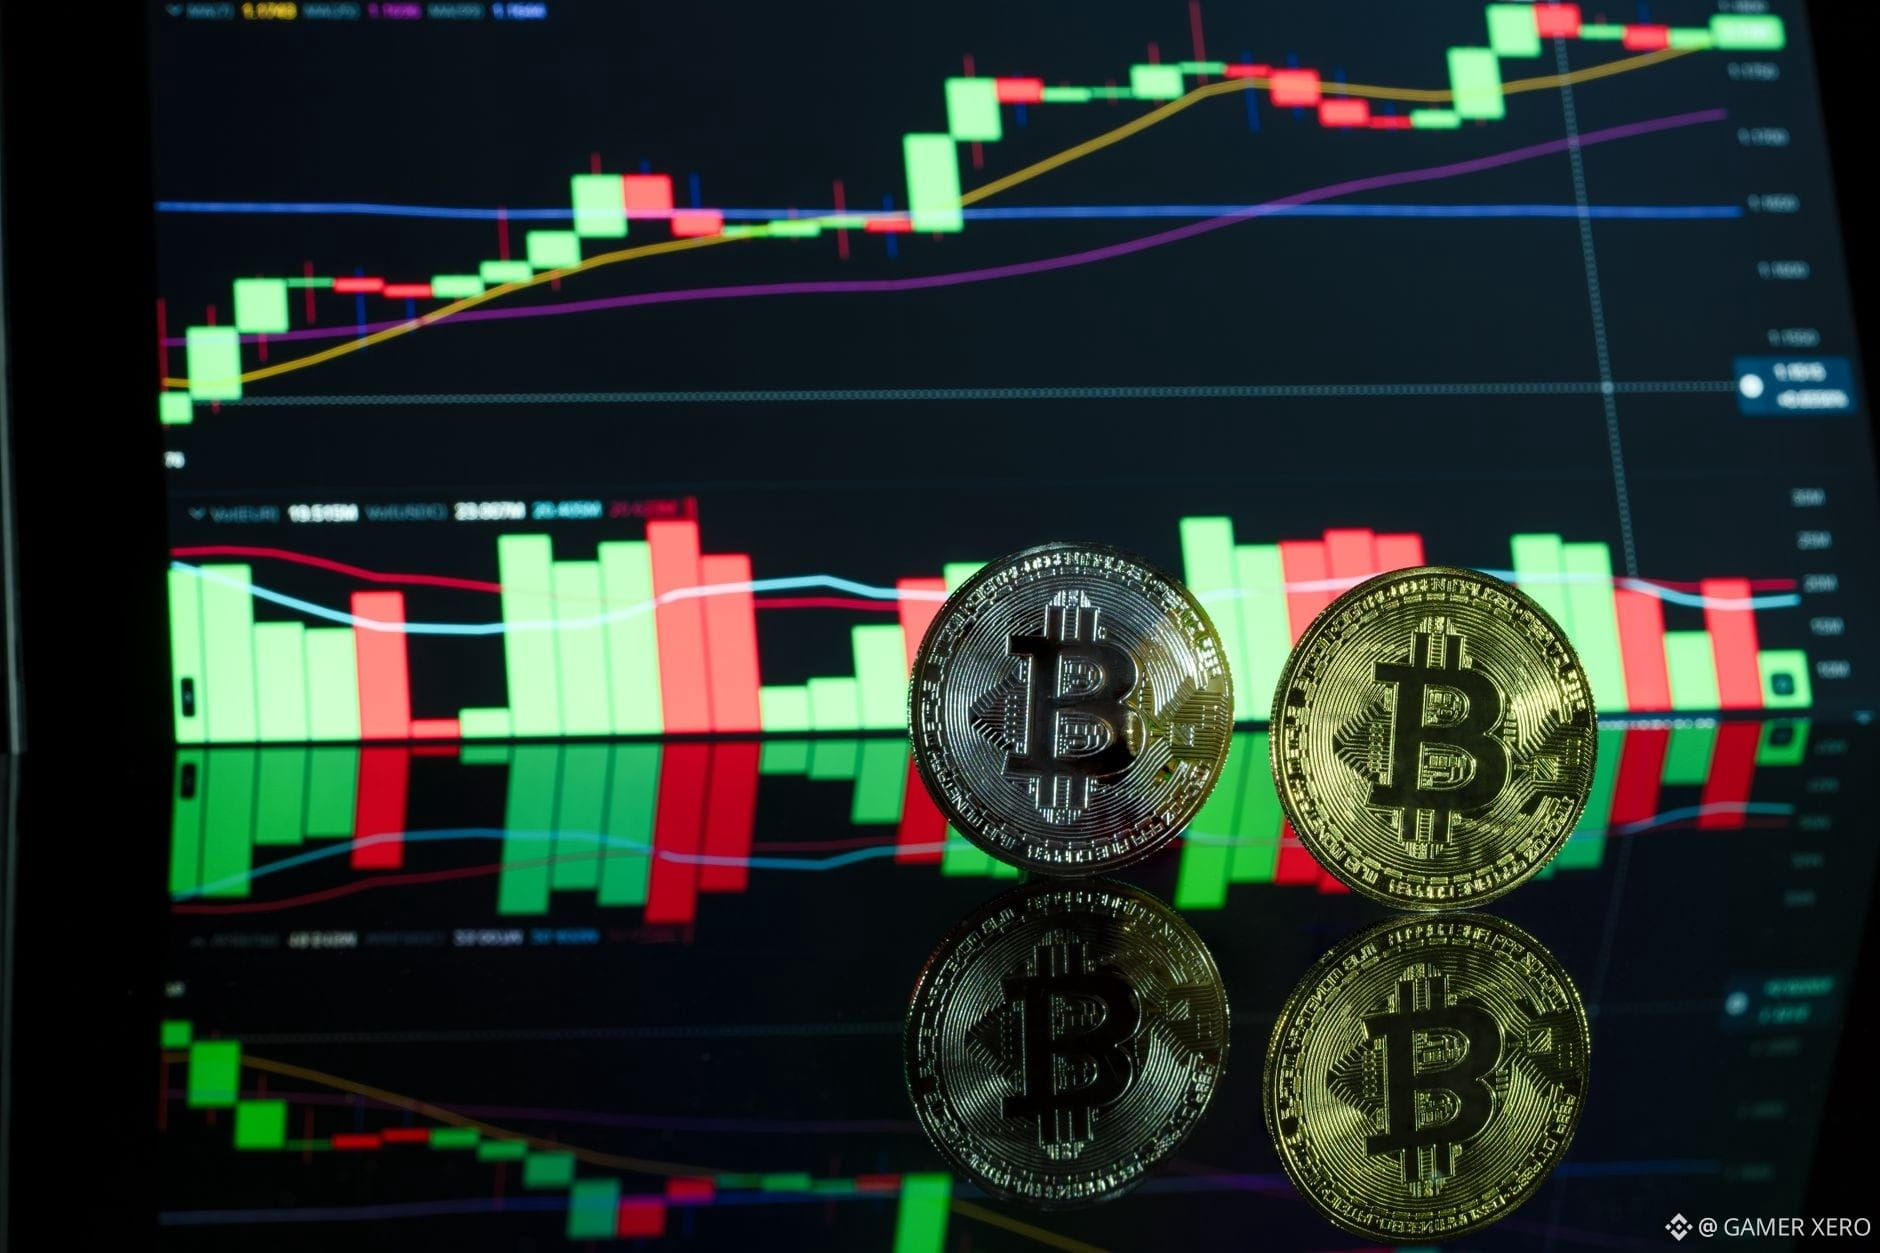
SOL’s 24‑hour price band has tightened noticeably, hovering between $102.56 and $107.36 with the current quote at $106.16. The narrow swing – just under a 5 % range – signals a balance between buyers and sellers rather than a decisive move. What’s interesting is the volume profile on Binance’s spot market: while price stayed near the upper half of the band, buy‑side depth has been building just below $105, creating a modest order‑wall that absorbs short‑term sell pressure. At the same time, sell orders are clustered around $107, suggesting that any breakout attempts will need to clear that resistance layer.
What do you think will be the catalyst that finally pushes SOL past the $107 resistance – a new DeFi integration, a macro shift, or something else?
#crypto #SOL #DeFi #GAMERXERO
What do you think will be the catalyst that finally pushes SOL past the $107 resistance – a new DeFi integration, a macro shift, or something else?
#crypto #SOL #DeFi #GAMERXERO
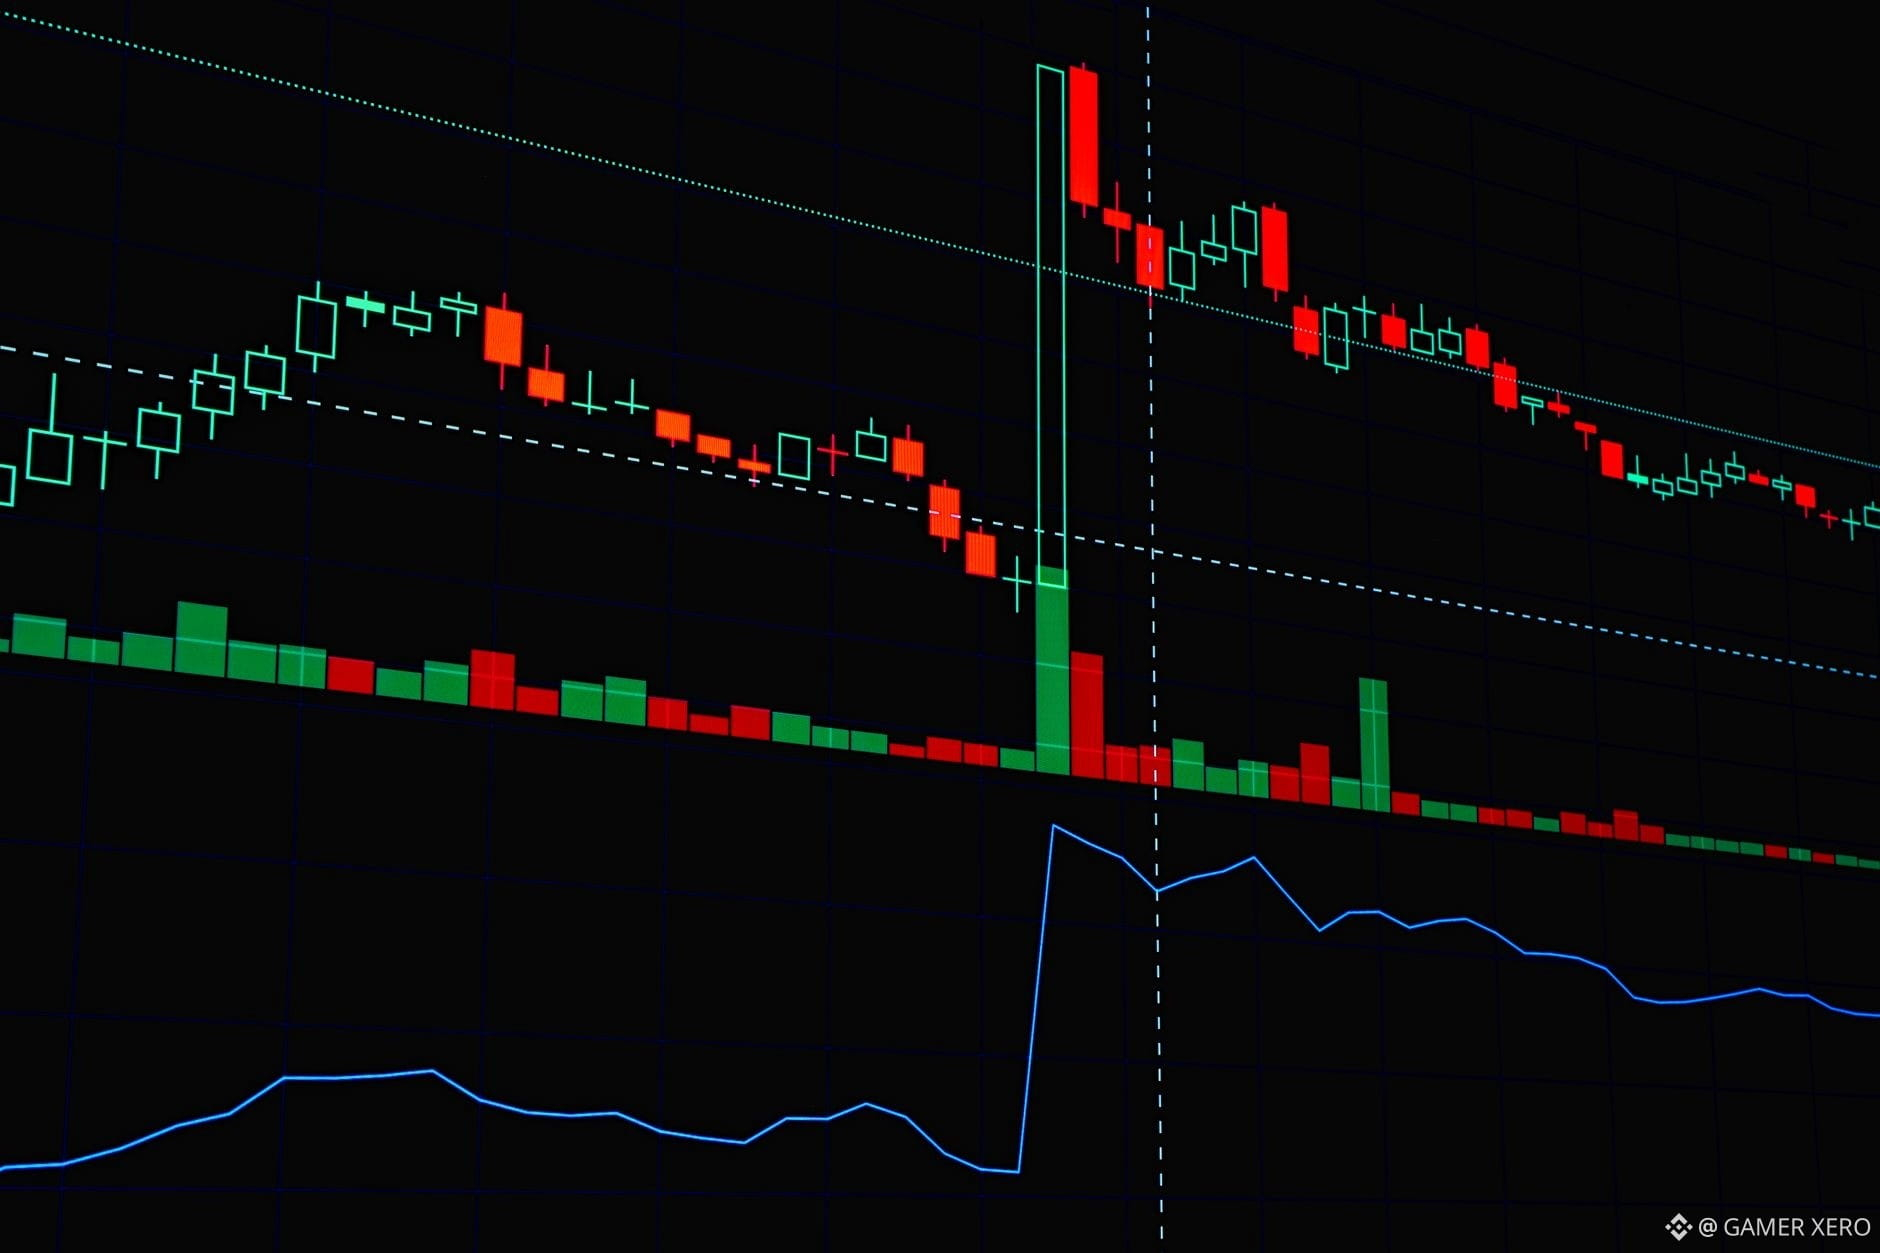
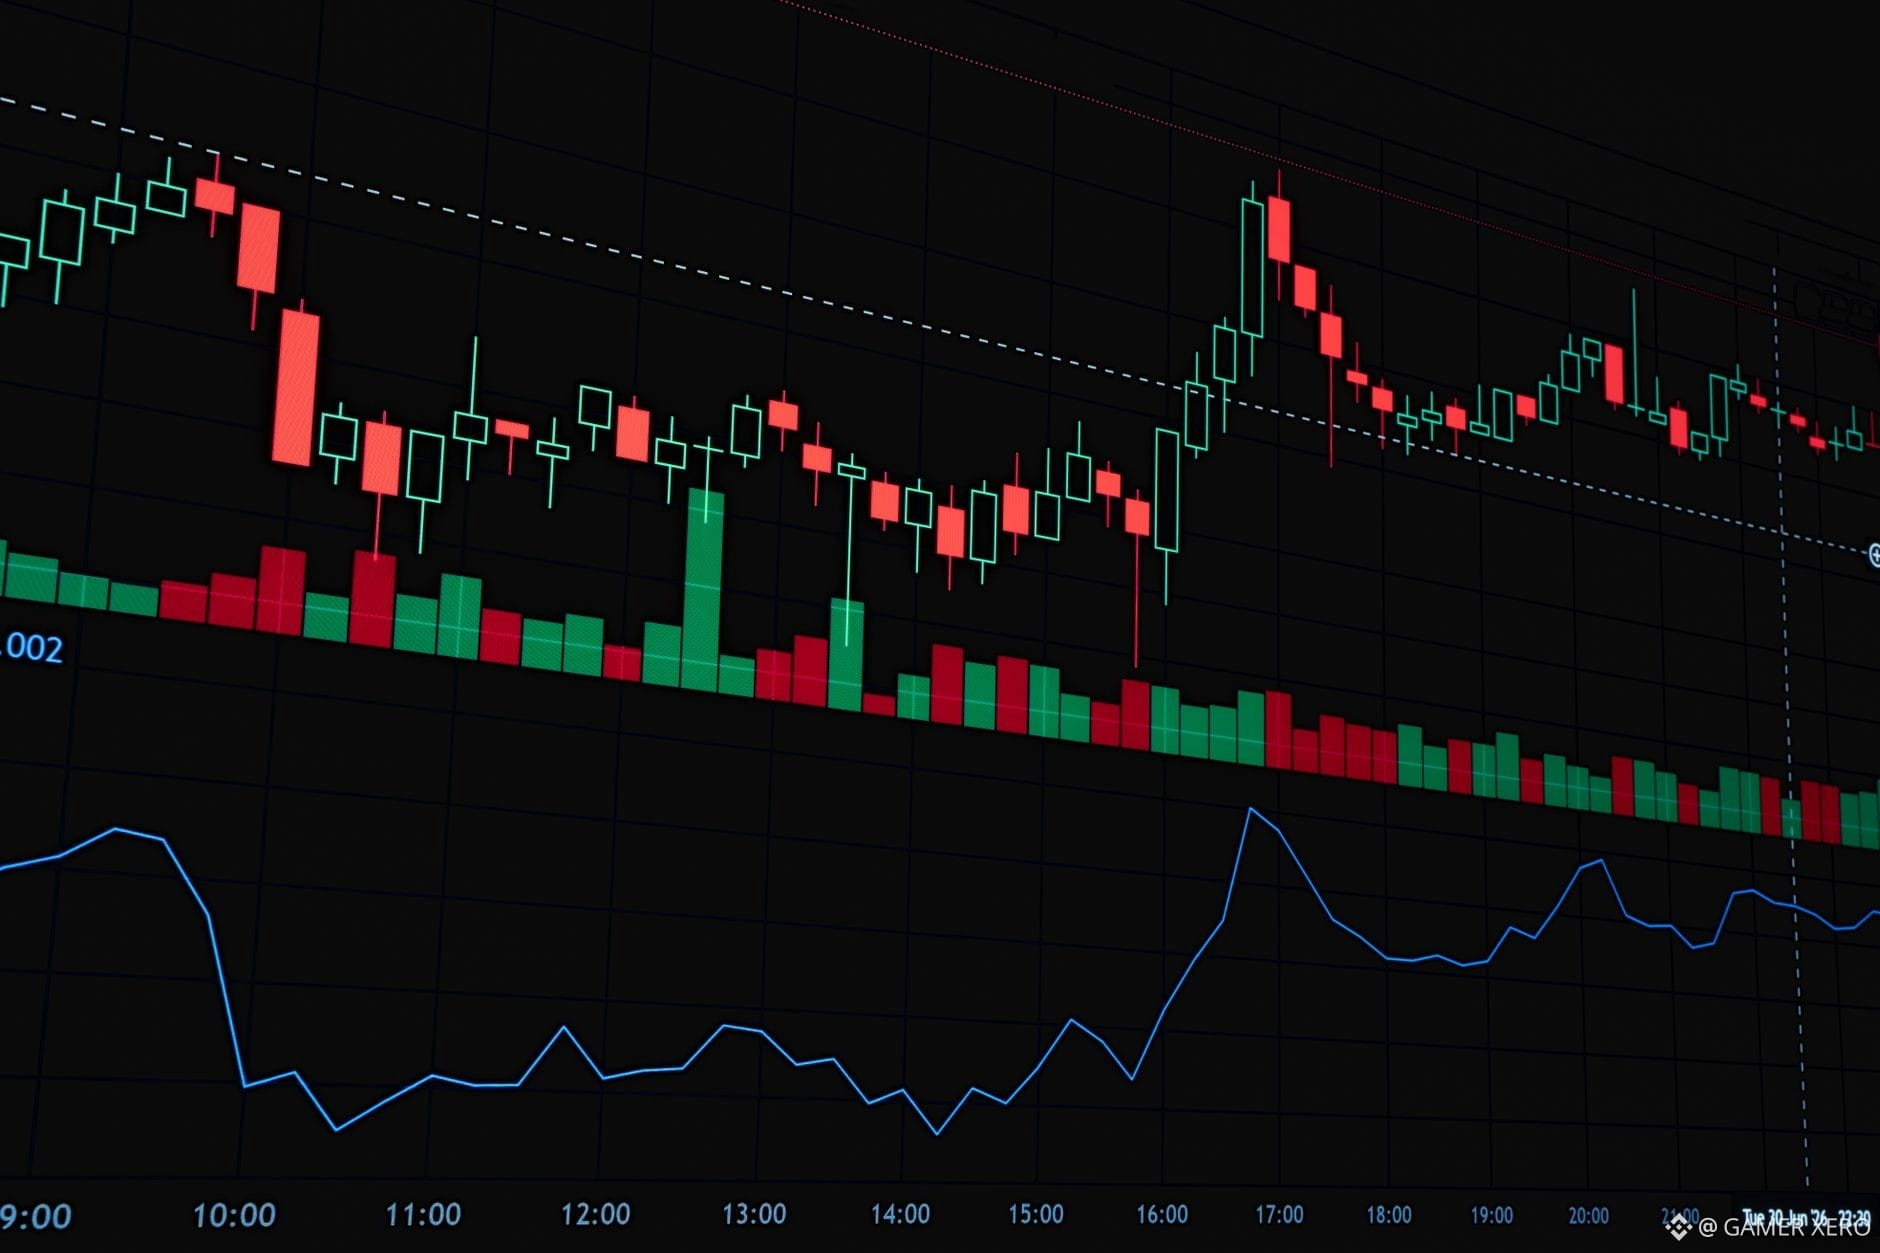
The latest Crypto Briefing piece flags rising energy prices as Iran‑Ukraine tensions tighten global supplies. Higher oil and gas costs can push inflation expectations, which often nudges investors toward assets that aren’t directly tied to traditional commodities. On Binance, $BTC is holding around $79,919 while $ETH sits near $2,502, both showing modest upside momentum – BTC up 0.39 % and ETH up almost 2 % in the past 24 hours.
When energy markets tighten, some traders look for “store‑of‑value” characteristics in crypto, especially in periods where fiat‑linked inflation erodes purchasing power. The ripple effect can also surface in transaction‑fee dynamics: miners and validators who earn a portion of their income from block rewards may see cost pressures on electricity, potentially influencing network participation rates.
How are you adjusting your risk buffers or exposure models in response to the current energy‑price backdrop?
#CryptoNews #EnergyMarkets #RiskManagement #GAMERXERO
When energy markets tighten, some traders look for “store‑of‑value” characteristics in crypto, especially in periods where fiat‑linked inflation erodes purchasing power. The ripple effect can also surface in transaction‑fee dynamics: miners and validators who earn a portion of their income from block rewards may see cost pressures on electricity, potentially influencing network participation rates.
How are you adjusting your risk buffers or exposure models in response to the current energy‑price backdrop?
#CryptoNews #EnergyMarkets #RiskManagement #GAMERXERO
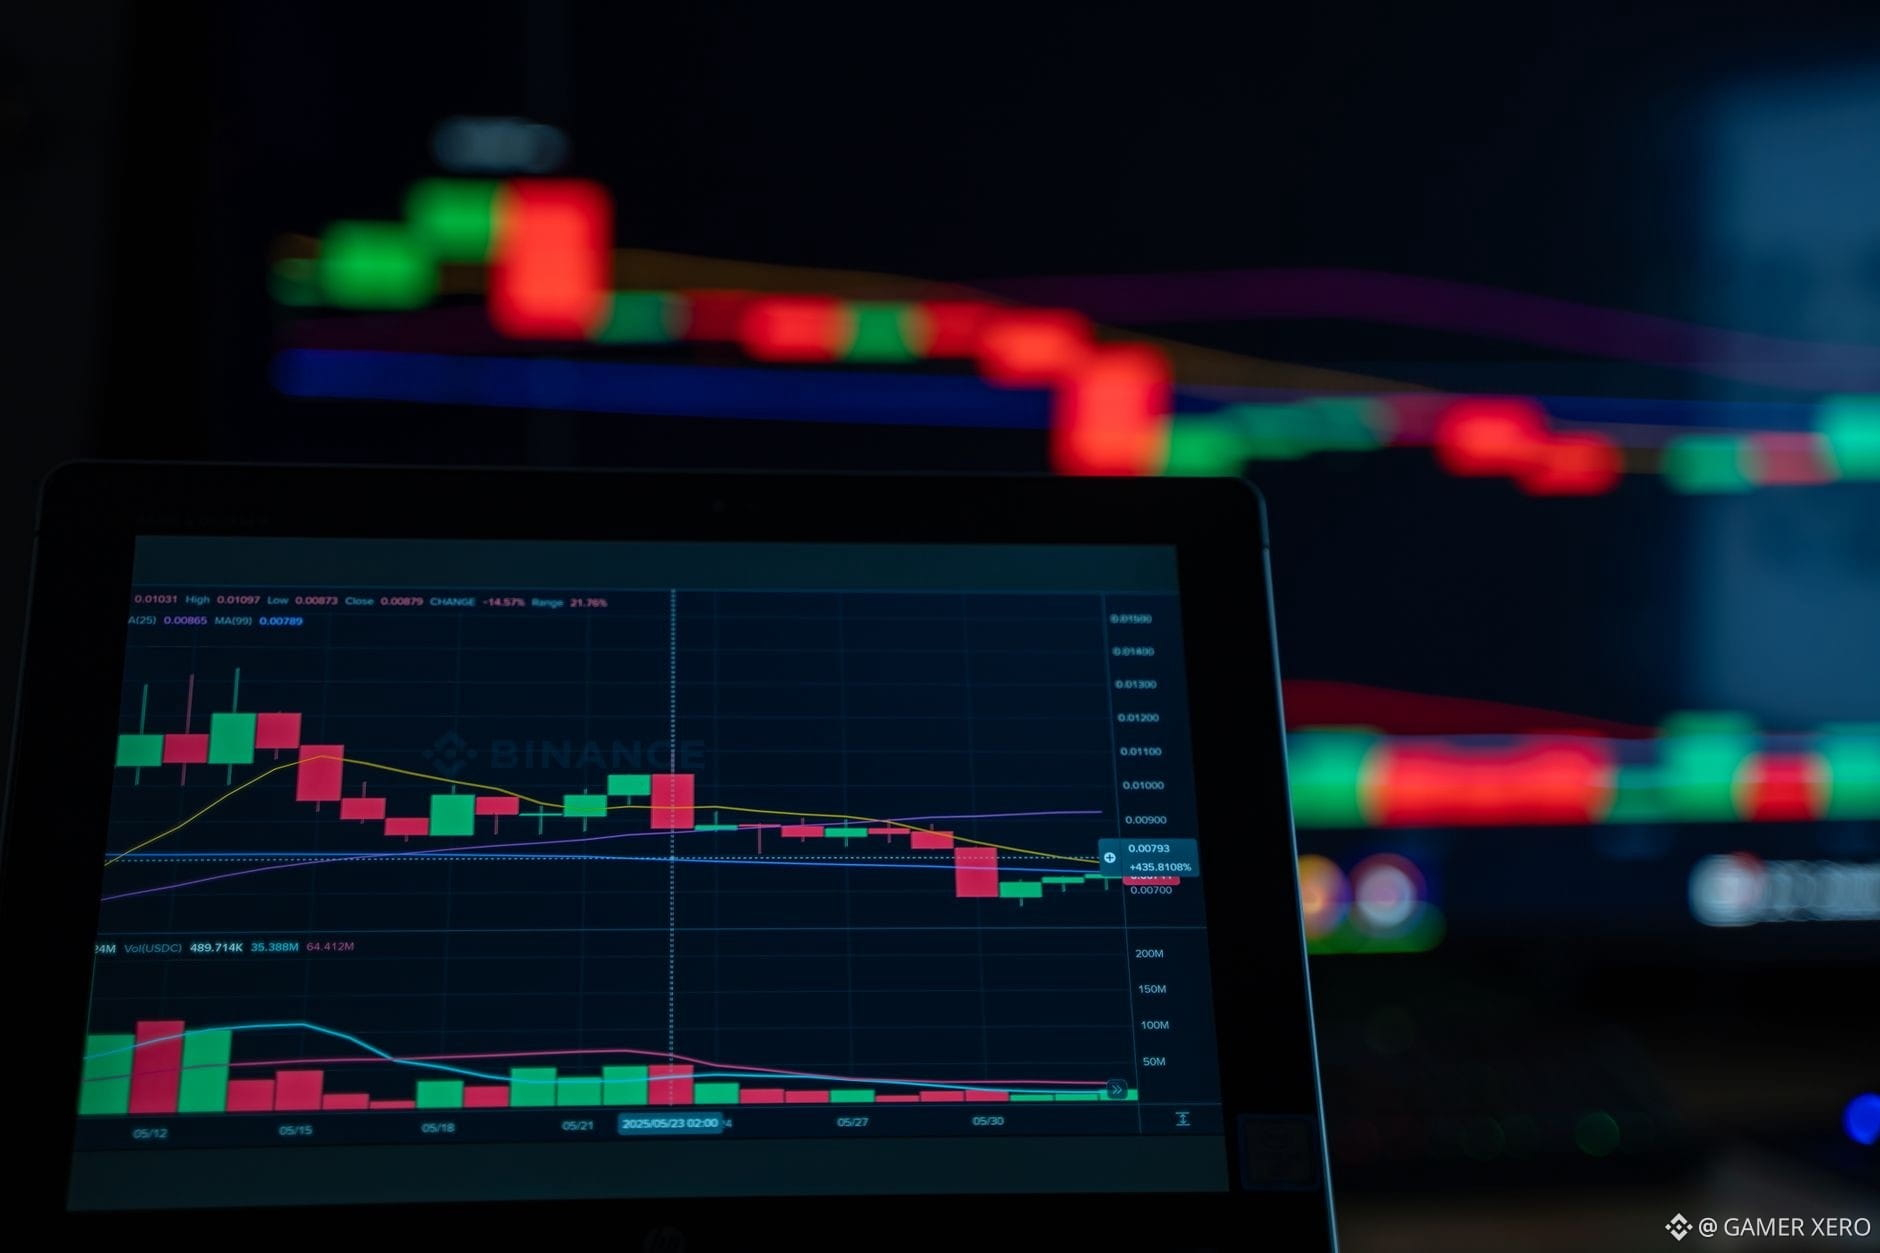
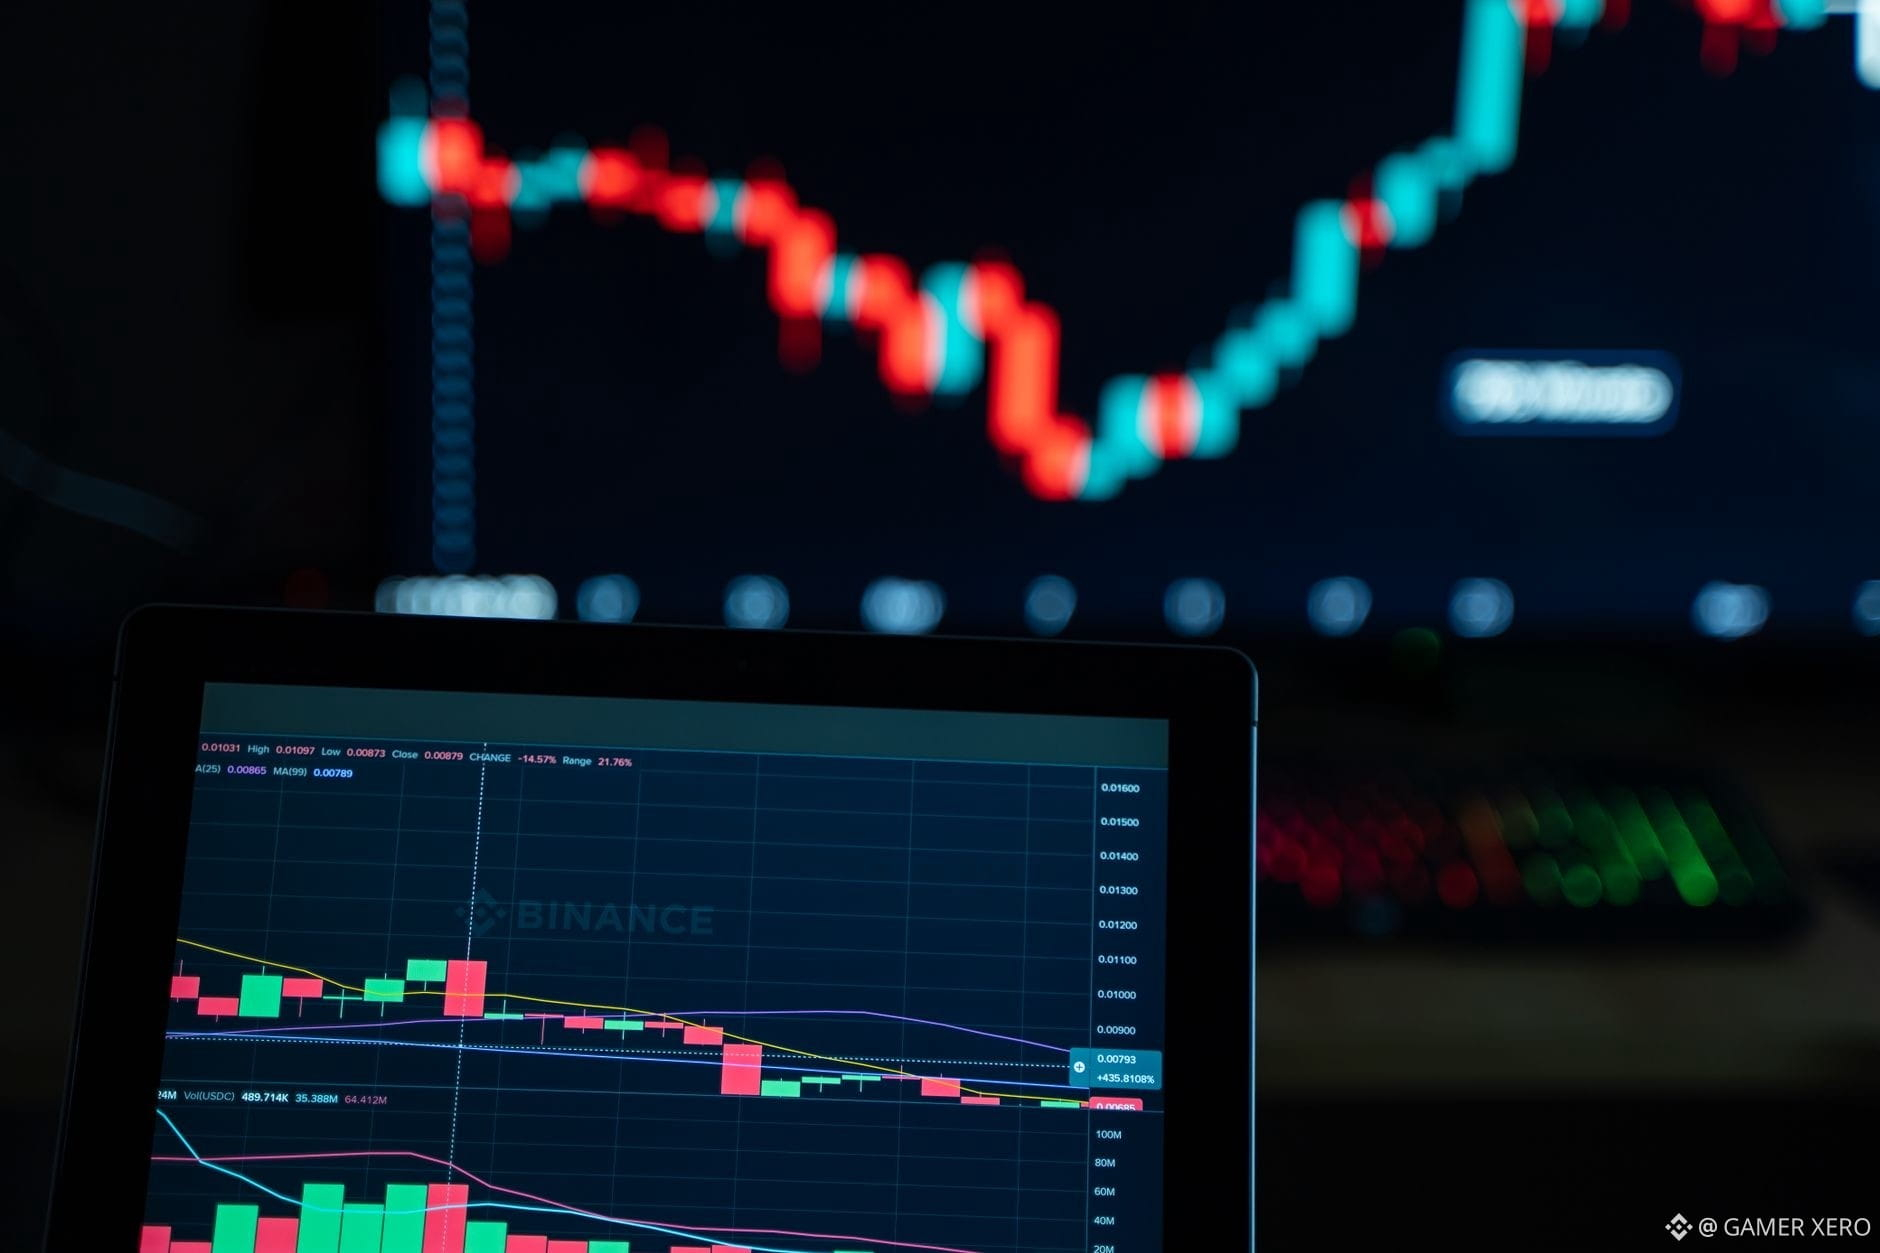
I was watching $BTC dance between $79,545.96 and $80,200 all morning, and the urge to jump in every time the price nudged the upper band was strong. My notebook showed a simple plan: only add a position if the candle closed above $79,900 with volume above the 24‑hour average. The price touched $79,900 twice, but each time the volume spike was missing, so I stayed out. Later, $ETH drifted up to $2,498.26, still within a tight range, and I reminded myself that the plan applies to every asset, not just the headline pair.
By refusing the instant‑entry temptation, I avoided a choppy pull‑back that would have taken a few minutes to recover. The real gain was mental – the discipline to check the rule before the reflex. When the market finally broke the $80,200 ceiling, I entered with a pre‑defined stop‑loss and a clear exit target, rather than scrambling for a “last chance” entry.
How do you keep your trading plan intact when the chart looks tempting?
#tradingpsychology #crypto #patience #GAMERXERO
By refusing the instant‑entry temptation, I avoided a choppy pull‑back that would have taken a few minutes to recover. The real gain was mental – the discipline to check the rule before the reflex. When the market finally broke the $80,200 ceiling, I entered with a pre‑defined stop‑loss and a clear exit target, rather than scrambling for a “last chance” entry.
How do you keep your trading plan intact when the chart looks tempting?
#tradingpsychology #crypto #patience #GAMERXERO
Log in to explore more content