Binance Square
#bitcoinhits$85k

bitcoinhits$85k

76,243 views
333 Discussing
Crypto_LUX
·
--
Bullish
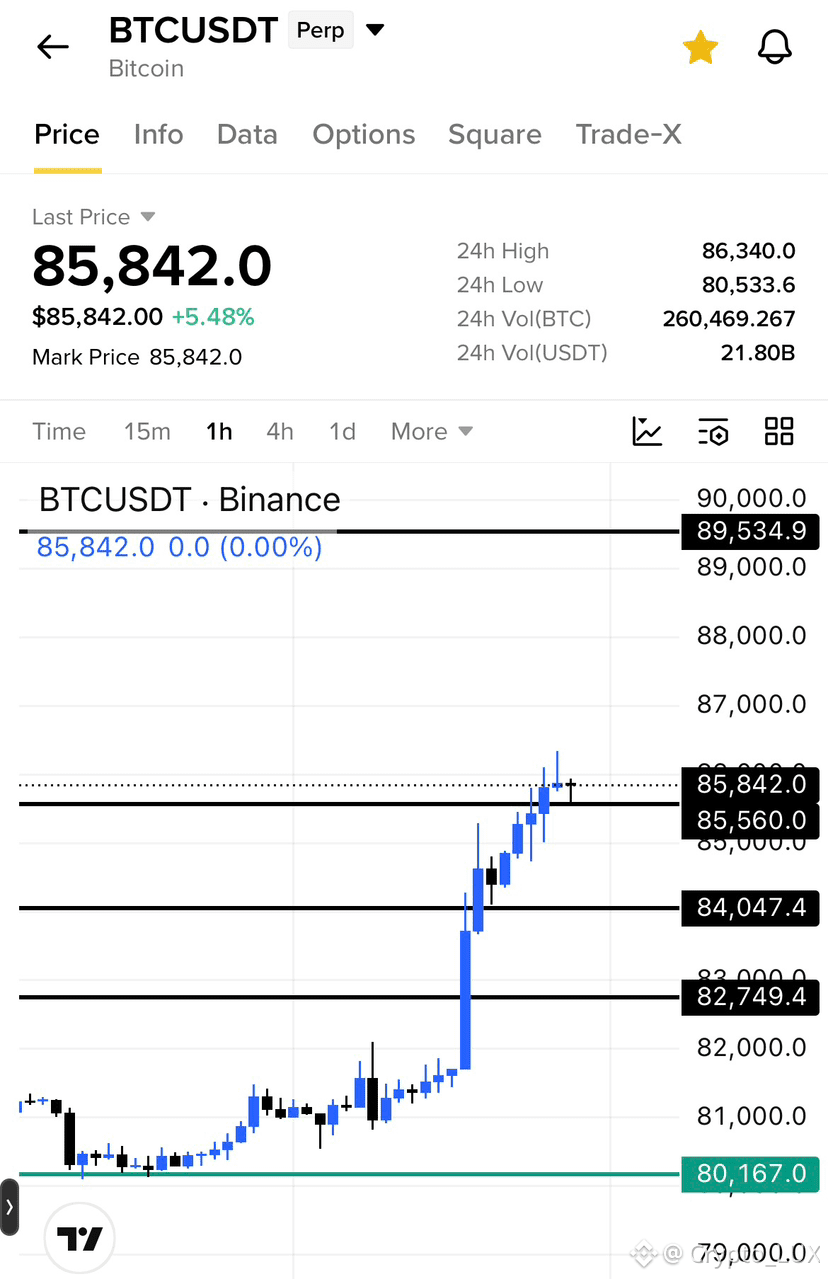
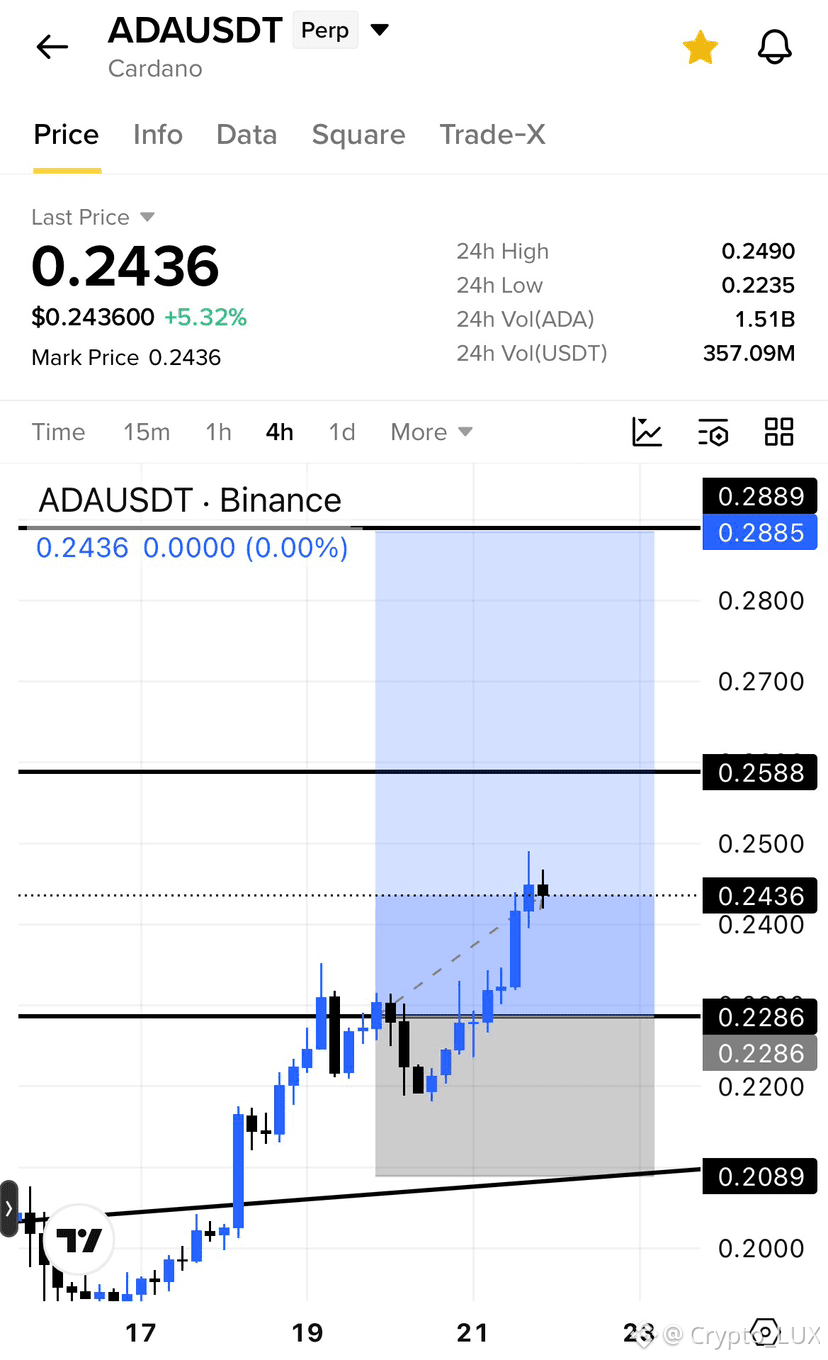
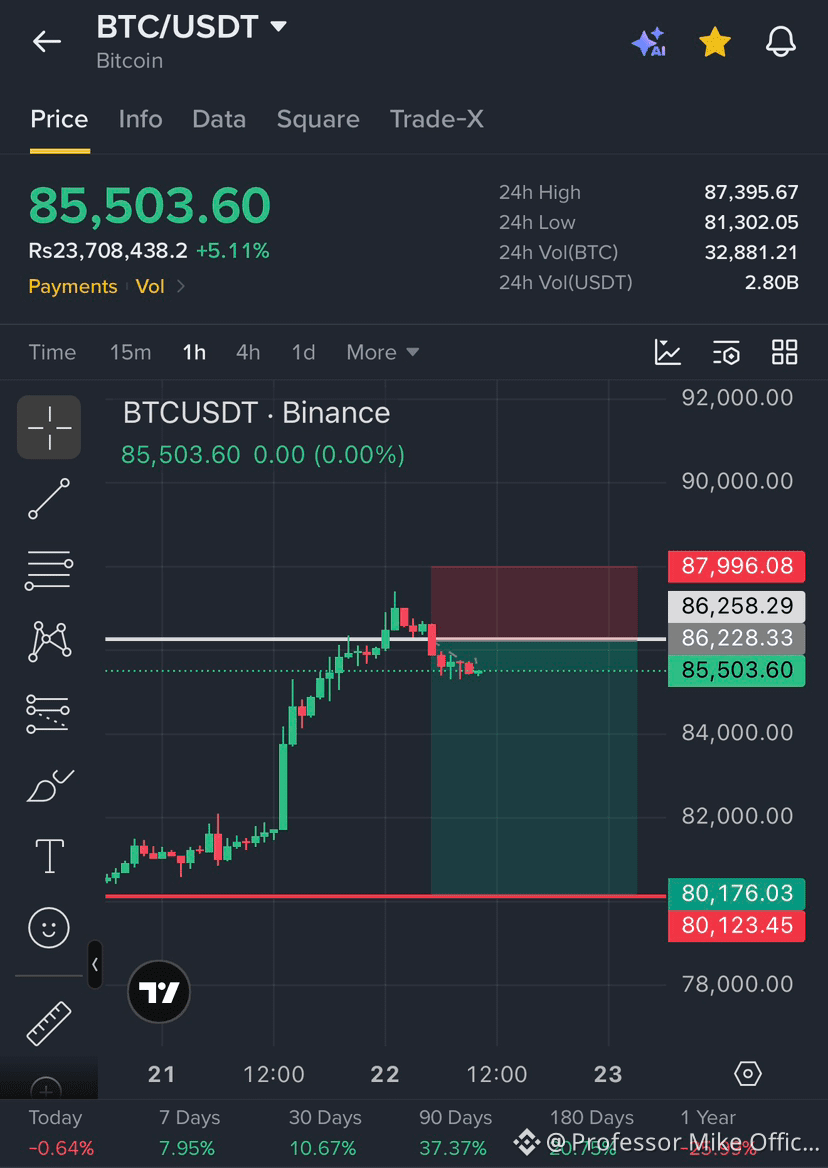
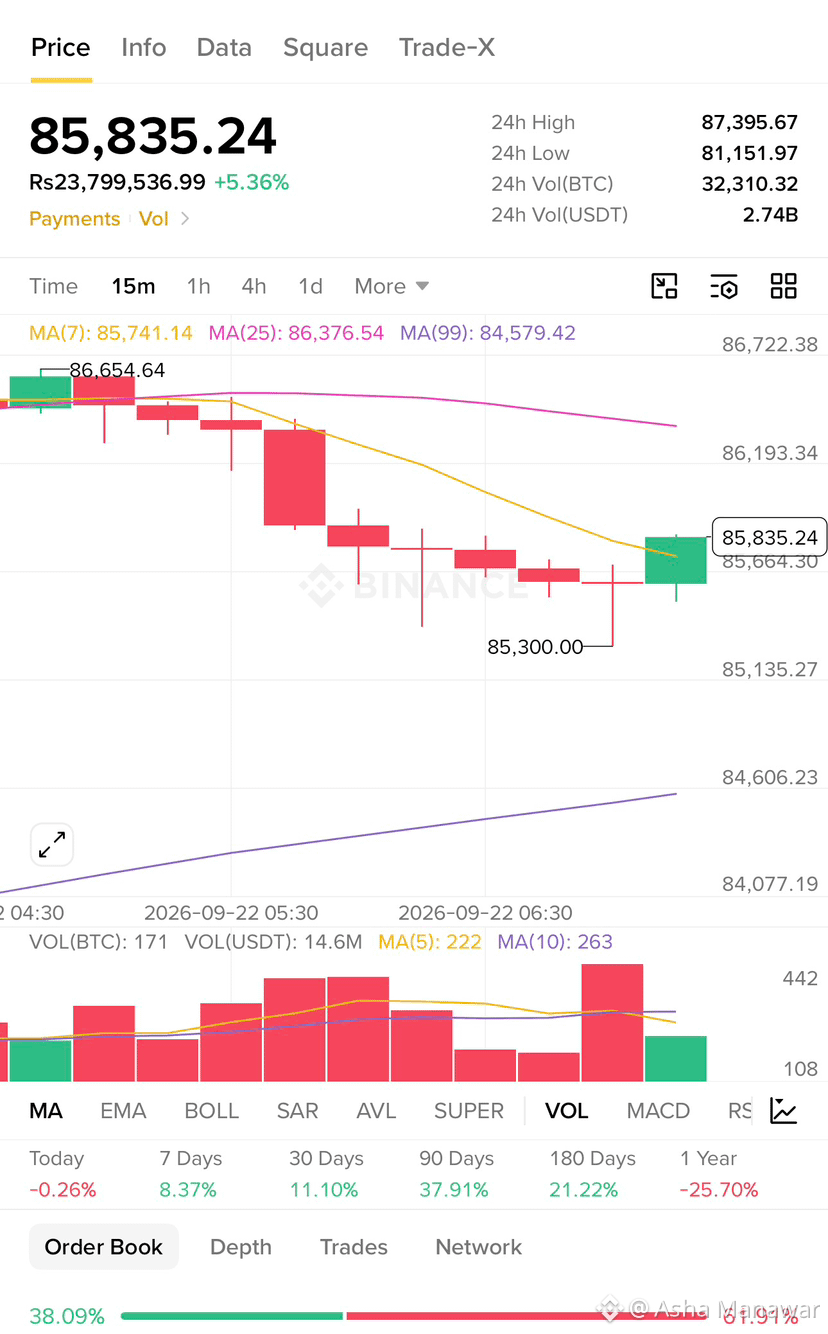
Guys, need your attention! $BTC is trading close to $86,000 now, with a wick over $86,300, which is great. We almost got the level I shared earlier today!!! Almost all the liquidations are finished overhead. Any move higher from here will be a bonus for us. Close in your stop-losses just under $85,000 and let it ride with the partials locked in. Also, if it suits you, you can take more partials here! But still structure on BTC is really agreesive for another run! Stay sharp with the longs a sqeeze can be their anytime… So, what’s my next plan here? We have been long on TAO, HYPE, $ADA , ENA, RENDER, INJ, ETHFI, SOL which ate the running trade except the ETHFI trade, which hit the SL today. And yes, just now I opened a SUIshort. What’s the next plan? Almost each of them got the target, and you guys must have locked in the partials. For the $SUI short, the reason is firstly a rejection from a weekly resistance. So if in case we got a sharp drop we have one short to enjoy that opportunity also sl is tigh in it which if doent favour will take that small sl and continue with the long trades…It’s a scalp, so take the gains on a solid move. So the smart way is to lock in the gains, at least 50%, and let the SL move with the candles. keep under the 2 one hour candles! Don’t worry if it takes the SL. We are ready with the next move to ride on!! Remember, while riding the wave, it is necessary to lock in gains and trail SL in a smart way!! {future}(BTCUSDT) {future}(SUIUSDT) {future}(ADAUSDT) #NEARRisesNearly80%InAWeek #MultiversXPlansHardForkRecovery #SouthAfricaProposesCryptoExchangeControls #BitcoinHits$85K
Guys, need your attention! $BTC is trading close to $86,000 now, with a wick over $86,300, which is great. We almost got the level I shared earlier today!!!
Almost all the liquidations are finished overhead. Any move higher from here will be a bonus for us. Close in your stop-losses just under $85,000 and let it ride with the partials locked in. Also, if it suits you, you can take more partials here! But still structure on BTC is really agreesive for another run!
Stay sharp with the longs a sqeeze can be their anytime…
So, what’s my next plan here?

We have been long on TAO, HYPE, $ADA , ENA, RENDER, INJ, ETHFI, SOL which ate the running trade except the ETHFI trade, which hit the SL today. And yes, just now I opened a SUIshort.

What’s the next plan? Almost each of them got the target, and you guys must have locked in the partials.

For the $SUI short, the reason is firstly a rejection from a weekly resistance. So if in case we got a sharp drop we have one short to enjoy that opportunity also sl is tigh in it which if doent favour will take that small sl and continue with the long trades…It’s a scalp, so take the gains on a solid move. So the smart way is to lock in the gains, at least 50%, and let the SL move with the candles.
keep under the 2 one hour candles!
Don’t worry if it takes the SL. We are ready with the next move to ride on!!

Remember, while riding the wave, it is necessary to lock in gains and trail SL in a smart way!!


#NEARRisesNearly80%InAWeek #MultiversXPlansHardForkRecovery #SouthAfricaProposesCryptoExchangeControls #BitcoinHits$85K
Arianne Glandon ovKr:
93 coming just wait
Article
BTC IS PUMPING… BUT THE MACRO PICTURE LOOKS BAD 👀This is one of those moments in crypto where you have to stop and ask: “Wait… why is Bitcoin going up?” The Fed just raised rates. Inflation is still a concern. Oil is still elevated. And borrowing money isn't exactly getting cheaper. Yet Bitcoin has pushed back above $85K. 🔥 So what's driving the move? It looks like several things are happening at the same time. 📈 1. Bitcoin broke higher BTC recovered sharply from around $75K and pushed through important resistance. Once that happened, traders who were positioned for another drop started getting squeezed. 🔥 2. Short sellers got caught This is a big one. Hundreds of millions of dollars in crypto shorts were liquidated as BTC moved higher. And liquidations can create a chain reaction: BTC rises → shorts get liquidated → forced buying → BTC rises again. Suddenly, the move becomes much bigger than anyone expected. 🛢️ 3. Oil is cooling Oil prices have pulled back, taking some pressure off inflation expectations. At the same time, Treasury yields have eased. That's giving risk assets — including crypto — a little more breathing room. 🇺🇸 4. Stocks are also moving higher The S&P 500 and Nasdaq rallied today, with technology and semiconductor stocks leading the move. Crypto doesn't trade in isolation. When investors become more comfortable taking risk across markets, Bitcoin can benefit too. But here's what I'm watching 👀 Can BTC hold these levels after the short squeeze is over? That's the real test. A rally driven mostly by liquidations can disappear quickly. But if we start seeing sustained spot buying and BTC continues holding above the breakout zone, the story becomes much more interesting. For now, the market is basically saying: “Macro looks messy… but traders are buying anyway.” And honestly, that's what makes this move so interesting. Do you think BTC is starting a bigger move, or are we just watching a massive short squeeze? 👇 #BitcoinHits$85K $BTC {spot}(BTCUSDT)

BTC IS PUMPING… BUT THE MACRO PICTURE LOOKS BAD 👀

This is one of those moments in crypto where you have to stop and ask:
“Wait… why is Bitcoin going up?”
The Fed just raised rates.
Inflation is still a concern.
Oil is still elevated.
And borrowing money isn't exactly getting cheaper.
Yet Bitcoin has pushed back above $85K. 🔥
So what's driving the move?
It looks like several things are happening at the same time.
📈 1. Bitcoin broke higher
BTC recovered sharply from around $75K and pushed through important resistance.
Once that happened, traders who were positioned for another drop started getting squeezed.
🔥 2. Short sellers got caught
This is a big one.
Hundreds of millions of dollars in crypto shorts were liquidated as BTC moved higher.
And liquidations can create a chain reaction:
BTC rises → shorts get liquidated → forced buying → BTC rises again.
Suddenly, the move becomes much bigger than anyone expected.
🛢️ 3. Oil is cooling
Oil prices have pulled back, taking some pressure off inflation expectations.
At the same time, Treasury yields have eased.
That's giving risk assets — including crypto — a little more breathing room.
🇺🇸 4. Stocks are also moving higher
The S&P 500 and Nasdaq rallied today, with technology and semiconductor stocks leading the move.
Crypto doesn't trade in isolation.
When investors become more comfortable taking risk across markets, Bitcoin can benefit too.
But here's what I'm watching 👀
Can BTC hold these levels after the short squeeze is over?
That's the real test.
A rally driven mostly by liquidations can disappear quickly.
But if we start seeing sustained spot buying and BTC continues holding above the breakout zone, the story becomes much more interesting.
For now, the market is basically saying:
“Macro looks messy… but traders are buying anyway.”
And honestly, that's what makes this move so interesting.
Do you think BTC is starting a bigger move, or are we just watching a massive short squeeze? 👇
#BitcoinHits$85K $BTC
ILHAM_SIREGAR:
T a i kau sell terus bujang
·
--
Bullish
Bitcoin Up or Down on September 22?

Bitcoin Up or Down on September 22?

31%Up68%Down
Volume $45,661.28
ابوالعز1123:
تحليل ممتاز يا Wyatt، وانت كنت دقيق جداً، $BTC فعلاً لمس 85,000 كحد أدنى زي ما قولت ودلوقتي راجع من 86 لـ 85,418 ودي حركة صحية لإعادة اختبار النمط. اتفق معاك ان اللمسة دي تعتبر نتيجة ضعيفة، والهدف الثابت اللي انت محدده 88,600 - 92,220 منطقي جداً كمنطقة سيولة، و 97,637 هدف ممتد لو كسرنا 92,220 بفوليوم. أنا شايف التصويت 68% Down ده معناه خوف زايد وده عادة إشارة انعكاس قريب. سؤال: هل شايف اننا هنعمل Higher Low عند 85,000 قبل الانطلاق لـ 88,600 ولا ممكن ننزل نختبر 84,200 الأول؟ متابعك.
·
--
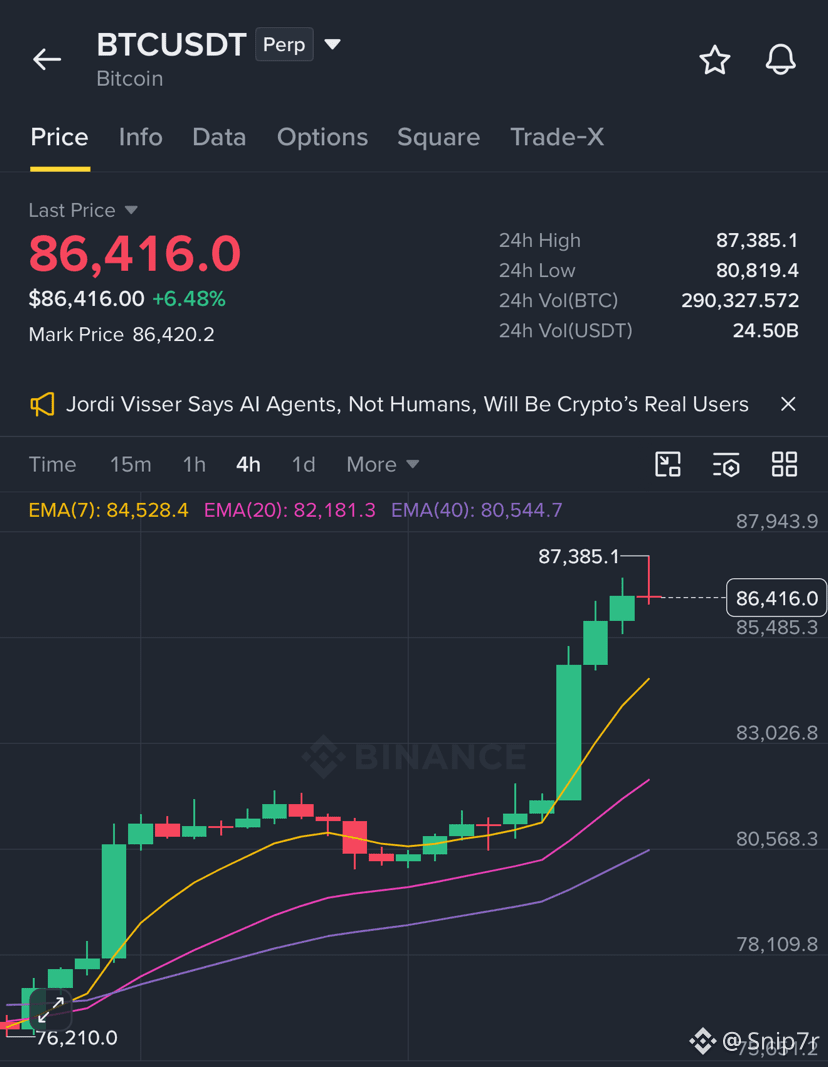
$BTC approaches $90K, but sellers are pushing back near $87,385. At $86,416, BTC needs another $3,584 to reach $90K. The $2,615 gap was from the recent high. The upper wick signals rejection, while 4H RSI near 86 shows stretched momentum. Buyers need to clear $87,385 and hold the retest before targeting $90K. Watch support near $85,500. Losing support raises pullback risk. #BitcoinHits$85K
$BTC approaches $90K, but sellers are pushing back near $87,385.

At $86,416, BTC needs another $3,584 to reach $90K. The $2,615 gap was from the recent high.

The upper wick signals rejection, while 4H RSI near 86 shows stretched momentum. Buyers need to clear $87,385 and hold the retest before targeting $90K.

Watch support near $85,500. Losing support raises pullback risk.
#BitcoinHits$85K
Feed-Creator-7e4e40fd7:
It is not gonna exceed 87.4 where we have a bb middle, of course nobody knows what will happen in the future but this is my guess
#BitcoinHits$85K 🚨 Bitcoin Hits $85K AFTER THE MICHAEL SAYLOR SIGNAL 🚨 Sunday looked quiet. Then Michael Saylor posted four words: “A little more orange.” By Monday, Bitcoin was pushing through $85,000 and the market was watching closely. The message mattered because Saylor’s orange chart tracks Strategy’s Bitcoin purchases. It was a signal, not confirmation, but the timing immediately revived speculation that another acquisition was coming. Then came the price move. Bitcoin climbed to an intraday high around $85,166, its strongest level since January, while short liquidations and improving risk sentiment added fuel to the rally. The bigger development is Strategy itself. The company has now disclosed another 950 BTC purchase for about $75.7 million, taking its holdings back to 846,000 BTC. But one distinction matters: Saylor’s post did not cause Bitcoin to rise by itself. ETF demand, regulatory developments, broader risk sentiment and short covering were also part of the market backdrop. My takeaway: the signal grabbed attention, but the real story is the combination of corporate accumulation and renewed market liquidity. When a signal becomes a transaction, the market starts listening differently. ❓Do you think Saylor’s signals still influence Bitcoin sentiment, or is the market now bigger than one buyer? Disclaimer: Educational content only, not financial advice. #Bitcoin #Crypto #GrowWithSAC $BTC $SAGA $FTT
#BitcoinHits$85K
🚨 Bitcoin Hits $85K AFTER THE MICHAEL SAYLOR SIGNAL 🚨

Sunday looked quiet. Then Michael Saylor posted four words: “A little more orange.” By Monday, Bitcoin was pushing through $85,000 and the market was watching closely.

The message mattered because Saylor’s orange chart tracks Strategy’s Bitcoin purchases. It was a signal, not confirmation, but the timing immediately revived speculation that another acquisition was coming.

Then came the price move. Bitcoin climbed to an intraday high around $85,166, its strongest level since January, while short liquidations and improving risk sentiment added fuel to the rally.

The bigger development is Strategy itself. The company has now disclosed another 950 BTC purchase for about $75.7 million, taking its holdings back to 846,000 BTC.

But one distinction matters: Saylor’s post did not cause Bitcoin to rise by itself. ETF demand, regulatory developments, broader risk sentiment and short covering were also part of the market backdrop.

My takeaway: the signal grabbed attention, but the real story is the combination of corporate accumulation and renewed market liquidity.

When a signal becomes a transaction, the market starts listening differently.

❓Do you think Saylor’s signals still influence Bitcoin sentiment, or is the market now bigger than one buyer?

Disclaimer: Educational content only, not financial advice.

#Bitcoin #Crypto #GrowWithSAC $BTC $SAGA $FTT
AI Radar:
$WLD Keeps Advancing.
·
--
Bullish
$BTC rocked the move today, guys! 6.89% move, and the total crypto market cap is now standing over $2.9 trillion, with an inflow of $160,000,000,000 in the last 24 hours! TPs smashed at $83,200, $84,600, and $86,100, with BTC now trading above $86,800! Now, my eyes are on the MA 100 at $89,540, while the psychological resistance at $87,000 is the next level to watch. Is BTC going to break through this resistance? I want to see it. But before that, I’m closing 70% of my BTC long now. I’ll keep the rest running with the SL at $85,000. I’m not going to risk what I’ve already gained. After a breakthrough, we’ll get another entry! If anybody is in on my call, take your maximum gains and secure what you’ve got. Hurry up, guys! Drop a like for the call and rate the todays setup guys!! With all of that $SOL 118$ and $TAO over 294$ 💫💫💫 a resistance zone lets watch what we get next, stay tunned for the next post guys!! {future}(BTCUSDT) {future}(TAOUSDT) {future}(SOLUSDT) #NEARRisesNearly80%InAWeek #MultiversXPlansHardForkRecovery #CircleLaunchesInstitutionalBTCBackedBorrowing #BitcoinHits$85K #EthereumSurpasses$2700
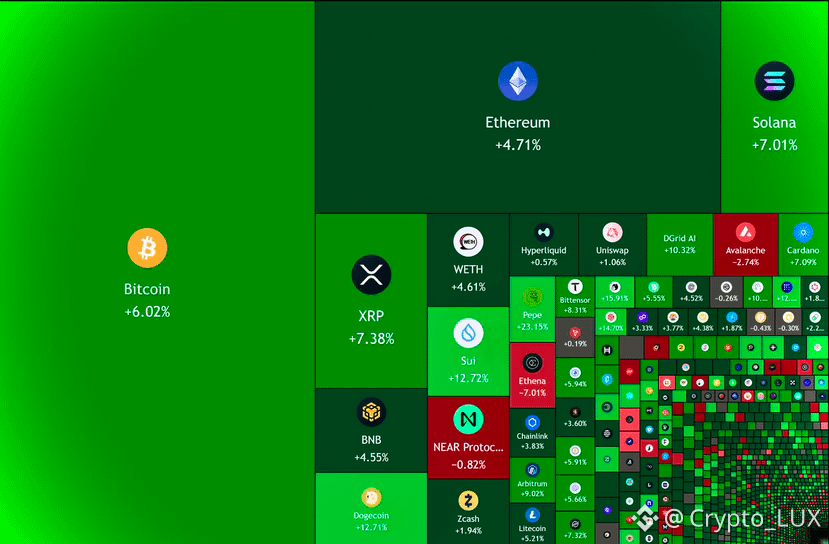
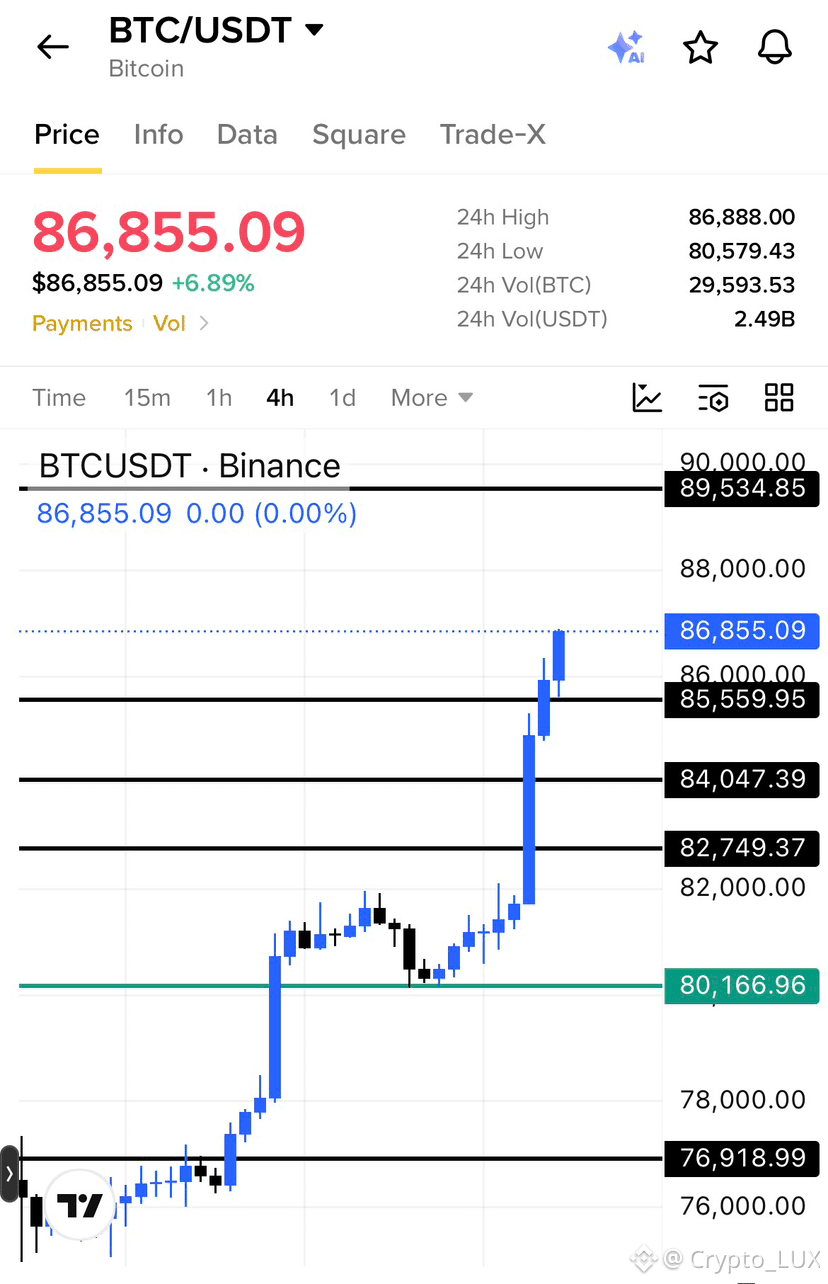
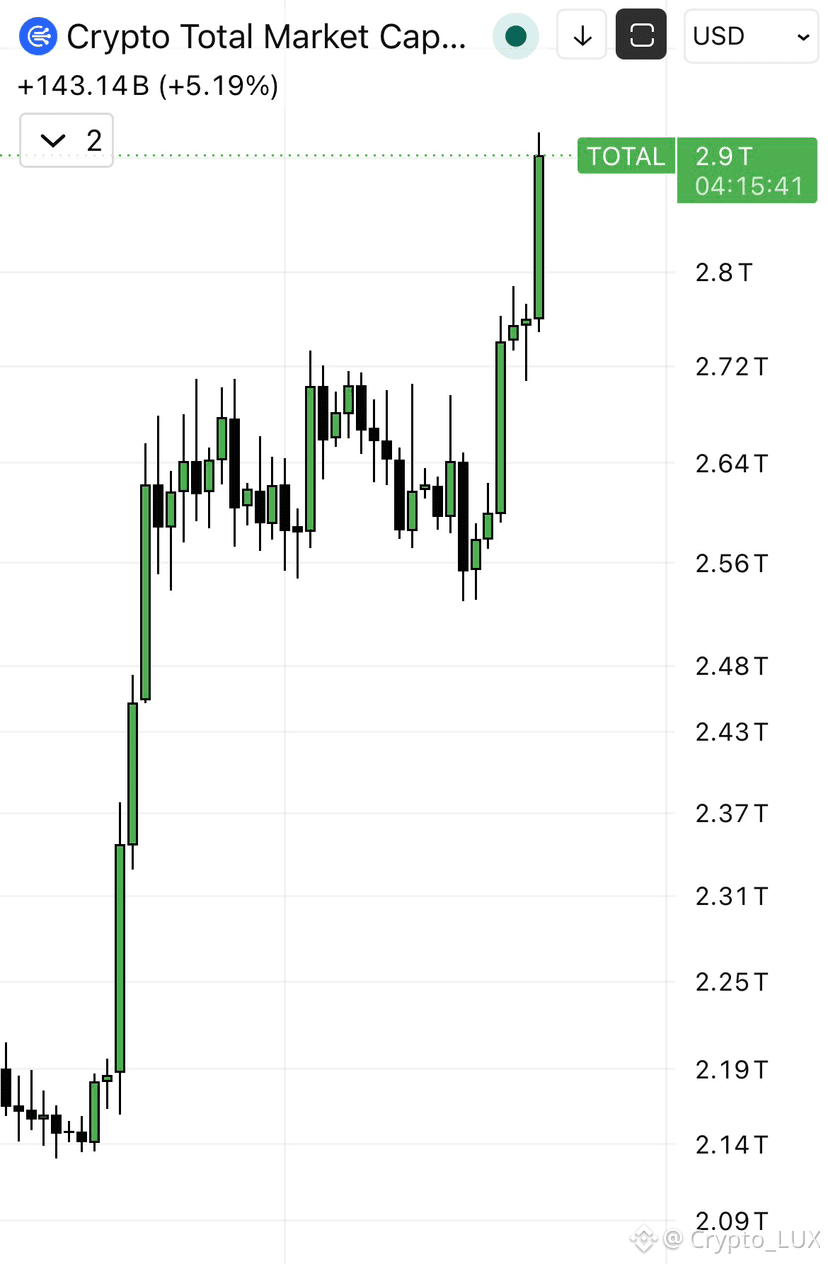
$BTC rocked the move today, guys! 6.89% move, and the total crypto market cap is now standing over $2.9 trillion, with an inflow of $160,000,000,000 in the last 24 hours!

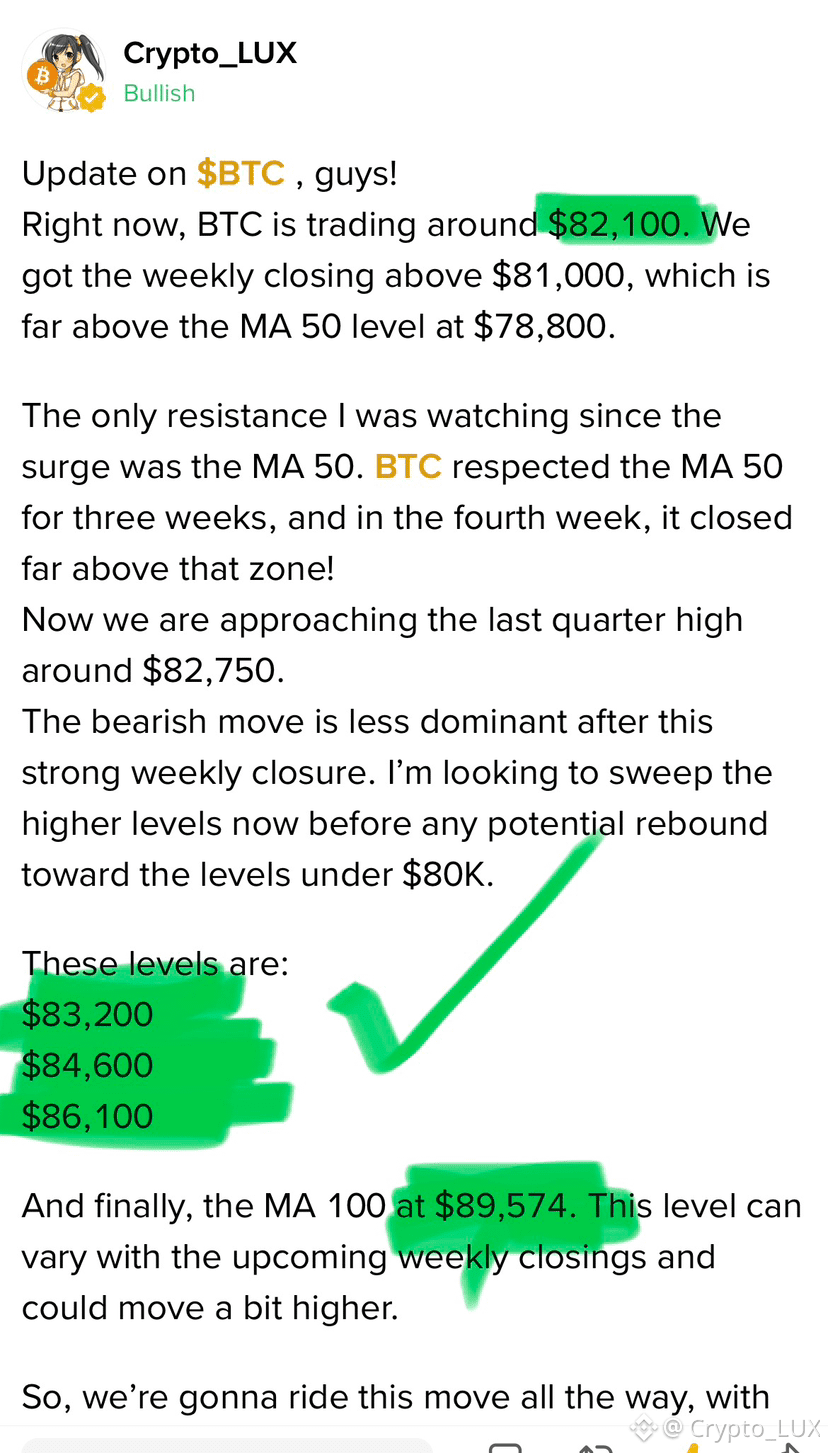
TPs smashed at $83,200, $84,600, and $86,100, with BTC now trading above $86,800!
Now, my eyes are on the MA 100 at $89,540, while the psychological resistance at $87,000 is the next level to watch. Is BTC going to break through this resistance? I want to see it.

But before that, I’m closing 70% of my BTC long now. I’ll keep the rest running with the SL at $85,000. I’m not going to risk what I’ve already gained. After a breakthrough, we’ll get another entry!
If anybody is in on my call, take your maximum gains and secure what you’ve got. Hurry up, guys!

Drop a like for the call and rate the todays setup guys!!

With all of that $SOL 118$ and $TAO over 294$ 💫💫💫 a resistance zone lets watch what we get next, stay tunned for the next post guys!!


#NEARRisesNearly80%InAWeek #MultiversXPlansHardForkRecovery #CircleLaunchesInstitutionalBTCBackedBorrowing #BitcoinHits$85K #EthereumSurpasses$2700
Binance BiBi:
Working on it. Your reply is on the way.
Article
🚀 BTC Holding the Line: Is $86K the Launchpad for Bitcoin's Next Leg Up?Bitcoin is trading around $86,558, up modestly over the last 24 hours as the market digests recent volatility. That puts BTC roughly 31% below its all-time high of $126,080, with the total market cap sitting near $1.75 trillion — still comfortably the #1 crypto asset by a wide margin. Quick Snapshot: 📊 Price: ~$86,558 📈 24h Change: +0.68% 🏆 Rank: #1 💰 Market Cap: ~$1.75T 🔺 ATH: $126,080 After pulling back from six-figure territory, Bitcoin appears to be consolidating rather than collapsing — a pattern long-term holders have seen before every major leg up. On-chain and macro conditions remain the key variables to watch this week. What's next for $BTC ? Will Bitcoin reclaim $100K before year-end, or is more consolidation ahead? Drop your prediction below 👇 #BitcoinHits$85K #bitcoin #BTC #crypto #BinanceSquare

🚀 BTC Holding the Line: Is $86K the Launchpad for Bitcoin's Next Leg Up?

Bitcoin is trading around $86,558, up modestly over the last 24 hours as the market digests recent volatility. That puts BTC roughly 31% below its all-time high of $126,080, with the total market cap sitting near $1.75 trillion — still comfortably the #1 crypto asset by a wide margin.
Quick Snapshot:
📊 Price: ~$86,558
📈 24h Change: +0.68%
🏆 Rank: #1
💰 Market Cap: ~$1.75T
🔺 ATH: $126,080
After pulling back from six-figure territory, Bitcoin appears to be consolidating rather than collapsing — a pattern long-term holders have seen before every major leg up. On-chain and macro conditions remain the key variables to watch this week.
What's next for $BTC ?
Will Bitcoin reclaim $100K before year-end, or is more consolidation ahead? Drop your prediction below 👇
#BitcoinHits$85K
#bitcoin #BTC #crypto #BinanceSquare
Devil9:
@Devil92052 Tax in here (x-twitter)
Article
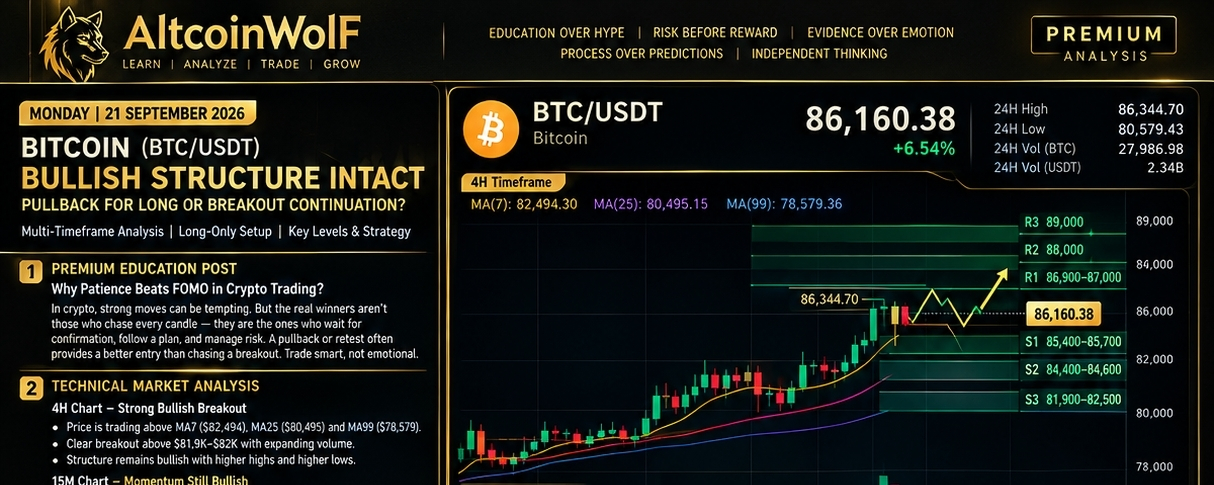
Bitcoin Bullish Structure Is Intact — But Should You Buy the Pullback or Chase the Breakout?Bitcoin has delivered the kind of move that immediately attracts attention. BTC climbed from the $80K area toward $86,344, while both the 4H and 15M charts continue to show a strong bullish structure. But this is exactly where traders need to slow down. A strong move does not automatically mean a strong entry. When price is already near a fresh local high, the key question is no longer “Is Bitcoin bullish?” The better question is: Where can a long position be entered with controlled risk? Today’s AltcoinWolF analysis focuses on that question. Premium Education Post: Why Patience Beats FOMO One of the biggest mistakes traders make during strong rallies is buying simply because candles are moving quickly. The market can remain bullish while still producing a short-term pullback. That distinction matters. A disciplined trader separates: Market direction from Entry timing. Bitcoin's current structure is bullish, but the better opportunity may come from either: A controlled pullback into support, or A confirmed breakout above the current high followed by a retest. The goal is not to predict every candle. The goal is to wait for the market to provide evidence. 📊 Bitcoin Technical Market Analysis 4H Timeframe — Strong Bullish Breakout The 4H chart remains clearly constructive. Current price is around $86,160, while the moving averages are: MA7: $82,494 MA25: $80,495 MA99: $78,579 Price is trading significantly above all three averages. More importantly, the recent structure shows: Higher highs Higher lows Strong bullish candles Breakout from the previous consolidation Noticeable volume expansion The $81.9K–$82.5K region has now become an important structural area to monitor. As long as the broader structure remains intact, the 4H trend continues to favor the upside. 15M Timeframe — Momentum Remains Bullish The short-term chart is also aligned with the higher timeframe. Current moving averages: MA7: $85,965 MA25: $85,189 MA99: $82,442 The alignment remains bullish: MA7 > MA25 > MA99 Price is also holding above the short-term averages. However, BTC is currently close to the $86,344.70 high, meaning immediate resistance is nearby. This makes chasing the current candle less attractive than waiting for confirmation. 🎯 Premium Trade Setup 🟢 Setup A — Pullback Long Preferred setup Entry Zone: $85,600–$85,950 The setup becomes more attractive if BTC returns to this area and produces: Bullish rejection Higher low 15M bullish candle confirmation MA7 support/reclaim Trade Levels Entry: $85,600–$85,950 Stop Loss: $84,950 TP1: $86,350 TP2: $87,200 TP3: $88,000 After TP1, traders can consider reducing risk and protecting the position rather than allowing a profitable trade to turn into a loss. 🚀 Setup B — Breakout Long The second possibility is continuation. If BTC produces a confirmed 15M close above $86,350 and successfully retests the breakout zone: Entry: $86,350–$86,550 SL: $85,650 Targets TP1: $87,200 TP2: $88,000 TP3: $89,000 The key word here is confirmed. A temporary wick above $86,350 is not enough. We want: Breakout → Close → Retest → Hold → Continuation 🛡️ Confirmation & Invalidation Confirmation A long setup becomes stronger when: 15M candle confirms the level BTC forms a higher low Volume supports the move Price maintains short-term MA structure Previous resistance turns into support Invalidation The immediate bullish setup becomes weaker if: 15M closes decisively below $85,450. A deeper loss of the $84,400–$84,600 support zone would further weaken the short-term bullish structure. The major 4H structural area remains around $81,900–$82,500. 🧭 Key BTC Levels Support S1: $85,400–$85,700 S2: $84,400–$84,600 S3: $81,900–$82,500 Resistance R1: $86,350 R2: $86,900–$87,000 R3: $88,000 R4: $89,000+ 🔮 Scenario Analysis 🟢 Bullish Scenario BTC holds above the $85.4K area and either: A) Pulls back → forms higher low → resumes upward or B) Breaks $86,350 → confirms above it → retests → continues higher. Potential upside areas: $87,200 → $88,000 → $89,000 🔴 Bearish / Invalidated Scenario If BTC loses $85,450 with decisive 15M weakness, the immediate long setup loses strength. A deeper move through $84,400–$84,600 would suggest that the market needs a larger reset before another continuation attempt. This does not automatically mean a trend reversal; it means the current long thesis requires reassessment. 📊 AltcoinWolF Market Scorecard Factor Reading 4H Trend 🟢 Bullish 15M Trend 🟢 Bullish Moving Averages 🟢 Bullish Breakout Structure 🟢 Positive Volume 🟢 Expanded Immediate Resistance 🟡 $86,350 Entry Risk 🟡 Avoid FOMO Long Bias 🟢 Active 🎯 Final Call Bitcoin's structure remains bullish across both analyzed timeframes. But the strongest lesson from today's chart is simple: Don't confuse bullish momentum with an invitation to chase. The preferred approach is to wait for either: $85,600–$85,950 pullback + bullish confirmation or $86,350 breakout + 15M close + successful retest. The market does not reward the trader who enters first. It rewards the trader who manages risk when the setup appears. Trade smarter. Move faster. Stay ahead. 📊 Follow AltcoinWolF for high-conviction setups, precision entries, and market-leading crypto insights. 🐺⚡ The market rewards patience, not emotions. Wait for confirmation, protect your capital, and let the charts lead the way. — AltcoinWolF Educational market analysis only. No setup guarantees profit. Always manage position size and risk according to your own strategy. #BitcoinHits$85K #BTC走势分析 #BTC☀️ #bitcoin #AltcoinWolF $BTC {spot}(BTCUSDT)

Bitcoin Bullish Structure Is Intact — But Should You Buy the Pullback or Chase the Breakout?

Bitcoin has delivered the kind of move that immediately attracts attention.
BTC climbed from the $80K area toward $86,344, while both the 4H and 15M charts continue to show a strong bullish structure.
But this is exactly where traders need to slow down.
A strong move does not automatically mean a strong entry.
When price is already near a fresh local high, the key question is no longer “Is Bitcoin bullish?”
The better question is:
Where can a long position be entered with controlled risk?
Today’s AltcoinWolF analysis focuses on that question.
Premium Education Post: Why Patience Beats FOMO
One of the biggest mistakes traders make during strong rallies is buying simply because candles are moving quickly.
The market can remain bullish while still producing a short-term pullback.
That distinction matters.
A disciplined trader separates:
Market direction
from
Entry timing.
Bitcoin's current structure is bullish, but the better opportunity may come from either:
A controlled pullback into support, or
A confirmed breakout above the current high followed by a retest.
The goal is not to predict every candle.
The goal is to wait for the market to provide evidence.
📊 Bitcoin Technical Market Analysis
4H Timeframe — Strong Bullish Breakout
The 4H chart remains clearly constructive.
Current price is around $86,160, while the moving averages are:
MA7: $82,494
MA25: $80,495
MA99: $78,579
Price is trading significantly above all three averages.
More importantly, the recent structure shows:
Higher highs
Higher lows
Strong bullish candles
Breakout from the previous consolidation
Noticeable volume expansion
The $81.9K–$82.5K region has now become an important structural area to monitor.
As long as the broader structure remains intact, the 4H trend continues to favor the upside.
15M Timeframe — Momentum Remains Bullish
The short-term chart is also aligned with the higher timeframe.
Current moving averages:
MA7: $85,965
MA25: $85,189
MA99: $82,442
The alignment remains bullish:
MA7 > MA25 > MA99
Price is also holding above the short-term averages.
However, BTC is currently close to the $86,344.70 high, meaning immediate resistance is nearby.
This makes chasing the current candle less attractive than waiting for confirmation.
🎯 Premium Trade Setup
🟢 Setup A — Pullback Long
Preferred setup
Entry Zone: $85,600–$85,950
The setup becomes more attractive if BTC returns to this area and produces:
Bullish rejection
Higher low
15M bullish candle confirmation
MA7 support/reclaim
Trade Levels
Entry: $85,600–$85,950
Stop Loss: $84,950
TP1: $86,350
TP2: $87,200
TP3: $88,000
After TP1, traders can consider reducing risk and protecting the position rather than allowing a profitable trade to turn into a loss.
🚀 Setup B — Breakout Long
The second possibility is continuation.
If BTC produces a confirmed 15M close above $86,350 and successfully retests the breakout zone:
Entry: $86,350–$86,550
SL: $85,650
Targets
TP1: $87,200
TP2: $88,000
TP3: $89,000
The key word here is confirmed.
A temporary wick above $86,350 is not enough.
We want:
Breakout → Close → Retest → Hold → Continuation
🛡️ Confirmation & Invalidation
Confirmation
A long setup becomes stronger when:
15M candle confirms the level
BTC forms a higher low
Volume supports the move
Price maintains short-term MA structure
Previous resistance turns into support
Invalidation
The immediate bullish setup becomes weaker if:
15M closes decisively below $85,450.
A deeper loss of the $84,400–$84,600 support zone would further weaken the short-term bullish structure.
The major 4H structural area remains around $81,900–$82,500.
🧭 Key BTC Levels
Support
S1: $85,400–$85,700
S2: $84,400–$84,600
S3: $81,900–$82,500
Resistance
R1: $86,350
R2: $86,900–$87,000
R3: $88,000
R4: $89,000+
🔮 Scenario Analysis
🟢 Bullish Scenario
BTC holds above the $85.4K area and either:
A) Pulls back → forms higher low → resumes upward
or
B) Breaks $86,350 → confirms above it → retests → continues higher.
Potential upside areas:
$87,200 → $88,000 → $89,000
🔴 Bearish / Invalidated Scenario
If BTC loses $85,450 with decisive 15M weakness, the immediate long setup loses strength.
A deeper move through $84,400–$84,600 would suggest that the market needs a larger reset before another continuation attempt.
This does not automatically mean a trend reversal; it means the current long thesis requires reassessment.
📊 AltcoinWolF Market Scorecard
Factor
Reading
4H Trend
🟢 Bullish
15M Trend
🟢 Bullish
Moving Averages
🟢 Bullish
Breakout Structure
🟢 Positive
Volume
🟢 Expanded
Immediate Resistance
🟡 $86,350
Entry Risk
🟡 Avoid FOMO
Long Bias
🟢 Active
🎯 Final Call
Bitcoin's structure remains bullish across both analyzed timeframes.
But the strongest lesson from today's chart is simple:
Don't confuse bullish momentum with an invitation to chase.
The preferred approach is to wait for either:
$85,600–$85,950 pullback + bullish confirmation
or
$86,350 breakout + 15M close + successful retest.
The market does not reward the trader who enters first.
It rewards the trader who manages risk when the setup appears.
Trade smarter. Move faster. Stay ahead.
📊 Follow AltcoinWolF for high-conviction setups, precision entries, and market-leading crypto insights. 🐺⚡
The market rewards patience, not emotions. Wait for confirmation, protect your capital, and let the charts lead the way.
— AltcoinWolF
Educational market analysis only. No setup guarantees profit. Always manage position size and risk according to your own strategy.
#BitcoinHits$85K #BTC走势分析 #BTC☀️ #bitcoin #AltcoinWolF $BTC
·
--
Bearish
Bitcoin has pushed above $85,000, up around 5–6% in 24 hours, showing strong short-term momentum. Key levels to watch: * 🟢 Support: $83,700–$84,000 * 🔥 Resistance: $85,200–$85,500 * 🚀 Next major resistance: ~$86,200 * 🎯 If momentum continues, $90,000+ becomes an important area. * ⚠️ $BTC is technically stretched/overbought in the short term, so a pullback or consolidation is possible. #BitcoinHits$85K #EthereumSurpasses$2700 #AIStocksWhatNext {spot}(BTCUSDT)
Bitcoin has pushed above $85,000, up around 5–6% in 24 hours, showing strong short-term momentum.

Key levels to watch:

* 🟢 Support: $83,700–$84,000
* 🔥 Resistance: $85,200–$85,500
* 🚀 Next major resistance: ~$86,200
* 🎯 If momentum continues, $90,000+ becomes an important area.
* ⚠️ $BTC is technically stretched/overbought in the short term, so a pullback or consolidation is possible.
#BitcoinHits$85K #EthereumSurpasses$2700
#AIStocksWhatNext
Article
Bitcoin Breaks $85K as Short Squeeze Meets a New Macro TestBitcoin entered the week with its strongest move in months, climbing above $85,000 on September 21 and reaching an intraday high around $85,166, its highest level since January. The move came after BTC reclaimed the $80,000–$82,000 area and followed its first weekly close above the 50-week moving average in 45 weeks. The important question now is not simply whether Bitcoin can keep moving higher. It is whether the rally can transition from short-covering into sustained spot demand while BTC enters a major holder supply zone and macro conditions remain complicated. $85K Breakout Was Powerful, But Leverage Did Much of the Work The latest move was accompanied by a major derivatives flush. CoinGlass data reported by The Block showed more than $750 million in crypto liquidations over 24 hours, including approximately $648.3 million in short positions. Bitcoin alone accounted for about $360.7 million of liquidations. On the shorter one-hour window, more than $262 million of shorts were liquidated as BTC crossed $84,000, while total crypto liquidations reached roughly $272 million. That matters because forced buying can accelerate a breakout without necessarily proving that fresh investors are aggressively accumulating at spot. There is evidence of genuine demand as well. U.S. spot Bitcoin ETFs recorded about $433 million of net inflows on September 18, with Fidelity's fund accounting for roughly $311 million. So the current setup is mixed: ETF demand has returned, but leverage-driven buying has also been a major part of the move. Long-Term Holders Are Selling Less as BTC Enters the $83K–$86K Zone Another important change is happening on the supply side. Recent on-chain analysis cited by Binance News shows that Bitcoin held by long-term holders has declined for five consecutive weeks since August 19, but the pace of distribution has slowed sharply. The figures circulating in the latest market analysis put LTH net distribution at roughly 105,900 BTC on August 30 versus 21,700 BTC on September 20, representing an approximately 80% reduction in the pace of selling. That slowdown is important because BTC is now moving through the $83,000–$86,000 area identified as a significant long-term-holder supply concentration. If holders who bought around these levels use the recovery to exit at breakeven, the zone could create additional supply. On the other hand, if BTC absorbs that supply without another major distribution wave, the market structure becomes more interesting. The distinction is simple: Breaking $85K is the price signal. Holding $85K against existing holder supply is the confirmation signal. Hashrate Is Recovering, But Miners Are Still Lagging Bitcoin Bitcoin's network economics are also changing as price rises. A move from roughly $75,000 to $85,000 represents a 13% increase in BTC's price, improving miner revenue per unit of computing power before accounting for difficulty changes. The hashrate recovery therefore makes economic sense: higher BTC prices can bring marginal mining machines back toward profitability. But mining equities have not matched Bitcoin's performance. The Block reported that the median return among tracked Bitcoin mining companies was only 1.8%, while Core Scientific underperformed Bitcoin by 27% and TeraWulf by 24%. AI data-center ambitions and the capital requirements of those businesses have complicated the relationship between mining stocks and BTC itself. There is also a natural limit. Bitcoin's difficulty adjusts approximately every two weeks, so if hashrate continues increasing without a comparable BTC price increase, competition for block rewards increases and revenue per unit of computing power is compressed. Technically, the next major level being watched is around $89,000, close to the 100-week moving average cited by market analysts. The Macro Picture Is Still Far From Easy Bitcoin's rally is happening while the Federal Reserve remains concerned about inflation. Chicago Fed President Austan Goolsbee said September 21 that the Fed may need to respond with higher interest rates if strong demand is contributing to persistent inflation. He also emphasized that policymakers need evidence that supply shocks are actually fading before they can confidently return inflation to the 2% target. U.S. inflation was still 3.7% in July, according to his remarks reported by Reuters. That creates an unusual backdrop for risk assets. Oil prices have recently fallen, helping ease pressure on bond yields and risk sentiment. On September 21, Brent crude was around $101.20, down 2.6% on the day, while the U.S. 10-year Treasury yield had retreated to about 4.95%. But the inflation problem has not disappeared. The University of Michigan's preliminary September consumer-sentiment reading came in at 47.8, down from 51.7 in August and 55.1 a year earlier. One-year inflation expectations also rose to 4.6% from 4.0%. The final September survey is scheduled for September 25. So BTC is climbing while the macro data still carries significant inflation and rate risk. Treasury Buybacks Add Another Layer to the Market Treasury Secretary Scott Bessent has defended the government's bond-buyback program, describing the recent $6 billion operation as successful. The debate is focused on whether Treasury intervention can meaningfully improve market liquidity without masking underlying pressure from deficits, inflation and long-term yields. The long end remains important for Bitcoin because rising Treasury yields can tighten financial conditions and compete with risk assets for capital. For crypto traders, the key relationship is therefore not simply Fed vs. Bitcoin. Oil, inflation expectations, Treasury yields and liquidity are all feeding into the same risk-asset equation. SEC Opens a New Chapter for Tokenized Stocks One of the biggest structural developments this week comes from the U.S. Securities and Exchange Commission. On September 17, the SEC approved a temporary, conditional five-year Innovation Exemption allowing certain Tokenized Securities Venues to trade tokenized U.S. stocks on public blockchains under specified conditions. The framework requires tokenized stocks to provide holders with the same rights and privileges as the equivalent traditional shares, including dividend and voting rights. It also gives issuers an opportunity to object to third-party tokenization, while smart contracts used by qualifying venues must be auditable and publicly deployed on a permissionless blockchain. This is significant because tokenization is moving from an industry concept toward a regulated market experiment. The first practical trading window begins September 22, making this one of the most important crypto-market developments to watch this week. What Matters From Here? Bitcoin's move above $85,000 has changed the short-term structure, but the next phase depends on whether several signals confirm each other. BTC: $85K breakout, with ~$89K as the next major technical reference.Supply: $83K–$86K remains a key LTH holder zone.Leverage: More than $648M in crypto shorts were liquidated over 24 hours.ETF demand: About $433M of spot BTC ETF inflows were recorded on September 18.Macro: Goolsbee continues to leave the door open to higher rates if inflation remains persistent.Consumer data: September sentiment is at 47.8, with final data due September 25.Regulation: SEC's five-year conditional tokenization framework begins its practical rollout this week.Mining: Hashrate recovery is positive for network security, but rising difficulty can eventually pressure miner economics. The biggest market question now is whether $85K becomes a new base or simply another liquidity event created by short covering. If spot demand continues absorbing the $83K–$86K holder supply, the structure will look materially different from a rally driven mainly by liquidations. If demand fades while long-term holders begin distributing again, the breakout will face a very different test. For September 22–25, the combination of BTC's $85K hold, ETF flows, oil, Treasury yields, Goolsbee's comments and the SEC's tokenized-stock rollout may tell us more than the breakout itself. #BitcoinHits$85K #LearnWithFatima #bitcoin $BTC #BTC走势分析 {future}(BTCUSDT)

Bitcoin Breaks $85K as Short Squeeze Meets a New Macro Test

Bitcoin entered the week with its strongest move in months, climbing above $85,000 on September 21 and reaching an intraday high around $85,166, its highest level since January. The move came after BTC reclaimed the $80,000–$82,000 area and followed its first weekly close above the 50-week moving average in 45 weeks.
The important question now is not simply whether Bitcoin can keep moving higher. It is whether the rally can transition from short-covering into sustained spot demand while BTC enters a major holder supply zone and macro conditions remain complicated.
$85K Breakout Was Powerful, But Leverage Did Much of the Work
The latest move was accompanied by a major derivatives flush.
CoinGlass data reported by The Block showed more than $750 million in crypto liquidations over 24 hours, including approximately $648.3 million in short positions. Bitcoin alone accounted for about $360.7 million of liquidations.
On the shorter one-hour window, more than $262 million of shorts were liquidated as BTC crossed $84,000, while total crypto liquidations reached roughly $272 million.
That matters because forced buying can accelerate a breakout without necessarily proving that fresh investors are aggressively accumulating at spot.
There is evidence of genuine demand as well. U.S. spot Bitcoin ETFs recorded about $433 million of net inflows on September 18, with Fidelity's fund accounting for roughly $311 million.
So the current setup is mixed: ETF demand has returned, but leverage-driven buying has also been a major part of the move.
Long-Term Holders Are Selling Less as BTC Enters the $83K–$86K Zone
Another important change is happening on the supply side.
Recent on-chain analysis cited by Binance News shows that Bitcoin held by long-term holders has declined for five consecutive weeks since August 19, but the pace of distribution has slowed sharply.
The figures circulating in the latest market analysis put LTH net distribution at roughly 105,900 BTC on August 30 versus 21,700 BTC on September 20, representing an approximately 80% reduction in the pace of selling.
That slowdown is important because BTC is now moving through the $83,000–$86,000 area identified as a significant long-term-holder supply concentration.
If holders who bought around these levels use the recovery to exit at breakeven, the zone could create additional supply. On the other hand, if BTC absorbs that supply without another major distribution wave, the market structure becomes more interesting.
The distinction is simple:
Breaking $85K is the price signal.
Holding $85K against existing holder supply is the confirmation signal.
Hashrate Is Recovering, But Miners Are Still Lagging Bitcoin
Bitcoin's network economics are also changing as price rises.
A move from roughly $75,000 to $85,000 represents a 13% increase in BTC's price, improving miner revenue per unit of computing power before accounting for difficulty changes.
The hashrate recovery therefore makes economic sense: higher BTC prices can bring marginal mining machines back toward profitability.
But mining equities have not matched Bitcoin's performance. The Block reported that the median return among tracked Bitcoin mining companies was only 1.8%, while Core Scientific underperformed Bitcoin by 27% and TeraWulf by 24%. AI data-center ambitions and the capital requirements of those businesses have complicated the relationship between mining stocks and BTC itself.
There is also a natural limit. Bitcoin's difficulty adjusts approximately every two weeks, so if hashrate continues increasing without a comparable BTC price increase, competition for block rewards increases and revenue per unit of computing power is compressed.
Technically, the next major level being watched is around $89,000, close to the 100-week moving average cited by market analysts.
The Macro Picture Is Still Far From Easy
Bitcoin's rally is happening while the Federal Reserve remains concerned about inflation.
Chicago Fed President Austan Goolsbee said September 21 that the Fed may need to respond with higher interest rates if strong demand is contributing to persistent inflation. He also emphasized that policymakers need evidence that supply shocks are actually fading before they can confidently return inflation to the 2% target. U.S. inflation was still 3.7% in July, according to his remarks reported by Reuters.
That creates an unusual backdrop for risk assets.
Oil prices have recently fallen, helping ease pressure on bond yields and risk sentiment. On September 21, Brent crude was around $101.20, down 2.6% on the day, while the U.S. 10-year Treasury yield had retreated to about 4.95%.
But the inflation problem has not disappeared.
The University of Michigan's preliminary September consumer-sentiment reading came in at 47.8, down from 51.7 in August and 55.1 a year earlier. One-year inflation expectations also rose to 4.6% from 4.0%. The final September survey is scheduled for September 25.
So BTC is climbing while the macro data still carries significant inflation and rate risk.
Treasury Buybacks Add Another Layer to the Market
Treasury Secretary Scott Bessent has defended the government's bond-buyback program, describing the recent $6 billion operation as successful. The debate is focused on whether Treasury intervention can meaningfully improve market liquidity without masking underlying pressure from deficits, inflation and long-term yields.
The long end remains important for Bitcoin because rising Treasury yields can tighten financial conditions and compete with risk assets for capital.
For crypto traders, the key relationship is therefore not simply Fed vs. Bitcoin. Oil, inflation expectations, Treasury yields and liquidity are all feeding into the same risk-asset equation.
SEC Opens a New Chapter for Tokenized Stocks
One of the biggest structural developments this week comes from the U.S. Securities and Exchange Commission.
On September 17, the SEC approved a temporary, conditional five-year Innovation Exemption allowing certain Tokenized Securities Venues to trade tokenized U.S. stocks on public blockchains under specified conditions.
The framework requires tokenized stocks to provide holders with the same rights and privileges as the equivalent traditional shares, including dividend and voting rights. It also gives issuers an opportunity to object to third-party tokenization, while smart contracts used by qualifying venues must be auditable and publicly deployed on a permissionless blockchain.
This is significant because tokenization is moving from an industry concept toward a regulated market experiment.
The first practical trading window begins September 22, making this one of the most important crypto-market developments to watch this week.
What Matters From Here?
Bitcoin's move above $85,000 has changed the short-term structure, but the next phase depends on whether several signals confirm each other.
BTC: $85K breakout, with ~$89K as the next major technical reference.Supply: $83K–$86K remains a key LTH holder zone.Leverage: More than $648M in crypto shorts were liquidated over 24 hours.ETF demand: About $433M of spot BTC ETF inflows were recorded on September 18.Macro: Goolsbee continues to leave the door open to higher rates if inflation remains persistent.Consumer data: September sentiment is at 47.8, with final data due September 25.Regulation: SEC's five-year conditional tokenization framework begins its practical rollout this week.Mining: Hashrate recovery is positive for network security, but rising difficulty can eventually pressure miner economics.
The biggest market question now is whether $85K becomes a new base or simply another liquidity event created by short covering.
If spot demand continues absorbing the $83K–$86K holder supply, the structure will look materially different from a rally driven mainly by liquidations. If demand fades while long-term holders begin distributing again, the breakout will face a very different test.
For September 22–25, the combination of BTC's $85K hold, ETF flows, oil, Treasury yields, Goolsbee's comments and the SEC's tokenized-stock rollout may tell us more than the breakout itself.
#BitcoinHits$85K #LearnWithFatima
#bitcoin $BTC #BTC走势分析

·
--
Bullish
#BitcoinHits$85K Bitcoin Blows Past $85K! Is $100K Next Stop? 🚀 Bitcoin has officially broken through key resistance, pushing past $85,000 in a massive bullish impulse! With strong spot buying and momentum building across major indicators, BTC is reclaiming control of the chart. Traders are now setting their eyes on the next key liquidity zone above $86.5K as bulls aim for the six-figure $100,000 landmark. Key Takeaways: Broke Crucial Resistance: BTC cleared the persistent multi-month overhead ceiling with strong volume. Next Target: Short-term resistance lies near $86,500, with $100K standing as the ultimate psychological target. Momentum: Indicators highlight heavy momentum—watch for potential retests of support before the next leg up. Are you taking profits here, or holding out for $100K? Drop your prediction below! 👇 $BTC {future}(BTCUSDT) #CanaryFilesSecondAmendmentForStakedSEIETF #bitcoin
#BitcoinHits$85K
Bitcoin Blows Past $85K! Is $100K Next Stop? 🚀

Bitcoin has officially broken through key resistance, pushing past $85,000 in a massive bullish impulse!

With strong spot buying and momentum building across major indicators, BTC is reclaiming control of the chart. Traders are now setting their eyes on the next key liquidity zone above $86.5K as bulls aim for the six-figure $100,000 landmark.

Key Takeaways:

Broke Crucial Resistance: BTC cleared the persistent multi-month overhead ceiling with strong volume.

Next Target: Short-term resistance lies near $86,500, with $100K standing as the ultimate psychological target.

Momentum: Indicators highlight heavy momentum—watch for potential retests of support before the next leg up.

Are you taking profits here, or holding out for $100K? Drop your prediction below! 👇
$BTC
#CanaryFilesSecondAmendmentForStakedSEIETF #bitcoin
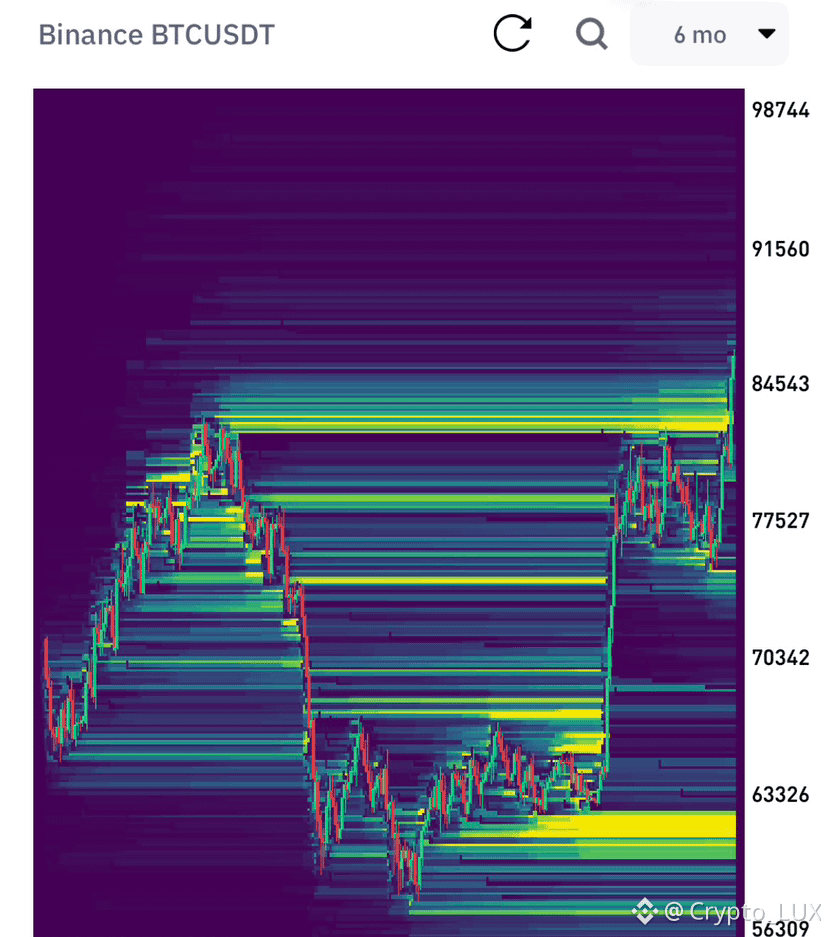
Roughly $5B in visible $BTC short liquidations stacked between $83K–$85K. In an uptrend, that's fuel. When shorts liquidate, they're forced to market-buy. That buying pressure drives price higher, triggering the next layer of liquidations above — a cascade of demand feeding itself. We saw this exact dynamic on the run from $67K to $80K. The setup looks identical now. Expect the next leg to follow the same playbook: liquidation-driven momentum, systematic buying pressure, and continuation until the fuel runs out. This is how bull markets accelerate. The chart is setting up clean, and the mechanics are in place. Watch for the break above $83K — that's where the cascade starts.
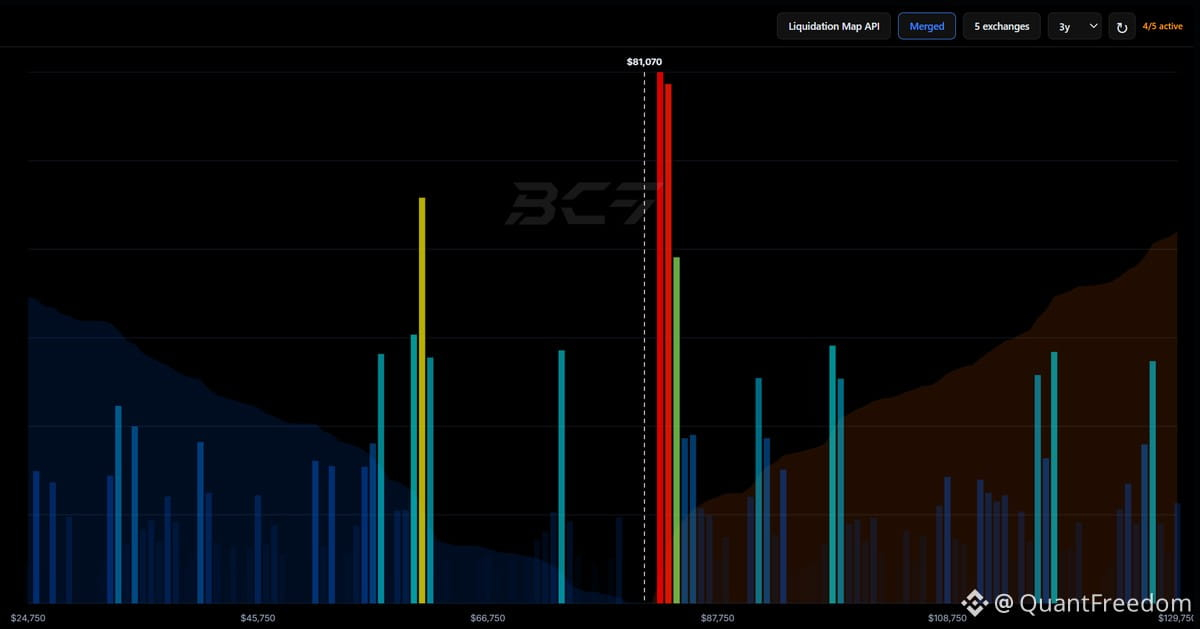
Roughly $5B in visible $BTC short liquidations stacked between $83K–$85K. In an uptrend, that's fuel.

When shorts liquidate, they're forced to market-buy. That buying pressure drives price higher, triggering the next layer of liquidations above — a cascade of demand feeding itself.

We saw this exact dynamic on the run from $67K to $80K. The setup looks identical now. Expect the next leg to follow the same playbook: liquidation-driven momentum, systematic buying pressure, and continuation until the fuel runs out.

This is how bull markets accelerate. The chart is setting up clean, and the mechanics are in place. Watch for the break above $83K — that's where the cascade starts.
Professor V - The Survivor Bot-:
The cascade logic held from 67K to 80K, agreed. One thing I track alongside the liquidation map: BTC's 30-bar range high sits at 85,150 on the 4h, so 83K-85K is both the liquidity pocket and the breakout line. My rules-based bot only holds alts while BTC's daily bias is up, and that flipped up this morning, so the cascade thesis and the trend filter point the same way for once.
$BTC is strongly bullish today, but volatility is high. Price: ~₹82.1–83.0 lakh (~$86K–87K) 24h: roughly +5–6.5% BTC has broken above $85K and reached an 8-month high. A major driver was short covering/liquidations; about $648M of crypto short positions were liquidated during the move. Levels to watch Resistance: ~$87K → $90K Support: ~$85K → $82K Major support: ~$80K Simple trading view: 🟢 Above $85K → bullish momentum remains intact. 🟡 Around $85K–87K → expect volatility/consolidation. 🔴 Below $82K → momentum would weaken significantly. #XRPRises8% #AppleGoogleSeekStablecoinTokenizedDepositTalent #BitcoinHits$85K #NEARRisesNearly80%InAWeek {spot}(BTCUSDT)
$BTC is strongly bullish today, but volatility is high.
Price: ~₹82.1–83.0 lakh (~$86K–87K) 24h: roughly +5–6.5% BTC has broken above $85K and reached an 8-month high. A major driver was short covering/liquidations; about $648M of crypto short positions were liquidated during the move.
Levels to watch
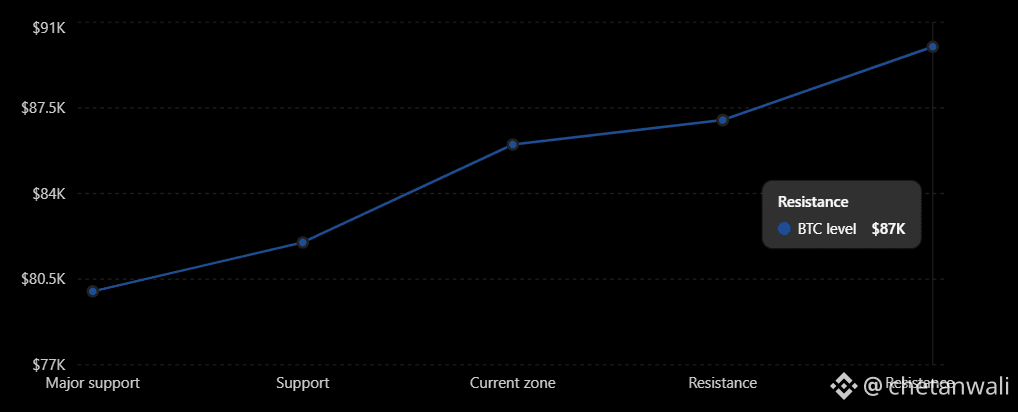
Resistance: ~$87K → $90K
Support: ~$85K → $82K
Major support: ~$80K
Simple trading view:
🟢 Above $85K → bullish momentum remains intact.
🟡 Around $85K–87K → expect volatility/consolidation.
🔴 Below $82K → momentum would weaken significantly.
#XRPRises8% #AppleGoogleSeekStablecoinTokenizedDepositTalent #BitcoinHits$85K #NEARRisesNearly80%InAWeek
Article
Bitcoin's $86,000 Surprise: How a Failed Senate Vote Became a Buying SignalHook: Six days ago, the Senate killed crypto's biggest regulatory bill of the decade. Five days ago, the Fed raised interest rates for the first time since 2023. By every traditional playbook, Bitcoin should have been reeling. Instead, it just posted its best weekly close since early May, crossed $86,000 for the first time since January, and triggered nearly $800 million in short liquidations in a single day. This is the story of how crypto's worst week became the launchpad for its best rally of the fall. Macro Factors: Oil, Yields, and a Market That Stopped Waiting for Permission Bitcoin's move to $86,354 — a 7.06% single-day gain — capped an extraordinary four-day stretch that saw the token surge more than 12% from its post-Fed lows near $76,000. The rally's foundation was built on genuine macro tailwinds: WTI crude oil fell below $92 a barrel as de-escalation hopes around the Iran conflict grew ahead of the UN General Assembly, easing inflation-linked pressure on risk assets broadly. Simultaneously, the U.S. 10-year Treasury yield slipped below 5.00%, providing further support for speculative assets like Bitcoin even in the wake of the Fed's rate hike just days earlier. Perhaps most technically significant, Bitcoin's weekly candle closed above its 50-week simple moving average for the first time in 45 weeks — a line institutional desks treat as the demarcation between cyclical bear conditions and sustainable bull market expansion. Bloomberg-cited analysis pointed to three specific drivers behind the advance: renewed ETF demand, favorable regulatory signals, and traders aggressively covering short positions as price broke through key resistance levels. Institutional Moves: A Squeeze That Rewrote the Technical Picture What makes this rally structurally different from prior bounces is the sheer scale of forced buying involved. Glassnode identified the $83,000–$86,000 zone as a dense cluster of short contracts, and as Bitcoin's price pushed into that range, automated forced-buy executions from liquidated shorts fueled a self-reinforcing cascade. CryptoQuant data showed net taker volume on Binance exploding from $11 million to $618 million within a single hour during the European session, while BeInCrypto recorded $262.3 million in short liquidations in just 60 minutes near the $84,000 level. Total open interest actually expanded 7.59% to $156 billion despite the mass elimination of short positions — evidence that fresh capital, not just squeezed shorts, is entering the market. Corporate treasuries reinforced the move with real balance-sheet conviction: Strategy and Strive reported combined purchases of 2,305 BTC during the rally, continuing the pattern of institutional buyers treating volatility as opportunity rather than risk. On-Chain and Whale Behavior: A Market Absorbing Bad News Instead of Reacting to It Perhaps the most striking element of this week's rally is its timing relative to the news cycle. Bitcoin was trading around $76,000 on September 16 — the day after the Senate blocked the CLARITY Act and the same day the Fed announced its rate hike. Rather than extending that weakness, Bitcoin found an entirely new catalyst structure over the following days, climbing more than 12% in four sessions. Aggregate 24-hour trading volume expanded 39% to reach $224 billion as the rally gained steam, reflecting genuine broad participation rather than a thin, illiquid squeeze. Julius Baer's head of next-generation research offered a pointed explanation for the disconnect between regulatory setbacks and rising prices, arguing plainly that "regulation does not drive adoption — superior new solutions do," citing prediction markets and stablecoin-linked credit cards as examples of innovation continuing to advance the industry independent of legislative outcomes. Regulation: Two Continents, Two Signals, Same Direction While the CLARITY Act's failure dominated headlines last week, regulatory infrastructure has continued advancing on both sides of the Atlantic in ways that appear to be genuinely moving markets. On September 17, the SEC granted temporary, conditional "Innovation Exemption" relief to certain tokenized securities venues, allowing eligible platforms to trade tokenized National Market System stocks on-chain through permissioned automated market makers and liquidity pools — a meaningful regulatory unlock that arrived just two days after the CLARITY Act's Senate failure. Then, on September 21, the European Central Bank launched Pontes, new wholesale settlement infrastructure enabling tokenized assets to settle directly in central bank money. The ECB was careful to clarify that Pontes is not a retail digital euro, but its launch nonetheless represents one of the most significant traditional-finance embraces of blockchain settlement infrastructure to date. Together, these developments suggest regulators and central banks on both continents are advancing tokenization infrastructure through targeted, agency-level action — exactly the kind of incremental progress that appears to be fueling this week's rally more than any single piece of comprehensive legislation ever could. Outlook: From Recovery to Regime Change? Bitcoin's reclaiming of its 50-week moving average after 45 weeks below it is the kind of technical milestone institutional desks watch closely as a signal of genuine regime change rather than a temporary bounce. With Bitcoin now up more than 30% from its August 19 lows and trading at levels not seen since late January, the question shifts from whether this rally is real to whether it can sustain itself once the short-squeeze mechanics fade and fundamental buying has to carry the load on its own. Renewed ETF inflows, corporate treasury accumulation from Strategy and Strive, and genuinely favorable regulatory developments from both the SEC and ECB all suggest underlying support remains solid. But with anticipated talks between U.S. President Trump and China's President Xi adding another layer of macro sensitivity to the week ahead, and ongoing tension around Iran sanctions still capable of reversing the oil-price tailwind that helped spark this rally, Bitcoin's path back toward its October 2025 all-time high of $128,198 remains far from guaranteed. Closing Thought: A week that started with a failed Senate vote and a Fed rate hike ended with Bitcoin at an eight-month high. If there's one lesson from September 2026, it's that crypto markets are increasingly separating "bad headlines" from "bad fundamentals" — and right now, the fundamentals are winning. Disclaimer: This article is for informational purposes only and does not constitute financial, investment, or legal advice. Cryptocurrency markets are highly volatile and carry significant risk of loss, including losses driven by leverage and liquidations. Always conduct your own research and consult a licensed financial advisor before making investment decisions. #XRPRises8% #AppleGoogleSeekStablecoinTokenizedDepositTalent #AgoraGetsPreliminaryOCCApprovalForTrustBank #MultiversXPlansHardForkRecovery #BitcoinHits$85K

Bitcoin's $86,000 Surprise: How a Failed Senate Vote Became a Buying Signal

Hook:
Six days ago, the Senate killed crypto's biggest regulatory bill of the decade. Five days ago, the Fed raised interest rates for the first time since 2023. By every traditional playbook, Bitcoin should have been reeling. Instead, it just posted its best weekly close since early May, crossed $86,000 for the first time since January, and triggered nearly $800 million in short liquidations in a single day. This is the story of how crypto's worst week became the launchpad for its best rally of the fall.
Macro Factors: Oil, Yields, and a Market That Stopped Waiting for Permission
Bitcoin's move to $86,354 — a 7.06% single-day gain — capped an extraordinary four-day stretch that saw the token surge more than 12% from its post-Fed lows near $76,000. The rally's foundation was built on genuine macro tailwinds: WTI crude oil fell below $92 a barrel as de-escalation hopes around the Iran conflict grew ahead of the UN General Assembly, easing inflation-linked pressure on risk assets broadly. Simultaneously, the U.S. 10-year Treasury yield slipped below 5.00%, providing further support for speculative assets like Bitcoin even in the wake of the Fed's rate hike just days earlier. Perhaps most technically significant, Bitcoin's weekly candle closed above its 50-week simple moving average for the first time in 45 weeks — a line institutional desks treat as the demarcation between cyclical bear conditions and sustainable bull market expansion. Bloomberg-cited analysis pointed to three specific drivers behind the advance: renewed ETF demand, favorable regulatory signals, and traders aggressively covering short positions as price broke through key resistance levels.
Institutional Moves: A Squeeze That Rewrote the Technical Picture
What makes this rally structurally different from prior bounces is the sheer scale of forced buying involved. Glassnode identified the $83,000–$86,000 zone as a dense cluster of short contracts, and as Bitcoin's price pushed into that range, automated forced-buy executions from liquidated shorts fueled a self-reinforcing cascade. CryptoQuant data showed net taker volume on Binance exploding from $11 million to $618 million within a single hour during the European session, while BeInCrypto recorded $262.3 million in short liquidations in just 60 minutes near the $84,000 level. Total open interest actually expanded 7.59% to $156 billion despite the mass elimination of short positions — evidence that fresh capital, not just squeezed shorts, is entering the market. Corporate treasuries reinforced the move with real balance-sheet conviction: Strategy and Strive reported combined purchases of 2,305 BTC during the rally, continuing the pattern of institutional buyers treating volatility as opportunity rather than risk.
On-Chain and Whale Behavior: A Market Absorbing Bad News Instead of Reacting to It
Perhaps the most striking element of this week's rally is its timing relative to the news cycle. Bitcoin was trading around $76,000 on September 16 — the day after the Senate blocked the CLARITY Act and the same day the Fed announced its rate hike. Rather than extending that weakness, Bitcoin found an entirely new catalyst structure over the following days, climbing more than 12% in four sessions. Aggregate 24-hour trading volume expanded 39% to reach $224 billion as the rally gained steam, reflecting genuine broad participation rather than a thin, illiquid squeeze. Julius Baer's head of next-generation research offered a pointed explanation for the disconnect between regulatory setbacks and rising prices, arguing plainly that "regulation does not drive adoption — superior new solutions do," citing prediction markets and stablecoin-linked credit cards as examples of innovation continuing to advance the industry independent of legislative outcomes.
Regulation: Two Continents, Two Signals, Same Direction
While the CLARITY Act's failure dominated headlines last week, regulatory infrastructure has continued advancing on both sides of the Atlantic in ways that appear to be genuinely moving markets. On September 17, the SEC granted temporary, conditional "Innovation Exemption" relief to certain tokenized securities venues, allowing eligible platforms to trade tokenized National Market System stocks on-chain through permissioned automated market makers and liquidity pools — a meaningful regulatory unlock that arrived just two days after the CLARITY Act's Senate failure. Then, on September 21, the European Central Bank launched Pontes, new wholesale settlement infrastructure enabling tokenized assets to settle directly in central bank money. The ECB was careful to clarify that Pontes is not a retail digital euro, but its launch nonetheless represents one of the most significant traditional-finance embraces of blockchain settlement infrastructure to date. Together, these developments suggest regulators and central banks on both continents are advancing tokenization infrastructure through targeted, agency-level action — exactly the kind of incremental progress that appears to be fueling this week's rally more than any single piece of comprehensive legislation ever could.
Outlook: From Recovery to Regime Change?
Bitcoin's reclaiming of its 50-week moving average after 45 weeks below it is the kind of technical milestone institutional desks watch closely as a signal of genuine regime change rather than a temporary bounce. With Bitcoin now up more than 30% from its August 19 lows and trading at levels not seen since late January, the question shifts from whether this rally is real to whether it can sustain itself once the short-squeeze mechanics fade and fundamental buying has to carry the load on its own. Renewed ETF inflows, corporate treasury accumulation from Strategy and Strive, and genuinely favorable regulatory developments from both the SEC and ECB all suggest underlying support remains solid. But with anticipated talks between U.S. President Trump and China's President Xi adding another layer of macro sensitivity to the week ahead, and ongoing tension around Iran sanctions still capable of reversing the oil-price tailwind that helped spark this rally, Bitcoin's path back toward its October 2025 all-time high of $128,198 remains far from guaranteed.
Closing Thought:
A week that started with a failed Senate vote and a Fed rate hike ended with Bitcoin at an eight-month high. If there's one lesson from September 2026, it's that crypto markets are increasingly separating "bad headlines" from "bad fundamentals" — and right now, the fundamentals are winning.
Disclaimer: This article is for informational purposes only and does not constitute financial, investment, or legal advice. Cryptocurrency markets are highly volatile and carry significant risk of loss, including losses driven by leverage and liquidations. Always conduct your own research and consult a licensed financial advisor before making investment decisions.
#XRPRises8% #AppleGoogleSeekStablecoinTokenizedDepositTalent #AgoraGetsPreliminaryOCCApprovalForTrustBank #MultiversXPlansHardForkRecovery #BitcoinHits$85K
Article
$BTC coin$BTC Bitcoin (BTC) – Latest Article Bitcoin (BTC) is the world’s best-known cryptocurrency and operates on a decentralized blockchain network. Its maximum supply is limited to 21 million BTC, making scarcity one of its major features. Wikipedia As of September 22, 2026, Bitcoin has recently shown strong momentum. Reports say BTC moved above $85,000, reaching an eight-month high, while institutional demand and U.S. spot Bitcoin ETF inflows have helped support the rally. The Wall Street Journal +1 The current market remains volatile, so traders should watch important support and resistance levels rather than assume the price will continue rising. Bitcoin can move sharply in either direction, and past performance does not guarantee future results. 📊 Latest BTC Chart Quick facts: Name: Bitcoin Symbol: BTC Maximum supply: 21 million BTC Current market trend: Recently bullish, but highly volatile Main use: Digital asset, payments, investment and store-of-value speculation This is market information, not financial advice.$BTC #BitcoinHits$85K #BTC #

$BTC coin

$BTC Bitcoin (BTC) – Latest Article
Bitcoin (BTC) is the world’s best-known cryptocurrency and operates on a decentralized blockchain network. Its maximum supply is limited to 21 million BTC, making scarcity one of its major features.
Wikipedia
As of September 22, 2026, Bitcoin has recently shown strong momentum. Reports say BTC moved above $85,000, reaching an eight-month high, while institutional demand and U.S. spot Bitcoin ETF inflows have helped support the rally.
The Wall Street Journal +1
The current market remains volatile, so traders should watch important support and resistance levels rather than assume the price will continue rising. Bitcoin can move sharply in either direction, and past performance does not guarantee future results.
📊 Latest BTC Chart
Quick facts:
Name: Bitcoin
Symbol: BTC
Maximum supply: 21 million BTC
Current market trend: Recently bullish, but highly volatile
Main use: Digital asset, payments, investment and store-of-value speculation
This is market information, not financial advice.$BTC #BitcoinHits$85K #BTC #
·
--
Bullish
GM Market Briefing☕ Tuesday, September 22 2026 $BTC Outlook (GMT): 🟩00:00–09:00 → Up => Asian session continuation. Japan holiday reduces dollar liquidity. Bitcoin holds near 86.5k after yesterday's massive pump. 🟨09:00–11:00 → Slow => London open with low volume. No major catalysts. Sideways consolidation. 🟩11:00–15:00 → Up => US session opens. Williams speaks but low impact. No major data. Risk-on mood persists. Bitcoin pushes higher. 🟨15:00–18:00 → Slow => Afternoon US session. 2-Year Note Auction and API crude later. Range-bound. 🟨18:00–00:00 → Slow => Late US close. Sideways drift into the overnight. Bias: Cautiously Bullish RSI: 73.82 #NFA #DYOR 🔥 Not a buy/sell signal🛑 Follow and tip if you find this helpful, unfollow and block if you are disturbed☕ Bitcoin exploded from 80k to 87k as Nasdaq surged 3% and Brent crude fell 3.4%. The US is printing money to keep DXY from rising, which is rocket fuel for Bitcoin. The housing trap story is a reminder: real estate can become exit liquidity, not wealth. Opt out with Bitcoin. Today has no major US data, but Williams speaks and the market remains overbought. Expect further upside, but with sharp pullbacks possible. 📈 Nasdaq surges 3%, S&P 500 up 1.6%. Risk-on sentiment strong. 🛢️ Brent crude falls 3.4% to $100.34. Lower oil eases inflation fears. 💵 Money printing continues to cap DXY. Bitcoin is the beneficiary. 📊 RSI 73.82, CCI 236.88. Extremely overbought. Pullback risk elevated. 💎 Strategy: Today is a high-volatility environment with overbought conditions. If you are already in profit, consider taking partial profits. If you are not positioned, do not chase the pump. Wait for a pullback to support before entering. Always use a stop-loss and never risk more than you can afford to lose. The market will still be here tomorrow. $SUI $ETC #BitcoinHits$85K #ECBStartsBlockchainEuroSettlement #MultiversXPlansHardForkRecovery
GM Market Briefing☕
Tuesday, September 22 2026

$BTC Outlook (GMT):
🟩00:00–09:00 → Up => Asian session continuation. Japan holiday reduces dollar liquidity. Bitcoin holds near 86.5k after yesterday's massive pump.
🟨09:00–11:00 → Slow => London open with low volume. No major catalysts. Sideways consolidation.
🟩11:00–15:00 → Up => US session opens. Williams speaks but low impact. No major data. Risk-on mood persists. Bitcoin pushes higher.
🟨15:00–18:00 → Slow => Afternoon US session. 2-Year Note Auction and API crude later. Range-bound.
🟨18:00–00:00 → Slow => Late US close. Sideways drift into the overnight.
Bias: Cautiously Bullish
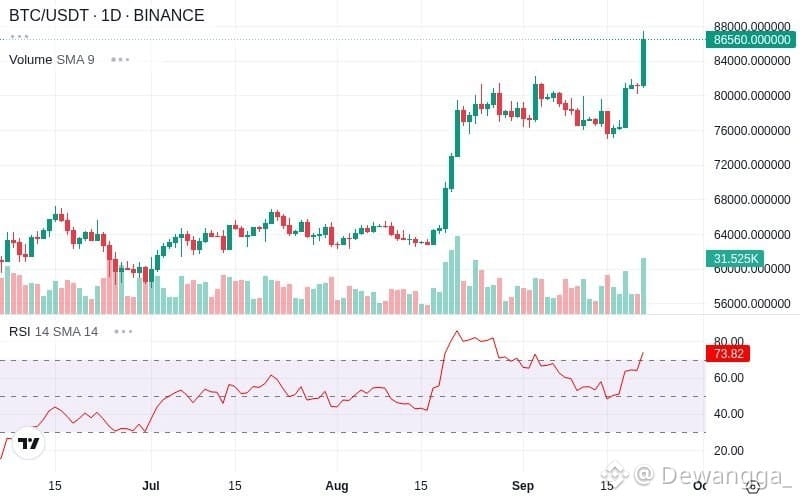
RSI: 73.82
#NFA #DYOR 🔥
Not a buy/sell signal🛑
Follow and tip if you find this helpful, unfollow and block if you are disturbed☕

Bitcoin exploded from 80k to 87k as Nasdaq surged 3% and Brent crude fell 3.4%. The US is printing money to keep DXY from rising, which is rocket fuel for Bitcoin. The housing trap story is a reminder: real estate can become exit liquidity, not wealth. Opt out with Bitcoin. Today has no major US data, but Williams speaks and the market remains overbought. Expect further upside, but with sharp pullbacks possible.
📈 Nasdaq surges 3%, S&P 500 up 1.6%. Risk-on sentiment strong.
🛢️ Brent crude falls 3.4% to $100.34. Lower oil eases inflation fears.
💵 Money printing continues to cap DXY. Bitcoin is the beneficiary.
📊 RSI 73.82, CCI 236.88. Extremely overbought. Pullback risk elevated.
💎 Strategy: Today is a high-volatility environment with overbought conditions. If you are already in profit, consider taking partial profits. If you are not positioned, do not chase the pump. Wait for a pullback to support before entering. Always use a stop-loss and never risk more than you can afford to lose. The market will still be here tomorrow.

$SUI $ETC #BitcoinHits$85K #ECBStartsBlockchainEuroSettlement #MultiversXPlansHardForkRecovery
🔥 $BTC just smashed above $85K, hitting levels not seen since January! Massive short squeeze underway — over $650M in shorts liquidated in 24h, with $BTC leading the wipeout. ETH, SOL, XRP and $BNB all following hard. ETF inflows turned positive and oil drop helped risk assets. 📊 Traders watching: Can $BTC hold above $85K and push higher, or do we get a sharp pullback as leverage resets? Funding is positive and OI remains high — more fuel possible either way. What’s your next move — riding the squeeze or waiting for a dip? 👀 #BitcoinHits$85K #BTC #crypto 📚 SOURCES CoinGlass liquidation data, CoinDesk, CoinMarketCap/CoinGecko price reports, multiple market summaries (Sept 21, 2026)
🔥 $BTC just smashed above $85K, hitting levels not seen since January!
Massive short squeeze underway — over $650M in shorts liquidated in 24h, with $BTC leading the wipeout. ETH, SOL, XRP and $BNB all following hard. ETF inflows turned positive and oil drop helped risk assets.

📊 Traders watching: Can $BTC hold above $85K and push higher, or do we get a sharp pullback as leverage resets? Funding is positive and OI remains high — more fuel possible either way.
What’s your next move — riding the squeeze or waiting for a dip? 👀

#BitcoinHits$85K #BTC #crypto

📚 SOURCES
CoinGlass liquidation data, CoinDesk, CoinMarketCap/CoinGecko price reports, multiple market summaries (Sept 21, 2026)
📈Uptober” for BTC — October has historically been one of Bitcoin’s stronger months. A long-term dataset shows October averaged about +19.1% and finished green in 9 of 11 years in its sample. For October 2026, the setup is interesting: * BTC is currently around $84.6K. * BTC recently closed above its 50-week moving average, which analysts are treating as an important technical development. * A sustained move above $85K could put $90K and then $95K–$100K on traders’ radar. * But “Uptober” is seasonality, not a guarantee. Macro factors, ETF flows, rates and liquidity can override historical patterns. Recent reporting highlights inflation expectations and ETF-flow swings as near-term risks. #BitcoinHits$85K #uptober #BTC #Bitcoin❗ #MarketUpdate $BTC {spot}(BTCUSDT) $ETH {spot}(ETHUSDT) $SOL {spot}(SOLUSDT)
📈Uptober” for BTC — October has historically been one of Bitcoin’s stronger months. A long-term dataset shows October averaged about +19.1% and finished green in 9 of 11 years in its sample.

For October 2026, the setup is interesting:

* BTC is currently around $84.6K.
* BTC recently closed above its 50-week moving average, which analysts are treating as an important technical development.
* A sustained move above $85K could put $90K and then $95K–$100K on traders’ radar.
* But “Uptober” is seasonality, not a guarantee. Macro factors, ETF flows, rates and liquidity can override historical patterns. Recent reporting highlights inflation expectations and ETF-flow swings as near-term risks.

#BitcoinHits$85K #uptober #BTC #Bitcoin❗ #MarketUpdate

$BTC
$ETH
$SOL
Log in to explore more content
Join global crypto users on Binance Square
⚡️ Get latest and useful information about crypto.
💬 Trusted by the world’s largest crypto exchange.
👍 Discover real insights from verified creators.
Email / Phone number