

#analisistecnico
analisistecnico
1M views
3,251 Discussing
Hot
Latest

🚨 ATTENTION, TRADERS! 🚨 Trap or rally? Here’s how Bitcoin reacted to the Fed’s blow 📉📈
The market has just experienced one of the week’s most anticipated moments. The Federal Reserve (Fed) decided to leave interest rates unchanged (in the 3.75% to 4% range), but its tone felt restrictive (hawkish), keeping markets laser-focused on December.
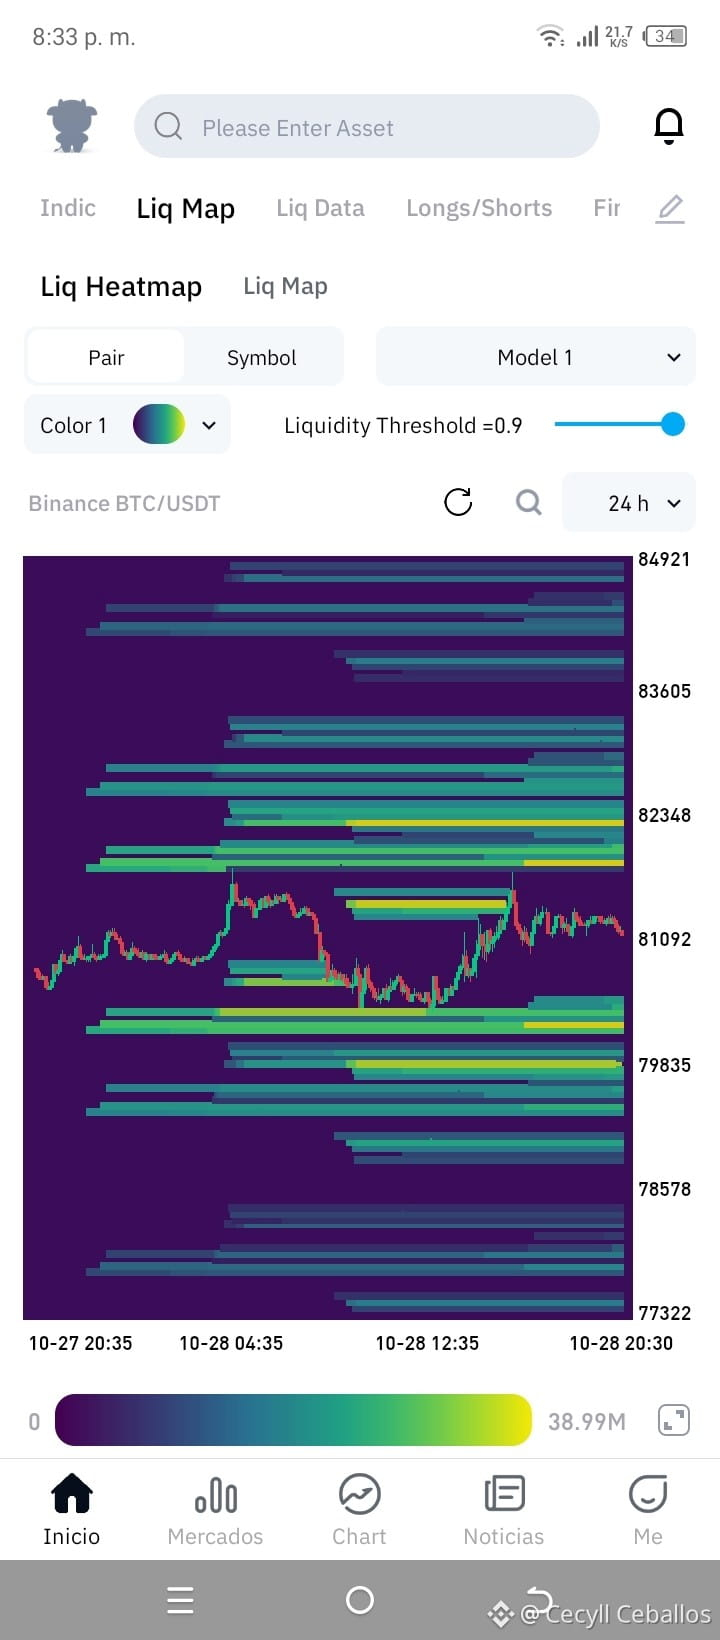
How did Bitcoin ($BTC) react to the news? Far from suffering a dramatic crash or an euphoric breakout, the leading cryptocurrency showed great resilience, stabilizing and hovering around the $81,000 USD zone. The market took the move in stride, but the liquidation heatmap data reveals the whales’ true hidden play 🐳:
🔥 What does the heatmap show us?
Lower zones cleared: As you can see in the chart, much of the liquidity at the lowest levels has already been swept, wiping out weaker leveraged long positions.
The liquidation magnet above: The dense yellow and bright green zones reveal a massive accumulation of liquidity at higher levels (above $83,000–$84,000 USD). Historically, price tends to act like a magnet toward these zones, hunting short positions before setting a broader trend.
Patience and correctly reading the heatmap are key to avoiding algorithmic traps. Keep a very close eye on those resistance levels!
👇 What do you think? Will we see a strong bounce to seek liquidity above, or will the Fed ultimately weigh more heavily on the market?
If you like this kind of straight-to-the-point technical analysis, leave a comment below.
🤝 Follow me and I’ll follow you! Let’s connect and keep growing together in this community. Thanks so much!
#Bitcoin #BinanceSquare $PEPE $RENDER #CryptoTrading #AnalisisTecnico
3
291

·
--
📚 Yesterday, $HAEDAL traded 40 times its normal volume. $BTC, just 0.8 times. What does that tell you?
🔍 The concept: relative volume compares a candle’s volume with the average of the previous 20.
• 1x = a normal day.
• More than 1.5–2x = there’s more interest than usual.
• Less than 1x = the market is watching, but not acting.
📊 Example using today’s data (Binance, closed candles):
• HAEDAL, daily: 40.3x → up +60% in 6 days. A move with massive participation.
• $PEPE , 4 h: 2.0x → its +16.8% rise comes with volume.
• $BNB, 4 h: 2.1x → hit the 20-candle high ($762.8) on double the volume.
• $BTC and $ETH, daily: 0.8x → below-normal days, with no conviction in either direction.
📌 Quick take:
• Price move + high volume = more participants behind the move.
• Price move + low volume = more likely to reverse.
❌ Common mistake: looking at the volume of a candle that hasn’t closed yet. Midway through the day, it always looks “low”; compare closed candles.
✅ In a nutshell: price tells you where the market is going; volume tells you how many people are going along with it.
Do you check volume before trading? Reply “YES” or “NO” 👇
#AnalisisTecnico #AprendeCripto #BTC #Trading #Tra100d
⚠️ For informational and educational purposes only; not financial advice. Cryptocurrencies are volatile: do your own research and trade with caution.
📚 Yesterday, $HAEDAL traded 40 times its normal volume. $BTC , just 0.8 times. What does that tell you?
🔍 The concept: relative volume compares a candle’s volume with the average of the previous 20.
• 1x = a normal day.
• More than 1.5–2x = there’s more interest than usual.
• Less than 1x = the market is watching, but not acting.
📊 Example using today’s data (Binance, closed candles):
• HAEDAL, daily: 40.3x → up +60% in 6 days. A move with massive participation.
• $PEPE , 4 h: 2.0x → its +16.8% rise comes with volume.
• $BNB, 4 h: 2.1x → hit the 20-candle high ($762.8) on double the volume.
• $BTC and $ETH, daily: 0.8x → below-normal days, with no conviction in either direction.
📌 Quick take:
• Price move + high volume = more participants behind the move.
• Price move + low volume = more likely to reverse.
❌ Common mistake: looking at the volume of a candle that hasn’t closed yet. Midway through the day, it always looks “low”; compare closed candles.
✅ In a nutshell: price tells you where the market is going; volume tells you how many people are going along with it.
Do you check volume before trading? Reply “YES” or “NO” 👇
#AnalisisTecnico #AprendeCripto #BTC #Trading #Tra100d
⚠️ For informational and educational purposes only; not financial advice. Cryptocurrencies are volatile: do your own research and trade with caution.
92
·
--
📚 BTC, ETH, and SOL are in a “strong downtrend” today… and in an “uptrend” at the same time. Neither one is wrong.
🔍 The concept: each time frame (4 h, daily, weekly) tells a different story. The 4 h chart shows what happened over the last few days; the daily chart shows what happened over the last few months.
📊 Example using today’s data (Binance):
• $BTC on the 4 h chart: ~$79,800, below its 20, 50, and 200 EMAs ($80,430 / $81,140 / $81,750) → strong downtrend.
• $BTC on the daily chart: well above its daily 200 EMA (~$74,230) → the broader trend is still bullish/ranging.
• $ETH: same story. Bearish on the 4 h chart, but still above its 200 EMA on the daily chart (~$2,226).
• $SOL: bearish on the 4 h chart; above its 200 EMA on the daily chart (~$93).
📌 Quick read:
• The higher time frame sets the broader direction.
• The lower time frame shows the current momentum (whether there’s pressure right now).
• When they contradict each other, it’s usually a correction within a larger trend… until the higher time frame changes too.
❌ Common mistake: looking only at the 15-minute or 1-hour chart and thinking “the market is crashing,” or looking only at the daily chart and ignoring short-term selling pressure.
✅ In one line: look at the daily chart first to see where you are, then the 4 h chart to know when.
Which time frame do you look at first? Reply “4H” or “DAILY” 👇
#AnalisisTecnico #AprendeCripto #BTC #Trading #Tra100d
⚠️ For informational and educational purposes only; this is not financial advice. Cryptocurrencies are volatile: do your own research and trade with caution.
74

·
--
🚨 $AIN New ATH at 0.1698 USDT or massive liquidity trap?
Urgent update on $AIN after it marked a new intraday high at 0.16985 USDT (+200% in 24h with over 680M USDT in volume). The market swept liquidity above 0.16 USDT, but the subsequent price action shows very clear technical signs of distribution:
Immediate rejection and absorption wick: After touching 0.1698 USDT, the price was sharply rejected toward 0.1514 USDT, leaving a pronounced upper wick on the 4H chart.
Loss of momentum on the 15-minute chart: The fast MA(7) was broken to the downside, and buying volume continues to decline candle after candle.
Disconnect from institutional support levels: On the 4H chart, the MA(7) is at 0.1126 USDT and the MA(25) at 0.0592 USDT. The gap between these levels and the current price represents an excessive imbalance that is often resolved through abrupt corrections.
⚠️ Key reminder: Don't get caught by FOMO during vertical green candles. Always check the Funding Rate before holding futures positions across multiple cycles
#CryptoTrading #BinanceSquare #AnalisisTecnico
237

·
--
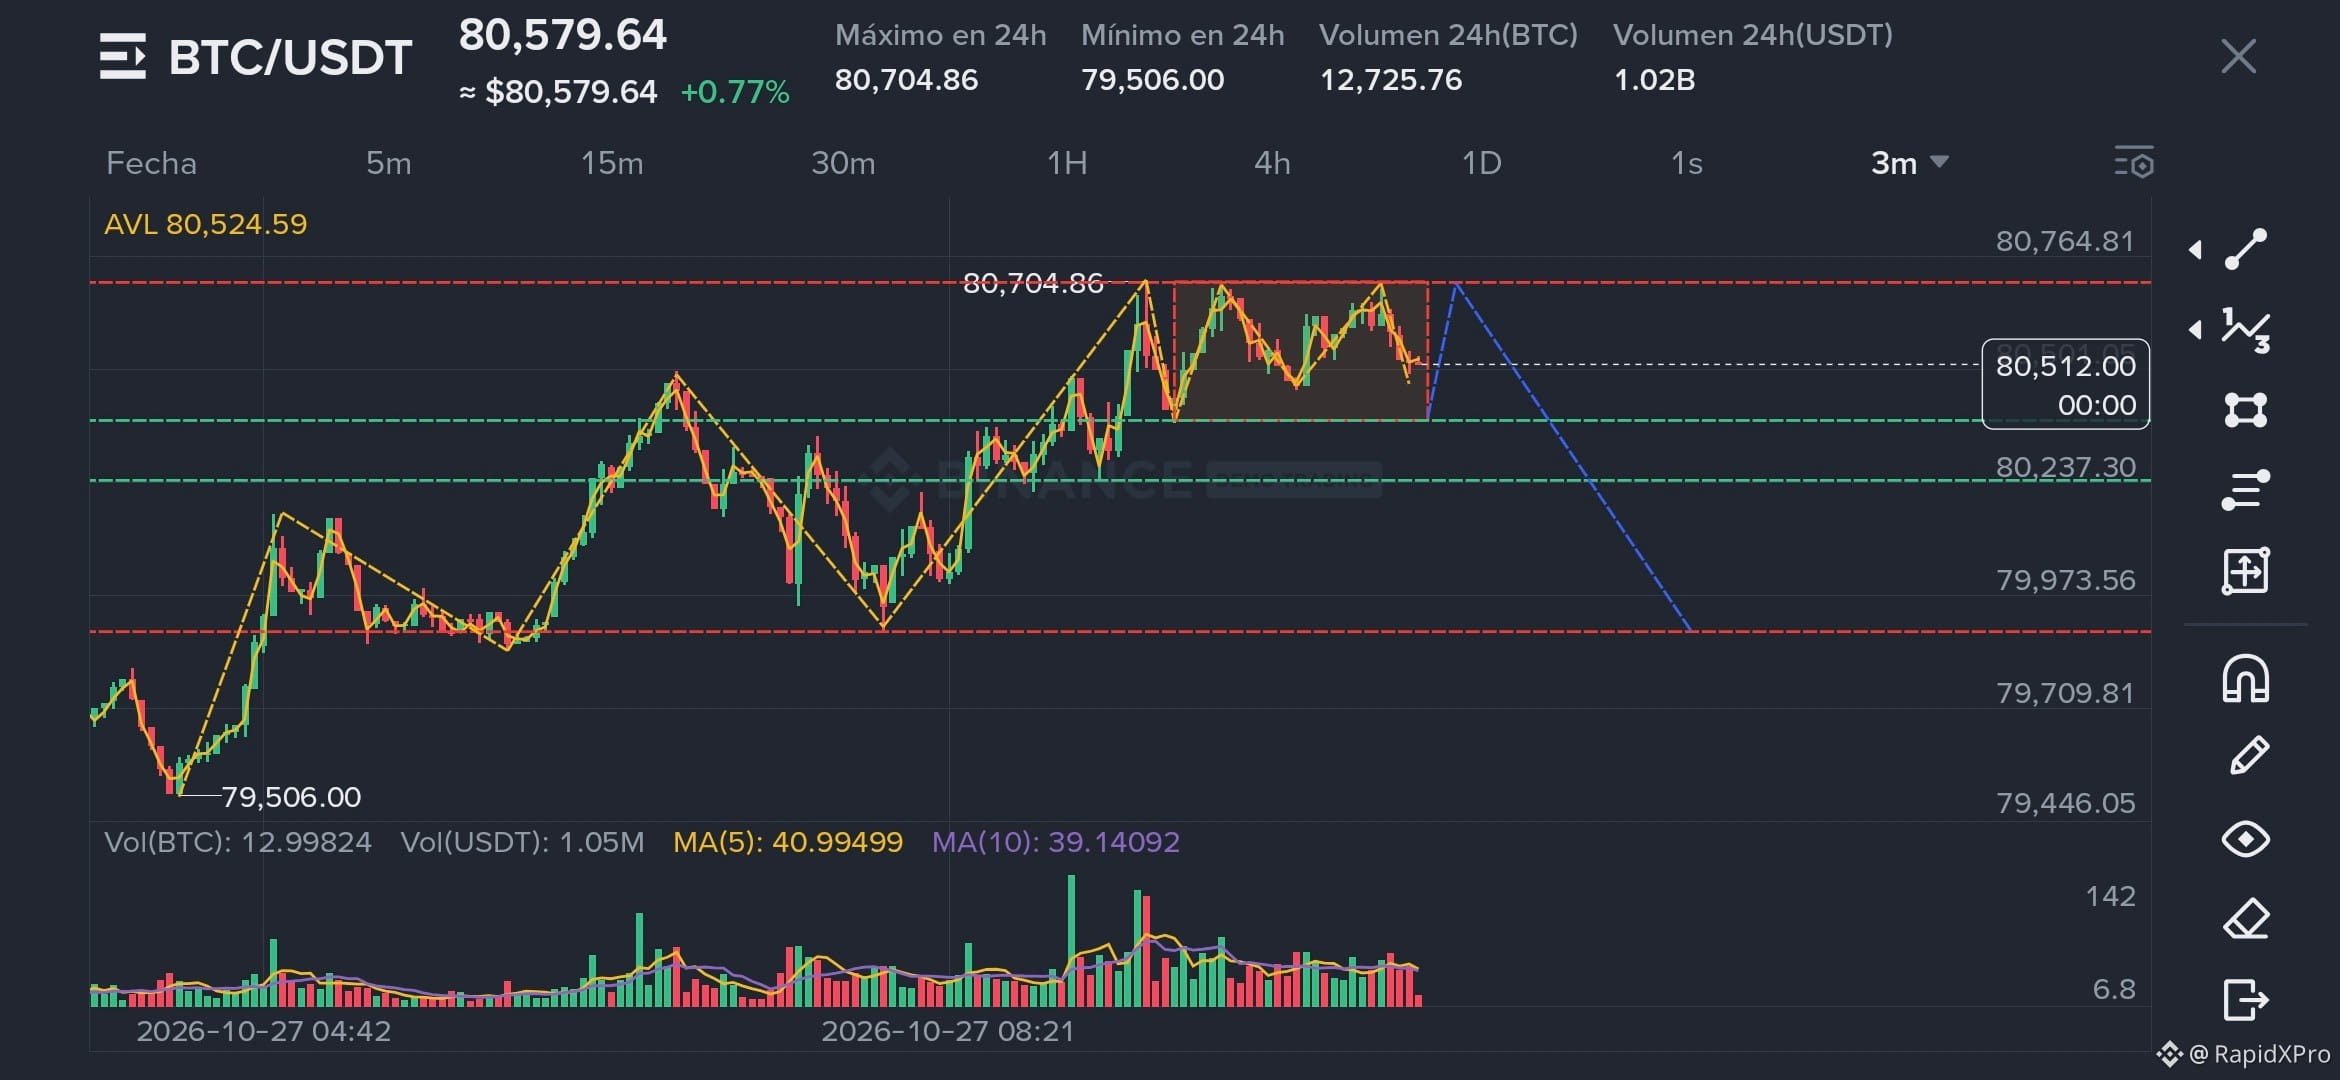
📉 BTC/USDT (3m): sweep of the high or breakout?
Triple top at ~80,705 and price inside a distribution range.
🔴 Ceiling: 80,705
🟢 Range low: 80,384
🎯 Target: 79,890
❌ Invalidated: 3m close > 80,705
Scenario: sweep of the high and drop. No confirmation without a close below 80,384.
Breakout or sweep? 👇
$BTC #BTC #AnalisisTecnico
{spot}(BTCUSDT)
📉 BTC/USDT (3m): sweep of the high or breakout?
Triple top at ~80,705 and price inside a distribution range.
🔴 Ceiling: 80,705
🟢 Range low: 80,384
🎯 Target: 79,890
❌ Invalidated: 3m close > 80,705
Scenario: sweep of the high and drop. No confirmation without a close below 80,384.
Breakout or sweep? 👇
$BTC #BTC #AnalisisTecnico
Triple top at ~80,705 and price inside a distribution range.
🔴 Ceiling: 80,705
🟢 Range low: 80,384
🎯 Target: 79,890
❌ Invalidated: 3m close > 80,705
Scenario: sweep of the high and drop. No confirmation without a close below 80,384.
Breakout or sweep? 👇
$BTC #BTC #AnalisisTecnico
128

·
--
📉 Many see the RSI for $BNB (76) or $XRP (74) and rush to buy. I prefer to look at the bigger picture. 🧐
The altcoin market is seeing a small short-term bounce, which is tempting many traders. But what about the King? 👑
$BTC is still trading below its 200-period moving average on the 4H chart. My bot has a “Macro Filter”: if Bitcoin is weak, it folds its arms and doesn’t buy anything, no matter how good the charts for other coins look.
📊 Why do I do this? Because trading against the overall trend is the fastest way to lose money. It’s not about guessing the next peak; it’s about preserving capital.
When $BTC breaks resistance, the bot will start trading. Until then, the best position is cash. 💵
Do you trade altcoins without looking at Bitcoin, or do you check the macro trend first? 👇
#CryptoTrading. #tradingpsicologia #AnalisisTecnico
#BinanceSquare $ETH $SOL
{spot}(BTCUSDT)
📉 Many see the RSI for $BNB (76) or $XRP (74) and rush to buy. I prefer to look at the bigger picture. 🧐
The altcoin market is seeing a small short-term bounce, which is tempting many traders. But what about the King? 👑
$BTC is still trading below its 200-period moving average on the 4H chart. My bot has a “Macro Filter”: if Bitcoin is weak, it folds its arms and doesn’t buy anything, no matter how good the charts for other coins look.
📊 Why do I do this? Because trading against the overall trend is the fastest way to lose money. It’s not about guessing the next peak; it’s about preserving capital.
When $BTC breaks resistance, the bot will start trading. Until then, the best position is cash. 💵
Do you trade altcoins without looking at Bitcoin, or do you check the macro trend first? 👇
#CryptoTrading. #tradingpsicologia #AnalisisTecnico
#BinanceSquare $ETH $SOL
134
·
--
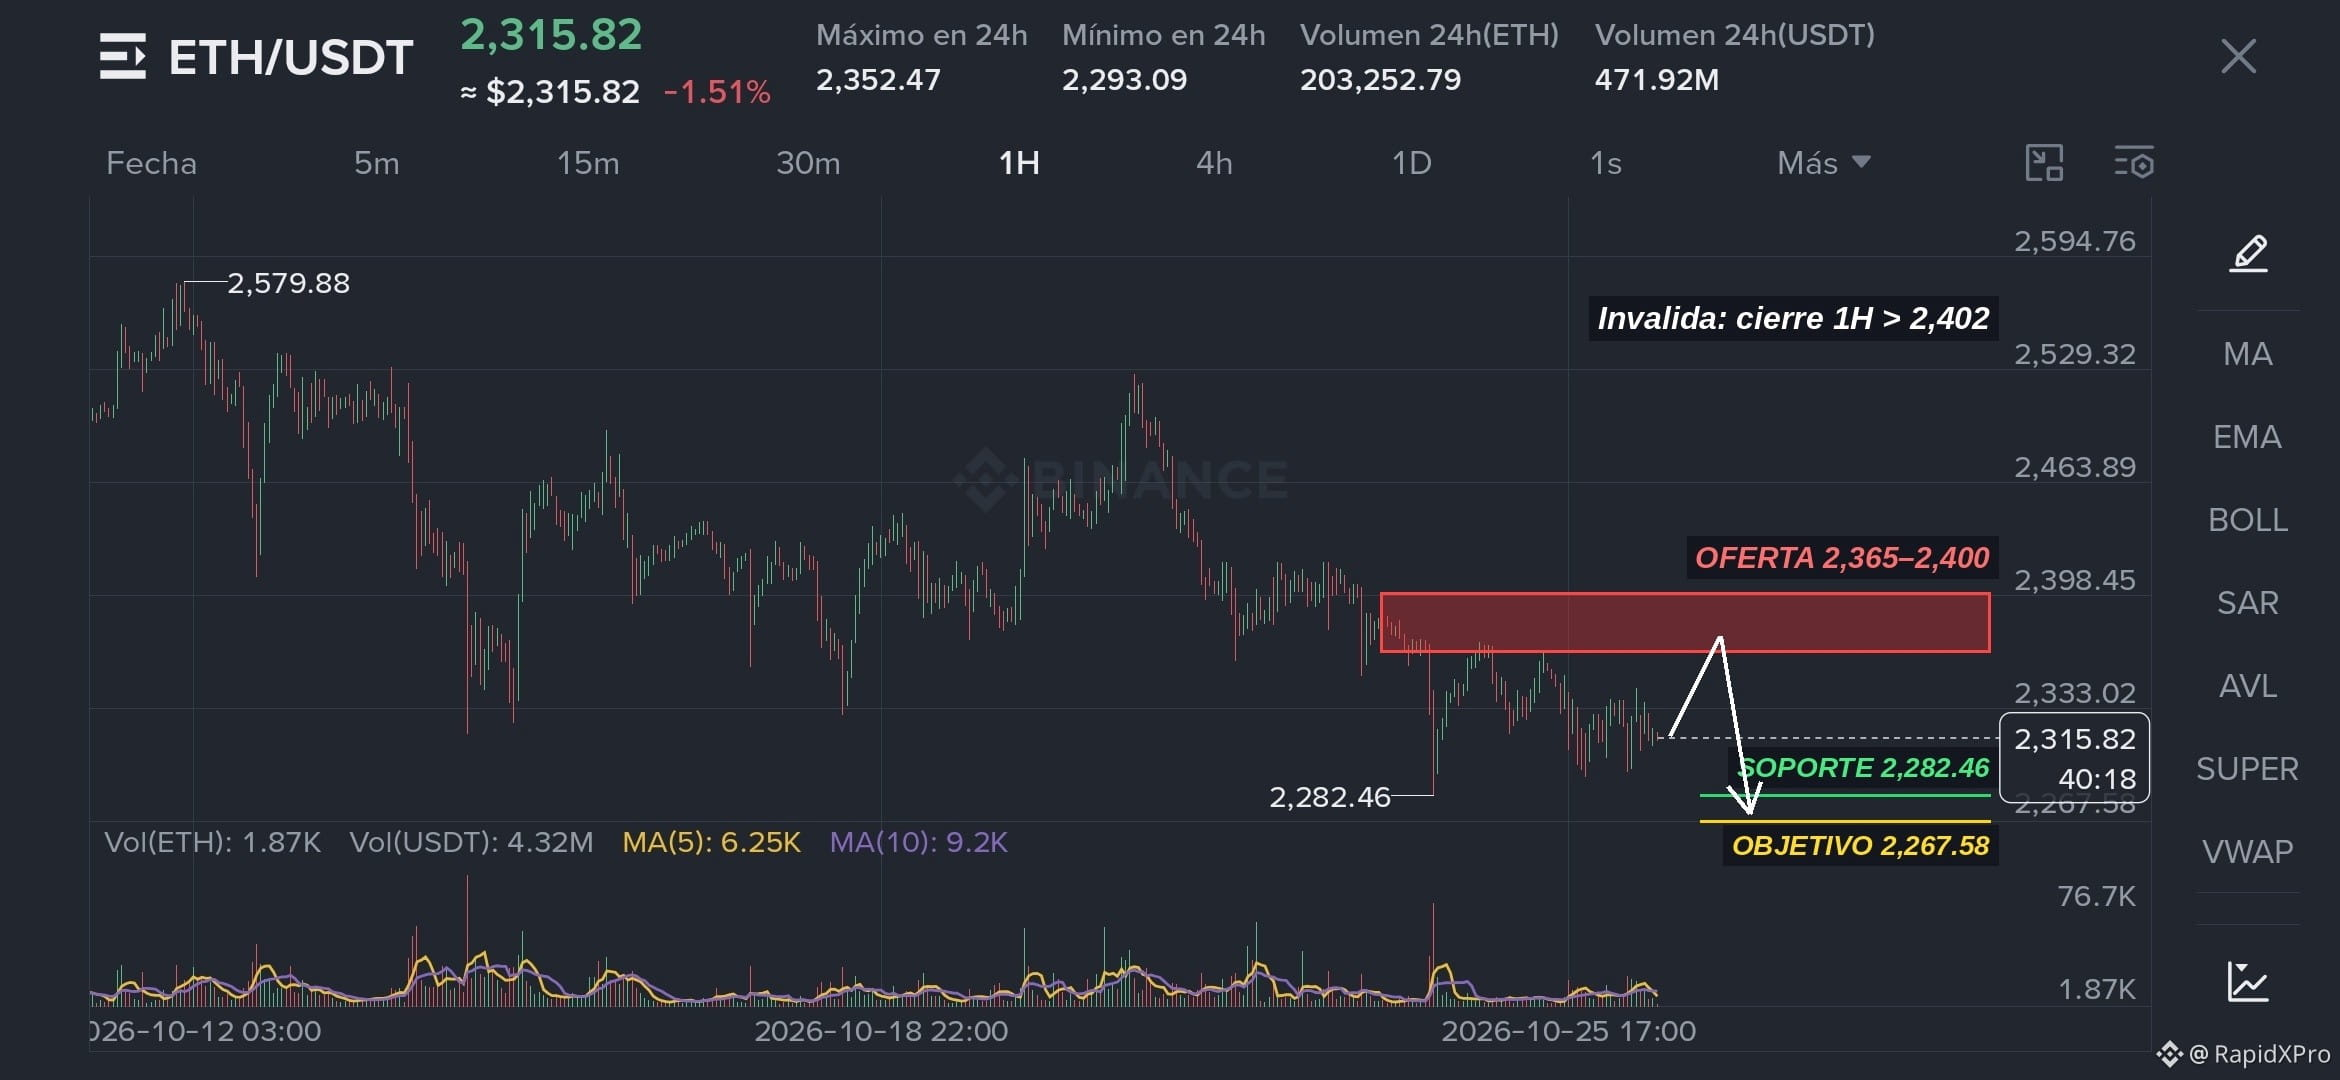
Bias: bearish; a pattern of lower highs and lower lows, with a low-volume bounce.
Most likely: bounce toward 2,365–2,400, rejection, then a drop toward 2,282 and 2,267.58.
Alternative: a 1H close > 2,402 invalidates this setup and opens the way to 2,440+.
Levels: 2,365–2,400 (supply), 2,282.46 (support), 2,267.58 (target).
R/R: entering around 2,365 with a stop at 2,402 and a target of 2,267.58 gives approximately 1:2.6. Wait for a rejection candle (wick/bearish close) in the zone. Entering at the current price (2,315) gives a poor R/R (~1:0.6), so there is no edge. $ETH #ETH #AnalisisTecnico
{spot}(ETHUSDT)
Bias: bearish; a pattern of lower highs and lower lows, with a low-volume bounce.
Most likely: bounce toward 2,365–2,400, rejection, then a drop toward 2,282 and 2,267.58.
Alternative: a 1H close > 2,402 invalidates this setup and opens the way to 2,440+.
Levels: 2,365–2,400 (supply), 2,282.46 (support), 2,267.58 (target).
R/R: entering around 2,365 with a stop at 2,402 and a target of 2,267.58 gives approximately 1:2.6. Wait for a rejection candle (wick/bearish close) in the zone. Entering at the current price (2,315) gives a poor R/R (~1:0.6), so there is no edge. $ETH #ETH #AnalisisTecnico
105
·
--
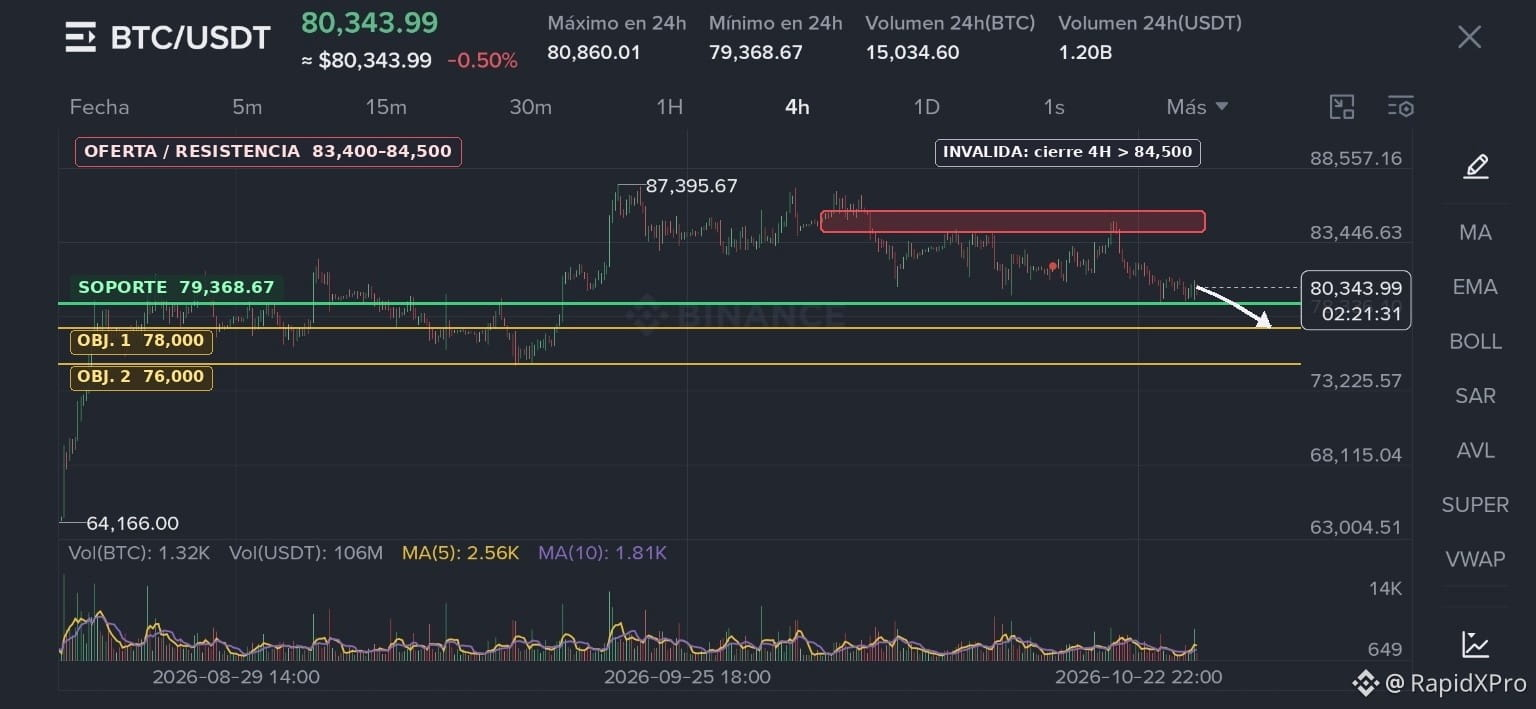
Asset: BTC/USDT · Timeframe: 4 hours.
Bias: bearish in the short term; the chart shows lower highs after reaching approximately 87,395 USDT.
Likely scenario: if selling pressure continues, BTC could test support at 79,368 USDT and, if it breaks below that level, move toward 78,000 USDT.
Alternative scenario: a recovery above 83,400–84,500 USDT would weaken the bearish thesis.
Key levels: support at 79,368 USDT; targets at 78,000 and 76,000 USDT; resistance between 83,400 and 84,500 USDT. #BTC #Bitcoin #BTCUSDT #Trading #AnalisisTecnico #CryptoTrading
#PriceAction
88
·
--
🎓 Today $BTC is “strongly bearish”… and also “bullish.” Both are true. Let me explain why.
📌 The concept: the trend always depends on the timeframe (the size of each candle). The same coin can fall on 4-hour candles and still be bullish on daily candles.
📊 Example using today's data (Binance):
• 4-hour chart: price ~ $80,650, below the 20 EMA ($81,218), the 50 EMA ($81,774), and the 200 EMA ($82,076) → short-term bearish trend.
• Daily chart: the 200 EMA is at $73,981, well below the price → the broader trend remains bullish or range-bound.
❌ Common mistake: seeing “BTC is bearish” on a 4-hour chart and making a decision meant to last months (or vice versa). Short-term traders look at 1-hour–4-hour charts; long-term investors look at the daily or weekly chart.
✅ Summary: before you say “up” or “down,” specify the timeframe.
What timeframe do you use to look at the chart: 15 min, 4 hours, daily, or weekly? Let us know in the comments 👇
#Bitcoin #AnalisisTecnico #Trading #AprendeCripto #Tra100d
⚠️ For informational and educational purposes only; this is not financial advice. Cryptocurrencies are volatile: do your own research and trade with caution.
60

Article
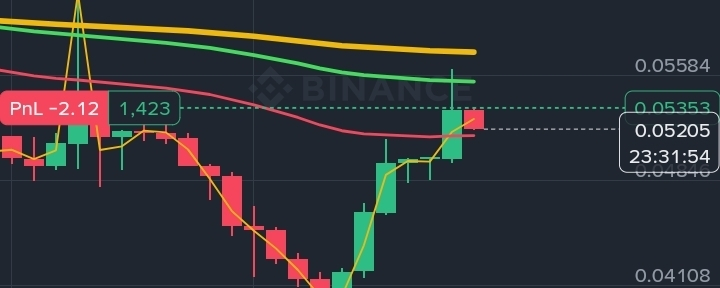
TA/USDT🔥 $TA / USDT (Perp) – Strong 1D recovery and key support above the EMA(50)! 🚀📈
Attention, Binance Futures traders! The TAUSDT (Trusta.AI) perpetual contract is showing an excellent recovery structure on the daily chart (1D) after bottoming at 0.03538.
Price just tested liquidity at the EMA(100) resistance (0.05538), setting a 24-hour high of 0.05628. It is now making a healthy technical pullback to find support just above the EMA(50) (0.05160), trading at 0.05205 (+4.06%).
TA/USDT
🔥 $TA / USDT (Perp) – Strong 1D recovery and key support above the EMA(50)! 🚀📈
Attention, Binance Futures traders! The TAUSDT (Trusta.AI) perpetual contract is showing an excellent recovery structure on the daily chart (1D) after bottoming at 0.03538.
Price just tested liquidity at the EMA(100) resistance (0.05538), setting a 24-hour high of 0.05628. It is now making a healthy technical pullback to find support just above the EMA(50) (0.05160), trading at 0.05205 (+4.06%).
129

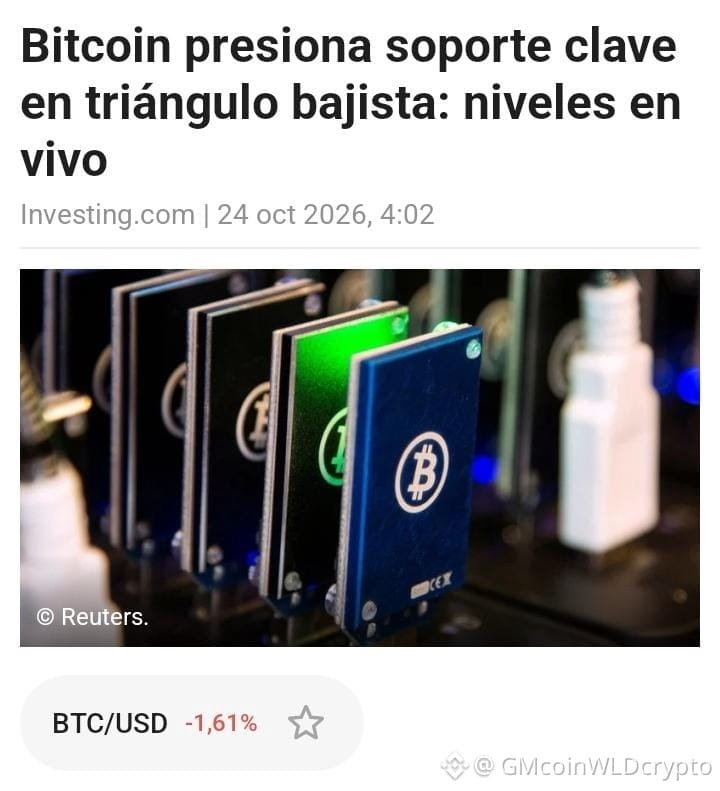
📉 BITCOIN (BTC) | BEARISH ANALYSIS
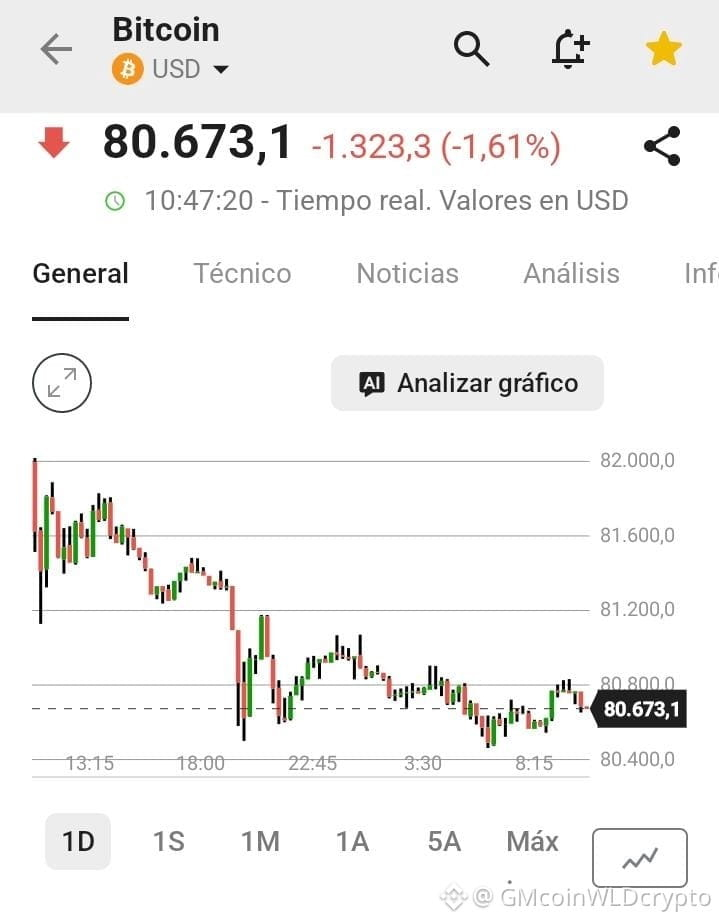
₿ Reference price: $80,773.9
Bitcoin remains under bearish pressure on the 5-hour chart, approaching the key support level at $80,500. A confirmed breakdown could open the way to lower levels.
🔴 BEARISH SCENARIO
If BTC loses $80,500 with a 5H close, the targets would be:
🎯 TP1: $77,781
🎯 TP2: $75,000
🎯 TP3: $72,000
📍 KEY ZONES
• Support: $80,500
• Resistance: $82,000–$82,500
• Potential buying zone: $79,500–$80,500, only with confirmation of a bounce.
📊 INDICATORS
The price is below the SMA200 and the Ichimoku cloud. The MACD remains in negative territory, reinforcing selling pressure.
⚠️ RISKS
A bounce toward $81,500 could be temporary. However, a break below $80,500 without volume could turn into a false bearish signal.
📌 Conclusion: $BTC
{future}(BTCUSDT)
is at a decisive level. Losing $80,500 could intensify the decline, while reclaiming $82,000–$82,500 would weaken the bearish scenario.
⚠️ Technical analysis based on the data provided. Scenarios are subject to price confirmation. This is not financial advice.
#bitcoin #BTC #Trading #Crypto #AnalisisTecnico
📉 BITCOIN (BTC) | BEARISH ANALYSIS
₿ Reference price: $80,773.9
Bitcoin remains under bearish pressure on the 5-hour chart, approaching the key support level at $80,500. A confirmed breakdown could open the way to lower levels.
🔴 BEARISH SCENARIO
If BTC loses $80,500 with a 5H close, the targets would be:
🎯 TP1: $77,781
🎯 TP2: $75,000
🎯 TP3: $72,000
📍 KEY ZONES
• Support: $80,500
• Resistance: $82,000–$82,500
• Potential buying zone: $79,500–$80,500, only with confirmation of a bounce.
📊 INDICATORS
The price is below the SMA200 and the Ichimoku cloud. The MACD remains in negative territory, reinforcing selling pressure.
⚠️ RISKS
A bounce toward $81,500 could be temporary. However, a break below $80,500 without volume could turn into a false bearish signal.
📌 Conclusion: $BTC
is at a decisive level. Losing $80,500 could intensify the decline, while reclaiming $82,000–$82,500 would weaken the bearish scenario.
⚠️ Technical analysis based on the data provided. Scenarios are subject to price confirmation. This is not financial advice.
#bitcoin #BTC #Trading #Crypto #AnalisisTecnico
10
·
--
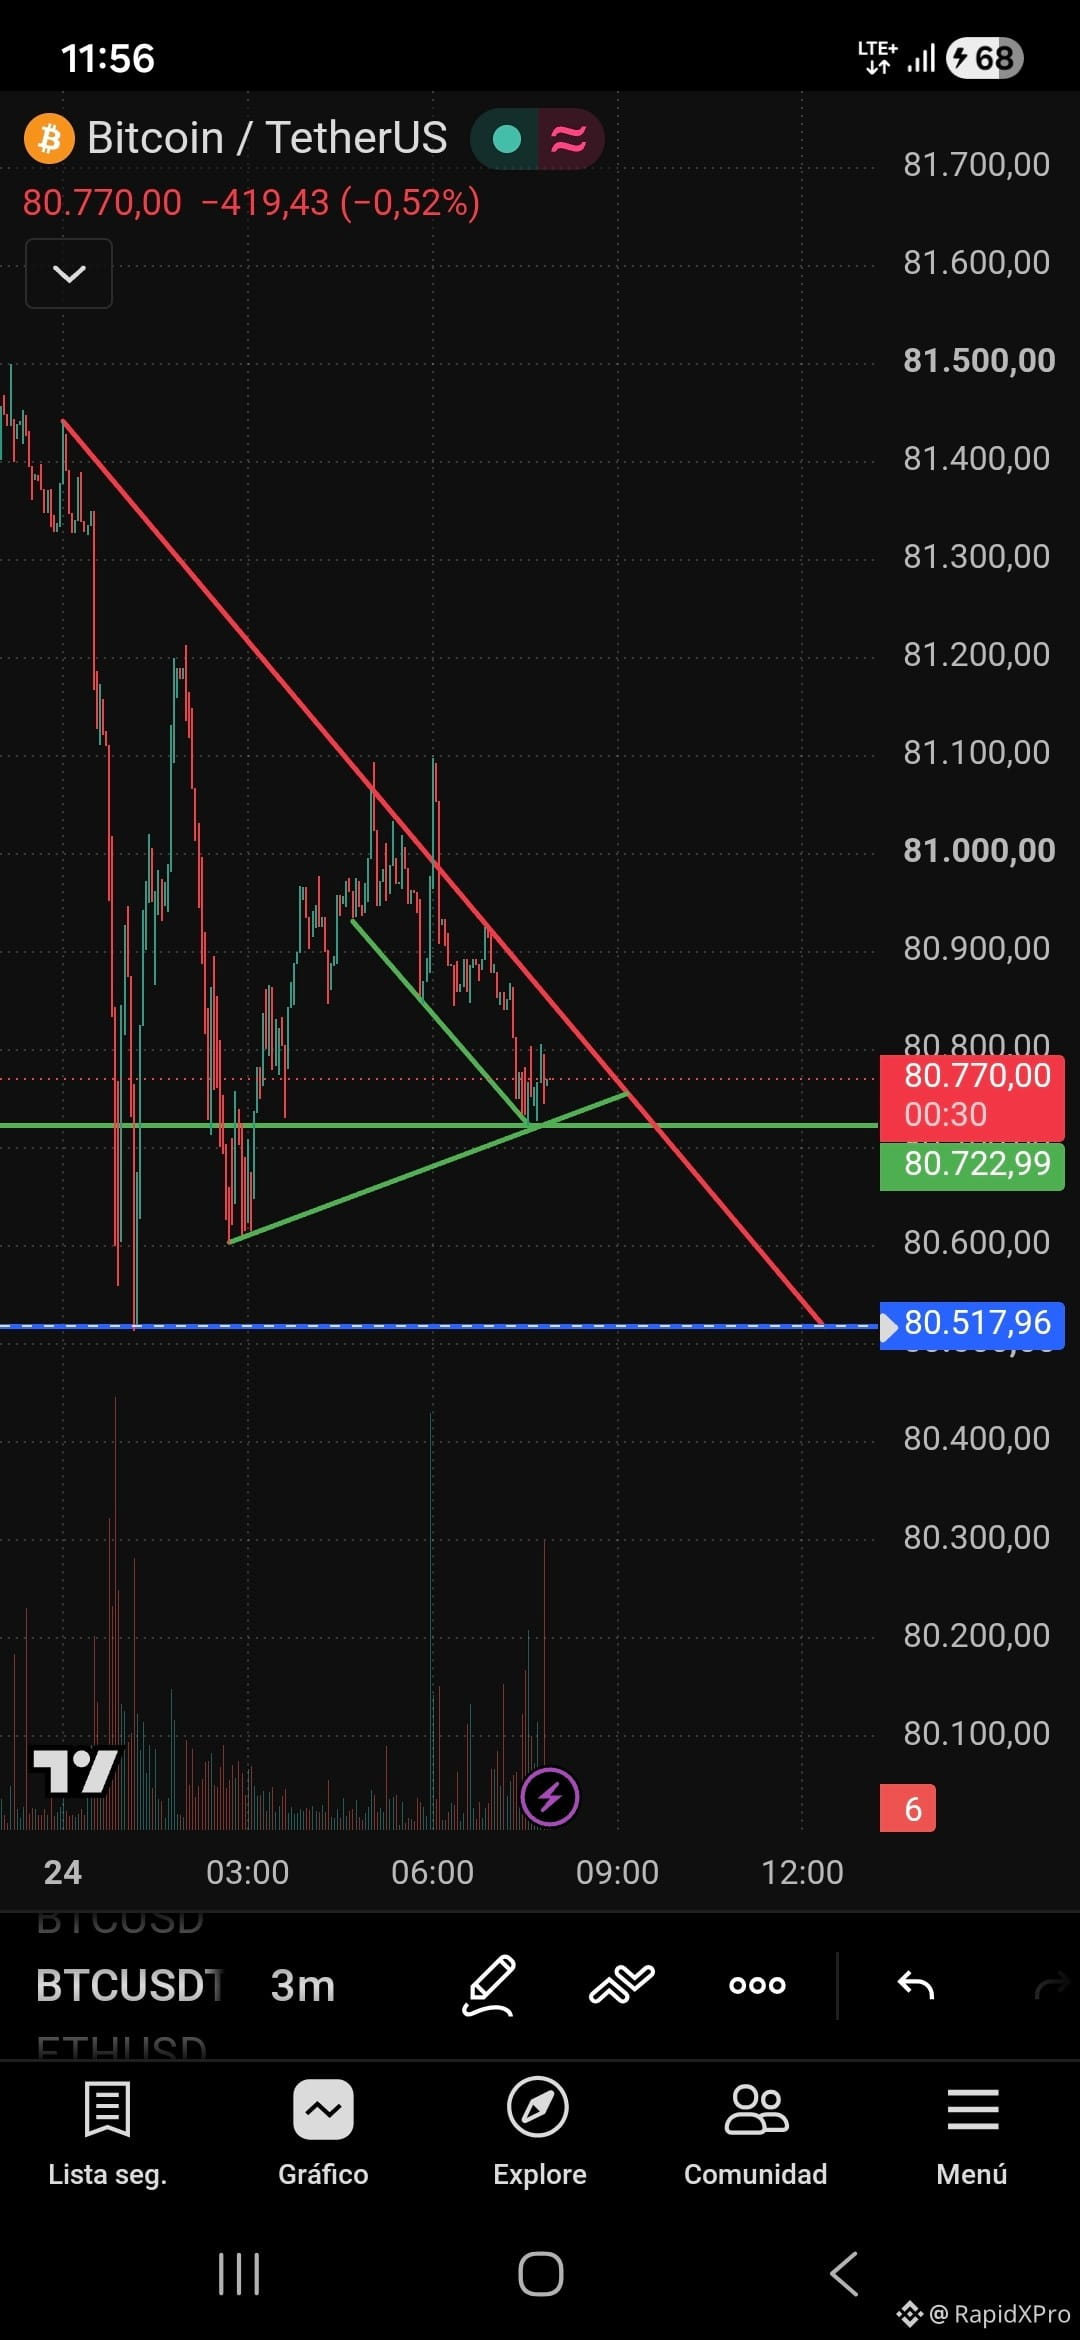
🚨 BTC/USDT: Key level at stake
Bitcoin ($BTC) is compressing against the descending trendline.
If it doesn’t break strongly to the upside, we’ll lose support and head straight to $80,517 in search of liquidity.
Patience and confirmation before entering. Does it drop or break out? 👇
#BTC #CRYPTO #TRADING #ANALISISTECNICO
Bitcoin ($BTC) is compressing against the descending trendline.
If it doesn’t break strongly to the upside, we’ll lose support and head straight to $80,517 in search of liquidity.
Patience and confirmation before entering. Does it drop or break out? 👇
#BTC #CRYPTO #TRADING #ANALISISTECNICO
1
280

·
--
Bearish
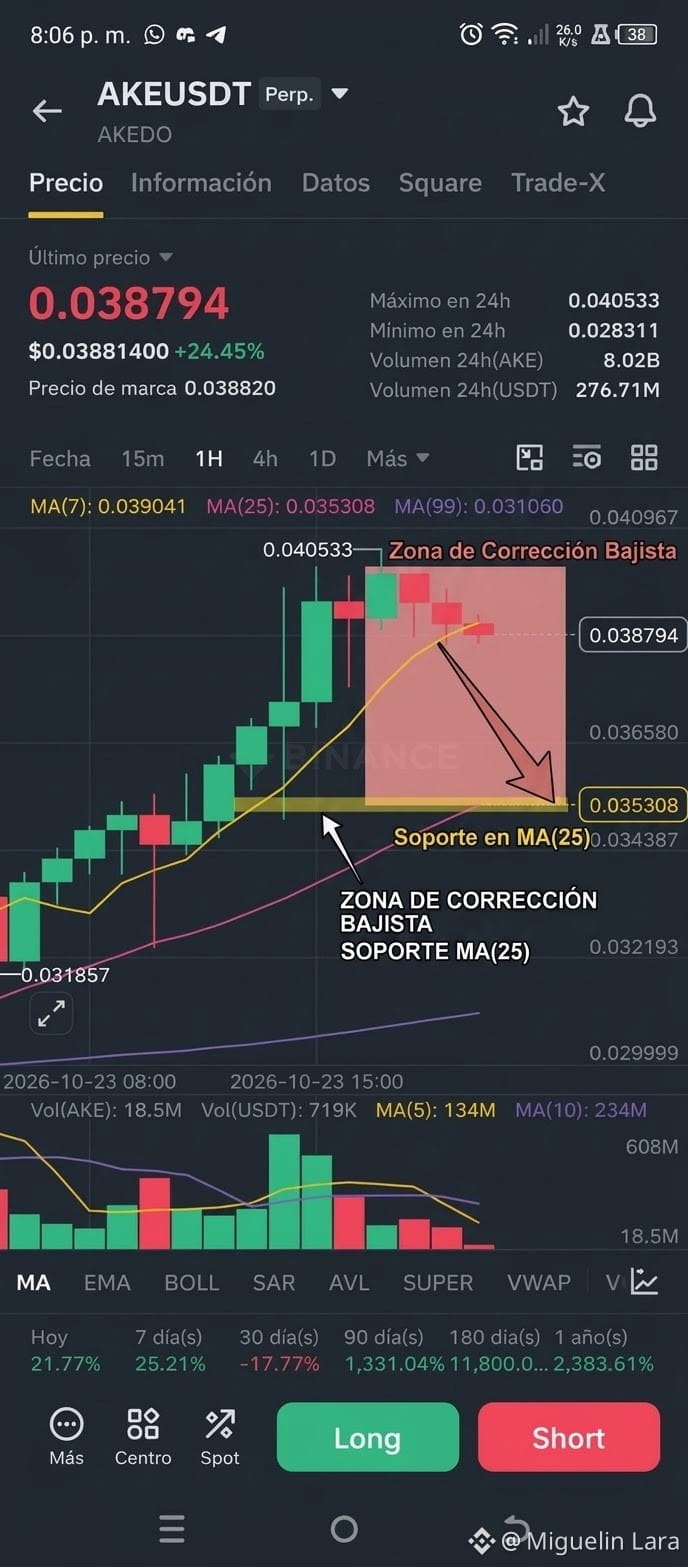
After an impressive bullish surge of more than +24% that pushed $AKE to a high of 0.040533, the 1H chart is showing clear signs of a pause and a possible technical pullback
#AKE #CryptoTrading #AnalisisTecnico #BinanceSquare
After an impressive bullish surge of more than +24% that pushed $AKE to a high of 0.040533, the 1H chart is showing clear signs of a pause and a possible technical pullback
#AKE #CryptoTrading #AnalisisTecnico #BinanceSquare
#AKE #CryptoTrading #AnalisisTecnico #BinanceSquare
1
235


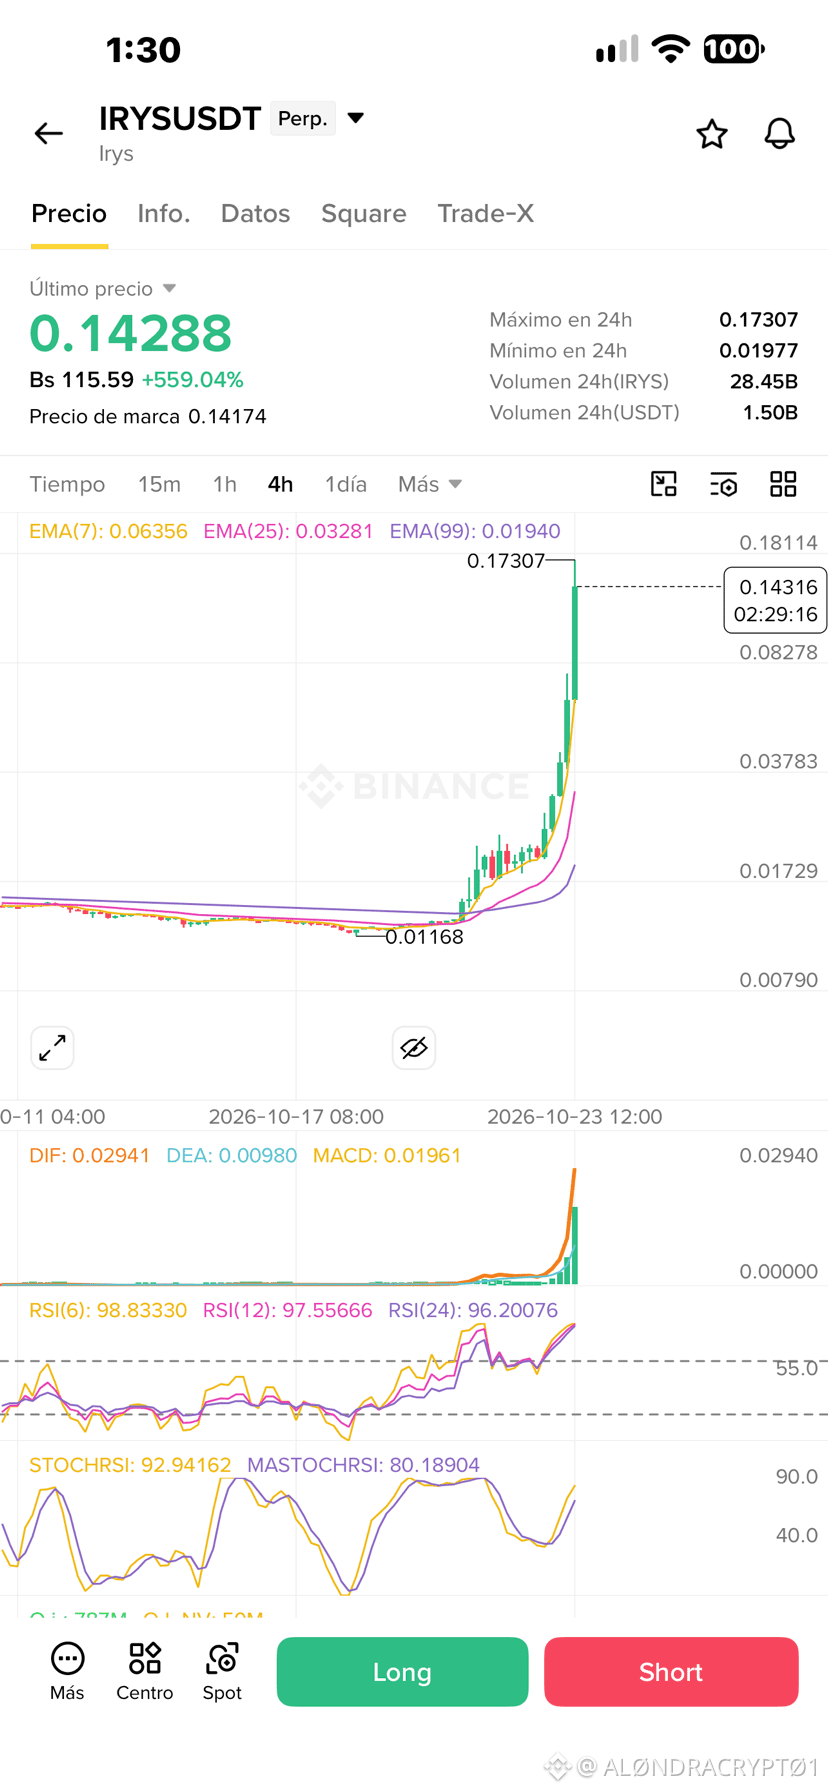
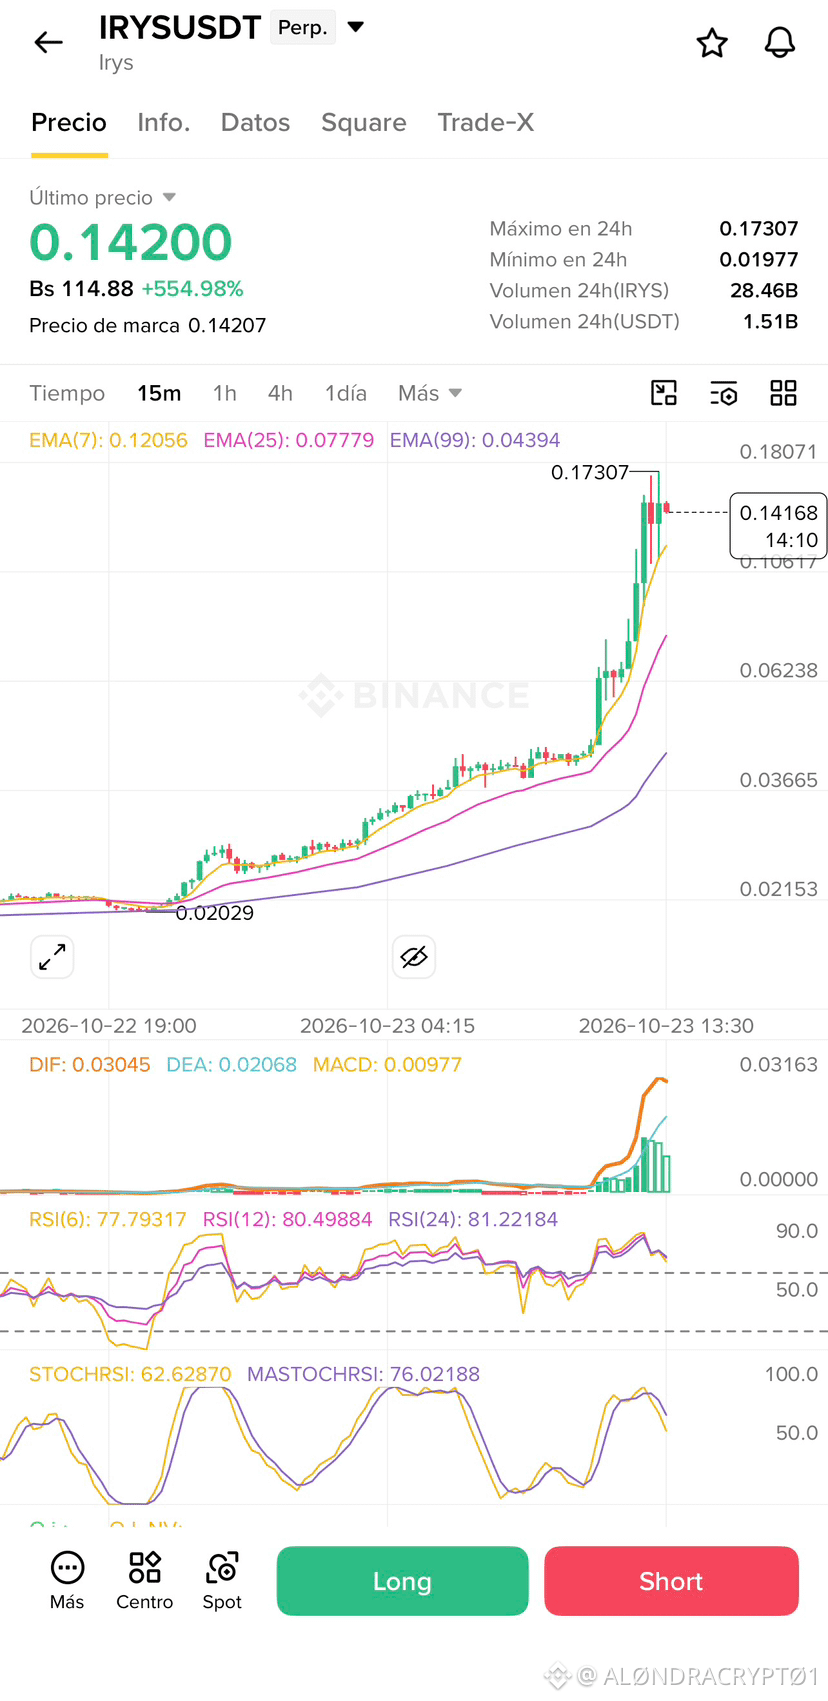
Folks, look at this crazy move with $IRYS : it’s recording an impressive increase of over 500%, with a staggering 24-hour volume of 28.45B in IRYS and 1.50B in USDT. If we look at the charts with a cool head, the Stochastic RSI on the 4-hour timeframe is looking strong and pointing upward, backing up the strength of this move. And although the indicator is already advanced on the lower timeframe, the market is still showing us that there’s an opportunity for further upside.
Have you already jumped on this rally, or would you rather wait for a pullback before entering?
Stay alert, and trade strategically!
#AnalisisTecnico
{future}(IRYSUSDT)
Folks, look at this crazy move with $IRYS : it’s recording an impressive increase of over 500%, with a staggering 24-hour volume of 28.45B in IRYS and 1.50B in USDT. If we look at the charts with a cool head, the Stochastic RSI on the 4-hour timeframe is looking strong and pointing upward, backing up the strength of this move. And although the indicator is already advanced on the lower timeframe, the market is still showing us that there’s an opportunity for further upside.
Have you already jumped on this rally, or would you rather wait for a pullback before entering?
Stay alert, and trade strategically!
#AnalisisTecnico
Have you already jumped on this rally, or would you rather wait for a pullback before entering?
Stay alert, and trade strategically!
#AnalisisTecnico
renacer21:
listo. Sigue escalando , eres excelente.
12
9
1.4k

·
--
📊 Is technical analysis forgotten, or is it still king? 🧠
Many say that in today’s crypto market, technical analysis (trend lines, support levels, RSI) no longer works like it used to because of the impact of artificial intelligence, macroeconomic news, and whale manipulation.
Others insist that charts reflect human psychology and that price ALWAYS respects key zones.
Here’s the current #BTC chart attached. Take a good look before you answer:
👇 LET’S DEBATE! Leave your comment below:
If you think the price is going to seek liquidity above by breaking through resistance. If you think a healthy correction is coming to flush out overleveraged futures traders.
Are you someone who trades based on chart patterns, or do you prefer to follow market sentiment and fundamentals? I’m reading all your comments! 💬🔥
#Bitcoin #AnalisisTecnico #CryptoTrading #BinanceSquar #BullRun2026
1
26
·
--
📊 Where is BTC headed today? The indicator you shouldn’t lose sight of
The crypto market moves fast, and making decisions without a plan is the quickest way to lose capital. Before hitting the buy or sell button at market price, consider this:
📉 The RSI (Relative Strength Index) on the 4H and 1D timeframes is showing key zones that every beginner trader should be monitoring. When AI summarizes current conditions, it reminds us that trading on impulse can be costly.
The best first task for anyone using AI assistants today isn’t opening leveraged futures contracts; it’s summarizing market conditions, understanding data sources, and mapping out support zones.
What’s your strategy for today? Are you accumulating on Spot or waiting for a deeper correction? 🧐💬
#Bitcoin #AnalisisTecnico #CryptoTrading #RSI
69

·
--
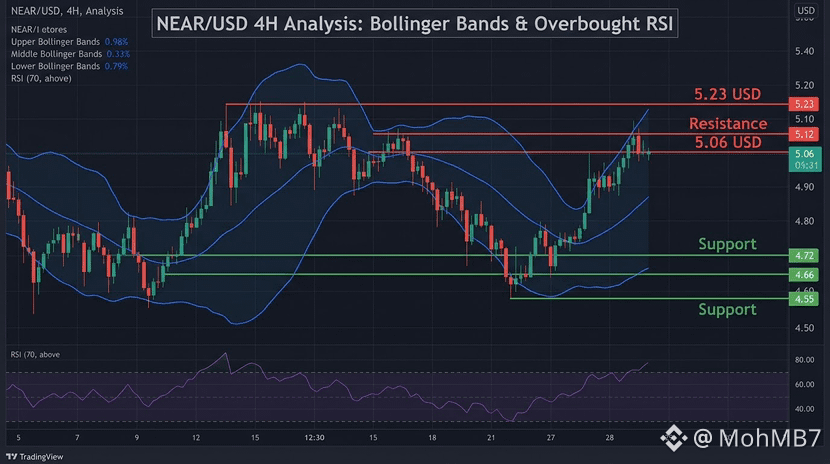
The 4-hour technical analysis using Bollinger Bands shows us an interesting scenario for trading cautiously.
Here are the key levels we should keep a close eye on:
🟢 Key support levels: $4.72, $4.66, and $4.55
🔴 Resistance levels: $5.06, $5.12, and $5.23
⚠️ Watch the RSI: It is currently in overbought territory, suggesting we should proceed with caution in case of a possible short-term correction or pullback before a new move higher. 📊
💬 What’s your strategy for NEAR? Are you waiting for the price to reach support, or do you think it will break through resistance? I’m looking forward to your comments! $NEAR #cryptotrading #BinanceSquare #TechnicalAnalysis
124

·
--
Bullish
📈🌐 TRADING STRATEGY: How to trade based on market conditions? 🎯🐂🐻
A trader’s biggest mistake is using the same strategy regardless of chart conditions. To be consistently profitable, you need to adapt your tactics to the market phase:
1. Bull Market 🚀🐂:
Strategy: Buy the dip.
Tactics: Don’t chase green candles at their highs. Wait for the price to pull back to key support levels or major moving averages, build your position in line with the trend, and let your profits run while taking profits in stages.
2. Bear Market 📉🐻:
Strategy: Sell the rally or hold liquidity in stablecoins.
Tactics: The main trend is downward. Avoid buying false bottoms out of FOMO. Look for technical short-selling opportunities when the price fails at former support levels that have turned into resistance, or keep your capital protected in stablecoins while waiting for the reaccumulation phase.
3. Sideways / Range-Bound Market ↔️🧱:
Strategy: Range trading or scalping.
Tactics: The price fluctuates between well-defined support and resistance levels. Buy near the bottom of the range and sell (or open short positions) near the top. Use oscillators such as the RSI to identify overbought or oversold conditions at the extremes.
💬 Trader, what kind of market are you most comfortable trading right now? Let me know in the comments! 👇
#BİNANCESQUARE
#tradingStrategy
#AnalisisTecnico
#cryptotrading
{spot}(BTCUSDT)
{future}(BTCUSDT)
📈🌐 TRADING STRATEGY: How to trade based on market conditions? 🎯🐂🐻
A trader’s biggest mistake is using the same strategy regardless of chart conditions. To be consistently profitable, you need to adapt your tactics to the market phase:
1. Bull Market 🚀🐂:
Strategy: Buy the dip.
Tactics: Don’t chase green candles at their highs. Wait for the price to pull back to key support levels or major moving averages, build your position in line with the trend, and let your profits run while taking profits in stages.
2. Bear Market 📉🐻:
Strategy: Sell the rally or hold liquidity in stablecoins.
Tactics: The main trend is downward. Avoid buying false bottoms out of FOMO. Look for technical short-selling opportunities when the price fails at former support levels that have turned into resistance, or keep your capital protected in stablecoins while waiting for the reaccumulation phase.
3. Sideways / Range-Bound Market ↔️🧱:
Strategy: Range trading or scalping.
Tactics: The price fluctuates between well-defined support and resistance levels. Buy near the bottom of the range and sell (or open short positions) near the top. Use oscillators such as the RSI to identify overbought or oversold conditions at the extremes.
💬 Trader, what kind of market are you most comfortable trading right now? Let me know in the comments! 👇
#BİNANCESQUARE
#tradingStrategy
#AnalisisTecnico
#cryptotrading
2
2
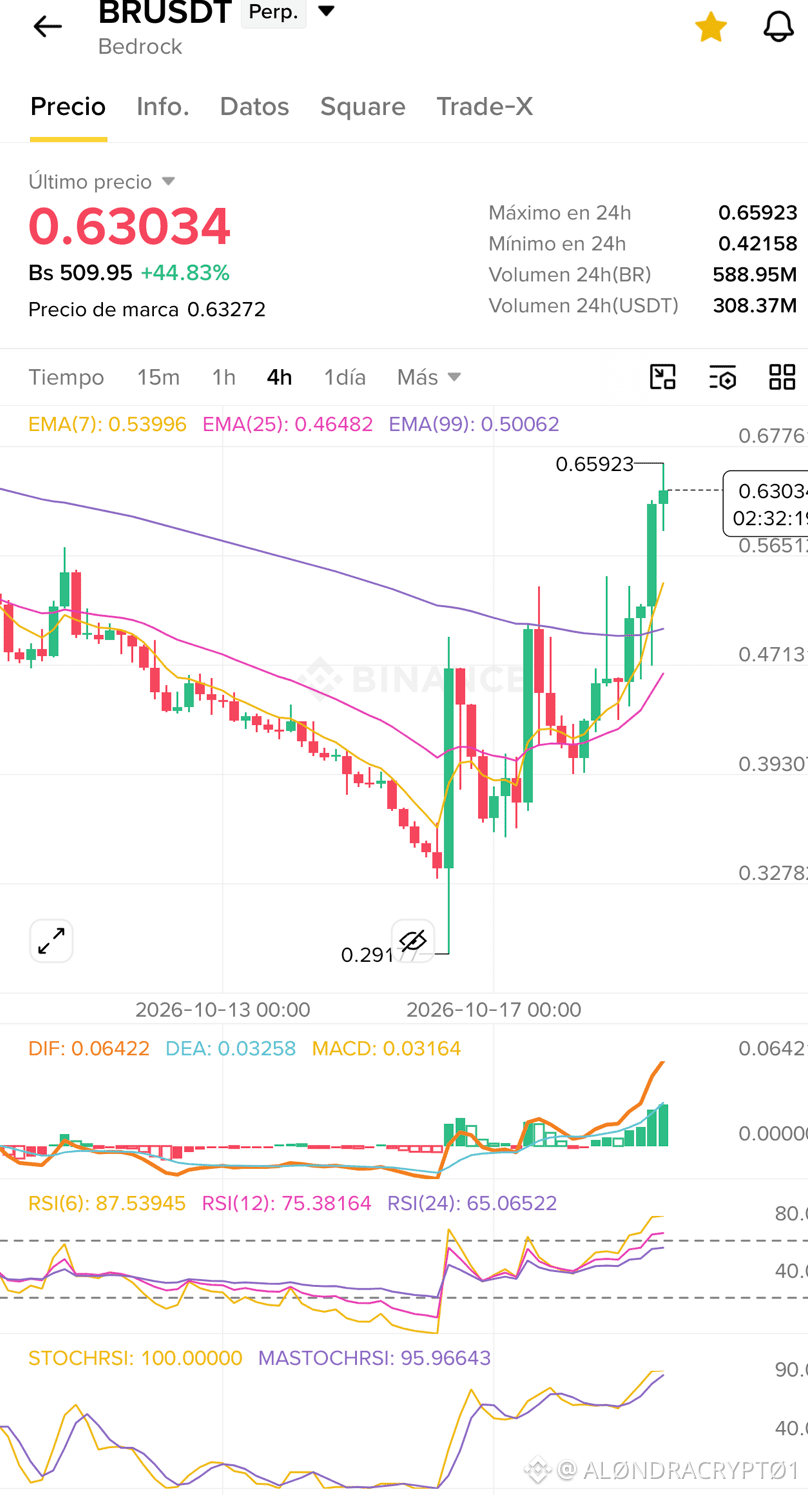
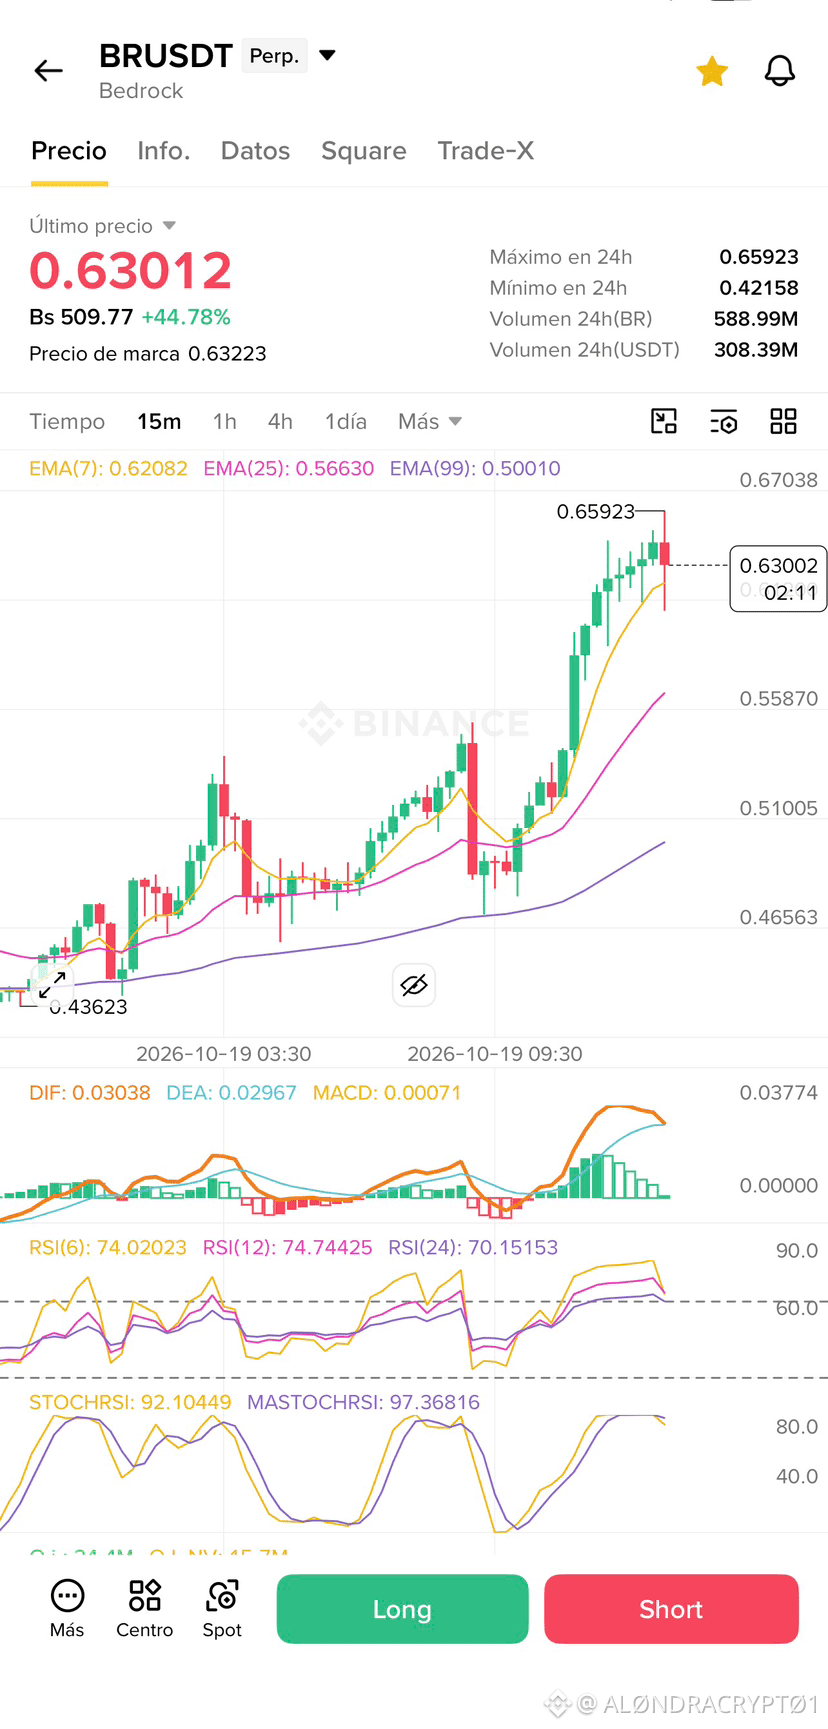
Everyone, pay attention to this: if we look at the daily and four-hour timeframes for $BR , the Stochastic RSI looks strong and is pointing upward, which shows us that momentum is still alive. And even though on the lower timeframe the Stochastic is already almost touching 100, there’s still room to keep climbing, although there could be a slight pullback.
#technicalanalysis
#technicalanalysis
9
769

·
--
Bullish
A risk-free trade in my Trader’s Diary! 🌸 Many of you read my posts looking for magic formulas, but the real key is risk management. 🛡️ Today I’m sharing my current trade in $ETH en on the Spot market.
I entered a lovely institutional support zone and, as the price moved in my favor, I decided to secure my position using an OCO order. ⚙️ I set my Take Profit to target a return of +1.33% before hitting a major sell wall. 📈
And the best part? I set my protective Stop-Loss in profit, guaranteeing a +0.15% gain if the market reverses. 💎 Win or lose, my balance will stay in the green, and my capital is 100% safe from catastrophic losses! Patience pays off. 📊 $ETH $BTC #BinanceSquare #CryptoTrading #AnalisisTecnico #diariodeunatrader
If you enjoy learning with me step by step, give me a Like, leave your thoughts in the comments, and Follow my profile! 🌟 Your support with a tip helps fuel this journey. 💖
{spot}(ETHUSDT)
A risk-free trade in my Trader’s Diary! 🌸 Many of you read my posts looking for magic formulas, but the real key is risk management. 🛡️ Today I’m sharing my current trade in $ETH en on the Spot market.
I entered a lovely institutional support zone and, as the price moved in my favor, I decided to secure my position using an OCO order. ⚙️ I set my Take Profit to target a return of +1.33% before hitting a major sell wall. 📈
And the best part? I set my protective Stop-Loss in profit, guaranteeing a +0.15% gain if the market reverses. 💎 Win or lose, my balance will stay in the green, and my capital is 100% safe from catastrophic losses! Patience pays off. 📊 $ETH $BTC #BinanceSquare #CryptoTrading #AnalisisTecnico #diariodeunatrader
If you enjoy learning with me step by step, give me a Like, leave your thoughts in the comments, and Follow my profile! 🌟 Your support with a tip helps fuel this journey. 💖
42
Log in to explore more content
Join global crypto users on Binance Square
⚡️ Get latest and useful information about crypto.
💬 Trusted by the world’s largest crypto exchange.
👍 Discover real insights from verified creators.
Email / Phone number
Trending Topics
1
#CanMicrosoftDeliverOnAI
537,393 views
3,577 Discussing
2
#CanGoogleDefindItsCore
325,859 views
2,530 Discussing
3
#EarningsSeason
6M views
29,792 Discussing
4
#BitcoinCoreIdentifiesThreeVulnerabilities
190 views
30 Discussing
5
#StrategyShareholdersApproveDailyDividends
200 views
23 Discussing
6
#FedLowerBoundRateDecisionAt3.75%
186 views
18 Discussing
7
#TokenizedGoldXAUaLaunchesOnSui
218 views
15 Discussing
8
#$10.9BBitcoinOptionsExpireFriday
2,802 views
99 Discussing
9
#ThailandSupremeCourtRulesBitcoinIsProperty
18,445 views
416 Discussing
10
#BitcoinSurpasses$81K
43,335 views
143 Discussing