
#analisistecnico
analisistecnico
1M views
2,965 Discussing
Hot
Latest

🚀 BNB IS IN A CONSOLIDATION PHASE: A CHANCE TO ACCUMULATE OR A DEEP CORRECTION? ⚡
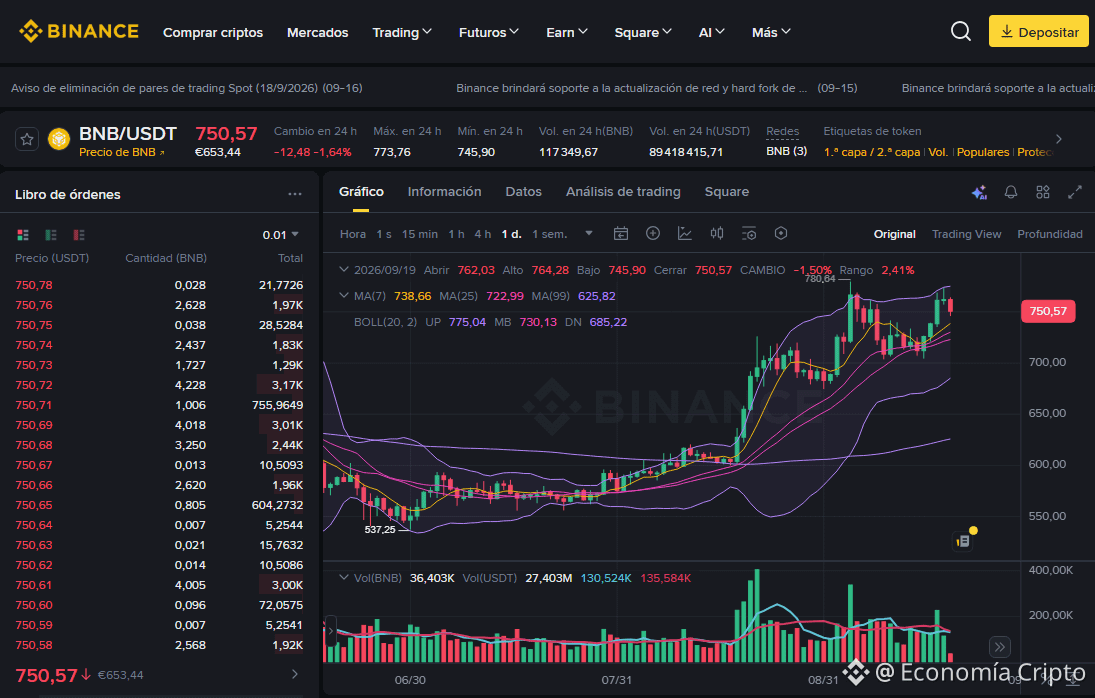
The BNB/USDT pair is trading at 750.57, registering a -1.64% pullback over the last 24 hours. The daily session shows an opening of 762.03, a high of 764.28, a low of 745.90, and a close of 750.57 (-1.50%), reflecting a technical pause after testing higher zones.
🔍 Trend Analysis and Indicators
Trend: Bullish at the base, with a temporary short-term pullback, while the overall market structure remains intact.
Moving Averages: Price is comfortably above the MA(7) (738.66) and the MA(25) (722.99), while the long-term macro trend remains firmly bullish, trading well above the MA(99) (625.82).
Bollinger Bands: The quotation pulls back from the upper zone and seeks support toward the middle band MB (730.13), with the upper band UP (775.04) and the lower band DN (685.22), showing a rebalancing of volatility after the previous impulse.
Key Levels: Immediate support is located at the session low of 745.90, while the main resistance to overcome is found at the highs of 773.76.
💡 Trading Strategy: Buy or Sell?
Buy (Long)?: This controlled pullback offers an interesting tactical accumulation opportunity to position in favor of the main trend, managing risk with a Stop Loss set below the moving averages.
Sell (Short)?: Trading to the downside carries high risk because it goes against the macro structure; it would only be considered in case of a sustained loss of the key supports.
#BNB #AnalisisTecnico #CryptoTrading
May the Lord bless and prosper those who operate here, in the name of Jesus, because your word says: "The silver is mine, and the gold is mine," says the LORD of hosts. Hageo 2:8 RV1960-T -
$BNB
{alpha}(560x44440f83419de123d7d411187adb9962db017d03)
{future}(BNBUSDT)
{spot}(BNBUSDT)
🚀 BNB IS IN A CONSOLIDATION PHASE: A CHANCE TO ACCUMULATE OR A DEEP CORRECTION? ⚡
The BNB/USDT pair is trading at 750.57, registering a -1.64% pullback over the last 24 hours. The daily session shows an opening of 762.03, a high of 764.28, a low of 745.90, and a close of 750.57 (-1.50%), reflecting a technical pause after testing higher zones.
🔍 Trend Analysis and Indicators
Trend: Bullish at the base, with a temporary short-term pullback, while the overall market structure remains intact.
Moving Averages: Price is comfortably above the MA(7) (738.66) and the MA(25) (722.99), while the long-term macro trend remains firmly bullish, trading well above the MA(99) (625.82).
Bollinger Bands: The quotation pulls back from the upper zone and seeks support toward the middle band MB (730.13), with the upper band UP (775.04) and the lower band DN (685.22), showing a rebalancing of volatility after the previous impulse.
Key Levels: Immediate support is located at the session low of 745.90, while the main resistance to overcome is found at the highs of 773.76.
💡 Trading Strategy: Buy or Sell?
Buy (Long)?: This controlled pullback offers an interesting tactical accumulation opportunity to position in favor of the main trend, managing risk with a Stop Loss set below the moving averages.
Sell (Short)?: Trading to the downside carries high risk because it goes against the macro structure; it would only be considered in case of a sustained loss of the key supports.
#BNB #AnalisisTecnico #CryptoTrading
May the Lord bless and prosper those who operate here, in the name of Jesus, because your word says: "The silver is mine, and the gold is mine," says the LORD of hosts. Hageo 2:8 RV1960-T -
$BNB
The BNB/USDT pair is trading at 750.57, registering a -1.64% pullback over the last 24 hours. The daily session shows an opening of 762.03, a high of 764.28, a low of 745.90, and a close of 750.57 (-1.50%), reflecting a technical pause after testing higher zones.
🔍 Trend Analysis and Indicators
Trend: Bullish at the base, with a temporary short-term pullback, while the overall market structure remains intact.
Moving Averages: Price is comfortably above the MA(7) (738.66) and the MA(25) (722.99), while the long-term macro trend remains firmly bullish, trading well above the MA(99) (625.82).
Bollinger Bands: The quotation pulls back from the upper zone and seeks support toward the middle band MB (730.13), with the upper band UP (775.04) and the lower band DN (685.22), showing a rebalancing of volatility after the previous impulse.
Key Levels: Immediate support is located at the session low of 745.90, while the main resistance to overcome is found at the highs of 773.76.
💡 Trading Strategy: Buy or Sell?
Buy (Long)?: This controlled pullback offers an interesting tactical accumulation opportunity to position in favor of the main trend, managing risk with a Stop Loss set below the moving averages.
Sell (Short)?: Trading to the downside carries high risk because it goes against the macro structure; it would only be considered in case of a sustained loss of the key supports.
#BNB #AnalisisTecnico #CryptoTrading
May the Lord bless and prosper those who operate here, in the name of Jesus, because your word says: "The silver is mine, and the gold is mine," says the LORD of hosts. Hageo 2:8 RV1960-T -
$BNB
1
129
🚀 Ethereum is in a correction phase: entry opportunity or a technical pause? ⚡
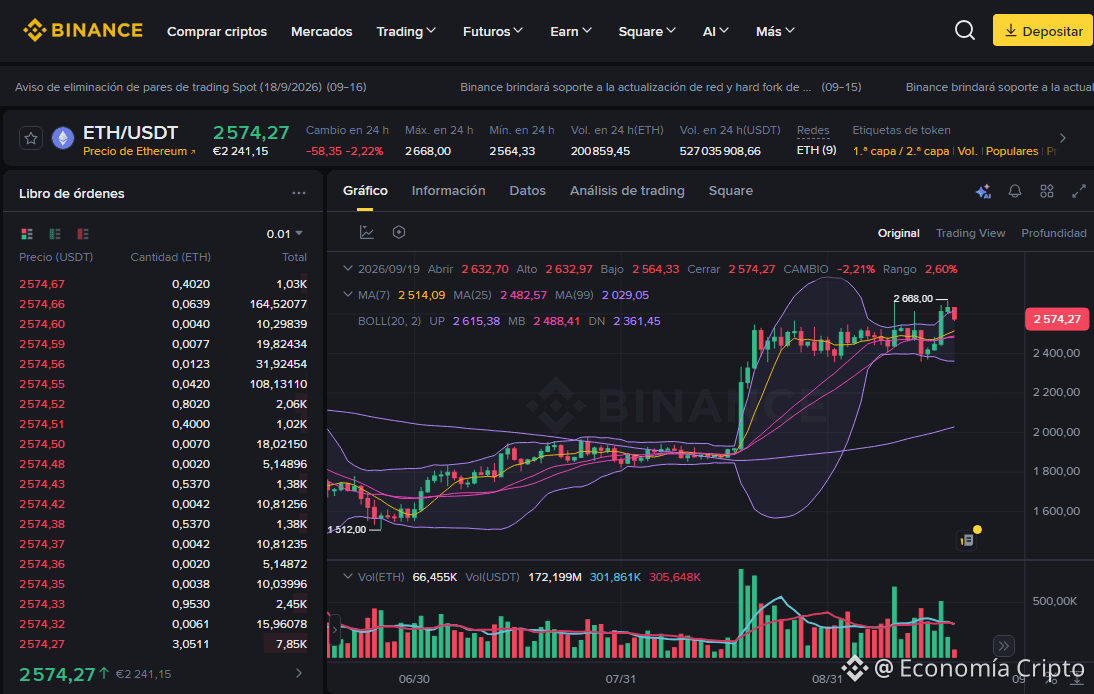
The ETH/USDT pair is trading at 2,574.27, recording a -2.22% correction over the last 24 hours. The daily session shows an open at 2,632.70, a high of 2,632.97, a low of 2,564.33, and a -2.21% adjustment, reflecting a healthy breather after testing the recent highs at 2,668.00.
🔍 Trend Analysis and Indicators
Trend: Bullish underlying trend with a temporary short-term pullback, while keeping the market’s overall structure intact.
Moving Averages: The price remains solidly above the MA(7) (2,514.09) and the MA(25) (2,482.57). Meanwhile, the long-term macro trend stays firmly bullish, as it is trading well above the MA(99) (2,029.05).
Bollinger Bands: Price is retreating from the upper zone and looking for support toward the middle band MB (2,488.41), with the upper band at UP (2,615.38) and the lower band at DN (2,361.45). This indicates a rebalancing of volatility after the previous impulse.
Key Levels: Immediate support is located at the session low of 2,564, while the main resistance to break is found at the highs of 2,668.
💡 Trading Strategy: Buy or Sell?
Buy (Long)?: This controlled pullback offers an interesting tactical opportunity for accumulation to position in favor of the main trend, managing risk with a Stop Loss set below the moving averages.
Sell (Short)?: Trading to the downside carries high risk because it goes against the macro structure; it would only be considered in the event of a sustained loss of the key supports.
#Ethereum #AnalisisTecnico #CryptoTrading
May the Lord bless and prosper whoever operates here, in the name of Jesus, since your word says: "Mine is the silver, and mine is the gold," says the LORD of hosts. Hageo 2:8 RV1960-T -
$ETH
{spot}(BTCUSDT)
{spot}(METABUSDT)
{spot}(ETHUSDT)
🚀 Ethereum is in a correction phase: entry opportunity or a technical pause? ⚡
The ETH/USDT pair is trading at 2,574.27, recording a -2.22% correction over the last 24 hours. The daily session shows an open at 2,632.70, a high of 2,632.97, a low of 2,564.33, and a -2.21% adjustment, reflecting a healthy breather after testing the recent highs at 2,668.00.
🔍 Trend Analysis and Indicators
Trend: Bullish underlying trend with a temporary short-term pullback, while keeping the market’s overall structure intact.
Moving Averages: The price remains solidly above the MA(7) (2,514.09) and the MA(25) (2,482.57). Meanwhile, the long-term macro trend stays firmly bullish, as it is trading well above the MA(99) (2,029.05).
Bollinger Bands: Price is retreating from the upper zone and looking for support toward the middle band MB (2,488.41), with the upper band at UP (2,615.38) and the lower band at DN (2,361.45). This indicates a rebalancing of volatility after the previous impulse.
Key Levels: Immediate support is located at the session low of 2,564, while the main resistance to break is found at the highs of 2,668.
💡 Trading Strategy: Buy or Sell?
Buy (Long)?: This controlled pullback offers an interesting tactical opportunity for accumulation to position in favor of the main trend, managing risk with a Stop Loss set below the moving averages.
Sell (Short)?: Trading to the downside carries high risk because it goes against the macro structure; it would only be considered in the event of a sustained loss of the key supports.
#Ethereum #AnalisisTecnico #CryptoTrading
May the Lord bless and prosper whoever operates here, in the name of Jesus, since your word says: "Mine is the silver, and mine is the gold," says the LORD of hosts. Hageo 2:8 RV1960-T -
$ETH
The ETH/USDT pair is trading at 2,574.27, recording a -2.22% correction over the last 24 hours. The daily session shows an open at 2,632.70, a high of 2,632.97, a low of 2,564.33, and a -2.21% adjustment, reflecting a healthy breather after testing the recent highs at 2,668.00.
🔍 Trend Analysis and Indicators
Trend: Bullish underlying trend with a temporary short-term pullback, while keeping the market’s overall structure intact.
Moving Averages: The price remains solidly above the MA(7) (2,514.09) and the MA(25) (2,482.57). Meanwhile, the long-term macro trend stays firmly bullish, as it is trading well above the MA(99) (2,029.05).
Bollinger Bands: Price is retreating from the upper zone and looking for support toward the middle band MB (2,488.41), with the upper band at UP (2,615.38) and the lower band at DN (2,361.45). This indicates a rebalancing of volatility after the previous impulse.
Key Levels: Immediate support is located at the session low of 2,564, while the main resistance to break is found at the highs of 2,668.
💡 Trading Strategy: Buy or Sell?
Buy (Long)?: This controlled pullback offers an interesting tactical opportunity for accumulation to position in favor of the main trend, managing risk with a Stop Loss set below the moving averages.
Sell (Short)?: Trading to the downside carries high risk because it goes against the macro structure; it would only be considered in the event of a sustained loss of the key supports.
#Ethereum #AnalisisTecnico #CryptoTrading
May the Lord bless and prosper whoever operates here, in the name of Jesus, since your word says: "Mine is the silver, and mine is the gold," says the LORD of hosts. Hageo 2:8 RV1960-T -
$ETH
1
168
🚀 BITCOIN IN A CONSOLIDATION ZONE: BUYING OPPORTUNITY OR TECHNICAL PAUSE? ⚡
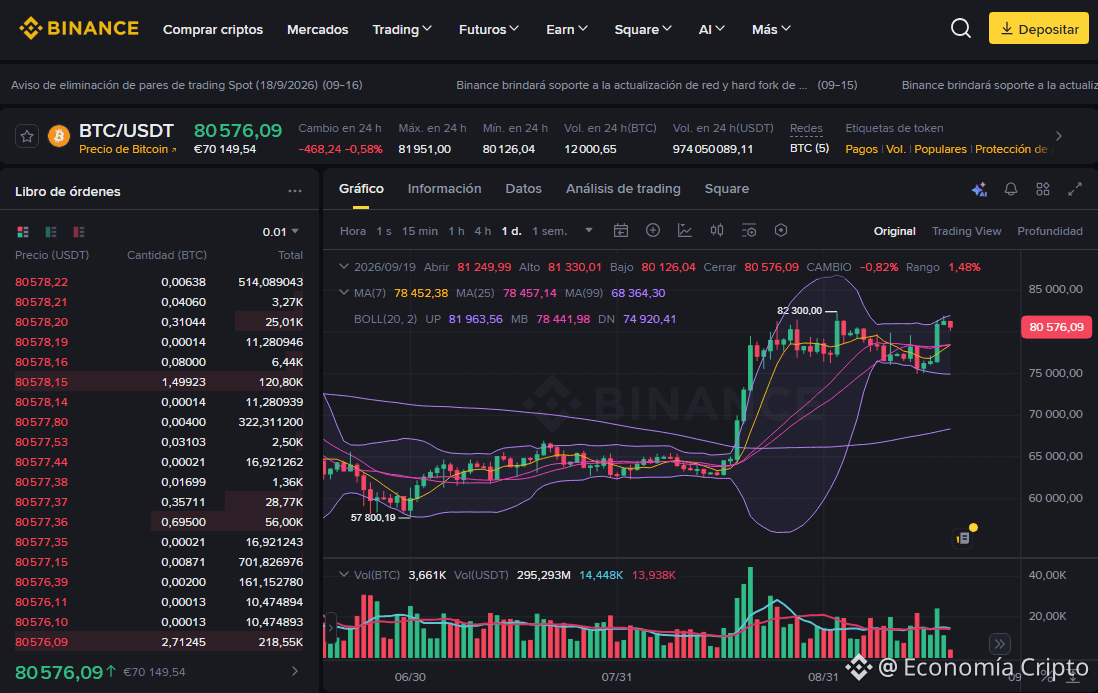
The BTC/USDT pair is trading at 80,576.09, registering a slight change of -0.58% over the last 24 hours. The daily session shows an opening at 81,249.99, a high of 81,330.01, a low of 80,126.04, and an adjustment of -0.82%, reflecting a healthy pause after the recent bullish impulses in the market.
🔍 Trend Analysis and Indicators
Trend: Bullish on the bigger picture, with temporary short-term consolidation, keeping the overall structure intact.
Moving Averages: Price remains well above the MA(7) (78,452.38) and the MA(25) (78,457.14), while the long-term macro trend remains firmly bullish, trading well above the MA(99) (68,364.30).
Bollinger Bands: Price pulls back from the upper zone and seeks support toward the middle band MB (78,441.98), with the upper band at UP (81,963.56) and the lower band at DN (74,920.41), showing a temporary rebalancing of volatility.
Key Levels: Immediate support is located at the session’s low of 80,126 and in the moving-average area above 78,450, while the key resistance to break lies at the highs of 81,951.
💡 Trading Strategy: Buy or Sell?
Buy (Long)?: This controlled pullback offers an interesting tactical accumulation opportunity for those looking to position in favor of the main trend, managing risk with a Stop Loss set just below the moving averages.
Sell (Short)?: Trading to the downside carries a high risk by going against the macro structure; it would only be considered in case of a clear and sustained loss of the key supports.
#Bitcoin #AnalisisTecnico #CryptoTrading
The Lord blesses and prospers whoever operates here, in the name of Jesus, because your word says: "Mine is the silver, and mine is the gold," says the LORD of hosts. Hageo 2:8 RV1960-T -
$BTC
{spot}(MUBUSDT)
{spot}(NVDABUSDT)
{spot}(BTCUSDT)
🚀 BITCOIN IN A CONSOLIDATION ZONE: BUYING OPPORTUNITY OR TECHNICAL PAUSE? ⚡
The BTC/USDT pair is trading at 80,576.09, registering a slight change of -0.58% over the last 24 hours. The daily session shows an opening at 81,249.99, a high of 81,330.01, a low of 80,126.04, and an adjustment of -0.82%, reflecting a healthy pause after the recent bullish impulses in the market.
🔍 Trend Analysis and Indicators
Trend: Bullish on the bigger picture, with temporary short-term consolidation, keeping the overall structure intact.
Moving Averages: Price remains well above the MA(7) (78,452.38) and the MA(25) (78,457.14), while the long-term macro trend remains firmly bullish, trading well above the MA(99) (68,364.30).
Bollinger Bands: Price pulls back from the upper zone and seeks support toward the middle band MB (78,441.98), with the upper band at UP (81,963.56) and the lower band at DN (74,920.41), showing a temporary rebalancing of volatility.
Key Levels: Immediate support is located at the session’s low of 80,126 and in the moving-average area above 78,450, while the key resistance to break lies at the highs of 81,951.
💡 Trading Strategy: Buy or Sell?
Buy (Long)?: This controlled pullback offers an interesting tactical accumulation opportunity for those looking to position in favor of the main trend, managing risk with a Stop Loss set just below the moving averages.
Sell (Short)?: Trading to the downside carries a high risk by going against the macro structure; it would only be considered in case of a clear and sustained loss of the key supports.
#Bitcoin #AnalisisTecnico #CryptoTrading
The Lord blesses and prospers whoever operates here, in the name of Jesus, because your word says: "Mine is the silver, and mine is the gold," says the LORD of hosts. Hageo 2:8 RV1960-T -
$BTC
The BTC/USDT pair is trading at 80,576.09, registering a slight change of -0.58% over the last 24 hours. The daily session shows an opening at 81,249.99, a high of 81,330.01, a low of 80,126.04, and an adjustment of -0.82%, reflecting a healthy pause after the recent bullish impulses in the market.
🔍 Trend Analysis and Indicators
Trend: Bullish on the bigger picture, with temporary short-term consolidation, keeping the overall structure intact.
Moving Averages: Price remains well above the MA(7) (78,452.38) and the MA(25) (78,457.14), while the long-term macro trend remains firmly bullish, trading well above the MA(99) (68,364.30).
Bollinger Bands: Price pulls back from the upper zone and seeks support toward the middle band MB (78,441.98), with the upper band at UP (81,963.56) and the lower band at DN (74,920.41), showing a temporary rebalancing of volatility.
Key Levels: Immediate support is located at the session’s low of 80,126 and in the moving-average area above 78,450, while the key resistance to break lies at the highs of 81,951.
💡 Trading Strategy: Buy or Sell?
Buy (Long)?: This controlled pullback offers an interesting tactical accumulation opportunity for those looking to position in favor of the main trend, managing risk with a Stop Loss set just below the moving averages.
Sell (Short)?: Trading to the downside carries a high risk by going against the macro structure; it would only be considered in case of a clear and sustained loss of the key supports.
#Bitcoin #AnalisisTecnico #CryptoTrading
The Lord blesses and prospers whoever operates here, in the name of Jesus, because your word says: "Mine is the silver, and mine is the gold," says the LORD of hosts. Hageo 2:8 RV1960-T -
$BTC
3
106


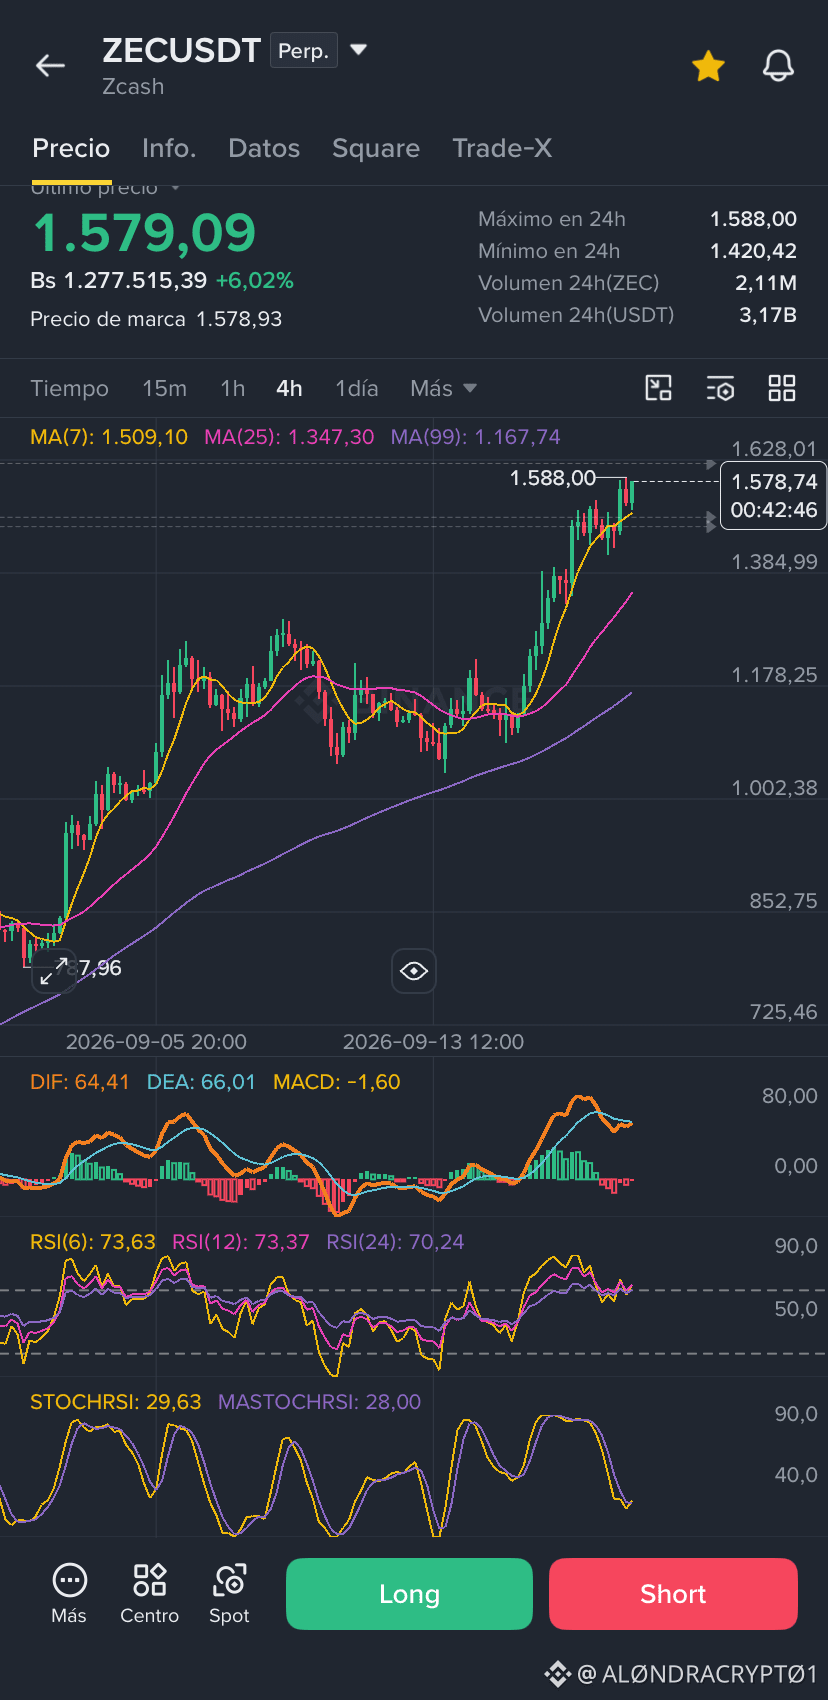
Analyzing $ZEC
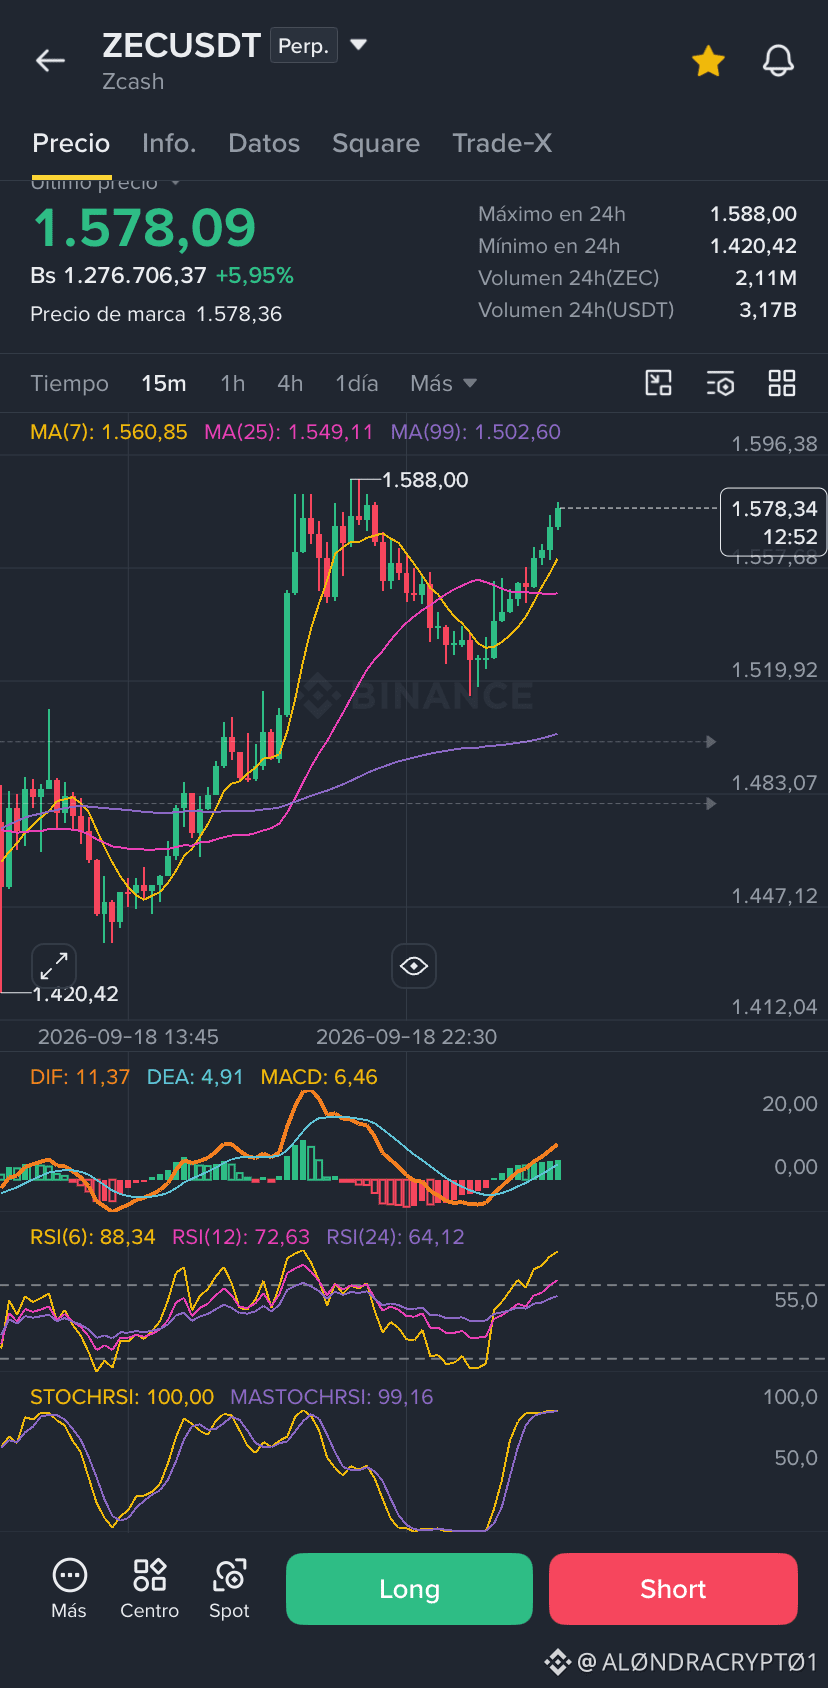
Driven by strong institutional interest, Grayscale’s ETF demand, and more than $26.5 million in short liquidations after breaking above $1,535, the market leaves us with a very interesting technical picture.
- Structure and Key Levels to Watch:
Main support (Floor): The zone between $1,480 and $1,500
- Immediate resistance: The $1,620 wall. If it’s broken with volume, the path opens toward the $1,700 - $1,750 zone.
What is smart money doing?
Whales are holding a strongly bullish stance (with an average price far below, around $974), and more than 71% of short traders are currently at a loss.
Consider an Trading Strategy:
1. Short term: Accumulate on pullbacks near the $1,480 - $1,500 support when volume stabilizes, or look for clean breakout trades above $1,620.
2. Take profit: Watch the supply zone around $1,650 - $1,700 if momentum begins to stall.
#analisistecnico
{future}(ZECUSDT)
Analyzing $ZEC
Driven by strong institutional interest, Grayscale’s ETF demand, and more than $26.5 million in short liquidations after breaking above $1,535, the market leaves us with a very interesting technical picture.
- Structure and Key Levels to Watch:
Main support (Floor): The zone between $1,480 and $1,500
- Immediate resistance: The $1,620 wall. If it’s broken with volume, the path opens toward the $1,700 - $1,750 zone.
What is smart money doing?
Whales are holding a strongly bullish stance (with an average price far below, around $974), and more than 71% of short traders are currently at a loss.
Consider an Trading Strategy:
1. Short term: Accumulate on pullbacks near the $1,480 - $1,500 support when volume stabilizes, or look for clean breakout trades above $1,620.
2. Take profit: Watch the supply zone around $1,650 - $1,700 if momentum begins to stall.
#analisistecnico
Driven by strong institutional interest, Grayscale’s ETF demand, and more than $26.5 million in short liquidations after breaking above $1,535, the market leaves us with a very interesting technical picture.
- Structure and Key Levels to Watch:
Main support (Floor): The zone between $1,480 and $1,500
- Immediate resistance: The $1,620 wall. If it’s broken with volume, the path opens toward the $1,700 - $1,750 zone.
What is smart money doing?
Whales are holding a strongly bullish stance (with an average price far below, around $974), and more than 71% of short traders are currently at a loss.
Consider an Trading Strategy:
1. Short term: Accumulate on pullbacks near the $1,480 - $1,500 support when volume stabilizes, or look for clean breakout trades above $1,620.
2. Take profit: Watch the supply zone around $1,650 - $1,700 if momentum begins to stall.
#analisistecnico
6
873

·
--
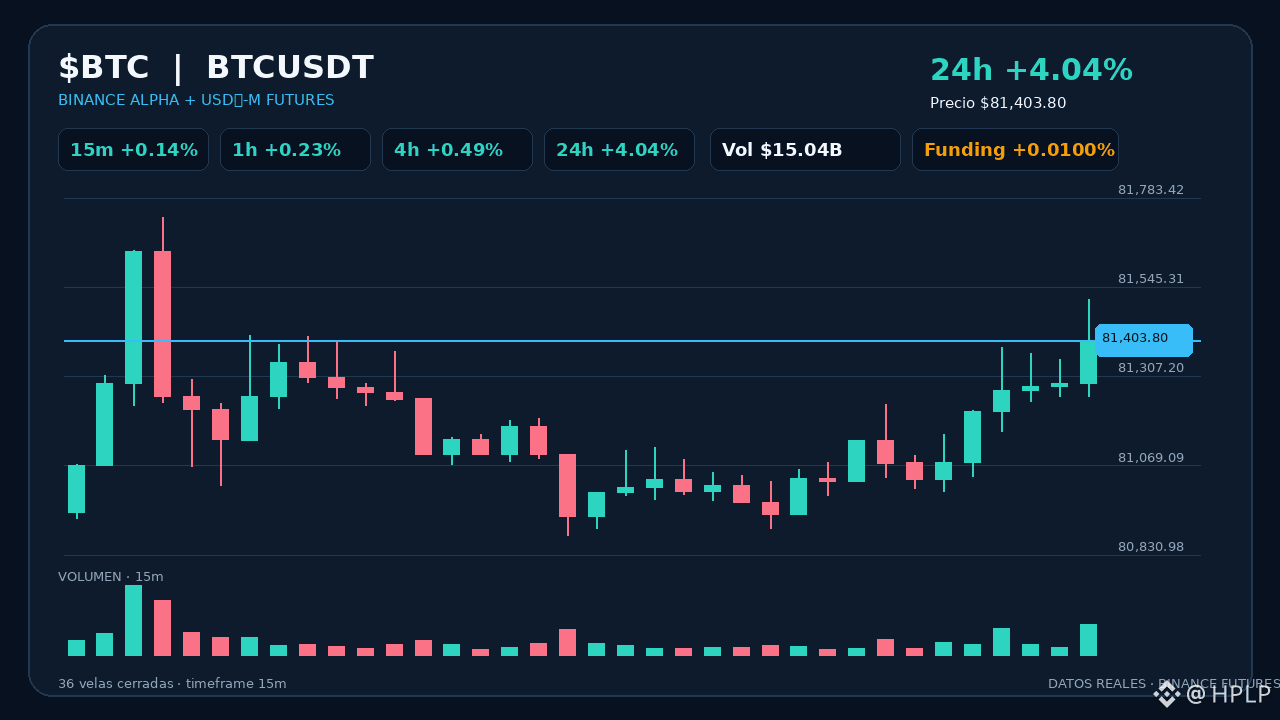
Bitcoin is approaching a key resistance zone around $82,000 after hitting intraday highs of $81,400. 📊 This level has capped recovery attempts since August, and its behavior over the weekend will be decisive, as it will trade in continuous markets without the support of the close and open of U.S. spot ETFs. 🛑 What to watch? Strong volume in open 24/7 markets and the ability to consolidate a breakout above the technical ceiling. Stay cautious given the volatility typical of weekends. Follow us for more market analysis without the noise. 📈 #Bitcoin #CryptoTrading #AnalisisTecnico $BTC
Bitcoin is approaching a key resistance zone around $82,000 after hitting intraday highs of $81,400. 📊 This level has capped recovery attempts since August, and its behavior over the weekend will be decisive, as it will trade in continuous markets without the support of the close and open of U.S. spot ETFs. 🛑 What to watch? Strong volume in open 24/7 markets and the ability to consolidate a breakout above the technical ceiling. Stay cautious given the volatility typical of weekends. Follow us for more market analysis without the noise. 📈 #Bitcoin #CryptoTrading #AnalisisTecnico $BTC
40
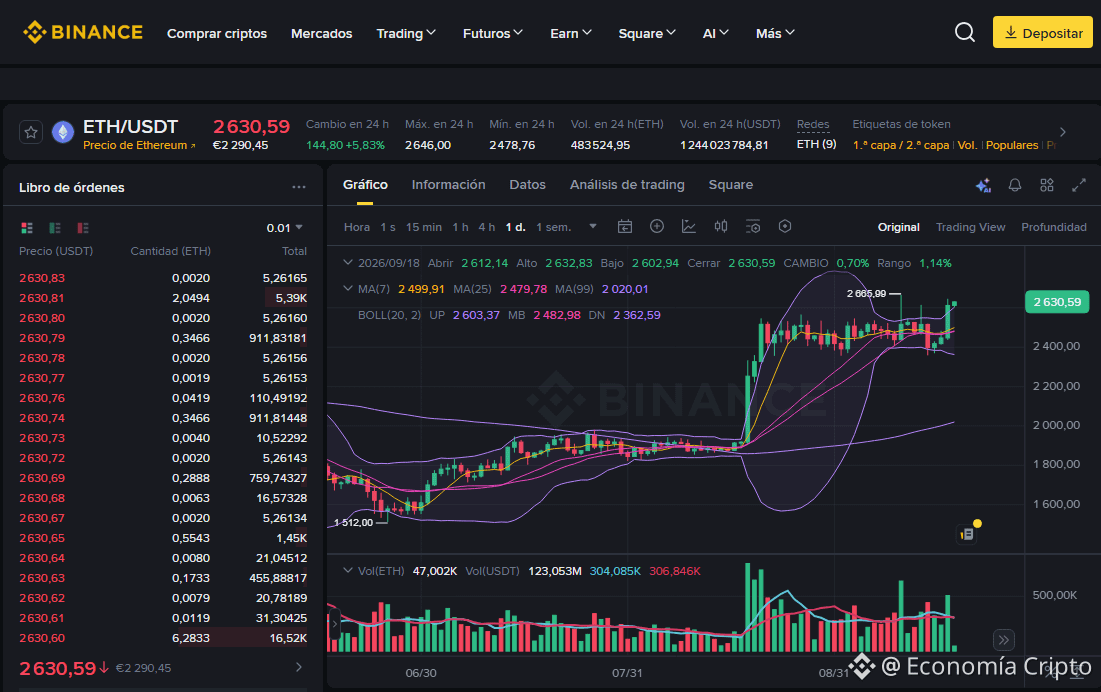
🚀 Ethereum breaks resistance: heading toward new bullish targets! ⚡
The ETH/USDT pair is trading at 2,630.59, registering a strong advance of +5.83% over the last 24 hours. The daily session shows an opening at 2,612.14, a high of 2,632.83, a low of 2,602.94, and a close at 2,630.59 (+0.70%), reflecting intense buying pressure in the market.
🔍 Trend Analysis and Indicators
Trend: Strong short-term bullish trend, with dynamic momentum challenging the upper part of the trading channel.
Moving Averages: Price is comfortably above the MA(7) (2,499.91) and the MA(25) (2,479.78), while the underlying macro structure remains firmly bullish as it trades well above the MA(99) (2,020.01).
Bollinger Bands: The price strongly breaks above the upper band UP (2,603.37) from the middle band MB (2,482.98) (with the lower band DN (2,362.59)), indicating a powerful expansion of bullish volatility.
Key Levels: Immediate support is consolidating in the 2,602 area, while the main resistance to overcome is located at the session highs of 2,646 and the targets toward the prior highs at 2,665.99.
💡 Trading Strategy: Buy or Sell?
Buy (Long)?: The clear breakout and positioning above the Bollinger upper band support tactical opportunities for bullish continuation to seek higher targets, managing risk with a Stop Loss adjusted below the session support.
Sell (Short)?: Trading down carries high risk due to the strength of the current bullish trend; it would only be considered in case of a major pullback and the loss of the fast moving averages.
#Ethereum #AnalisisTecnico #CryptoTrading
May the Lord bless and prosper whoever operates here, in the name of Jesus, because your word says: "Mine is the silver, and mine is the gold, says the LORD of hosts". Hageo 2:8 RV1960-T -
$ETH
{spot}(BNBUSDT)
{spot}(BTCUSDT)
{spot}(ETHUSDT)
🚀 Ethereum breaks resistance: heading toward new bullish targets! ⚡
The ETH/USDT pair is trading at 2,630.59, registering a strong advance of +5.83% over the last 24 hours. The daily session shows an opening at 2,612.14, a high of 2,632.83, a low of 2,602.94, and a close at 2,630.59 (+0.70%), reflecting intense buying pressure in the market.
🔍 Trend Analysis and Indicators
Trend: Strong short-term bullish trend, with dynamic momentum challenging the upper part of the trading channel.
Moving Averages: Price is comfortably above the MA(7) (2,499.91) and the MA(25) (2,479.78), while the underlying macro structure remains firmly bullish as it trades well above the MA(99) (2,020.01).
Bollinger Bands: The price strongly breaks above the upper band UP (2,603.37) from the middle band MB (2,482.98) (with the lower band DN (2,362.59)), indicating a powerful expansion of bullish volatility.
Key Levels: Immediate support is consolidating in the 2,602 area, while the main resistance to overcome is located at the session highs of 2,646 and the targets toward the prior highs at 2,665.99.
💡 Trading Strategy: Buy or Sell?
Buy (Long)?: The clear breakout and positioning above the Bollinger upper band support tactical opportunities for bullish continuation to seek higher targets, managing risk with a Stop Loss adjusted below the session support.
Sell (Short)?: Trading down carries high risk due to the strength of the current bullish trend; it would only be considered in case of a major pullback and the loss of the fast moving averages.
#Ethereum #AnalisisTecnico #CryptoTrading
May the Lord bless and prosper whoever operates here, in the name of Jesus, because your word says: "Mine is the silver, and mine is the gold, says the LORD of hosts". Hageo 2:8 RV1960-T -
$ETH
The ETH/USDT pair is trading at 2,630.59, registering a strong advance of +5.83% over the last 24 hours. The daily session shows an opening at 2,612.14, a high of 2,632.83, a low of 2,602.94, and a close at 2,630.59 (+0.70%), reflecting intense buying pressure in the market.
🔍 Trend Analysis and Indicators
Trend: Strong short-term bullish trend, with dynamic momentum challenging the upper part of the trading channel.
Moving Averages: Price is comfortably above the MA(7) (2,499.91) and the MA(25) (2,479.78), while the underlying macro structure remains firmly bullish as it trades well above the MA(99) (2,020.01).
Bollinger Bands: The price strongly breaks above the upper band UP (2,603.37) from the middle band MB (2,482.98) (with the lower band DN (2,362.59)), indicating a powerful expansion of bullish volatility.
Key Levels: Immediate support is consolidating in the 2,602 area, while the main resistance to overcome is located at the session highs of 2,646 and the targets toward the prior highs at 2,665.99.
💡 Trading Strategy: Buy or Sell?
Buy (Long)?: The clear breakout and positioning above the Bollinger upper band support tactical opportunities for bullish continuation to seek higher targets, managing risk with a Stop Loss adjusted below the session support.
Sell (Short)?: Trading down carries high risk due to the strength of the current bullish trend; it would only be considered in case of a major pullback and the loss of the fast moving averages.
#Ethereum #AnalisisTecnico #CryptoTrading
May the Lord bless and prosper whoever operates here, in the name of Jesus, because your word says: "Mine is the silver, and mine is the gold, says the LORD of hosts". Hageo 2:8 RV1960-T -
$ETH
1
80
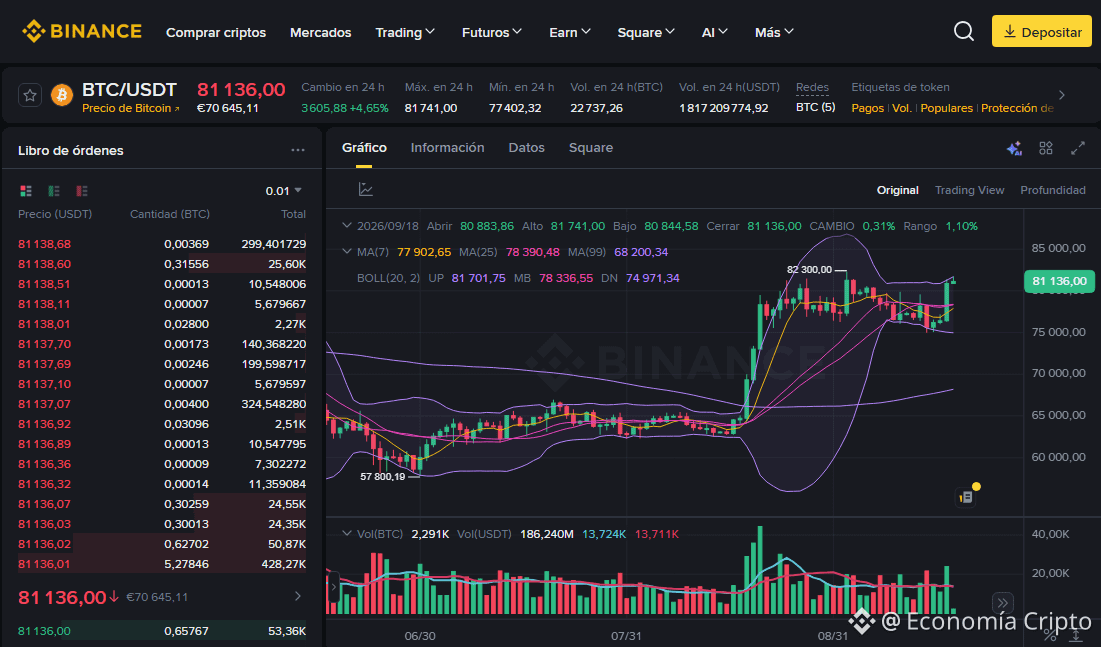
🚀 Bitcoin Breaks Barriers: Onward to New All-Time Highs! ⚡
The BTC/USDT pair is trading at 81,136.00, recording a strong gain of +4.65% over the last 24 hours. The daily session shows an open at 80,883.86, a high of 81,741.00, a low of 80,444.58, and an increase of +0.31%, reflecting intense buying pressure dominating the market.
🔍 Trend Analysis and Indicators
Trend: A solid uptrend in the short and medium term, with dynamic momentum challenging the top of the trading channel.
Moving Averages: Price is clearly above the MA(7) (77,902.65) and the MA(25) (78,390.48), while the underlying structure remains firmly bullish since it is trading well above the MA(99) (68,200.34).
Bollinger Bands: The price is pressing directly against the upper band UP (81,701.75) from the mid band MB (78,336.55) (with the lower band DN (74,971.34)), indicating a strong expansion of bullish volatility.
Key Levels: Immediate support is consolidating around 80,440, while the main resistance to break is located at the session highs of 81,741.
💡 Trading Strategy: Buy or Sell?
Buy (Long): The clear breakout and positioning above the fast moving averages support tactical continuation opportunities to target higher objectives, managing risk with a Stop Loss adjusted below the session support.
Sell (Short): Trading to the downside carries a high risk due to the strength of the current uptrend; it would only be considered in the event of a major rejection and the loss of the fast moving averages.
#Bitcoin #AnalisisTecnico #CryptoTrading
May the Lord bless and prosper whoever operates here, in the name of Jesus, because your word says: “Mine is the silver, and mine is the gold,” says the LORD of hosts. Hageo 2:8 RV1960-T -
$BTC
{spot}(BNBUSDT)
{spot}(TSMBUSDT)
{spot}(BTCUSDT)
🚀 Bitcoin Breaks Barriers: Onward to New All-Time Highs! ⚡
The BTC/USDT pair is trading at 81,136.00, recording a strong gain of +4.65% over the last 24 hours. The daily session shows an open at 80,883.86, a high of 81,741.00, a low of 80,444.58, and an increase of +0.31%, reflecting intense buying pressure dominating the market.
🔍 Trend Analysis and Indicators
Trend: A solid uptrend in the short and medium term, with dynamic momentum challenging the top of the trading channel.
Moving Averages: Price is clearly above the MA(7) (77,902.65) and the MA(25) (78,390.48), while the underlying structure remains firmly bullish since it is trading well above the MA(99) (68,200.34).
Bollinger Bands: The price is pressing directly against the upper band UP (81,701.75) from the mid band MB (78,336.55) (with the lower band DN (74,971.34)), indicating a strong expansion of bullish volatility.
Key Levels: Immediate support is consolidating around 80,440, while the main resistance to break is located at the session highs of 81,741.
💡 Trading Strategy: Buy or Sell?
Buy (Long): The clear breakout and positioning above the fast moving averages support tactical continuation opportunities to target higher objectives, managing risk with a Stop Loss adjusted below the session support.
Sell (Short): Trading to the downside carries a high risk due to the strength of the current uptrend; it would only be considered in the event of a major rejection and the loss of the fast moving averages.
#Bitcoin #AnalisisTecnico #CryptoTrading
May the Lord bless and prosper whoever operates here, in the name of Jesus, because your word says: “Mine is the silver, and mine is the gold,” says the LORD of hosts. Hageo 2:8 RV1960-T -
$BTC
The BTC/USDT pair is trading at 81,136.00, recording a strong gain of +4.65% over the last 24 hours. The daily session shows an open at 80,883.86, a high of 81,741.00, a low of 80,444.58, and an increase of +0.31%, reflecting intense buying pressure dominating the market.
🔍 Trend Analysis and Indicators
Trend: A solid uptrend in the short and medium term, with dynamic momentum challenging the top of the trading channel.
Moving Averages: Price is clearly above the MA(7) (77,902.65) and the MA(25) (78,390.48), while the underlying structure remains firmly bullish since it is trading well above the MA(99) (68,200.34).
Bollinger Bands: The price is pressing directly against the upper band UP (81,701.75) from the mid band MB (78,336.55) (with the lower band DN (74,971.34)), indicating a strong expansion of bullish volatility.
Key Levels: Immediate support is consolidating around 80,440, while the main resistance to break is located at the session highs of 81,741.
💡 Trading Strategy: Buy or Sell?
Buy (Long): The clear breakout and positioning above the fast moving averages support tactical continuation opportunities to target higher objectives, managing risk with a Stop Loss adjusted below the session support.
Sell (Short): Trading to the downside carries a high risk due to the strength of the current uptrend; it would only be considered in the event of a major rejection and the loss of the fast moving averages.
#Bitcoin #AnalisisTecnico #CryptoTrading
May the Lord bless and prosper whoever operates here, in the name of Jesus, because your word says: “Mine is the silver, and mine is the gold,” says the LORD of hosts. Hageo 2:8 RV1960-T -
$BTC
1
86

·
--
Bullish
{spot}(BTCUSDT)
Is Bitcoin consolidating or preparing the next key move? 🚀
The market remains in a zone of high technical attention. With BTC firmly hovering around $80,000 USDT, macroeconomic tension and expectations regarding the Fed's upcoming moves ( #FedRateWatch ) demand that we keep a close watch on the charts.
🔹 Key points to watch today:
Range zones: Price is trying to establish solid supports while assessing market pressure.
Risk management: In cautious moments like this one, trading with strategy, controlling leverage, and using stop loss is the golden rule. Discipline is worth more than rushing! 🛑
Altcoins and radar: Interesting moves across multiple fronts as institutional volume continues to decide the direction.
👇 How are you trading this week? Do you see Bitcoin breaking upward, or do you prefer to wait for a correction to accumulate?
I’m reading your comments! 💬📉📈
#BinanceSquare #Bitcoin #FedRateWatch #CryptoTrading #AnalisisTecnico $BTC $BNB $ETH
Is Bitcoin consolidating or preparing the next key move? 🚀
The market remains in a zone of high technical attention. With BTC firmly hovering around $80,000 USDT, macroeconomic tension and expectations regarding the Fed's upcoming moves ( #FedRateWatch ) demand that we keep a close watch on the charts.
🔹 Key points to watch today:
Range zones: Price is trying to establish solid supports while assessing market pressure.
Risk management: In cautious moments like this one, trading with strategy, controlling leverage, and using stop loss is the golden rule. Discipline is worth more than rushing! 🛑
Altcoins and radar: Interesting moves across multiple fronts as institutional volume continues to decide the direction.
👇 How are you trading this week? Do you see Bitcoin breaking upward, or do you prefer to wait for a correction to accumulate?
I’m reading your comments! 💬📉📈
#BinanceSquare #Bitcoin #FedRateWatch #CryptoTrading #AnalisisTecnico $BTC $BNB $ETH
The market remains in a zone of high technical attention. With BTC firmly hovering around $80,000 USDT, macroeconomic tension and expectations regarding the Fed's upcoming moves ( #FedRateWatch ) demand that we keep a close watch on the charts.
🔹 Key points to watch today:
Range zones: Price is trying to establish solid supports while assessing market pressure.
Risk management: In cautious moments like this one, trading with strategy, controlling leverage, and using stop loss is the golden rule. Discipline is worth more than rushing! 🛑
Altcoins and radar: Interesting moves across multiple fronts as institutional volume continues to decide the direction.
👇 How are you trading this week? Do you see Bitcoin breaking upward, or do you prefer to wait for a correction to accumulate?
I’m reading your comments! 💬📉📈
#BinanceSquare #Bitcoin #FedRateWatch #CryptoTrading #AnalisisTecnico $BTC $BNB $ETH
1
103

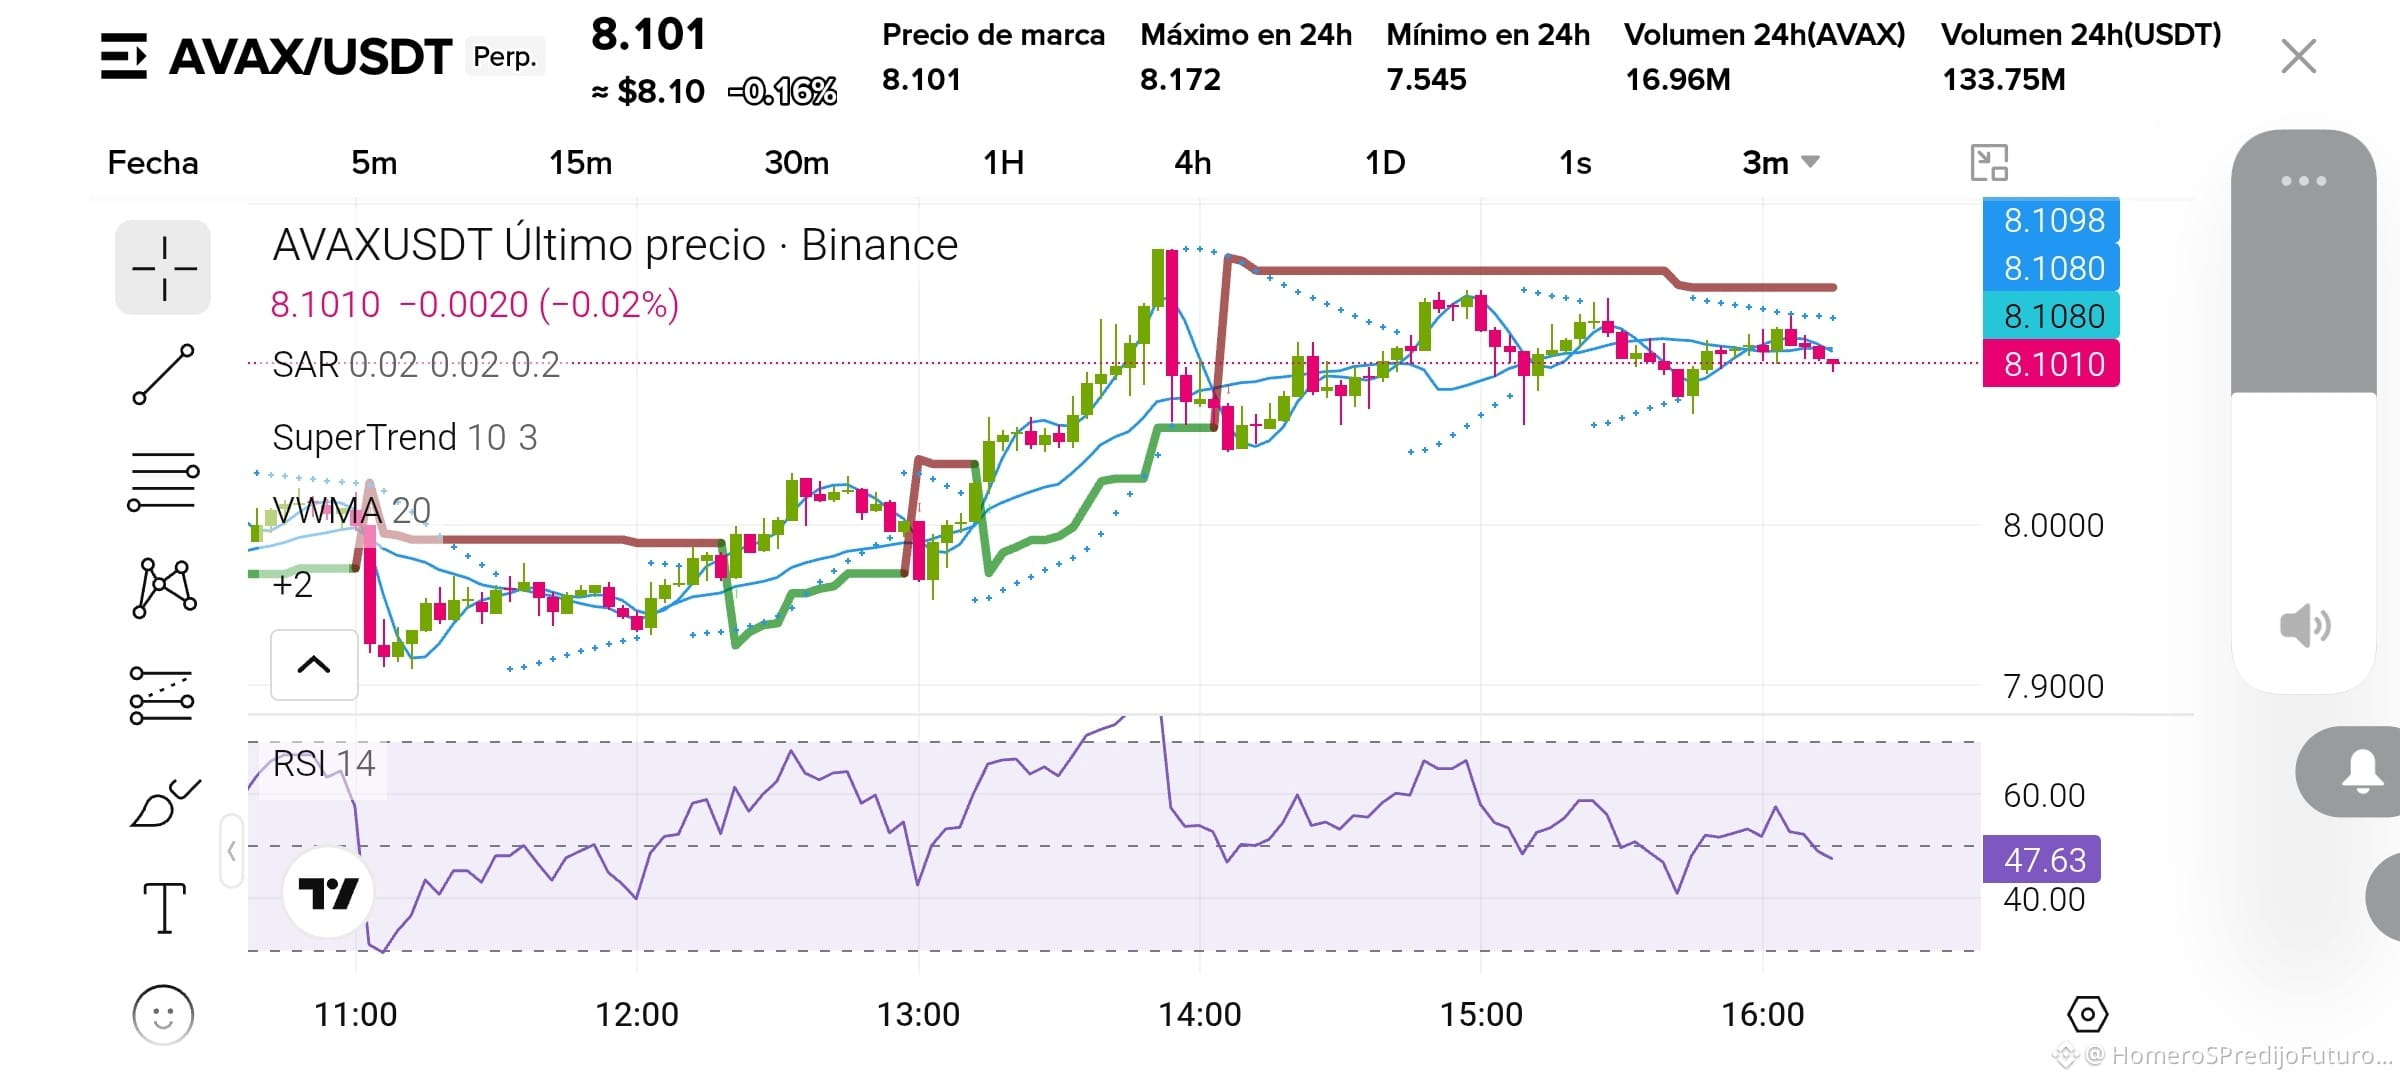
$AVAX currently struggling in the area of 8.101 USDT 🚨
after the previous day’s high at 8.172 USDT there is sideways compression
ST 10,3 bullish here
price pivoting on VWMA, key balance in the short term
RSI neutral, cooling off after being overbought.
🚨 if it breaks the resistance at 8.110-8.120 USDT it will go test the day’s high 📈
🚨 if it loses support it will correct, looking for liquidity around 8 dollars 📉
so you decide..
#AVAX #BinanceSquareFamily
#AnalisisTecnico
$AVAX currently struggling in the area of 8.101 USDT 🚨
after the previous day’s high at 8.172 USDT there is sideways compression
ST 10,3 bullish here
price pivoting on VWMA, key balance in the short term
RSI neutral, cooling off after being overbought.
🚨 if it breaks the resistance at 8.110-8.120 USDT it will go test the day’s high 📈
🚨 if it loses support it will correct, looking for liquidity around 8 dollars 📉
so you decide..
#AVAX #BinanceSquareFamily
#AnalisisTecnico
after the previous day’s high at 8.172 USDT there is sideways compression
ST 10,3 bullish here
price pivoting on VWMA, key balance in the short term
RSI neutral, cooling off after being overbought.
🚨 if it breaks the resistance at 8.110-8.120 USDT it will go test the day’s high 📈
🚨 if it loses support it will correct, looking for liquidity around 8 dollars 📉
so you decide..
#AVAX #BinanceSquareFamily
#AnalisisTecnico
224
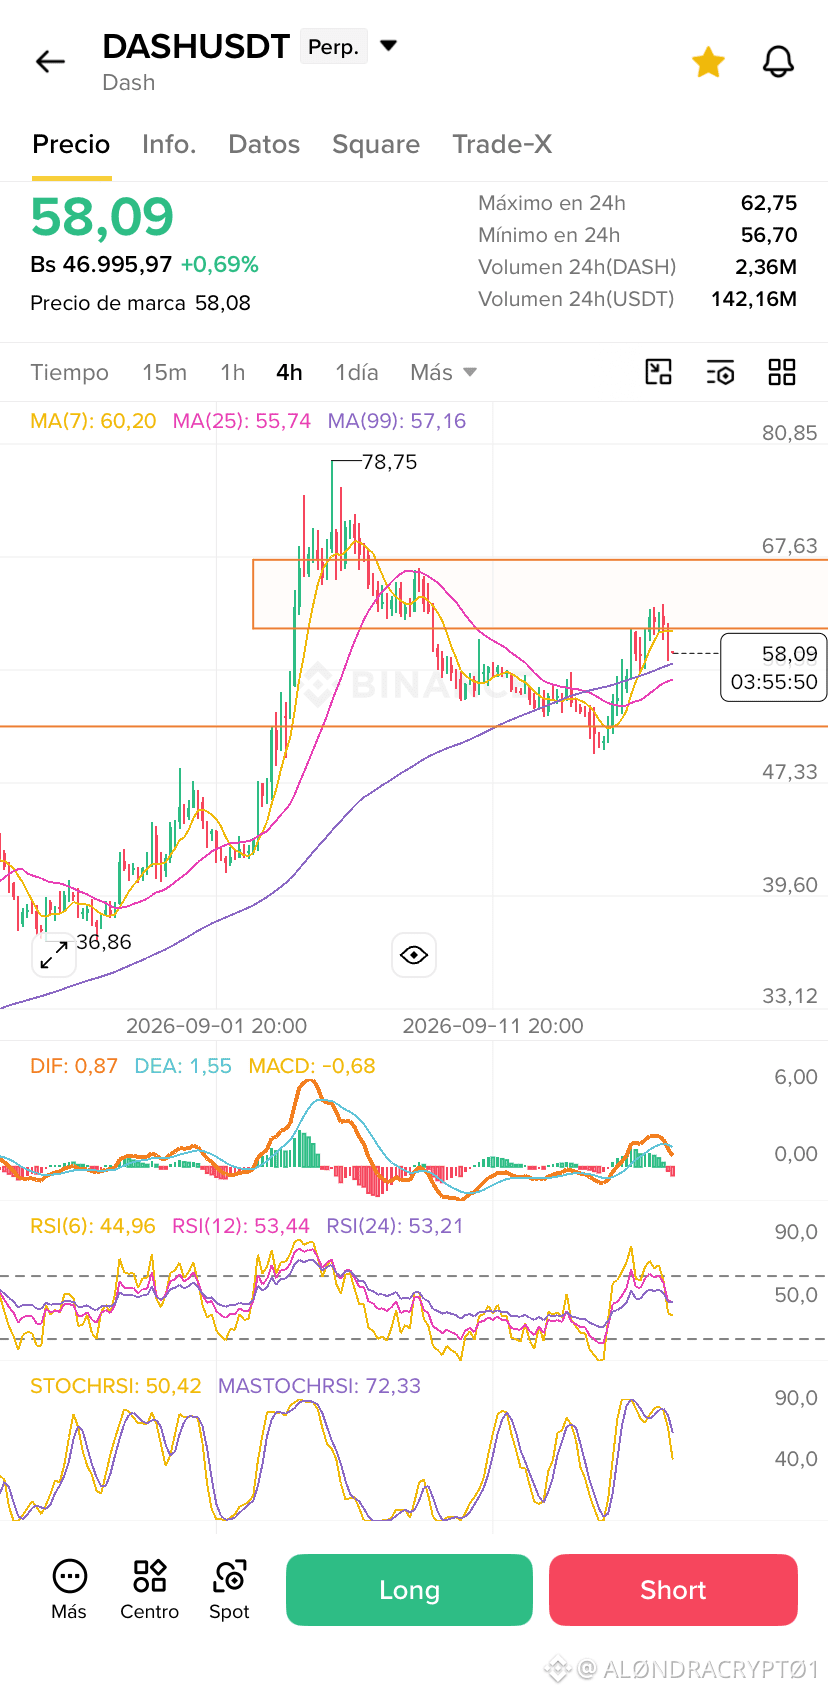
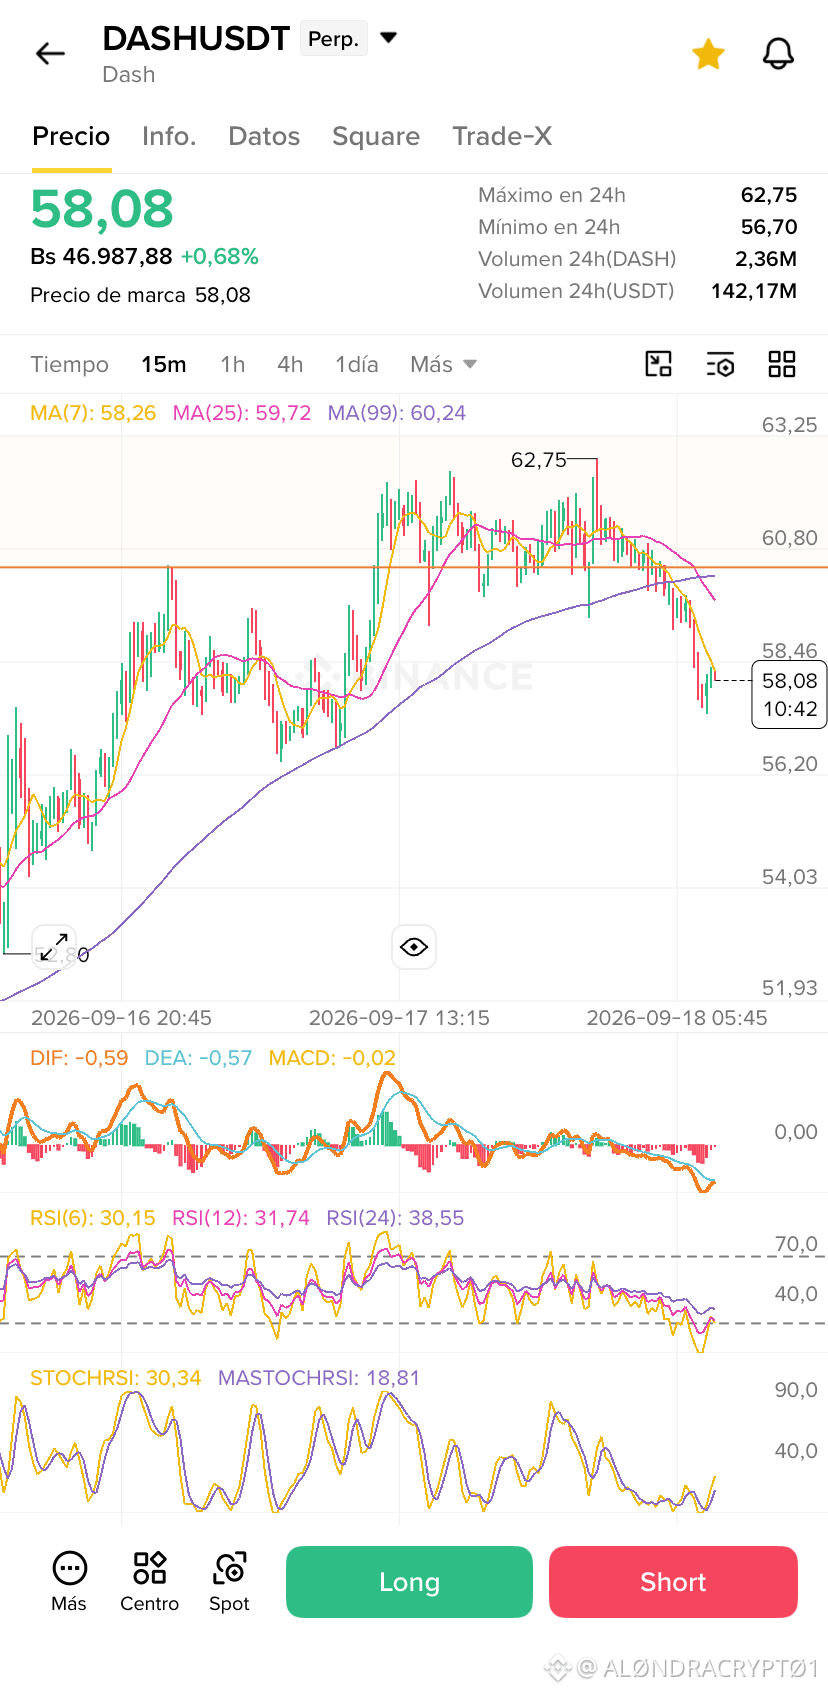
The price of $DASH is in a super decisive area, and the liquidation map shows us exactly where the game is heading. For now, we have the support zone between 56.00 and 58.00 USDT, where you have to be very careful about a quick drop to clear positions before continuing. Above that, we have the magnet for shorts between 62.00 and 64.00 USDT, which is the main target for hunting the liquidity of those betting against. And finally, the invalidation floor below 56.00 USDT, because if the price breaks this level completely, the structure changes and the drop extends. In short, it’s all about patience and good risk management while the price defines its direction toward liquidity. How are you positioned in this play?
#AnalisisTecnico
CLICK HERE ⬇️
{future}(DASHUSDT)
The price of $DASH is in a super decisive area, and the liquidation map shows us exactly where the game is heading. For now, we have the support zone between 56.00 and 58.00 USDT, where you have to be very careful about a quick drop to clear positions before continuing. Above that, we have the magnet for shorts between 62.00 and 64.00 USDT, which is the main target for hunting the liquidity of those betting against. And finally, the invalidation floor below 56.00 USDT, because if the price breaks this level completely, the structure changes and the drop extends. In short, it’s all about patience and good risk management while the price defines its direction toward liquidity. How are you positioned in this play?
#AnalisisTecnico
CLICK HERE ⬇️
#AnalisisTecnico
CLICK HERE ⬇️
4
2k
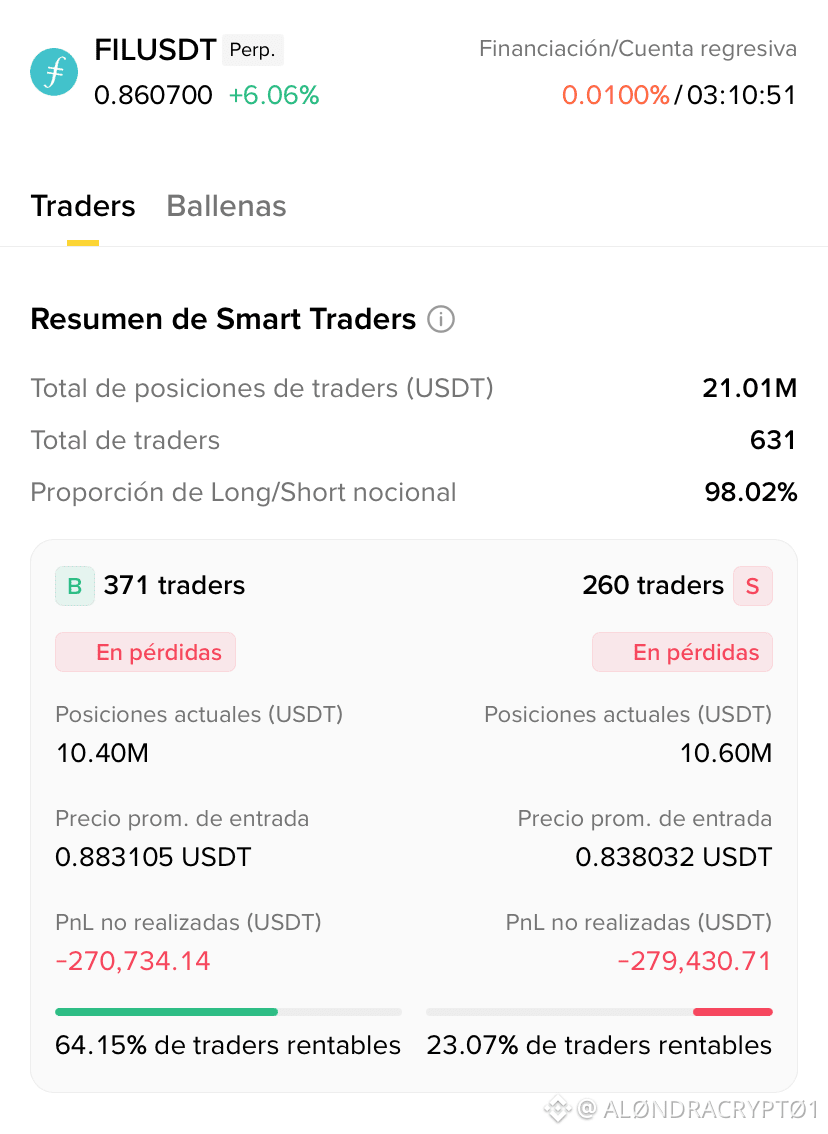
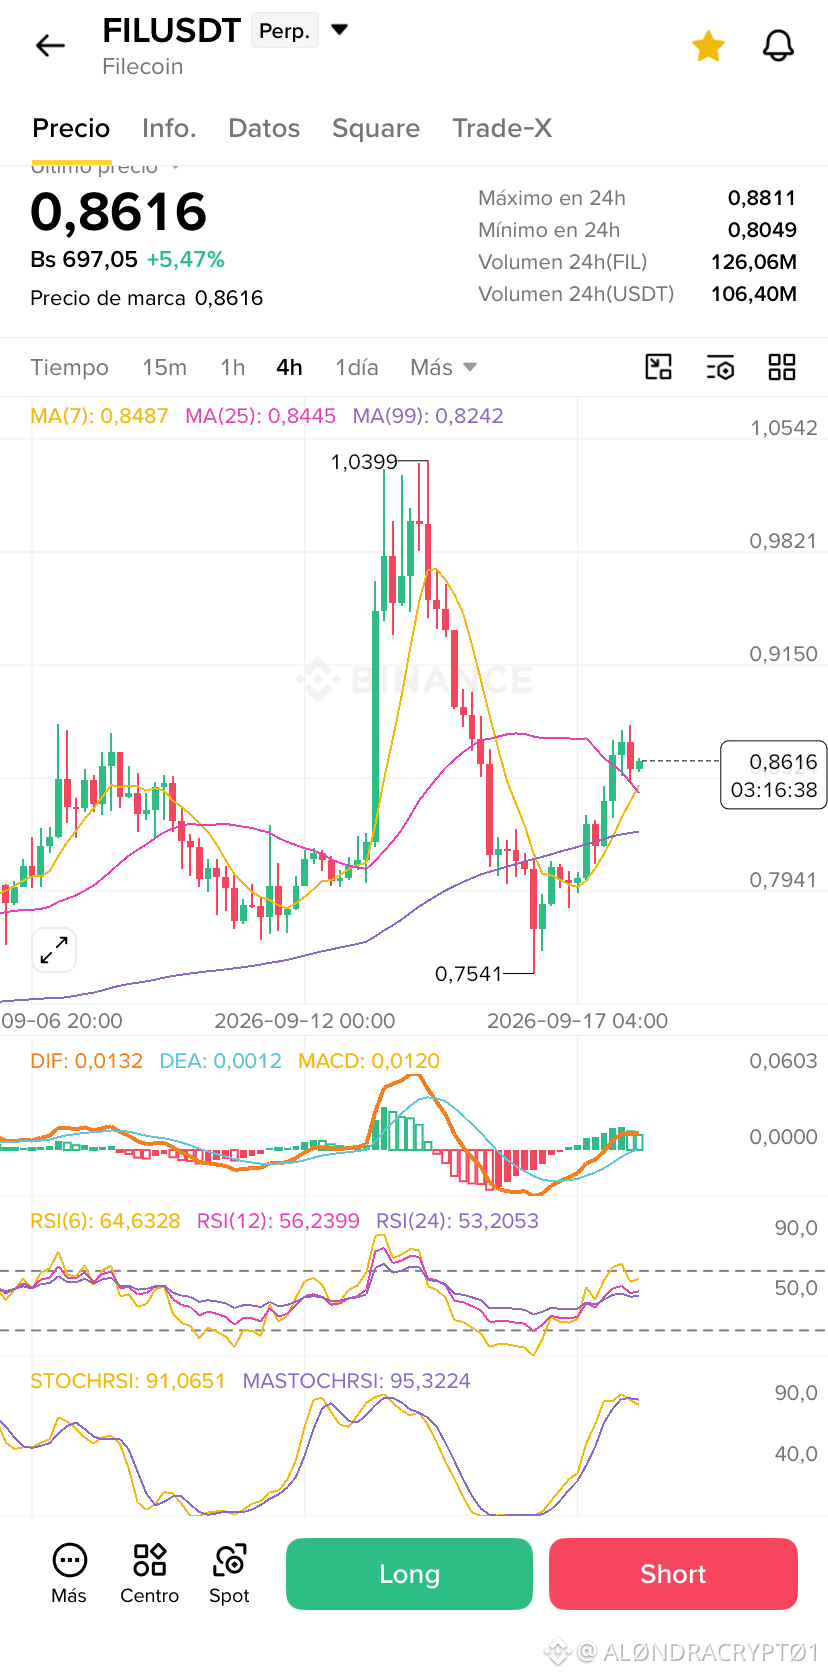
The market is showing us a very interesting situation in $FIL because the Smart Traders who entered in long positions with an average of 0.883105 USDT are trapped in losses after the price retracement, and this perfectly explains why so much yellow zone is accumulating on the liquidation map. On the other hand, shorts are also suffering, with an average entry price at 0.838032 USDT, which sets up a perfect scenario for a clearing sweep before defining the next real move. The key zones to watch are the immediate support between 0.834 and 0.853 USDT, where the greatest risk for longs is concentrated, the upper resistance between 0.892 and 0.911 USDT, which acts like a magnet to go after the shorts, and the invalidation level below 0.815 USDT, which would completely break the current structure.
Taking into account the combination of the liquidation map and the Smart Traders data, the most likely direction in the short term is a clearing move or sweep to the downside in order to go catch all those longs that are trapped in losses with the average at 0.8831 USDT. Since the map shows a large concentration of yellow liquidation zones below, the market usually uses that as a magnet before trying to find the shorts’ liquidity upward. So, in my opinion, I would first look to sweep the lower support before defining a real upside move. Do you think those longs will hold, or will they get liquidated soon?
#analisistecnico
CLICK HERE ⬇️
{future}(FILUSDT)
The market is showing us a very interesting situation in $FIL because the Smart Traders who entered in long positions with an average of 0.883105 USDT are trapped in losses after the price retracement, and this perfectly explains why so much yellow zone is accumulating on the liquidation map. On the other hand, shorts are also suffering, with an average entry price at 0.838032 USDT, which sets up a perfect scenario for a clearing sweep before defining the next real move. The key zones to watch are the immediate support between 0.834 and 0.853 USDT, where the greatest risk for longs is concentrated, the upper resistance between 0.892 and 0.911 USDT, which acts like a magnet to go after the shorts, and the invalidation level below 0.815 USDT, which would completely break the current structure.
Taking into account the combination of the liquidation map and the Smart Traders data, the most likely direction in the short term is a clearing move or sweep to the downside in order to go catch all those longs that are trapped in losses with the average at 0.8831 USDT. Since the map shows a large concentration of yellow liquidation zones below, the market usually uses that as a magnet before trying to find the shorts’ liquidity upward. So, in my opinion, I would first look to sweep the lower support before defining a real upside move. Do you think those longs will hold, or will they get liquidated soon?
#analisistecnico
CLICK HERE ⬇️
Taking into account the combination of the liquidation map and the Smart Traders data, the most likely direction in the short term is a clearing move or sweep to the downside in order to go catch all those longs that are trapped in losses with the average at 0.8831 USDT. Since the map shows a large concentration of yellow liquidation zones below, the market usually uses that as a magnet before trying to find the shorts’ liquidity upward. So, in my opinion, I would first look to sweep the lower support before defining a real upside move. Do you think those longs will hold, or will they get liquidated soon?
#analisistecnico
CLICK HERE ⬇️
1
3
1.4k
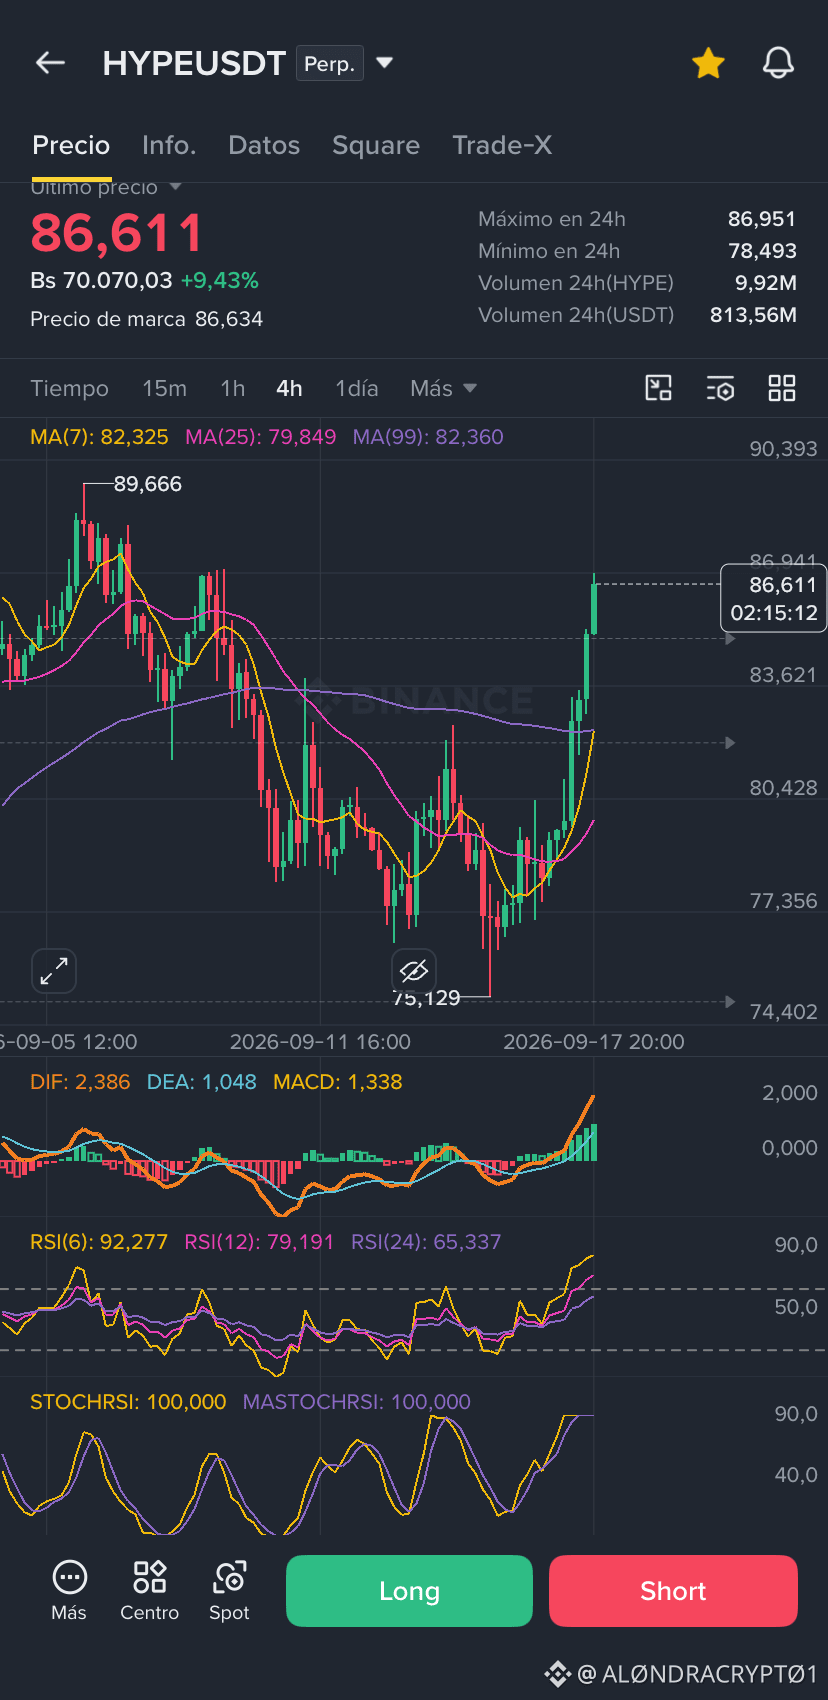
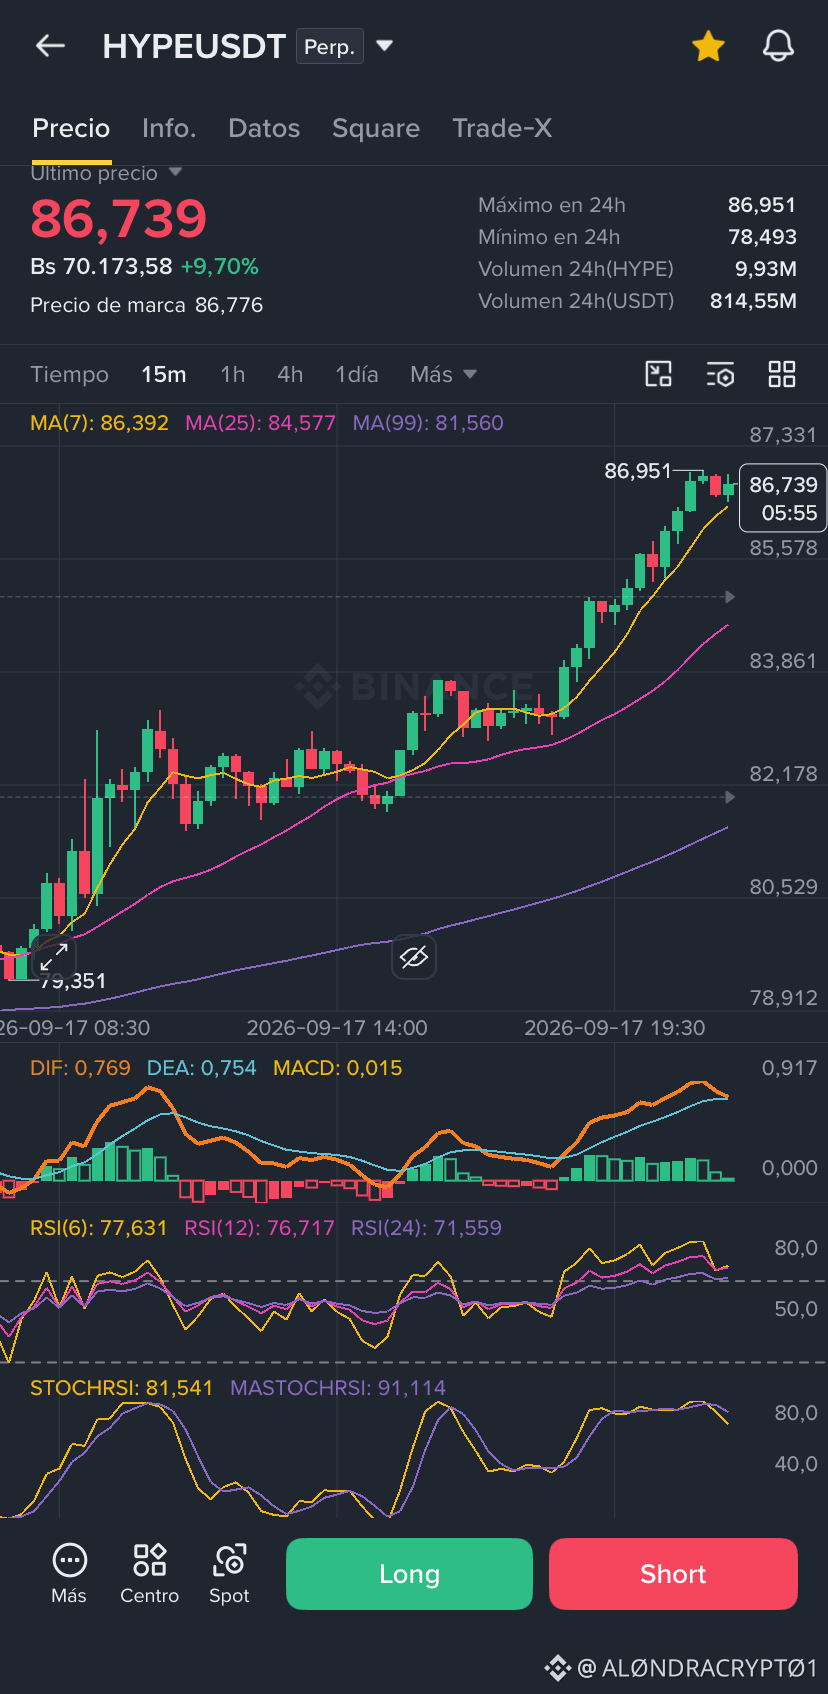
Personally, I got left out this time because I preferred to observe and see how far the price of $HYPE was going to go, and now it’s my turn to wait patiently for the pullback so I can look for a good entry.
That’s why many people say that real trading is boring: it’s not about gambling wildly, but knowing how to wait for the exact moment. Look at what the chart is telling us right now:
On the 4-hour timeframe: StochRSI is at its maximum (touching 100 points), warning us that there is overbought conditions and that price needs a breather or an obligatory pause.
Watch the RSI: Since it’s hovering around 92, it still shows a little bit of “technical air,” which explains why the price tries to probe or extend a bit more toward the upper area before deciding its direction.
On the daily chart (1D): The underlying structure is still trying to maintain a bullish tone.
What’s the action plan from here?
With the move already developed, nothing of rushing to chase buys above out of desperation or FOMO. The smart plays we’re still keeping an eye on are:
The tactical pullback (relief Short): If the price hits this resistance and the 15-minute candles lose momentum, we can consider a controlled pullback to unload the overbought accumulated on 4H.
Wait for the key support The 75k zone: Just like I waited for the pullback, patience is the key. We don’t buy on the first touch; we wait to see whether buyers defend the lower supports (like the 75k USDT zone) with confirmation from volume and structure on the 15-minute chart.
#AnalisisTecnico
Always do your own research..
And you? Were you able to enter this move, or do you prefer to have the patience to wait for the pullback with me?
CLICK HERE ⬇️
{future}(HYPEUSDT)
Personally, I got left out this time because I preferred to observe and see how far the price of $HYPE was going to go, and now it’s my turn to wait patiently for the pullback so I can look for a good entry.
That’s why many people say that real trading is boring: it’s not about gambling wildly, but knowing how to wait for the exact moment. Look at what the chart is telling us right now:
On the 4-hour timeframe: StochRSI is at its maximum (touching 100 points), warning us that there is overbought conditions and that price needs a breather or an obligatory pause.
Watch the RSI: Since it’s hovering around 92, it still shows a little bit of “technical air,” which explains why the price tries to probe or extend a bit more toward the upper area before deciding its direction.
On the daily chart (1D): The underlying structure is still trying to maintain a bullish tone.
What’s the action plan from here?
With the move already developed, nothing of rushing to chase buys above out of desperation or FOMO. The smart plays we’re still keeping an eye on are:
The tactical pullback (relief Short): If the price hits this resistance and the 15-minute candles lose momentum, we can consider a controlled pullback to unload the overbought accumulated on 4H.
Wait for the key support The 75k zone: Just like I waited for the pullback, patience is the key. We don’t buy on the first touch; we wait to see whether buyers defend the lower supports (like the 75k USDT zone) with confirmation from volume and structure on the 15-minute chart.
#AnalisisTecnico
Always do your own research..
And you? Were you able to enter this move, or do you prefer to have the patience to wait for the pullback with me?
CLICK HERE ⬇️
That’s why many people say that real trading is boring: it’s not about gambling wildly, but knowing how to wait for the exact moment. Look at what the chart is telling us right now:
On the 4-hour timeframe: StochRSI is at its maximum (touching 100 points), warning us that there is overbought conditions and that price needs a breather or an obligatory pause.
Watch the RSI: Since it’s hovering around 92, it still shows a little bit of “technical air,” which explains why the price tries to probe or extend a bit more toward the upper area before deciding its direction.
On the daily chart (1D): The underlying structure is still trying to maintain a bullish tone.
What’s the action plan from here?
With the move already developed, nothing of rushing to chase buys above out of desperation or FOMO. The smart plays we’re still keeping an eye on are:
The tactical pullback (relief Short): If the price hits this resistance and the 15-minute candles lose momentum, we can consider a controlled pullback to unload the overbought accumulated on 4H.
Wait for the key support The 75k zone: Just like I waited for the pullback, patience is the key. We don’t buy on the first touch; we wait to see whether buyers defend the lower supports (like the 75k USDT zone) with confirmation from volume and structure on the 15-minute chart.
#AnalisisTecnico
Always do your own research..
And you? Were you able to enter this move, or do you prefer to have the patience to wait for the pullback with me?
CLICK HERE ⬇️
ALØNDRACRYPTØ1
·
--
Do you remember our previous post where I asked you to set the alarms and stay calm? Well, $HYPE has just arrived exactly at the zone we had our sights on. But as we always tell you around here, hitting the number isn’t an order to rush in; it’s the exact moment to review the indicators with a magnifying glass. 🔍
What is the chart telling us right now?
- On the 4-hour timeframe: StochRSI is at its maximum (touching the 100 level), warning us of overbought conditions and that the price needs a breather—or an obligatory pause.
- But watch the RSI: Since it’s still hovering around 81, it still shows a little bit of technical “room,” which explains why the price tries to probe or stretch a bit higher toward the top before deciding its next move.
- On the daily chart (1D): The underlying structure is still trying to maintain a bullish tone, creating that classic tension between short-term consolidation and the macro trend.
What’s the action plan from here?
With the price around 82k and the indicators asking for a break, no chasing buys higher. The smart moves we’re watching are:
- The tactical pullback (relief Short): If the price hits this ceiling and the 15-minute candles lose momentum, we can consider a controlled pullback to unload the accumulated overbought on the 4H.
- Wait for the key support (Zone of 75): If the price cooling drives it downward, the key is precise patience. We don’t buy on the first touch—we wait to see whether buyers defend the lower supports (like the 75.129 USDT zone) with volume confirmation and structure on the 15-minute chart.
#AnalisisTecnico
What do you think? …I’ll read you in the comments!
TOUCH HERE ⬇️⬇️
What is the chart telling us right now?
- On the 4-hour timeframe: StochRSI is at its maximum (touching the 100 level), warning us of overbought conditions and that the price needs a breather—or an obligatory pause.
- But watch the RSI: Since it’s still hovering around 81, it still shows a little bit of technical “room,” which explains why the price tries to probe or stretch a bit higher toward the top before deciding its next move.
- On the daily chart (1D): The underlying structure is still trying to maintain a bullish tone, creating that classic tension between short-term consolidation and the macro trend.
What’s the action plan from here?
With the price around 82k and the indicators asking for a break, no chasing buys higher. The smart moves we’re watching are:
- The tactical pullback (relief Short): If the price hits this ceiling and the 15-minute candles lose momentum, we can consider a controlled pullback to unload the accumulated overbought on the 4H.
- Wait for the key support (Zone of 75): If the price cooling drives it downward, the key is precise patience. We don’t buy on the first touch—we wait to see whether buyers defend the lower supports (like the 75.129 USDT zone) with volume confirmation and structure on the 15-minute chart.
#AnalisisTecnico
What do you think? …I’ll read you in the comments!
TOUCH HERE ⬇️⬇️
JohnnyM220777:
lo mas seguro es que el alza de las cripto esta infundada en la baja del petroleo y de la bolsa
14
6
3.1k
🚀 ¡ASTER IN FULL ACCUMULATION: HEADING TOWARD NEW HIGHS OR KEY RESISTANCE? ⚡
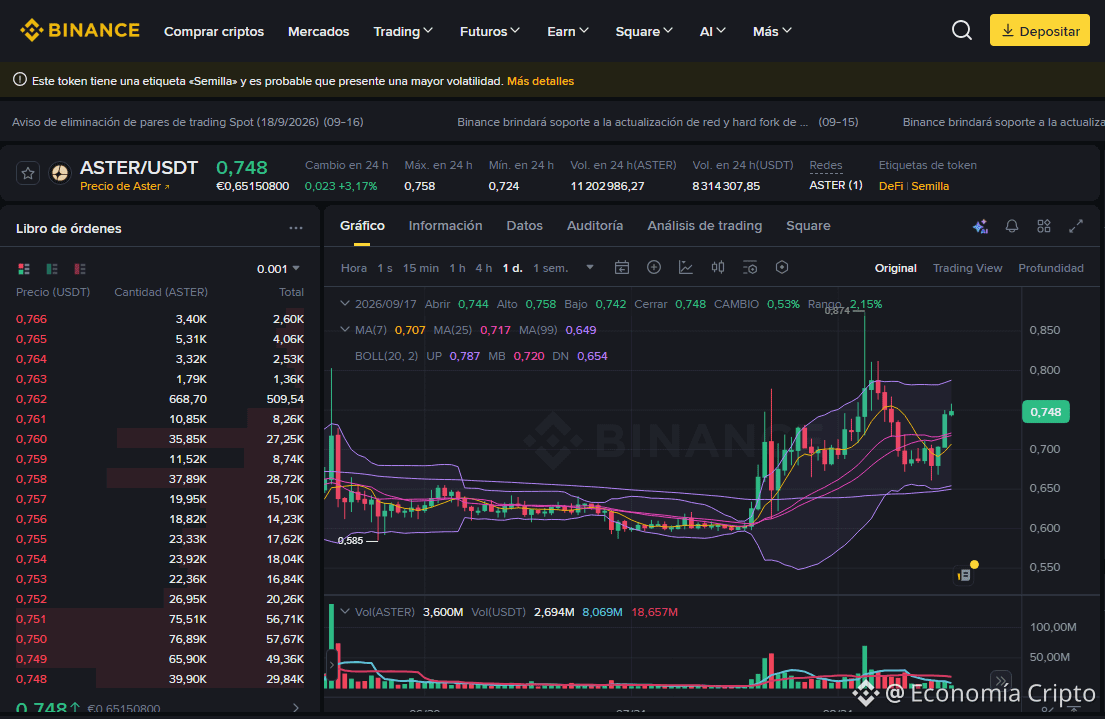
The ASTER/USDT pair is trading at 0.748, recording a solid gain of +3.17% over the last 24 hours. The daily session shows an opening at 0.744, a high of 0.758, a low of 0.742, and a close at 0.748 (+0.53%), reflecting buying interest in this DeFi ecosystem asset that has a seed tag and high volatility.
🔍 Trend Analysis and Indicators
Trend: Bullish in the short term, consolidating a steady recovery move above the operational control zones.
Moving Averages: The price is clearly above the MA(7) (0.707) and the MA(25) (0.717), while the broader underlying macro structure remains supported as it trades well above the MA(99) (0.649).
Bollinger Bands: Price is operating in the upper half, moving from the middle band MB (0.720) toward the upper band UP (0.787) (with the lower band DN at 0.654), indicating active buying pressure.
Key Levels: Immediate support consolidates around 0.72, while the main resistance to challenge is located at the session highs of 0.758 and the targets toward the upper band.
💡 Trading Strategy: Buy or Sell?
Buy (Long)?: The price position above the fast moving averages supports tactical continuation opportunities for a bullish move toward higher targets, managing risk strictly due to its high volatility and using a Stop Loss adjusted below the support.
Sell (Short)?: Trading to the downside carries higher risk given the strength of the current uptrend; it would only be considered with a clear rejection in the resistance zone or a loss of the 25-period moving average.
#ASTER #AnalisisTecnico #CryptoTrading
The Lord blesses and prospers whoever operates here, in the name of Jesus, because your word says: "Mine is the silver, and mine is the gold, says the LORD of hosts." Hageo 2:8 RV1960-T -
$ASTER
{spot}(ASTERUSDT)
🚀 ¡ASTER IN FULL ACCUMULATION: HEADING TOWARD NEW HIGHS OR KEY RESISTANCE? ⚡
The ASTER/USDT pair is trading at 0.748, recording a solid gain of +3.17% over the last 24 hours. The daily session shows an opening at 0.744, a high of 0.758, a low of 0.742, and a close at 0.748 (+0.53%), reflecting buying interest in this DeFi ecosystem asset that has a seed tag and high volatility.
🔍 Trend Analysis and Indicators
Trend: Bullish in the short term, consolidating a steady recovery move above the operational control zones.
Moving Averages: The price is clearly above the MA(7) (0.707) and the MA(25) (0.717), while the broader underlying macro structure remains supported as it trades well above the MA(99) (0.649).
Bollinger Bands: Price is operating in the upper half, moving from the middle band MB (0.720) toward the upper band UP (0.787) (with the lower band DN at 0.654), indicating active buying pressure.
Key Levels: Immediate support consolidates around 0.72, while the main resistance to challenge is located at the session highs of 0.758 and the targets toward the upper band.
💡 Trading Strategy: Buy or Sell?
Buy (Long)?: The price position above the fast moving averages supports tactical continuation opportunities for a bullish move toward higher targets, managing risk strictly due to its high volatility and using a Stop Loss adjusted below the support.
Sell (Short)?: Trading to the downside carries higher risk given the strength of the current uptrend; it would only be considered with a clear rejection in the resistance zone or a loss of the 25-period moving average.
#ASTER #AnalisisTecnico #CryptoTrading
The Lord blesses and prospers whoever operates here, in the name of Jesus, because your word says: "Mine is the silver, and mine is the gold, says the LORD of hosts." Hageo 2:8 RV1960-T -
$ASTER
The ASTER/USDT pair is trading at 0.748, recording a solid gain of +3.17% over the last 24 hours. The daily session shows an opening at 0.744, a high of 0.758, a low of 0.742, and a close at 0.748 (+0.53%), reflecting buying interest in this DeFi ecosystem asset that has a seed tag and high volatility.
🔍 Trend Analysis and Indicators
Trend: Bullish in the short term, consolidating a steady recovery move above the operational control zones.
Moving Averages: The price is clearly above the MA(7) (0.707) and the MA(25) (0.717), while the broader underlying macro structure remains supported as it trades well above the MA(99) (0.649).
Bollinger Bands: Price is operating in the upper half, moving from the middle band MB (0.720) toward the upper band UP (0.787) (with the lower band DN at 0.654), indicating active buying pressure.
Key Levels: Immediate support consolidates around 0.72, while the main resistance to challenge is located at the session highs of 0.758 and the targets toward the upper band.
💡 Trading Strategy: Buy or Sell?
Buy (Long)?: The price position above the fast moving averages supports tactical continuation opportunities for a bullish move toward higher targets, managing risk strictly due to its high volatility and using a Stop Loss adjusted below the support.
Sell (Short)?: Trading to the downside carries higher risk given the strength of the current uptrend; it would only be considered with a clear rejection in the resistance zone or a loss of the 25-period moving average.
#ASTER #AnalisisTecnico #CryptoTrading
The Lord blesses and prospers whoever operates here, in the name of Jesus, because your word says: "Mine is the silver, and mine is the gold, says the LORD of hosts." Hageo 2:8 RV1960-T -
$ASTER
1
54
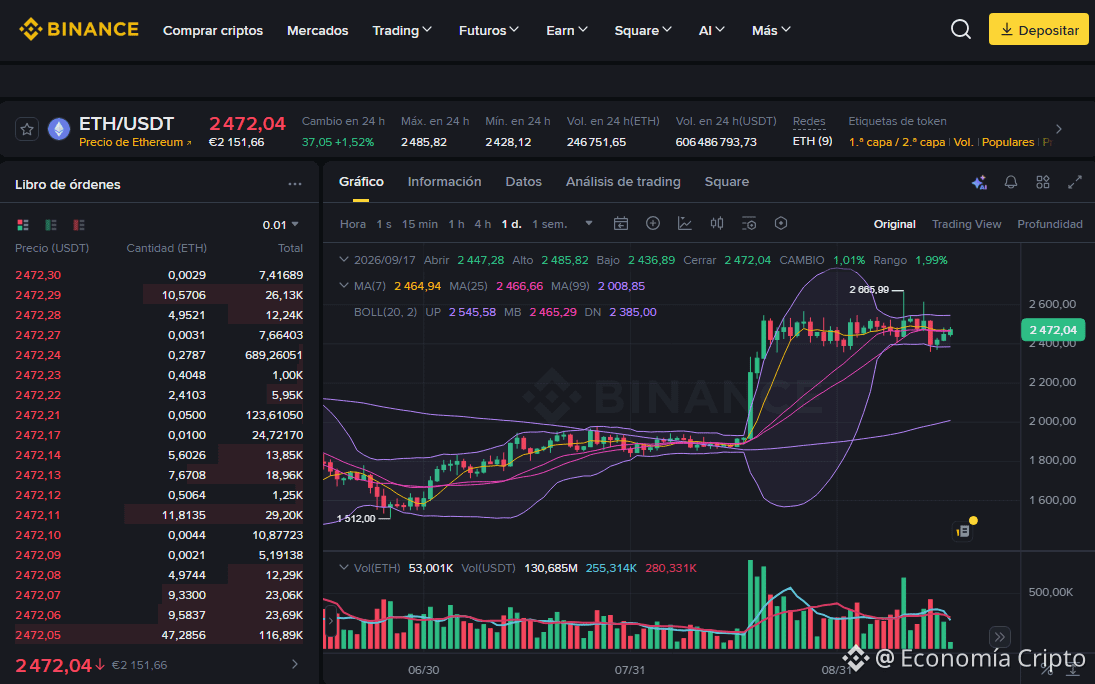
🚀 Ethereum regains momentum: heading for new phases or consolidation? ⚡
The ETH/USDT pair is trading at 2,472.04, recording a gain of +1.52% over the last 24 hours. The daily session shows an open at 2,447.28, a high of 2,485.82, a low of 2,428.12, and an increase of +1.01%, reflecting the return of buying pressure in the market.
🔍 Trend Analysis and Indicators
Trend: Bullish short-term recovery, consolidating positions above the operational control zones.
Moving Averages: Price is above the MA(7) (2,464.94) and touches the MA(25) (2,466.66), while the broader macro structure remains firmly bullish as it trades well above the MA(99) (2,008.85).
Bollinger Bands: Price is oscillating near the middle band MB (2,465.29), with the upper band UP (2,545.58) and the lower band DN (2,385.00), indicating temporary equilibrium and a favorable bias to seek the upper part of the channel.
Key Levels: Immediate support is consolidating in the 2,428 area, while the main resistance to challenge is located near the previous highs at 2,665.99.
💡 Trading Strategy: Buy or Sell?
Buy (Long)?: A break above the fast moving averages supports tactical entry opportunities to seek an upward push toward the upper band, always using strict risk management and a Stop Loss adjusted below the session low.
Sell (Short)?: Shorting has low probability due to the strength of the underlying bullish trend; it would only be considered in case of a clear rejection in the resistance zone.
#Ethereum #AnalisisTecnico #CryptoTrading
May the Lord bless and prosper those who operate here, in the name of Jesus, because your word says: "Mine is the silver, and mine is the gold," says the LORD of hosts. Hageo 2:8 RV1960-T -
$ETH
{spot}(BNBUSDT)
{spot}(ETHUSDT)
{spot}(BTCUSDT)
🚀 Ethereum regains momentum: heading for new phases or consolidation? ⚡
The ETH/USDT pair is trading at 2,472.04, recording a gain of +1.52% over the last 24 hours. The daily session shows an open at 2,447.28, a high of 2,485.82, a low of 2,428.12, and an increase of +1.01%, reflecting the return of buying pressure in the market.
🔍 Trend Analysis and Indicators
Trend: Bullish short-term recovery, consolidating positions above the operational control zones.
Moving Averages: Price is above the MA(7) (2,464.94) and touches the MA(25) (2,466.66), while the broader macro structure remains firmly bullish as it trades well above the MA(99) (2,008.85).
Bollinger Bands: Price is oscillating near the middle band MB (2,465.29), with the upper band UP (2,545.58) and the lower band DN (2,385.00), indicating temporary equilibrium and a favorable bias to seek the upper part of the channel.
Key Levels: Immediate support is consolidating in the 2,428 area, while the main resistance to challenge is located near the previous highs at 2,665.99.
💡 Trading Strategy: Buy or Sell?
Buy (Long)?: A break above the fast moving averages supports tactical entry opportunities to seek an upward push toward the upper band, always using strict risk management and a Stop Loss adjusted below the session low.
Sell (Short)?: Shorting has low probability due to the strength of the underlying bullish trend; it would only be considered in case of a clear rejection in the resistance zone.
#Ethereum #AnalisisTecnico #CryptoTrading
May the Lord bless and prosper those who operate here, in the name of Jesus, because your word says: "Mine is the silver, and mine is the gold," says the LORD of hosts. Hageo 2:8 RV1960-T -
$ETH
The ETH/USDT pair is trading at 2,472.04, recording a gain of +1.52% over the last 24 hours. The daily session shows an open at 2,447.28, a high of 2,485.82, a low of 2,428.12, and an increase of +1.01%, reflecting the return of buying pressure in the market.
🔍 Trend Analysis and Indicators
Trend: Bullish short-term recovery, consolidating positions above the operational control zones.
Moving Averages: Price is above the MA(7) (2,464.94) and touches the MA(25) (2,466.66), while the broader macro structure remains firmly bullish as it trades well above the MA(99) (2,008.85).
Bollinger Bands: Price is oscillating near the middle band MB (2,465.29), with the upper band UP (2,545.58) and the lower band DN (2,385.00), indicating temporary equilibrium and a favorable bias to seek the upper part of the channel.
Key Levels: Immediate support is consolidating in the 2,428 area, while the main resistance to challenge is located near the previous highs at 2,665.99.
💡 Trading Strategy: Buy or Sell?
Buy (Long)?: A break above the fast moving averages supports tactical entry opportunities to seek an upward push toward the upper band, always using strict risk management and a Stop Loss adjusted below the session low.
Sell (Short)?: Shorting has low probability due to the strength of the underlying bullish trend; it would only be considered in case of a clear rejection in the resistance zone.
#Ethereum #AnalisisTecnico #CryptoTrading
May the Lord bless and prosper those who operate here, in the name of Jesus, because your word says: "Mine is the silver, and mine is the gold," says the LORD of hosts. Hageo 2:8 RV1960-T -
$ETH
1
95
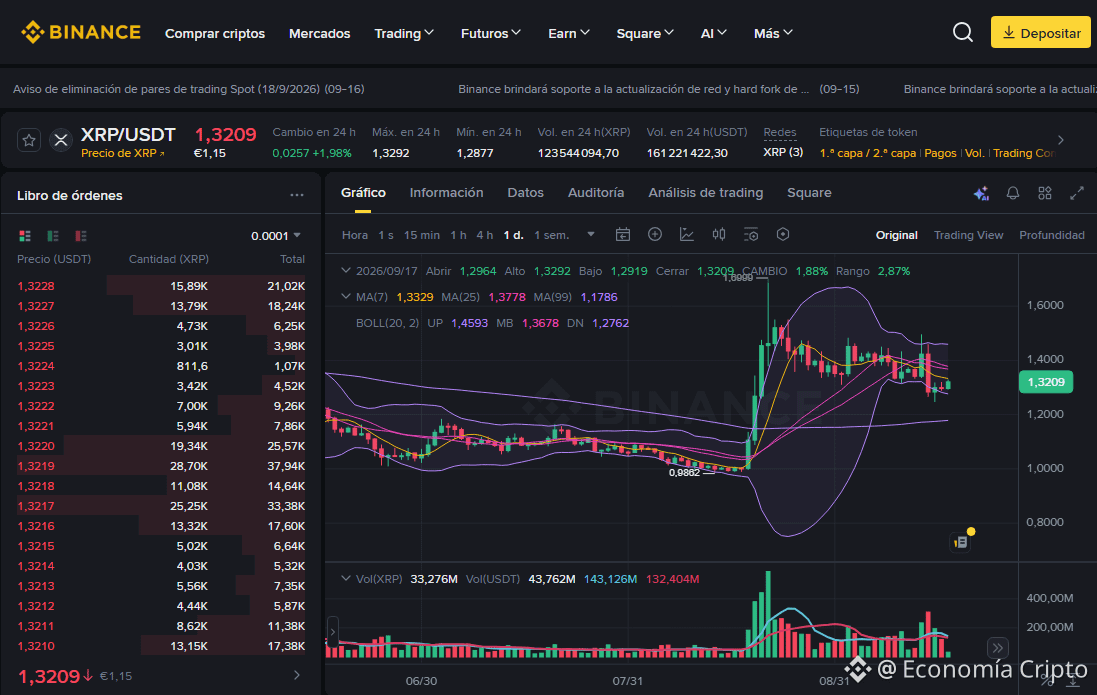
🚀 XRP REGAINS MOMENTUM: HEADING FOR NEW MOVES OR CONSOLIDATION? ⚡
The XRP/USDT pair is trading at 1.3209, recording a +1.98% gain over the last 24 hours. The daily session shows an open at 1.2964, a high of 1.3292, a low of 1.2919, and a +1.88% increase, reflecting the return of buying pressure in the market.
🔍 Trend Analysis and Indicators
Trend: Bullish short-term recovery, looking to stabilize and break above key operating control zones after the prior corrections.
Moving Averages: Price is approaching the MA(7) (1.3329) and is trading below the MA(25) (1.3778), while the broader macro structure remains firmly supported, as it is trading well above the MA(99) (1.1786).
Bollinger Bands: Price bounces from the lower zone and is moving toward the middle band MB (1.3678), with the upper band UP (1.4593) and the lower band DN (1.2762), indicating a decrease in bearish volatility and greater buying interest.
Key Levels: Immediate support is consolidating in the 1.27–1.29 area, while the main resistance to challenge lies at the 25-period moving average and the middle band.
💡 Trading Strategy: Buy or Sell?
Buy (Long)?: Support defense and the technical bounce support tactical entry opportunities, aiming for a move toward the Bollinger middle band, always using strict risk management and a Stop Loss placed below the session’s low.
Sell (Short)?: Selling lower has a low probability due to the strength of the underlying bullish trend; it would only be considered if there is a clear rejection in the resistance zone.
#XRP #AnalisisTecnico #CryptoTrading
May the Lord bless and prosper the one who trades here, in the name of Jesus, because your word says: “Mine is the silver, and mine is the gold,” says the LORD of hosts. Hageo 2:8 RV1960-T -
$XRP
{spot}(AMZNBUSDT)
{spot}(BTCUSDT)
{spot}(XRPUSDT)
🚀 XRP REGAINS MOMENTUM: HEADING FOR NEW MOVES OR CONSOLIDATION? ⚡
The XRP/USDT pair is trading at 1.3209, recording a +1.98% gain over the last 24 hours. The daily session shows an open at 1.2964, a high of 1.3292, a low of 1.2919, and a +1.88% increase, reflecting the return of buying pressure in the market.
🔍 Trend Analysis and Indicators
Trend: Bullish short-term recovery, looking to stabilize and break above key operating control zones after the prior corrections.
Moving Averages: Price is approaching the MA(7) (1.3329) and is trading below the MA(25) (1.3778), while the broader macro structure remains firmly supported, as it is trading well above the MA(99) (1.1786).
Bollinger Bands: Price bounces from the lower zone and is moving toward the middle band MB (1.3678), with the upper band UP (1.4593) and the lower band DN (1.2762), indicating a decrease in bearish volatility and greater buying interest.
Key Levels: Immediate support is consolidating in the 1.27–1.29 area, while the main resistance to challenge lies at the 25-period moving average and the middle band.
💡 Trading Strategy: Buy or Sell?
Buy (Long)?: Support defense and the technical bounce support tactical entry opportunities, aiming for a move toward the Bollinger middle band, always using strict risk management and a Stop Loss placed below the session’s low.
Sell (Short)?: Selling lower has a low probability due to the strength of the underlying bullish trend; it would only be considered if there is a clear rejection in the resistance zone.
#XRP #AnalisisTecnico #CryptoTrading
May the Lord bless and prosper the one who trades here, in the name of Jesus, because your word says: “Mine is the silver, and mine is the gold,” says the LORD of hosts. Hageo 2:8 RV1960-T -
$XRP
The XRP/USDT pair is trading at 1.3209, recording a +1.98% gain over the last 24 hours. The daily session shows an open at 1.2964, a high of 1.3292, a low of 1.2919, and a +1.88% increase, reflecting the return of buying pressure in the market.
🔍 Trend Analysis and Indicators
Trend: Bullish short-term recovery, looking to stabilize and break above key operating control zones after the prior corrections.
Moving Averages: Price is approaching the MA(7) (1.3329) and is trading below the MA(25) (1.3778), while the broader macro structure remains firmly supported, as it is trading well above the MA(99) (1.1786).
Bollinger Bands: Price bounces from the lower zone and is moving toward the middle band MB (1.3678), with the upper band UP (1.4593) and the lower band DN (1.2762), indicating a decrease in bearish volatility and greater buying interest.
Key Levels: Immediate support is consolidating in the 1.27–1.29 area, while the main resistance to challenge lies at the 25-period moving average and the middle band.
💡 Trading Strategy: Buy or Sell?
Buy (Long)?: Support defense and the technical bounce support tactical entry opportunities, aiming for a move toward the Bollinger middle band, always using strict risk management and a Stop Loss placed below the session’s low.
Sell (Short)?: Selling lower has a low probability due to the strength of the underlying bullish trend; it would only be considered if there is a clear rejection in the resistance zone.
#XRP #AnalisisTecnico #CryptoTrading
May the Lord bless and prosper the one who trades here, in the name of Jesus, because your word says: “Mine is the silver, and mine is the gold,” says the LORD of hosts. Hageo 2:8 RV1960-T -
$XRP
1
23
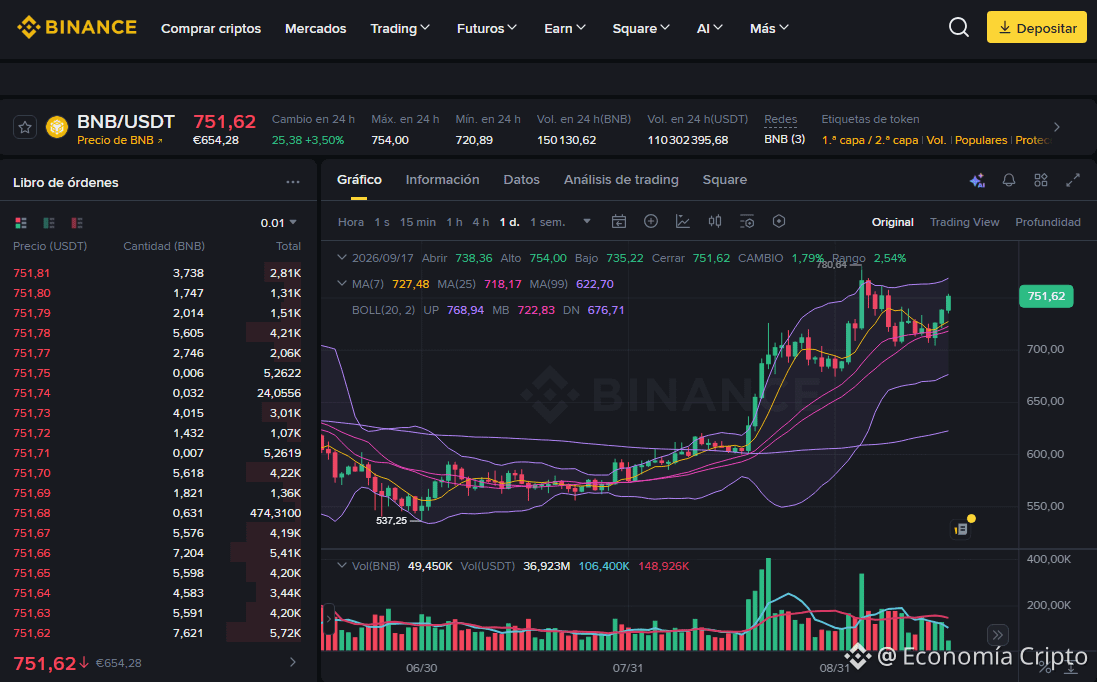
🚀 BNB BOOSTS ITS MOMENTUM: HEADING FOR NEW HIGHS OR KEY RESISTANCE? ⚡
The BNB/USDT pair is trading at 751.62, registering a strong advance of +3.50% over the last 24 hours. The daily session shows an opening at 738.36, a high of 754.00, a low of 735.22, and a sustained increase of +1.79%, reflecting intense buying participation in the market.
🔍 Trend Analysis and Indicators
Trend: Bullish in the short term, consolidating a firm recovery move above the control zones.
Moving Averages: The price is solidly above the MA(7) (727.48) and the MA(25) (718.17), while the broader macro structure remains supported by trading well above the MA(99) (622.70).
Bollinger Bands: Price is expanding toward the upper half, seeking to approach the upper band UP (768.94) from the mid band MB (722.83) (with the lower band DN (676.71)), indicating stronger bullish pressure.
Key Levels: Immediate support is consolidating around the 735 area, while the main resistance to challenge is located at the session highs and the upper band.
💡 Trading Strategy: Buy or Sell?
Buy (Long)?: Price positioning above the fast moving averages supports tactical opportunities for bullish continuation to target higher objectives, managing risk with a Stop Loss placed below the session support.
Sell (Short)?: Shorting carries a high risk probability due to the strength of the current uptrend; it would only be considered in the event of a clear rejection in the resistance zone.
#BNB #AnalisisTecnico #CryptoTrading
May the Lord bless and prosper whoever operates here, in the name of Jesus, because your word says: "Mine is the silver, and mine is the gold, says the LORD of hosts." Hageo 2:8 RV1960-T -
$BNB
{spot}(AAPLBUSDT)
{spot}(BTCUSDT)
{spot}(BNBUSDT)
🚀 BNB BOOSTS ITS MOMENTUM: HEADING FOR NEW HIGHS OR KEY RESISTANCE? ⚡
The BNB/USDT pair is trading at 751.62, registering a strong advance of +3.50% over the last 24 hours. The daily session shows an opening at 738.36, a high of 754.00, a low of 735.22, and a sustained increase of +1.79%, reflecting intense buying participation in the market.
🔍 Trend Analysis and Indicators
Trend: Bullish in the short term, consolidating a firm recovery move above the control zones.
Moving Averages: The price is solidly above the MA(7) (727.48) and the MA(25) (718.17), while the broader macro structure remains supported by trading well above the MA(99) (622.70).
Bollinger Bands: Price is expanding toward the upper half, seeking to approach the upper band UP (768.94) from the mid band MB (722.83) (with the lower band DN (676.71)), indicating stronger bullish pressure.
Key Levels: Immediate support is consolidating around the 735 area, while the main resistance to challenge is located at the session highs and the upper band.
💡 Trading Strategy: Buy or Sell?
Buy (Long)?: Price positioning above the fast moving averages supports tactical opportunities for bullish continuation to target higher objectives, managing risk with a Stop Loss placed below the session support.
Sell (Short)?: Shorting carries a high risk probability due to the strength of the current uptrend; it would only be considered in the event of a clear rejection in the resistance zone.
#BNB #AnalisisTecnico #CryptoTrading
May the Lord bless and prosper whoever operates here, in the name of Jesus, because your word says: "Mine is the silver, and mine is the gold, says the LORD of hosts." Hageo 2:8 RV1960-T -
$BNB
The BNB/USDT pair is trading at 751.62, registering a strong advance of +3.50% over the last 24 hours. The daily session shows an opening at 738.36, a high of 754.00, a low of 735.22, and a sustained increase of +1.79%, reflecting intense buying participation in the market.
🔍 Trend Analysis and Indicators
Trend: Bullish in the short term, consolidating a firm recovery move above the control zones.
Moving Averages: The price is solidly above the MA(7) (727.48) and the MA(25) (718.17), while the broader macro structure remains supported by trading well above the MA(99) (622.70).
Bollinger Bands: Price is expanding toward the upper half, seeking to approach the upper band UP (768.94) from the mid band MB (722.83) (with the lower band DN (676.71)), indicating stronger bullish pressure.
Key Levels: Immediate support is consolidating around the 735 area, while the main resistance to challenge is located at the session highs and the upper band.
💡 Trading Strategy: Buy or Sell?
Buy (Long)?: Price positioning above the fast moving averages supports tactical opportunities for bullish continuation to target higher objectives, managing risk with a Stop Loss placed below the session support.
Sell (Short)?: Shorting carries a high risk probability due to the strength of the current uptrend; it would only be considered in the event of a clear rejection in the resistance zone.
#BNB #AnalisisTecnico #CryptoTrading
May the Lord bless and prosper whoever operates here, in the name of Jesus, because your word says: "Mine is the silver, and mine is the gold, says the LORD of hosts." Hageo 2:8 RV1960-T -
$BNB
1
40
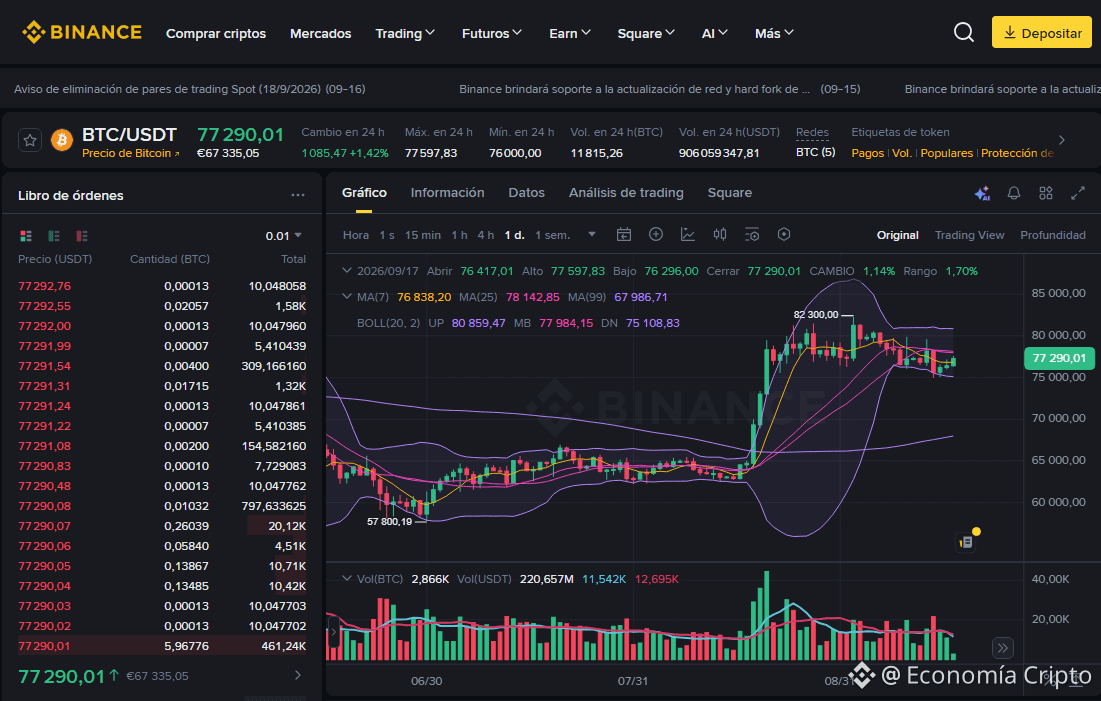
🚀 BITCOIN REGAINS MOMENTUM: HEADING FOR NEW HIGHS OR CONSOLIDATION? ⚡
The BTC/USDT pair trades at 77,290.01, up +1.42% over the last 24 hours. The daily session shows an opening at 76,417.01, a high of 77,597.83, a low of 76,000.00, and a steady increase of +1.14%, reflecting a return of buying pressure.
🔍 Trend Analysis and Indicators
Trend: Short-term bullish recovery, aiming to stabilize above the moving control zones.
Moving Averages: Price has broken above the MA(7) (76,838.20) and is pressing the MA(25) (78,142.85), while the broader macro structure remains firmly bullish, trading well above the MA(99) (67,986.71).
Bollinger Bands: Price rebounds from the lower area and points toward the middle band MB (77,984.15), with the upper band UP (80,859.47) and the lower band DN (75,108.83), indicating a decline in bearish volatility and greater buying participation.
Key Levels: Immediate support is consolidating around 76,000, while the main resistance to challenge lies at the 25-period moving average and 82,300.00.
💡 Trading Strategy: Buy or Sell?
Buy (Long)?: A break above the fast moving average supports tactical entry opportunities to seek momentum toward the Bollinger middle band, always using strict risk management and a Stop Loss adjusted below the session low.
Sell (Short)?: Going short has low probability due to the strength of the underlying uptrend; it would only be considered with a clear rejection at resistance accompanied by a loss of the fast moving average.
#Bitcoin #AnalisisTecnico #CryptoTrading
May the Lord bless and prosper the one who operates here, in the name of Jesus, because your word says: "Mine is the silver, and mine is the gold," says the LORD of hosts. Hageo 2:8 RV1960-T -
$BTC
{spot}(BNBUSDT)
{spot}(MSFTBUSDT)
{spot}(BTCUSDT)
🚀 BITCOIN REGAINS MOMENTUM: HEADING FOR NEW HIGHS OR CONSOLIDATION? ⚡
The BTC/USDT pair trades at 77,290.01, up +1.42% over the last 24 hours. The daily session shows an opening at 76,417.01, a high of 77,597.83, a low of 76,000.00, and a steady increase of +1.14%, reflecting a return of buying pressure.
🔍 Trend Analysis and Indicators
Trend: Short-term bullish recovery, aiming to stabilize above the moving control zones.
Moving Averages: Price has broken above the MA(7) (76,838.20) and is pressing the MA(25) (78,142.85), while the broader macro structure remains firmly bullish, trading well above the MA(99) (67,986.71).
Bollinger Bands: Price rebounds from the lower area and points toward the middle band MB (77,984.15), with the upper band UP (80,859.47) and the lower band DN (75,108.83), indicating a decline in bearish volatility and greater buying participation.
Key Levels: Immediate support is consolidating around 76,000, while the main resistance to challenge lies at the 25-period moving average and 82,300.00.
💡 Trading Strategy: Buy or Sell?
Buy (Long)?: A break above the fast moving average supports tactical entry opportunities to seek momentum toward the Bollinger middle band, always using strict risk management and a Stop Loss adjusted below the session low.
Sell (Short)?: Going short has low probability due to the strength of the underlying uptrend; it would only be considered with a clear rejection at resistance accompanied by a loss of the fast moving average.
#Bitcoin #AnalisisTecnico #CryptoTrading
May the Lord bless and prosper the one who operates here, in the name of Jesus, because your word says: "Mine is the silver, and mine is the gold," says the LORD of hosts. Hageo 2:8 RV1960-T -
$BTC
The BTC/USDT pair trades at 77,290.01, up +1.42% over the last 24 hours. The daily session shows an opening at 76,417.01, a high of 77,597.83, a low of 76,000.00, and a steady increase of +1.14%, reflecting a return of buying pressure.
🔍 Trend Analysis and Indicators
Trend: Short-term bullish recovery, aiming to stabilize above the moving control zones.
Moving Averages: Price has broken above the MA(7) (76,838.20) and is pressing the MA(25) (78,142.85), while the broader macro structure remains firmly bullish, trading well above the MA(99) (67,986.71).
Bollinger Bands: Price rebounds from the lower area and points toward the middle band MB (77,984.15), with the upper band UP (80,859.47) and the lower band DN (75,108.83), indicating a decline in bearish volatility and greater buying participation.
Key Levels: Immediate support is consolidating around 76,000, while the main resistance to challenge lies at the 25-period moving average and 82,300.00.
💡 Trading Strategy: Buy or Sell?
Buy (Long)?: A break above the fast moving average supports tactical entry opportunities to seek momentum toward the Bollinger middle band, always using strict risk management and a Stop Loss adjusted below the session low.
Sell (Short)?: Going short has low probability due to the strength of the underlying uptrend; it would only be considered with a clear rejection at resistance accompanied by a loss of the fast moving average.
#Bitcoin #AnalisisTecnico #CryptoTrading
May the Lord bless and prosper the one who operates here, in the name of Jesus, because your word says: "Mine is the silver, and mine is the gold," says the LORD of hosts. Hageo 2:8 RV1960-T -
$BTC
1
82
Do you remember our previous post where I asked you to set the alarms and stay calm? Well, $HYPE has just arrived exactly at the zone we had our sights on. But as we always tell you around here, hitting the number isn’t an order to rush in; it’s the exact moment to review the indicators with a magnifying glass. 🔍
What is the chart telling us right now?
- On the 4-hour timeframe: StochRSI is at its maximum (touching the 100 level), warning us of overbought conditions and that the price needs a breather—or an obligatory pause.
- But watch the RSI: Since it’s still hovering around 81, it still shows a little bit of technical “room,” which explains why the price tries to probe or stretch a bit higher toward the top before deciding its next move.
- On the daily chart (1D): The underlying structure is still trying to maintain a bullish tone, creating that classic tension between short-term consolidation and the macro trend.
What’s the action plan from here?
With the price around 82k and the indicators asking for a break, no chasing buys higher. The smart moves we’re watching are:
- The tactical pullback (relief Short): If the price hits this ceiling and the 15-minute candles lose momentum, we can consider a controlled pullback to unload the accumulated overbought on the 4H.
- Wait for the key support (Zone of 75): If the price cooling drives it downward, the key is precise patience. We don’t buy on the first touch—we wait to see whether buyers defend the lower supports (like the 75.129 USDT zone) with volume confirmation and structure on the 15-minute chart.
#AnalisisTecnico
What do you think? …I’ll read you in the comments!
TOUCH HERE ⬇️⬇️
{future}(HYPEUSDT)
Do you remember our previous post where I asked you to set the alarms and stay calm? Well, $HYPE has just arrived exactly at the zone we had our sights on. But as we always tell you around here, hitting the number isn’t an order to rush in; it’s the exact moment to review the indicators with a magnifying glass. 🔍
What is the chart telling us right now?
- On the 4-hour timeframe: StochRSI is at its maximum (touching the 100 level), warning us of overbought conditions and that the price needs a breather—or an obligatory pause.
- But watch the RSI: Since it’s still hovering around 81, it still shows a little bit of technical “room,” which explains why the price tries to probe or stretch a bit higher toward the top before deciding its next move.
- On the daily chart (1D): The underlying structure is still trying to maintain a bullish tone, creating that classic tension between short-term consolidation and the macro trend.
What’s the action plan from here?
With the price around 82k and the indicators asking for a break, no chasing buys higher. The smart moves we’re watching are:
- The tactical pullback (relief Short): If the price hits this ceiling and the 15-minute candles lose momentum, we can consider a controlled pullback to unload the accumulated overbought on the 4H.
- Wait for the key support (Zone of 75): If the price cooling drives it downward, the key is precise patience. We don’t buy on the first touch—we wait to see whether buyers defend the lower supports (like the 75.129 USDT zone) with volume confirmation and structure on the 15-minute chart.
#AnalisisTecnico
What do you think? …I’ll read you in the comments!
TOUCH HERE ⬇️⬇️
What is the chart telling us right now?
- On the 4-hour timeframe: StochRSI is at its maximum (touching the 100 level), warning us of overbought conditions and that the price needs a breather—or an obligatory pause.
- But watch the RSI: Since it’s still hovering around 81, it still shows a little bit of technical “room,” which explains why the price tries to probe or stretch a bit higher toward the top before deciding its next move.
- On the daily chart (1D): The underlying structure is still trying to maintain a bullish tone, creating that classic tension between short-term consolidation and the macro trend.
What’s the action plan from here?
With the price around 82k and the indicators asking for a break, no chasing buys higher. The smart moves we’re watching are:
- The tactical pullback (relief Short): If the price hits this ceiling and the 15-minute candles lose momentum, we can consider a controlled pullback to unload the accumulated overbought on the 4H.
- Wait for the key support (Zone of 75): If the price cooling drives it downward, the key is precise patience. We don’t buy on the first touch—we wait to see whether buyers defend the lower supports (like the 75.129 USDT zone) with volume confirmation and structure on the 15-minute chart.
#AnalisisTecnico
What do you think? …I’ll read you in the comments!
TOUCH HERE ⬇️⬇️
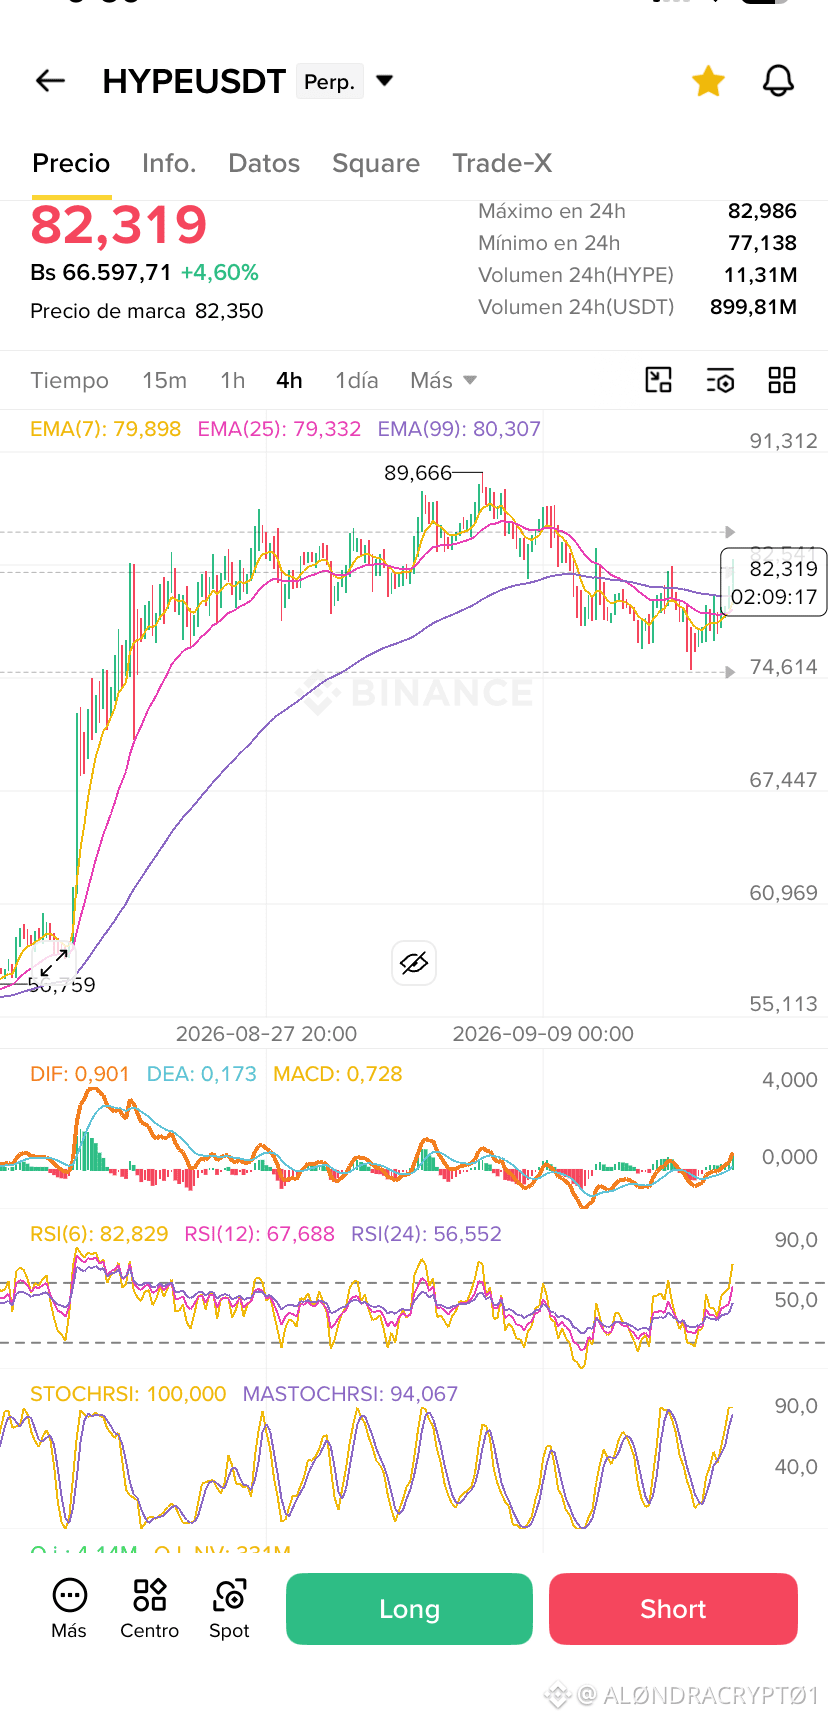
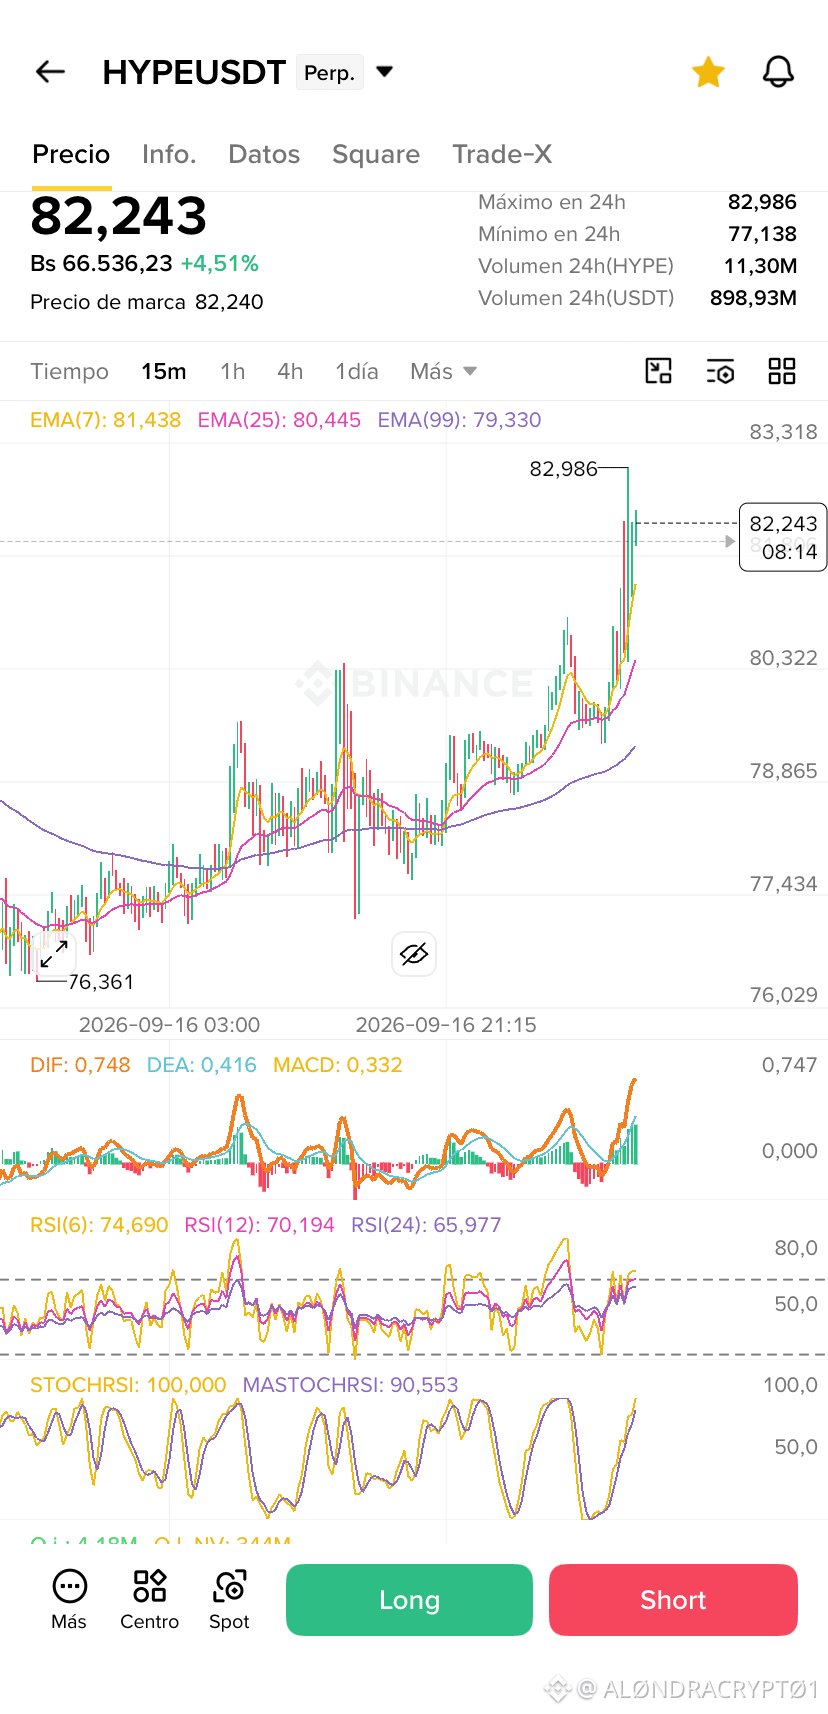
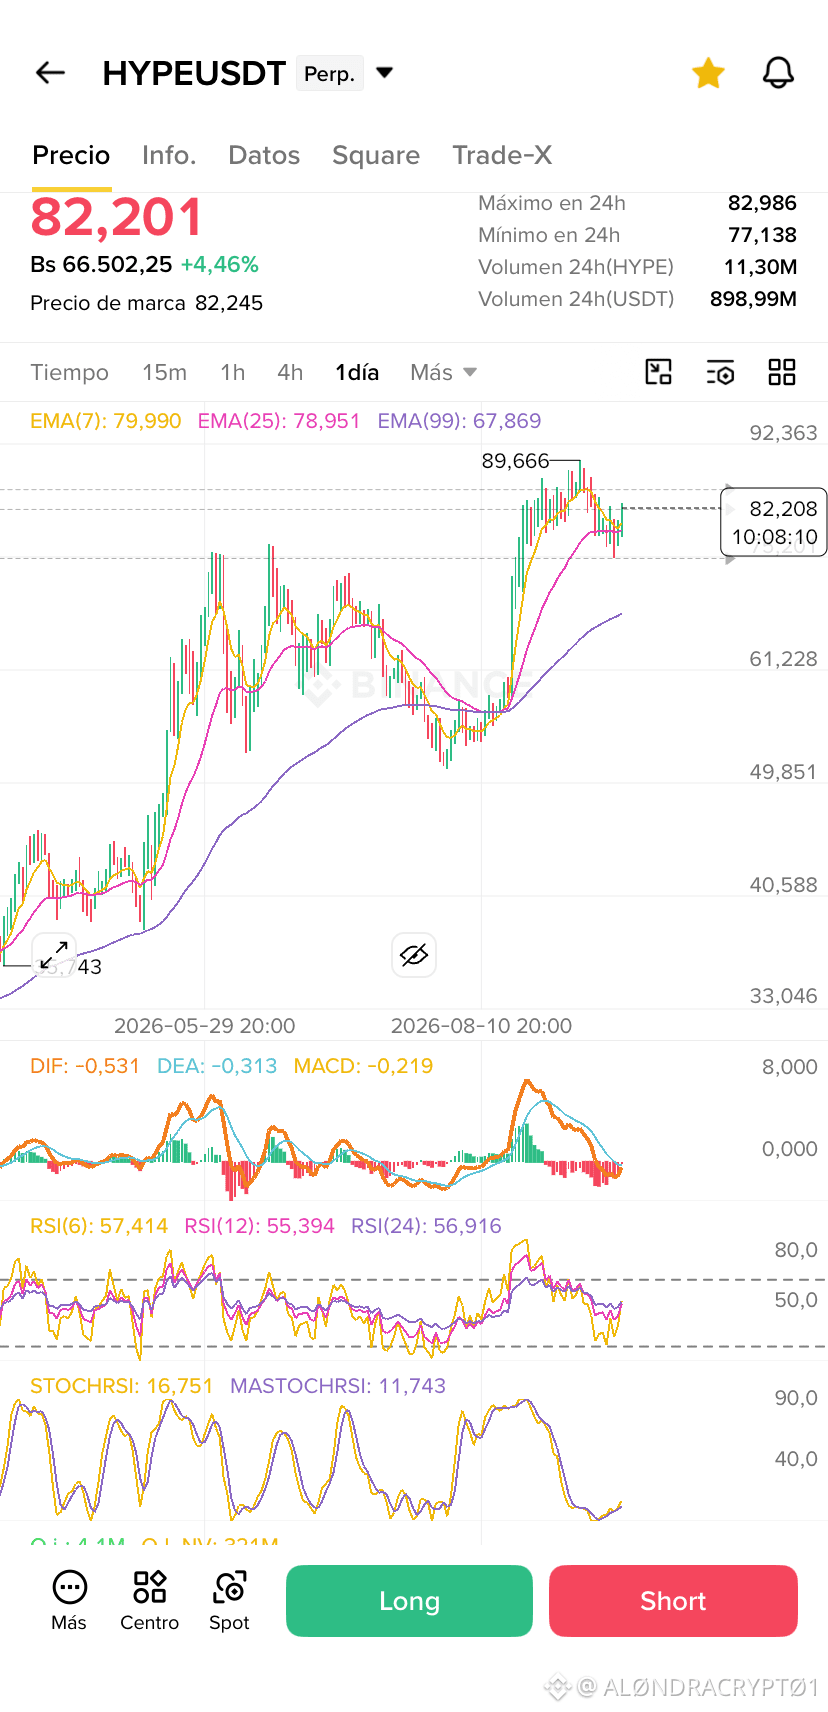
ALØNDRACRYPTØ1
·
--
$HYPE shows interesting conditions because it comes from testing the upper area and the daily chart reflects that the main bullish impulse has already started to cool off.
If I had to assess a short right now, these would be the key points to consider:
It’s not a good idea to enter chasing the price halfway. Ideally, for a short, wait for the price to attempt a small rebound toward the resistance zone between 82,000 and 85,000 USDT and fail to break it, or wait until it strongly loses the 75,129 USDT support to confirm the breakdown.
Since the RSI is neutral and the price stays oscillating in the middle zone (around 78,800), entering a short right now is risky because the market could range sideways or deliver a sudden bullish snap before deciding its real direction.
Do you prefer to wait for a rebound up in order to catch the short, or are you watching for support to break so you can go all in to the downside?
TOUCH HERE ⬇️⬇️
If I had to assess a short right now, these would be the key points to consider:
It’s not a good idea to enter chasing the price halfway. Ideally, for a short, wait for the price to attempt a small rebound toward the resistance zone between 82,000 and 85,000 USDT and fail to break it, or wait until it strongly loses the 75,129 USDT support to confirm the breakdown.
Since the RSI is neutral and the price stays oscillating in the middle zone (around 78,800), entering a short right now is risky because the market could range sideways or deliver a sudden bullish snap before deciding its real direction.
Do you prefer to wait for a rebound up in order to catch the short, or are you watching for support to break so you can go all in to the downside?
TOUCH HERE ⬇️⬇️
Joel23:
Excelente análisis. Para aprender más.
2
1
5
949

·
--
Bullish
The pair $LSK registers a corrective move near -33%, cooling off from the highs of 0.8660 and finding a high-demand buying attention zone around 0.4860.
📊 Technical snapshot:
Price is seeking to stabilize after shaking out leveraged positions, testing critical support levels that have stopped massive selling pressure.
The bias in major accounts shows a higher bullish weight (Longs exceeding 61%), reflecting the bulls’ confidence in a technical rebound from these discounted levels.
🎯 Strategy: Patience and razor-sharp risk management. Keep a close eye on the volume’s reaction at this support to confirm a possible recovery toward the intermediate resistance levels.
Are they buying on the dip, or do they prefer to wait for greater confirmation in the order book? I’d love to read your thoughts in the comments! 📉📈
#lsk/usdt #BinanceSquareFamily #CryptoTrading. #AnalisisTecnico #futuresignal
The pair $LSK registers a corrective move near -33%, cooling off from the highs of 0.8660 and finding a high-demand buying attention zone around 0.4860.
📊 Technical snapshot:
Price is seeking to stabilize after shaking out leveraged positions, testing critical support levels that have stopped massive selling pressure.
The bias in major accounts shows a higher bullish weight (Longs exceeding 61%), reflecting the bulls’ confidence in a technical rebound from these discounted levels.
🎯 Strategy: Patience and razor-sharp risk management. Keep a close eye on the volume’s reaction at this support to confirm a possible recovery toward the intermediate resistance levels.
Are they buying on the dip, or do they prefer to wait for greater confirmation in the order book? I’d love to read your thoughts in the comments! 📉📈
#lsk/usdt #BinanceSquareFamily #CryptoTrading. #AnalisisTecnico #futuresignal
📊 Technical snapshot:
Price is seeking to stabilize after shaking out leveraged positions, testing critical support levels that have stopped massive selling pressure.
The bias in major accounts shows a higher bullish weight (Longs exceeding 61%), reflecting the bulls’ confidence in a technical rebound from these discounted levels.
🎯 Strategy: Patience and razor-sharp risk management. Keep a close eye on the volume’s reaction at this support to confirm a possible recovery toward the intermediate resistance levels.
Are they buying on the dip, or do they prefer to wait for greater confirmation in the order book? I’d love to read your thoughts in the comments! 📉📈
#lsk/usdt #BinanceSquareFamily #CryptoTrading. #AnalisisTecnico #futuresignal
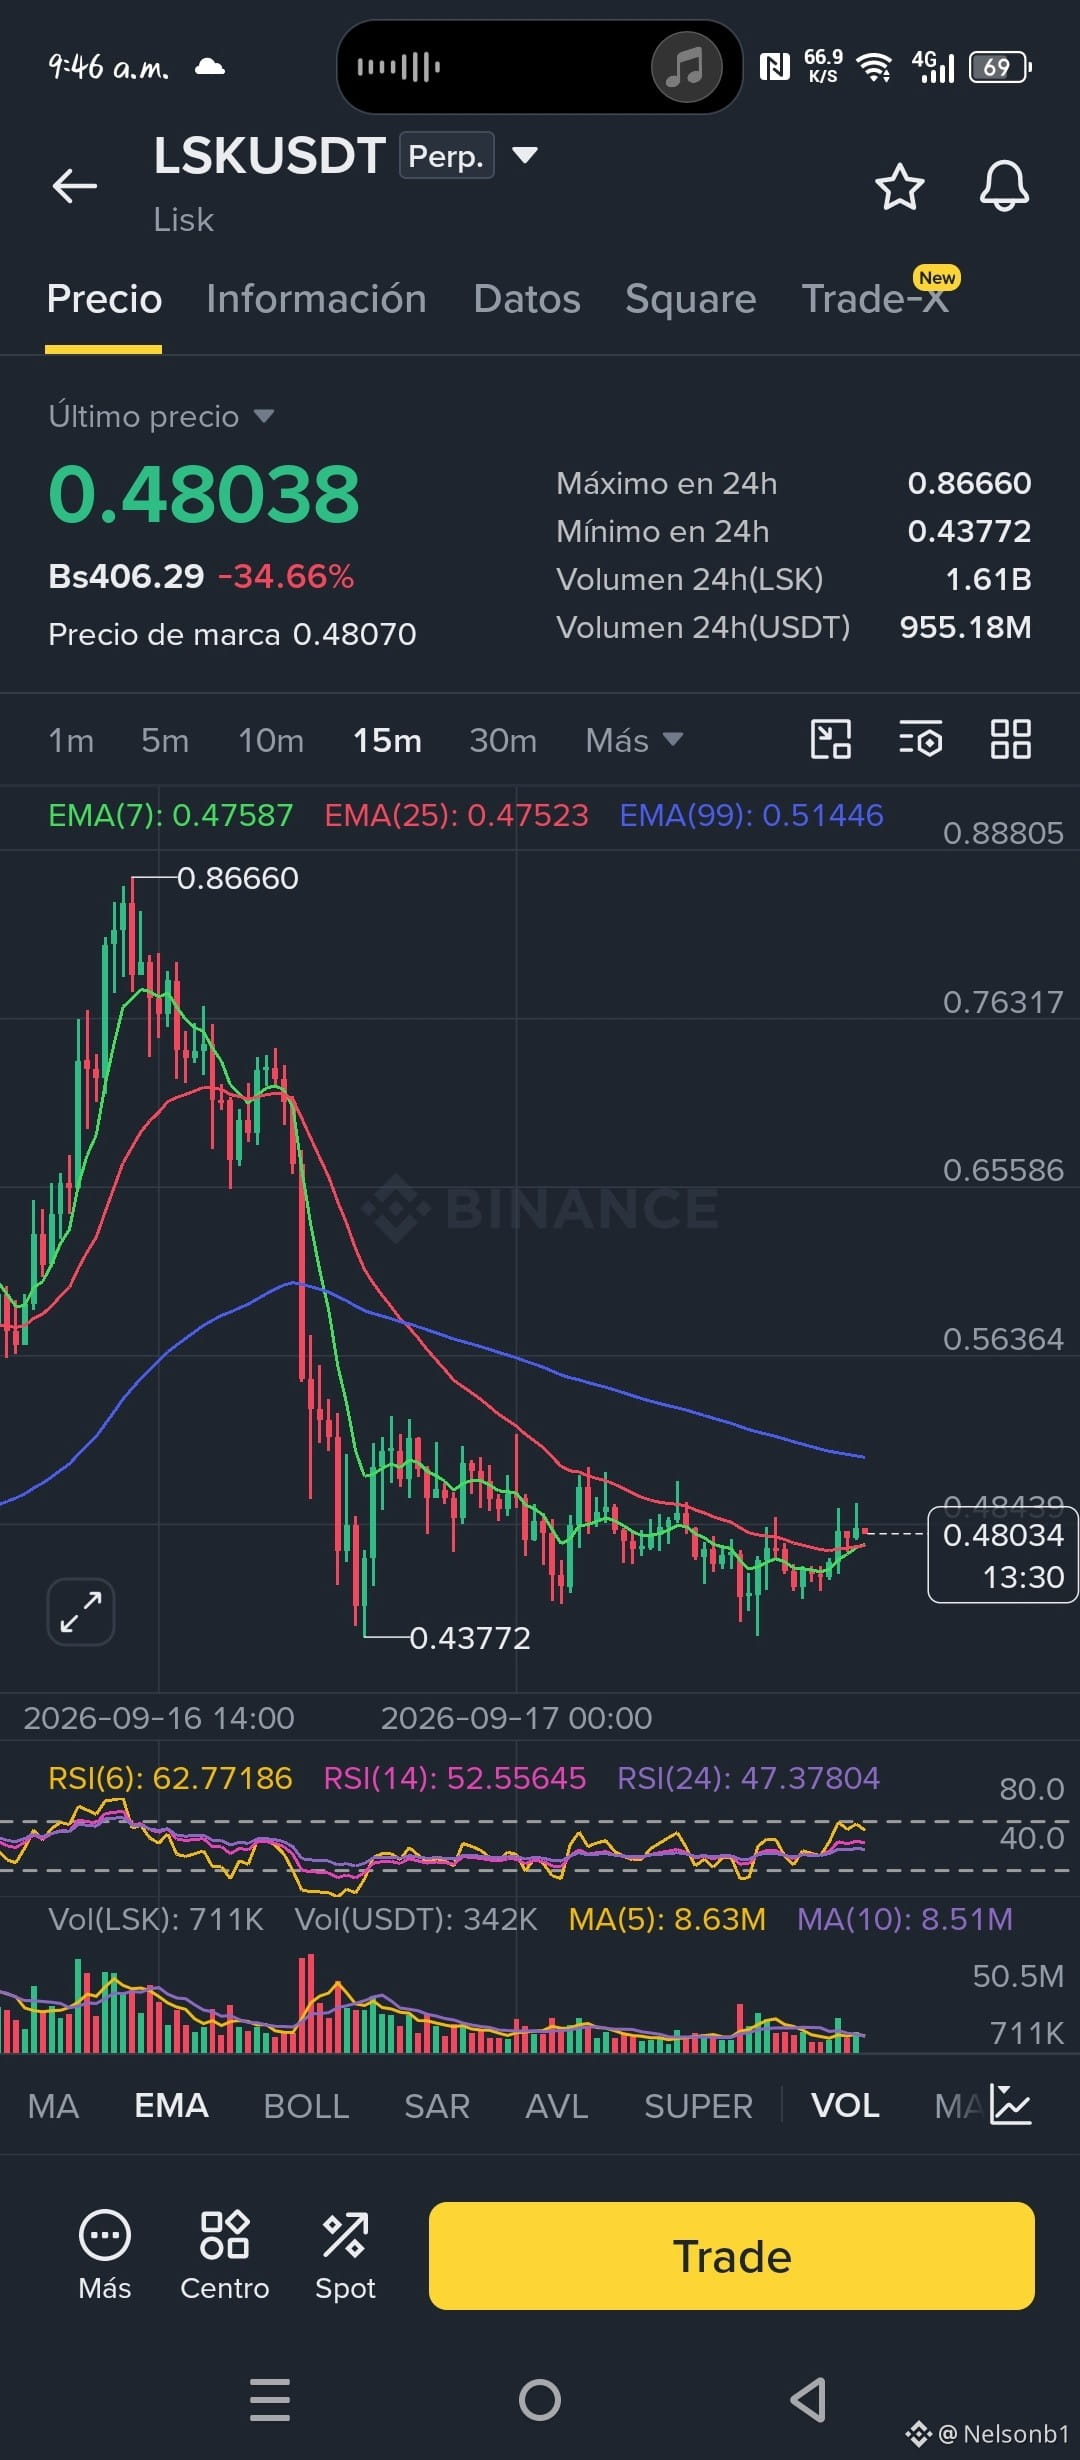
304

·
--
Bullish
⚡ What to expect from $BNB ? Key levels to watch
BNB’s price is in a very important decision zone. To avoid relying on fixed numbers that change quickly, these are the structural points we should monitor on the chart:
📍 Support: The base of the current range (a key zone that buyers must defend with volume).
🧱 Resistance: The upper trendline / immediate ceiling (a barrier to break to see bullish continuation).
💡 The market requires patience and good risk management. Watch how the price reacts at these points before taking positions.
👇 Do you see $BNB bouncing off support or breaking resistance? I’ll read your comments!
#BİNANCESQUARE #CryptoTrading #AnalisisTecnico #bnb
⚡ What to expect from $BNB ? Key levels to watch
BNB’s price is in a very important decision zone. To avoid relying on fixed numbers that change quickly, these are the structural points we should monitor on the chart:
📍 Support: The base of the current range (a key zone that buyers must defend with volume).
🧱 Resistance: The upper trendline / immediate ceiling (a barrier to break to see bullish continuation).
💡 The market requires patience and good risk management. Watch how the price reacts at these points before taking positions.
👇 Do you see $BNB bouncing off support or breaking resistance? I’ll read your comments!
#BİNANCESQUARE #CryptoTrading #AnalisisTecnico #bnb
BNB’s price is in a very important decision zone. To avoid relying on fixed numbers that change quickly, these are the structural points we should monitor on the chart:
📍 Support: The base of the current range (a key zone that buyers must defend with volume).
🧱 Resistance: The upper trendline / immediate ceiling (a barrier to break to see bullish continuation).
💡 The market requires patience and good risk management. Watch how the price reacts at these points before taking positions.
👇 Do you see $BNB bouncing off support or breaking resistance? I’ll read your comments!
#BİNANCESQUARE #CryptoTrading #AnalisisTecnico #bnb

115
Log in to explore more content
Join global crypto users on Binance Square
⚡️ Get latest and useful information about crypto.
💬 Trusted by the world’s largest crypto exchange.
👍 Discover real insights from verified creators.
Email / Phone number
Trending Topics
1
#SaylorHintsStrategyBitcoinBuy
2.2M views
11,160 Discussing
2
#BOJRaisesRatesTo31YearHigh
167,876 views
2,549 Discussing
3
#BuffettStepsDownAsBerkshireChairman
80,895 views
1,313 Discussing
4
#XRPExchangeReservesHitSevenYearLow
88,347 views
1,167 Discussing
5
#HKCompletesFirstHKDStablecoinUseCase
121,380 views
1,566 Discussing
6
#VietnamPlansFirstCryptoLicensesIn2026
75,510 views
1,090 Discussing
7
#BTCBreaks80K
455,123 views
5,287 Discussing
8
#BitcoinMarketCapTopsTesla
107,739 views
1,274 Discussing
9
#SOLJumpsAbout10%
109,191 views
1,163 Discussing
10
#EthereumReclaims$2600
9,457 views
130 Discussing