

#tra100d
tra100d
11,235 views
64 Discussing
Hot
Latest

·
--
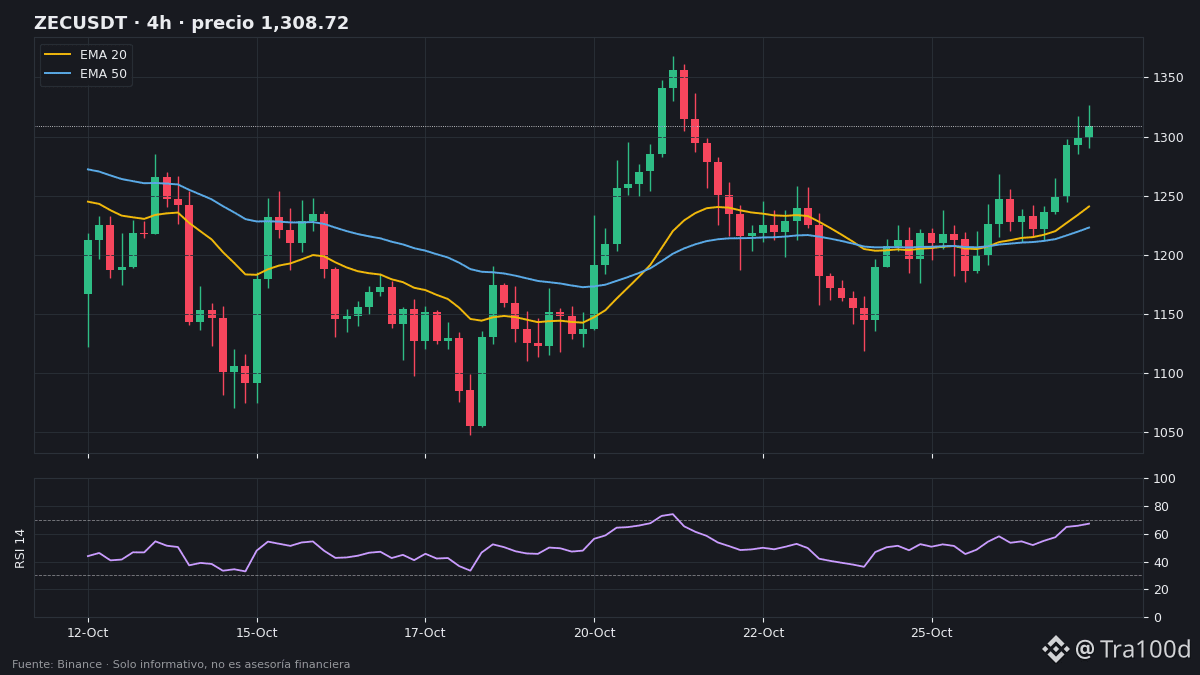
📈 $ZEC is up +6.2% over the last 6 4-hour candles: it broke above the EMA 200 and the morning range ceiling ($1.268).
📊 Context (Binance, 4 h):
• Price: ~$1.300–$1.309.
• Above the EMA 20 (~$1.241), EMA 50 (~$1.223), and EMA 200 (~$1.260), which is now the first support level.
• 20-candle high: $1.326,55, about 1.4% away.
• RSI at 67: approaching overbought territory (70).
• Relative volume 0.63: the rally is happening on lower volume than average.
• Open interest +7.4% and funding nearly neutral (+0.002%): positions are opening without euphoria.
• The daily trend remains strongly bullish (daily EMA 200 ~ $814) and daily ATR is 8.7%.
🟢 Bullish scenario: a break above $1.326,55 with volume, with the 20-day high (~$1.368) as the next reference point.
🔴 Bearish scenario: if RSI moves above 70 without volume and price loses the EMA 200 (~$1.260), a return to the EMA 20 (~$1.241).
👀 What to watch: volume on the next breakout and whether funding spikes as the price rises (a sign of euphoria).
Will ZEC break above $1.368 this week? Reply "YES" or "NO" 👇
#ZEC #Zcash #AnalisisTecnico #Cripto #Tra100d
⚠️ For informational and educational purposes only; this is not financial advice. Cryptocurrencies are volatile: do your own research and trade with caution.
111
·
--
🚨 $BTC is back above $80,000 (~$80,870) and has reclaimed the 4-hour EMA 20 (~$80,470). The 20-candle low held at $79,322.
Now resistance is close: EMA 50 (~$81,050) and the 20-candle high ($81,271). The 4-hour RSI is at 54 and open interest is down 0.8%: the rebound isn’t driven by new leverage.
Will it reclaim $81,300 this week? Reply “YES” or “NO” 👇
#BTC #Bitcoin #Cripto #Tra100d
⚠️ For informational and educational purposes only; this is not financial advice. Cryptocurrencies are volatile: do your own research and trade with caution.
59
·
--
📚 BTC, ETH, and SOL are in a “strong downtrend” today… and in an “uptrend” at the same time. Neither one is wrong.
🔍 The concept: each time frame (4 h, daily, weekly) tells a different story. The 4 h chart shows what happened over the last few days; the daily chart shows what happened over the last few months.
📊 Example using today’s data (Binance):
• $BTC on the 4 h chart: ~$79,800, below its 20, 50, and 200 EMAs ($80,430 / $81,140 / $81,750) → strong downtrend.
• $BTC on the daily chart: well above its daily 200 EMA (~$74,230) → the broader trend is still bullish/ranging.
• $ETH: same story. Bearish on the 4 h chart, but still above its 200 EMA on the daily chart (~$2,226).
• $SOL: bearish on the 4 h chart; above its 200 EMA on the daily chart (~$93).
📌 Quick read:
• The higher time frame sets the broader direction.
• The lower time frame shows the current momentum (whether there’s pressure right now).
• When they contradict each other, it’s usually a correction within a larger trend… until the higher time frame changes too.
❌ Common mistake: looking only at the 15-minute or 1-hour chart and thinking “the market is crashing,” or looking only at the daily chart and ignoring short-term selling pressure.
✅ In one line: look at the daily chart first to see where you are, then the 4 h chart to know when.
Which time frame do you look at first? Reply “4H” or “DAILY” 👇
#AnalisisTecnico #AprendeCripto #BTC #Trading #Tra100d
⚠️ For informational and educational purposes only; this is not financial advice. Cryptocurrencies are volatile: do your own research and trade with caution.
74
·
--
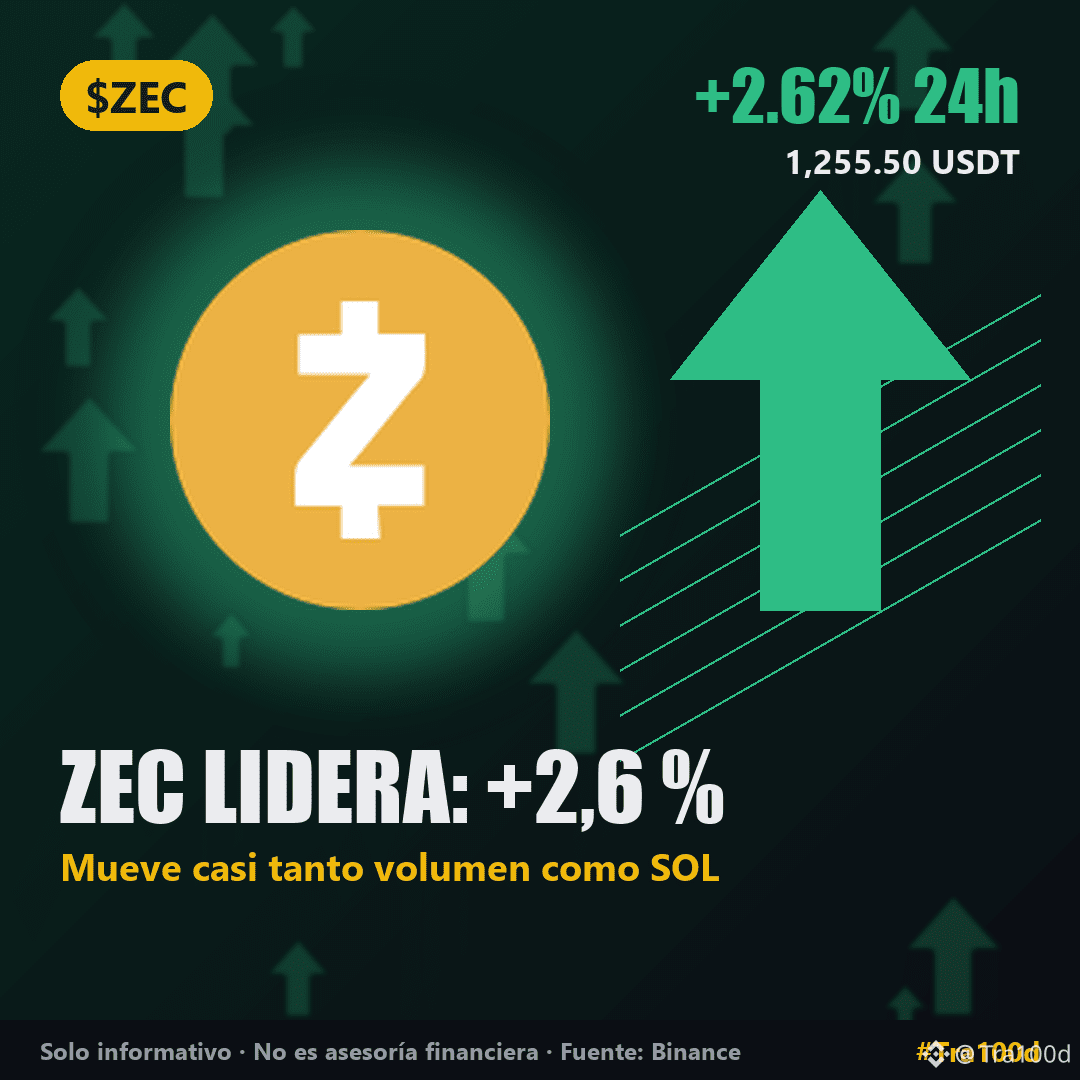
🗞️ Tuesday is slightly in the red… and a privacy coin is moving almost as much money as Solana.
1️⃣ $ZEC is the biggest gainer of the day: +2.6% (~$1,255) with $162M traded, practically the same as $SOL ($163M), which is down 1% and is battling to hold $100.
2️⃣ $QNT gives back some of yesterday’s +20%: −3.6% (~$204). Its open interest is up +8.4% and funding is negative (−0.02%): new positions are coming in, many betting on a decline.
3️⃣ BTC (−0.4%, ~$79,900) and ETH (−0.4%, ~$2,316) remain weak. The Fear and Greed Index falls from 50 to 48: neutral, but leaning toward fear.
Why does it matter? When a mid-cap coin sees the same trading volume as a top-10 coin, it’s on the market’s radar. And QNT shows the other side: after a sharp rise, traders start betting on a correction. (Our data has no confirmed news explaining either move.)
Which one will you be watching today? Reply “ZEC” or “QNT” 👇
#ZEC #SOL #QNT #Altcoins #Tra100d
⚠️ For informational and educational purposes only; this is not financial advice. Cryptocurrencies are volatile: do your own research and trade with caution.
188
·
--
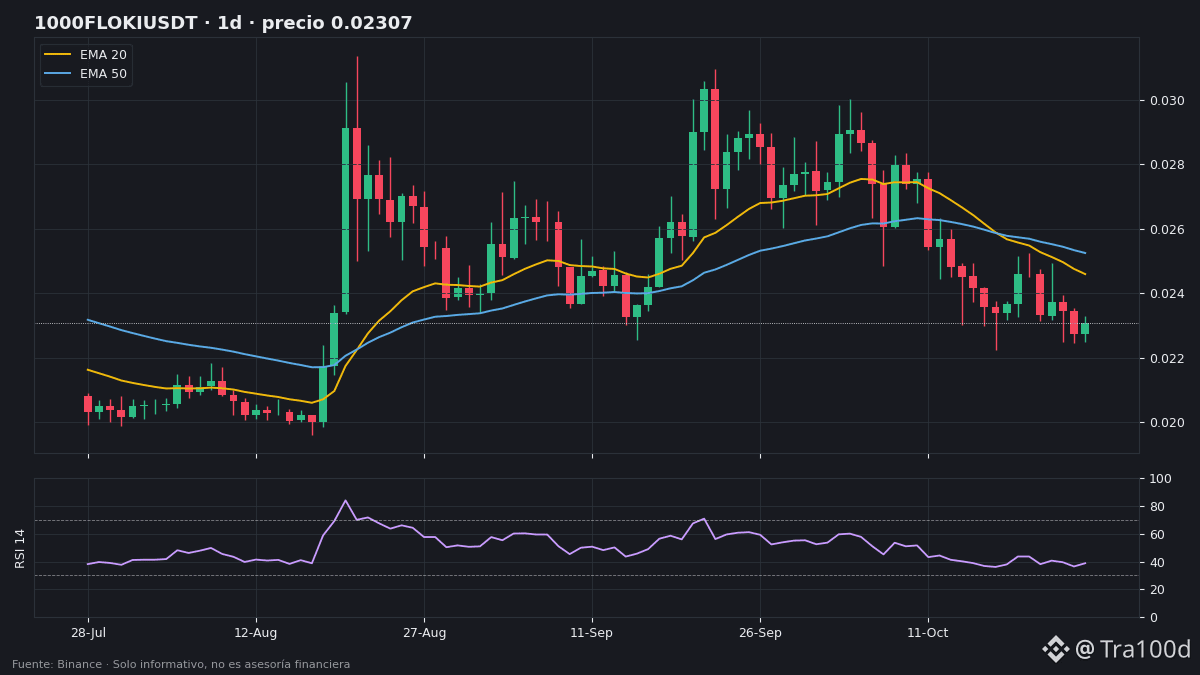
🐕🦺 Of the 6 memes we follow, only one has shorts paying: $FLOKI .
📊 The data (Binance, 07:14):
• Spot price: ~0.0000227 $ (−0.1 % in 24 h), with 0.7 M$ traded.
• Funding −0.003 %: it is the only meme in negative territory (DOGE, PEPE, SHIB, BONK and WIF are positive).
• Open interest +3.5 %: new positions are coming in while funding is negative → bearish bets are piling up.
• Strong daily downtrend: price below its 20, 50 and 200 EMA. Daily RSI at 39.
• It is down −6.2 % in 6 days and is ~2 % above the 20-day low (~0.0000222 $).
⚠️ Note: its daily ATR is 6.6 %. For FLOKI, moving ±6–7 % in a day is normal, in both directions. And when many shorts pile up, sharp moves can go either way.
Question for the Viking pack 🛡️: Will FLOKI hold the 20-day low this week? Reply only "YES" or "NO" 👇
#floki #Memecoins #DOGE #Cripto #Tra100d
⚠️ Informational and educational content only, not financial advice. Cryptocurrencies are volatile: do your own research and trade with caution.
52
·
--
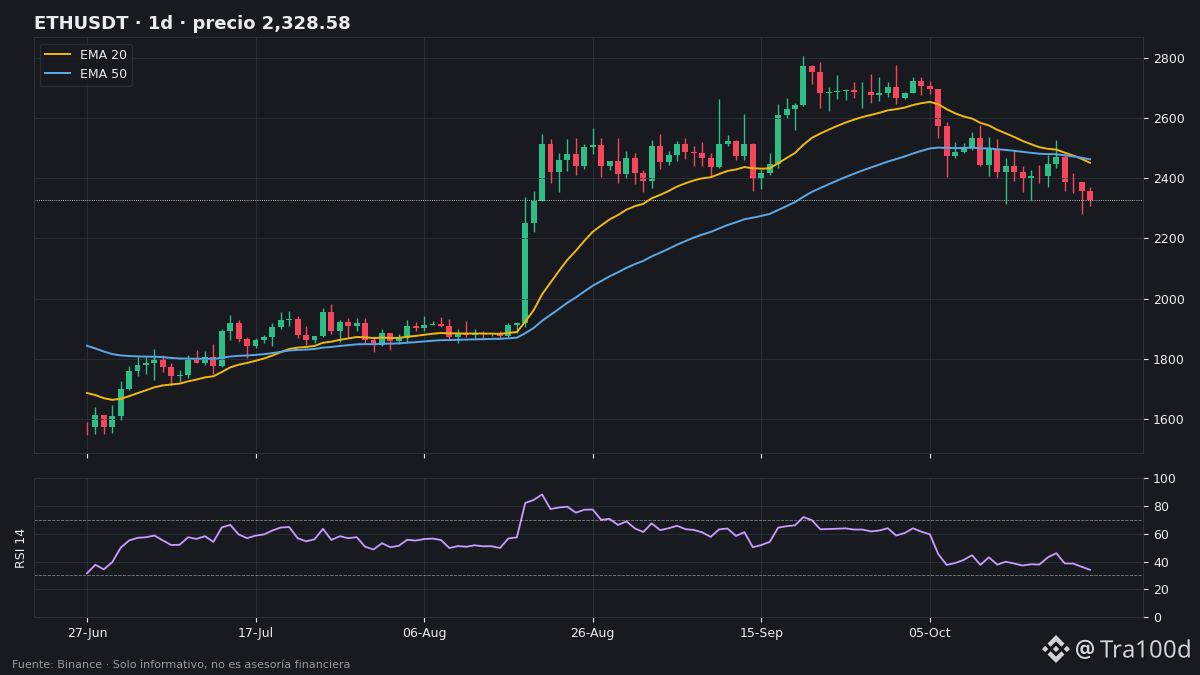
📉 $ETH is down 3.3% over 6 days, and its daily RSI has fallen to 34, near the oversold zone (30).
📊 Context (Binance, daily):
• Price: ~$2,330.
• Below the 20 EMA (~$2,452) and the 50 EMA (~$2,463), but still above the 200 EMA (~$2,224), the key long-term trend line.
• 20-day range: $2,281–$2,725. The price is ~2% from the bottom.
• Daily ATR: $94 (4%). A move of ±$94 in a day is typical.
• Open interest +2% and funding +0.006%: positions are coming in, but there’s no euphoria.
🟢 Bullish scenario: a bounce from the $2,281 zone and a daily close back above the 20 EMA (~$2,452).
🔴 Bearish scenario: a daily close below $2,281 opens the door toward the 200 EMA (~$2,224).
👀 What to watch: whether the RSI breaks below 30 and whether $2,281 holds on a daily close.
Where do you see ETH on Friday? Reply “2,200” or “2,450” 👇
#ETH #Ethereum #AnalisisTecnico #Cripto #Tra100d
⚠️ For informational and educational purposes only; this is not financial advice. Cryptocurrencies are volatile: do your own research and trade with caution.
66
·
--
🚨 $BTC at ~$80,330, just 1.4% above the low of the last 20 4-hour candles: $79,179.
On the 4-hour chart, it’s below its 20, 50, and 200 EMAs ($80,750 / $81,440 / $82,070), and the RSI is at 38. The first resistance level to reclaim is the 20 EMA (~$80,750).
Will $79,000 hold today? Reply “YES” or “NO” 👇
#BTC #Bitcoin #Cripto #Tra100d
⚠️ For informational and educational purposes only; this is not financial advice. Cryptocurrencies are volatile: do your own research and trade with caution.
120
·
--
📚 Two coins went up today. One had new money behind it and the other didn’t. How can you tell? By looking at open interest.
🔍 The concept: open interest (OI) is the number of futures contracts that are still open. If it rises, new positions are being opened; if it falls, positions are being closed.
📊 Example using today’s data (Binance):
• $ENA : price +6.8% and OI +12.3% → new money is coming in alongside the rise.
• $QNT : price +20.5% and OI −7.5% → the rise coincides with positions being closed (shorts covering or people taking profits).
• $WLD : price −1.7%, OI +5.9% and negative funding (−0.014%) → positions are being opened as the price falls, with shorts paying.
📌 Quick guide:
• Price ↑ + OI ↑ → a trend with fresh fuel.
• Price ↑ + OI ↓ → a rise driven by positions closing; it may lose momentum once they run out.
• Price ↓ + OI ↑ → bets are building up, often short positions.
❌ Common mistake: thinking high OI = bullish. OI doesn’t indicate direction, only how many people are betting. You need to look at it alongside price and funding.
✅ In a nutshell: price tells you what happened; open interest tells you whether there’s new money behind it.
Did you already check open interest before trading? Reply “YES” or “NO” 👇
#Futuros #InteresAbierto #AprendeCripto #Trading #Tra100d
⚠️ For informational and educational purposes only; this is not financial advice. Cryptocurrencies are volatile: do your own research and trade with caution.
1
181
·
--
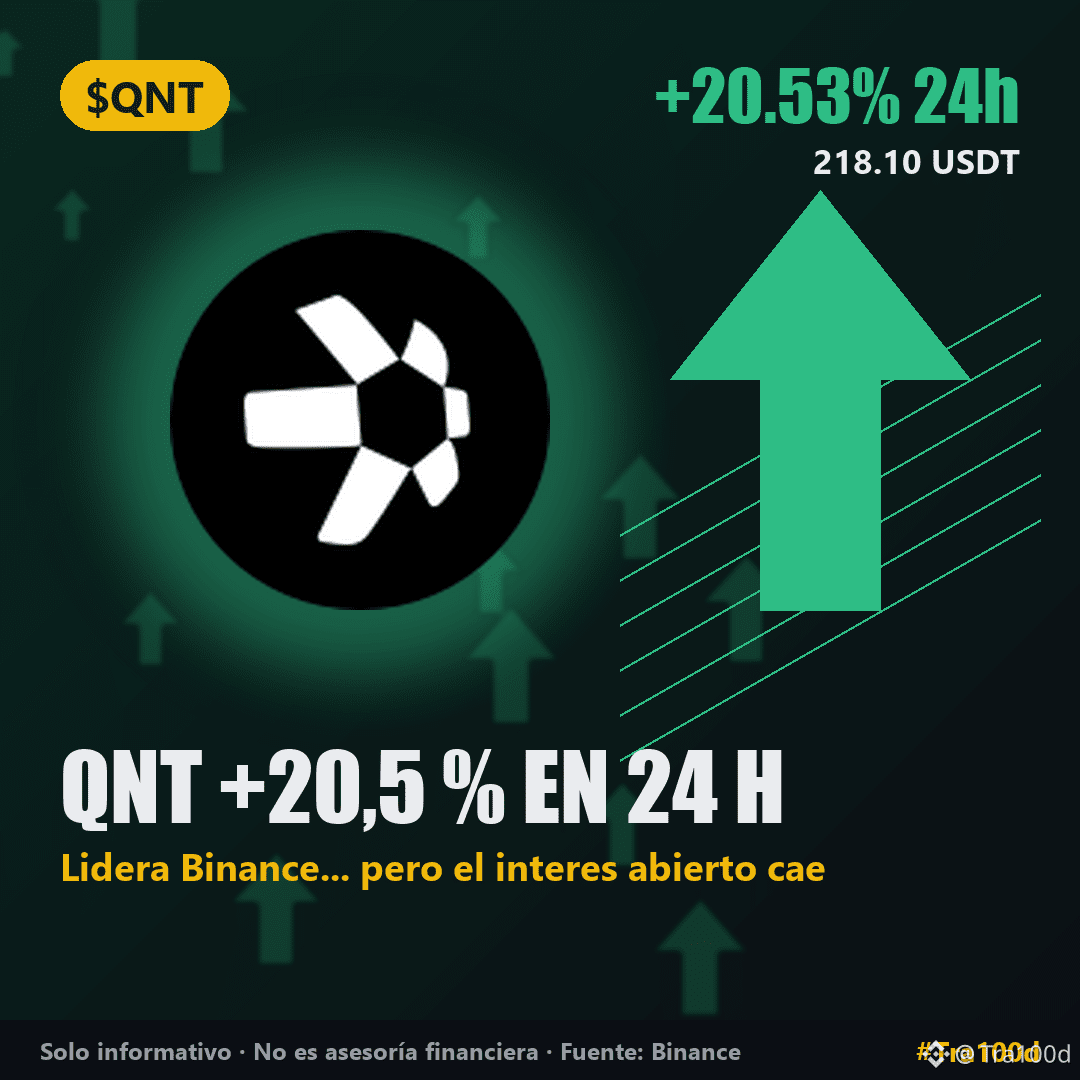
🗞️ A quiet Monday for the majors… except for one coin that surged +20%.
1️⃣ $QNT is the biggest gainer of the day: +20.5% (~$218) on $23.1M in trading volume. Curiously, its futures open interest **fell** by 7.5%. The price is rising, but positions are being closed.
2️⃣ $ENA is up +6.8% (~$0.205) on $42M in volume, and its open interest grew by +12.3%: here, new money is indeed flowing into futures.
3️⃣ BTC (−0.07%, ~$80,360) and ETH (−0.02%, ~$2,331) are practically unchanged. The Fear and Greed Index fell from 54 to 50: firmly neutral.
Why does it matter? Two gains, two different stories. When the price rises while open interest falls, it usually means short positions are being closed or profits are being taken; when both rise, new positions are behind the move. (Our data shows no confirmed news explaining QNT's jump.)
Which of the two gains seems more solid to you? Reply "QNT" or "ENA" 👇
#QNT #ENA #Altcoins #Cripto #Tra100d
⚠️ For informational and educational purposes only; this is not financial advice. Cryptocurrencies are volatile: do your research and trade with caution.
101
·
--
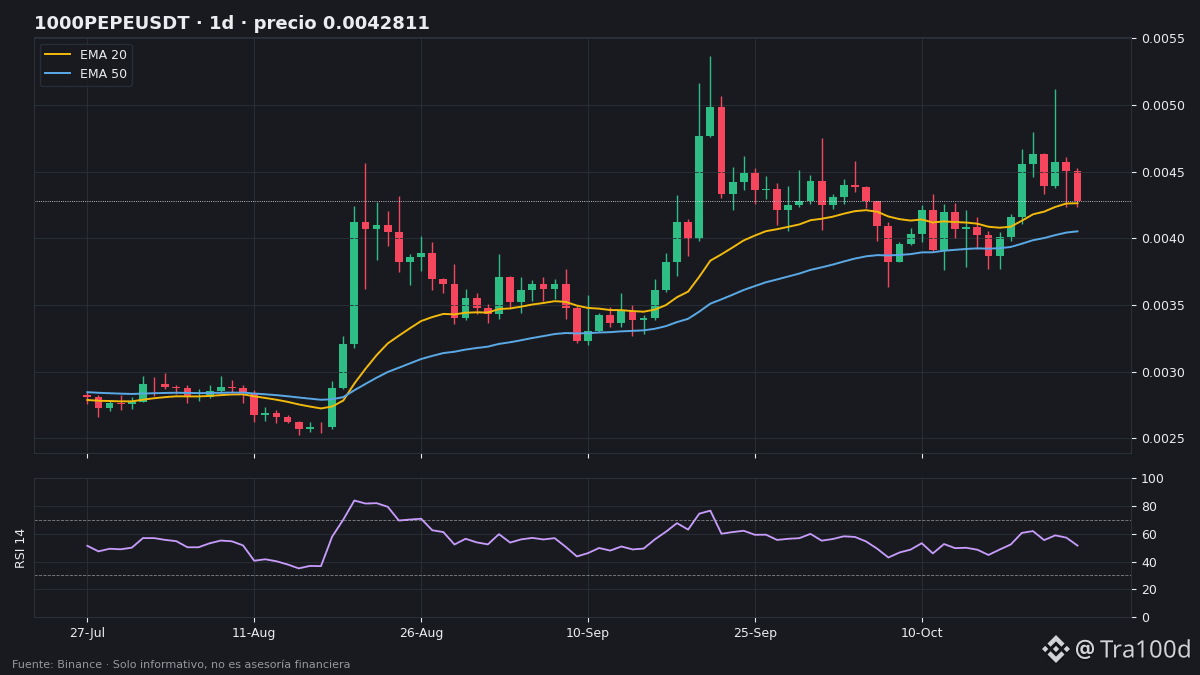
🐸 Today the frog is moving more money than the dog: $PEPE traded $24.8M in spot volume, beating $DOGE ($22.5M).
📊 The data (Binance, 08:40):
• Spot price: ~$0.00000435 (−2.2% in 24 hours).
• It’s the only one of the 6 meme coins we track with a bullish daily trend: the price remains above its daily 20, 50, and 200 EMAs.
• DOGE, SHIB, BONK, and FLOKI are in a strong downtrend; WIF is down 10.9% in 6 days.
• Daily RSI at 53: neither overbought nor oversold.
• Funding at +0.01% and open interest down 2.2%: some traders are closing positions, not opening new ones.
• 20-day high: ~$0.00000512 (≈18% above the current price).
⚠️ Keep in mind: its daily ATR is 7.9%. A move of ±8% in a day is normal for PEPE, in either direction.
Quick question for the frog community 🐸: Will PEPE return to its 20-day high this month? Reply only “YES” or “NO” 👇
#PEPE #Memecoins #DOGE #Cripto #Tra100d
⚠️ For informational and educational purposes only; not financial advice. Cryptocurrencies are volatile: do your research and trade with caution.
69
·
--
🚨 $ETH falls −0.9% (~$2,335), putting it ~2.3% above the 20-day low of $2,281.
Daily RSI is at 34, and open interest is up +1.2% while the price falls → new leveraged positions are entering near support.
If it loses $2,281, the next key level is the 200-day EMA (~$2,224).
Will $2,281 hold this week? Yes or no 👇
#Ethereum #ETH #Cripto #Tra100d
⚠️ For informational and educational purposes only; this is not financial advice. Cryptocurrencies are volatile: do your own research and trade with caution.
475
·
--
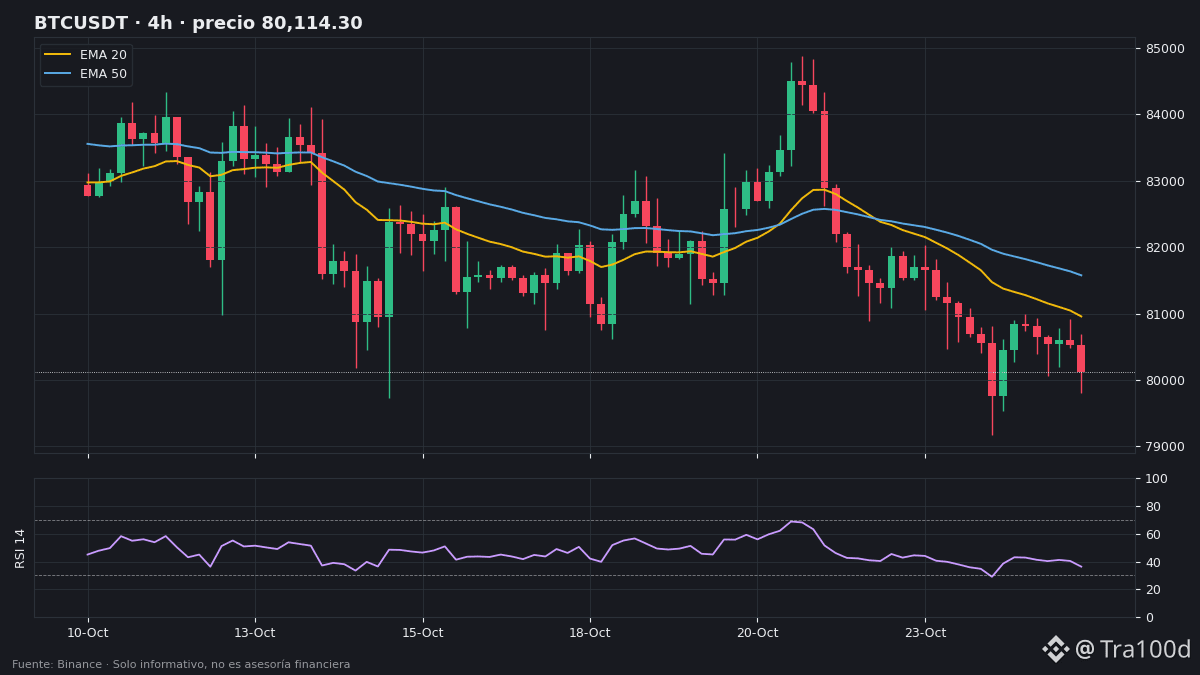
₿ Yesterday $BTC recovered the daily 50 EMA. Today it closed below it: $80,114 (−0.8% in 24 h).
📌 Context: Sunday had low volume (52% of the usual daily volume), but the last 4-hour candle closed red and with greater strength (118%). Weekend moves are often confirmed or invalidated when Monday trading begins.
📊 Key levels (Binance):
• Daily 50 EMA: $80,787 → the first resistance to reclaim.
• 4-hour EMA zone: $80,958 (EMA 20) – $82,154 (EMA 200).
• Support: $79,179, the 20-day low it swept yesterday.
• Major resistance: $86,665 (20-day high).
• 4-hour RSI: 36 → weak, near oversold (30) but not quite there.
• Funding +0.002% and open interest −1.6% → leveraged positions are closing: the market is reducing risk.
🟢 Bullish scenario: reclaims $80,787 on a daily close, then tests the $81,000–$82,150 zone.
🔴 Bearish scenario: loses $79,179 and yesterday’s sweep becomes a breakdown.
👀 What to watch: Monday’s volume and whether the price holds above $79,179.
Will Monday reclaim $80,787 or go looking for $79,179? Vote in the comments: “up” or “down” 👇
#Bitcoin #BTC #AnalisisTecnico #Cripto #Tra100d
⚠️ For informational and educational purposes only; not financial advice. Cryptocurrencies are volatile: do your own research and trade with caution.
102
·
--
🎓 Today $BTC is “strongly bearish”… and also “bullish.” Both are true. Let me explain why.
📌 The concept: the trend always depends on the timeframe (the size of each candle). The same coin can fall on 4-hour candles and still be bullish on daily candles.
📊 Example using today's data (Binance):
• 4-hour chart: price ~ $80,650, below the 20 EMA ($81,218), the 50 EMA ($81,774), and the 200 EMA ($82,076) → short-term bearish trend.
• Daily chart: the 200 EMA is at $73,981, well below the price → the broader trend remains bullish or range-bound.
❌ Common mistake: seeing “BTC is bearish” on a 4-hour chart and making a decision meant to last months (or vice versa). Short-term traders look at 1-hour–4-hour charts; long-term investors look at the daily or weekly chart.
✅ Summary: before you say “up” or “down,” specify the timeframe.
What timeframe do you use to look at the chart: 15 min, 4 hours, daily, or weekly? Let us know in the comments 👇
#Bitcoin #AnalisisTecnico #Trading #AprendeCripto #Tra100d
⚠️ For informational and educational purposes only; this is not financial advice. Cryptocurrencies are volatile: do your own research and trade with caution.
60
·
--
🗞️ A quiet, green Sunday for the big players… with two exceptions.
1️⃣ $ZEC is the biggest gainer among the top 10 by volume: +5.5% (~$1,208) with $114M traded, more than SOL and XRP. Only BTC and ETH see more money move.
2️⃣ BMT, which was up +50% yesterday, is down −19.4% today (~$0.0299). Its funding rate went from −1.40% to −0.01%: short sellers betting on a price drop are now paying almost nothing.
3️⃣ $BTC is up +1.1% (~$80,640) and ETH is up +1.7% (~$2,344). The Fear and Greed Index has risen to 54: still neutral.
Why does it matter? Gains of +50% in a day rarely hold steady: BMT is a real-time reminder. ZEC, on the other hand, is rising on high volume.
Tell me: which one would you keep an eye on this week, ZEC or BMT? 👇
#ZEC #BMT #Altcoins #Cripto #Tra100d
⚠️ For informational and educational purposes only; this is not financial advice. Cryptocurrencies are volatile: do your research and trade with caution.
173
·
--
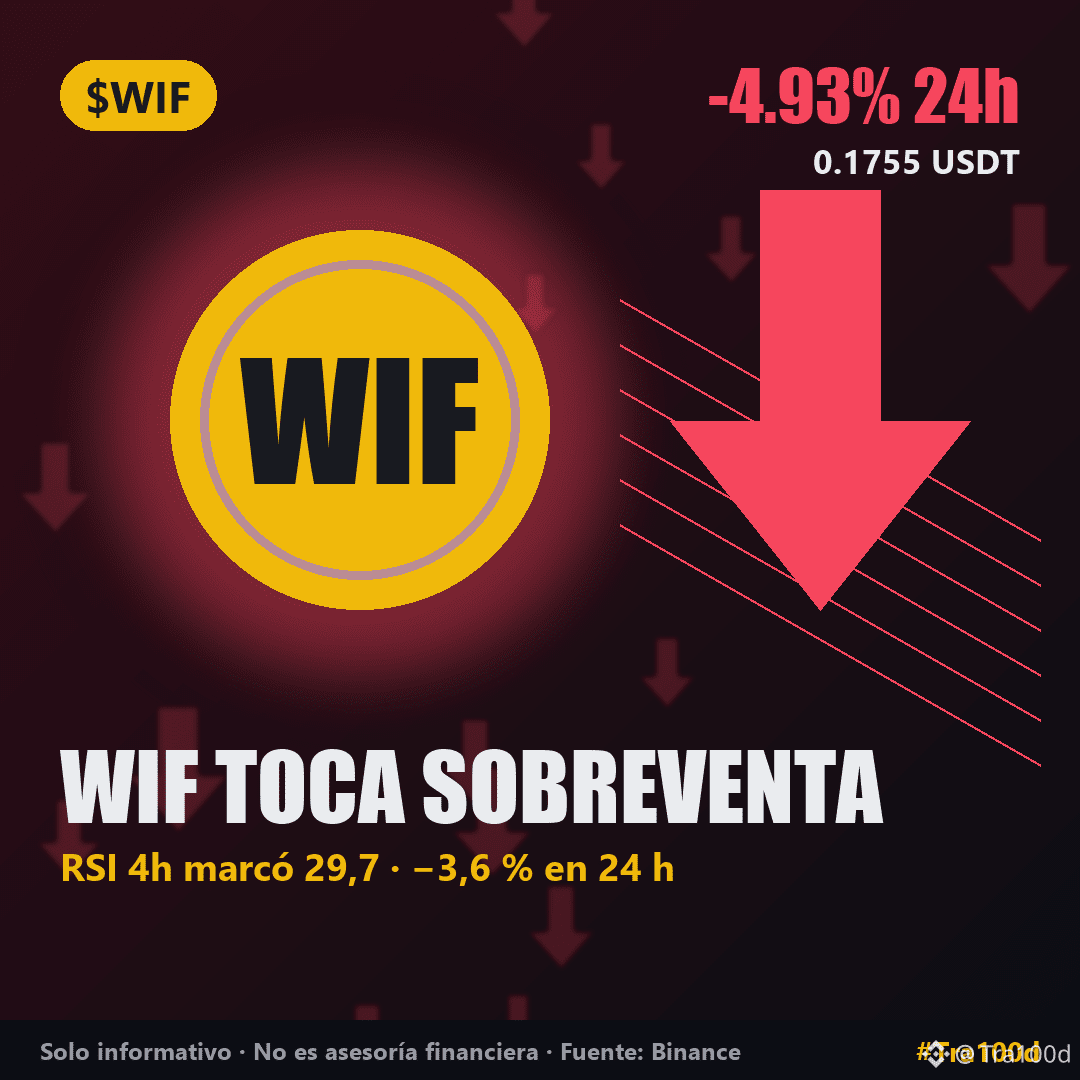
🐶 The dog with a hat has entered oversold territory: early this morning, its 4-hour RSI hit 29.7, the lowest among the meme coins we track.
📊 Data (Binance, 08:10):
• Spot price: ~$0.1779 (−3.6% in 24 h), still the worst performer among the meme coins.
• It’s battling the 20-candle 4-hour low ($0.1775): it fell below it early this morning and is now just above it. It’s down −6.4% over 6 days, and its recent daily high was $0.264.
• It remains below its 4-hour EMAs and the daily 20 EMA (~$0.207).
• Funding +0.005% (nearly neutral) and open interest −0.3% → no strong new bets are coming in, either for or against it.
⚠️ Keep in mind: oversold doesn’t mean “a bounce is guaranteed.” Its daily ATR is 8.5%: moves of ±8% in a day are normal for WIF.
Other meme coins: $PEPE is the only one in the green (+1.4%); DOGE −1.1%, SHIB −1.0%, BONK −1.3%, and FLOKI −2.0%.
A direct question for the community $WIF : do you see this as an opportunity or a trap? Reply “bounce” or “more downside” 👇
#WIF #Memecoins #Solana #Cripto #Tra100d
⚠️ For informational and educational purposes only; this is not financial advice. Cryptocurrencies are volatile: do your own research and trade with caution.
76
·
--
🚨 This morning we warned: $SOL was less than 2% away from $100. Today it lost that level: it touched $98.62 (a new 20-day low)… and rebounded to around $102.3 (−0.3% in 24 hours).
The 4-hour EMA 20 is now right above it (~$103.15). The other 4-hour EMAs are higher: the 50 at ~$104.5 and the 200 at ~$107.7. The 4-hour RSI is climbing to 43; funding is at +0.007% (neutral), and open interest is up 1% on the day.
🔎 Key levels: if it recovers ~$103.15, the rebound gains strength. If it falls below $100 again, today’s low ($98.62) is the level to watch.
Was that a stop sweep or just a pause in the decline? 👇
#Solana #SOL #Cripto #Tra100d
⚠️ For informational and educational purposes only; this is not financial advice. Cryptocurrencies are volatile: do your own research and trade with caution.
633
·
--
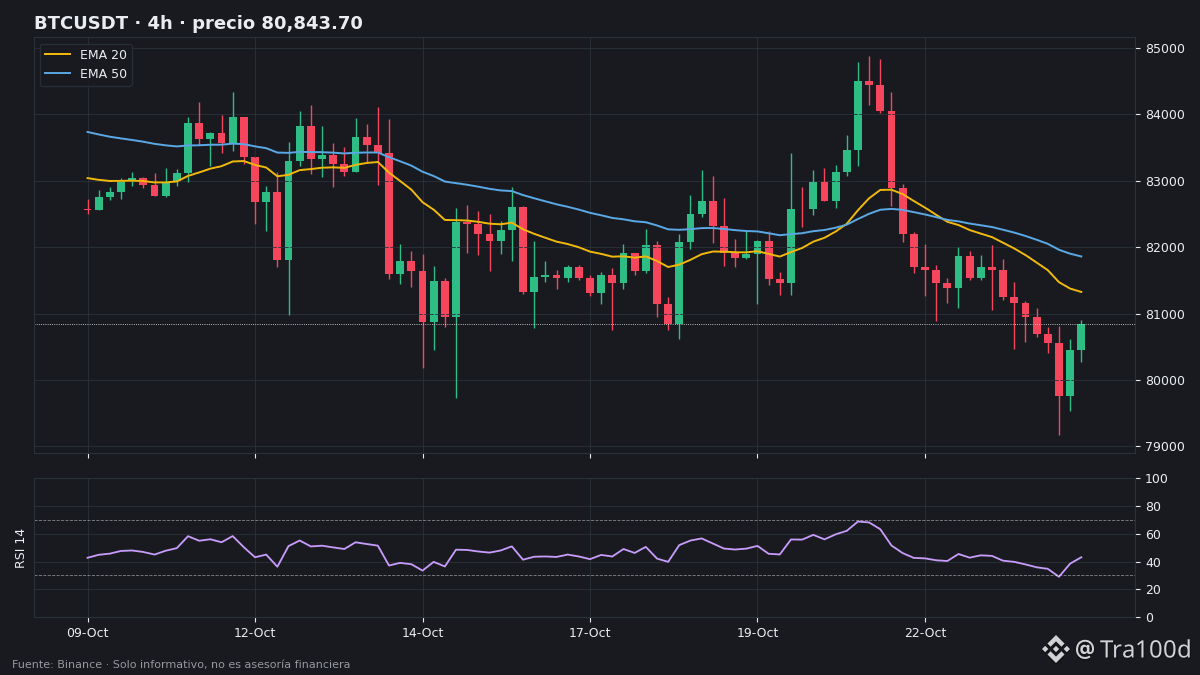
📊 Wick and rebound: $BTC dropped to $79,220 (a new 20-day low), but the daily candle closed at ~$80,890, just above the daily 50 EMA (~$80,810). It’s now trading at ~$80,800 (−0.4% in 24h).
The 4-hour EMA 20/50/200 cluster ($81,310–$81,960) remains resistance. The 4-hour RSI is rising from 36 to 42: momentum is recovering somewhat, but there’s no reversal signal yet.
🔎 Levels I’m watching:
• Resistance: $81,310–$81,960 (4-hour EMAs).
• Support: ~$80,810 (daily 50 EMA) and $79,220 (today’s low).
• Funding +0.009% (neutral) and open interest +2% on the day → new positions came in during the wick.
📈 Bullish scenario: a 4-hour candle closes above $81,960 → price breaks above the EMA ceiling and is no longer in a short-term downtrend.
📉 Bearish scenario: price loses the daily 50 EMA → $79,220 becomes the level to watch again.
What to watch: was today’s wick a stop hunt or the first warning sign? What do you see? 👇
#Bitcoin #BTC #AnálisisTécnico #Cripto #Tra100d
⚠️ For informational and educational purposes only; this is not financial advice. Cryptocurrencies are volatile: do your own research and trade with caution.
111
·
--
🎓 $BMT is up +50%, and yet its funding is at −1.40%. How do you explain that? With the funding rate.
📌 The concept: in perpetual futures, longs and shorts pay each other periodically so the contract price doesn’t drift away from the spot price.
• Positive funding → longs pay shorts (there are more bullish bets).
• Negative funding → shorts pay longs (there are more bearish bets).
📊 Example using today’s data (Binance):
• $BTC: +0.003% → almost neutral.
• PEPE: +0.01% → the standard rate.
• BMT: −1.40% → about 140 times the standard rate, on the negative side. Anyone holding a short pays that percentage of their position at each funding payment.
❌ Common mistake: “Very negative funding = it’s definitely going to rise.” It can trigger forced short liquidations, but funding can also stay negative while the price continues to fall. It’s a positioning signal, not a prediction.
✅ In a nutshell: funding tells you which side the crowd is on and how much it costs to stay there.
#FundingRate #Futuros #BMT #Cripto #Tra100d
⚠️ For informational and educational purposes only; this is not financial advice. Cryptocurrencies are volatile: do your own research and trade with caution.
75
·
--
🗞️ Market in the red… except for one: $BMT is up +50.8% in 24 hours, making it the biggest gainer on Binance.
1️⃣ BMT: ~$0.0358 with $45M in volume; its futures funding rate is −1.40% (extremely negative), and open interest is down −7.5%.
2️⃣ $BTC is down −1.3% (~$80,680) and ETH is down −1.2%: the big players aren't joining in.
3️⃣ Biggest losers: $WLD , down −12.5%, and NEAR, down −7.5%; both have over $80M in volume.
Why does it matter? A 50% gain with such negative funding indicates that futures traders are predominantly betting against it. Its 4-hour ATR is 11%: for BMT, a move like that can happen in a single candle, in either direction.
The Fear and Greed Index remains neutral (51).
Are you jumping on these rockets or watching from a distance? 👇
#BMT #Altcoins #Bitcoin #Cripto #Tra100d
⚠️ For informational and educational purposes only; this is not financial advice. Cryptocurrencies are volatile: do your own research and trade with caution.
70
·
--
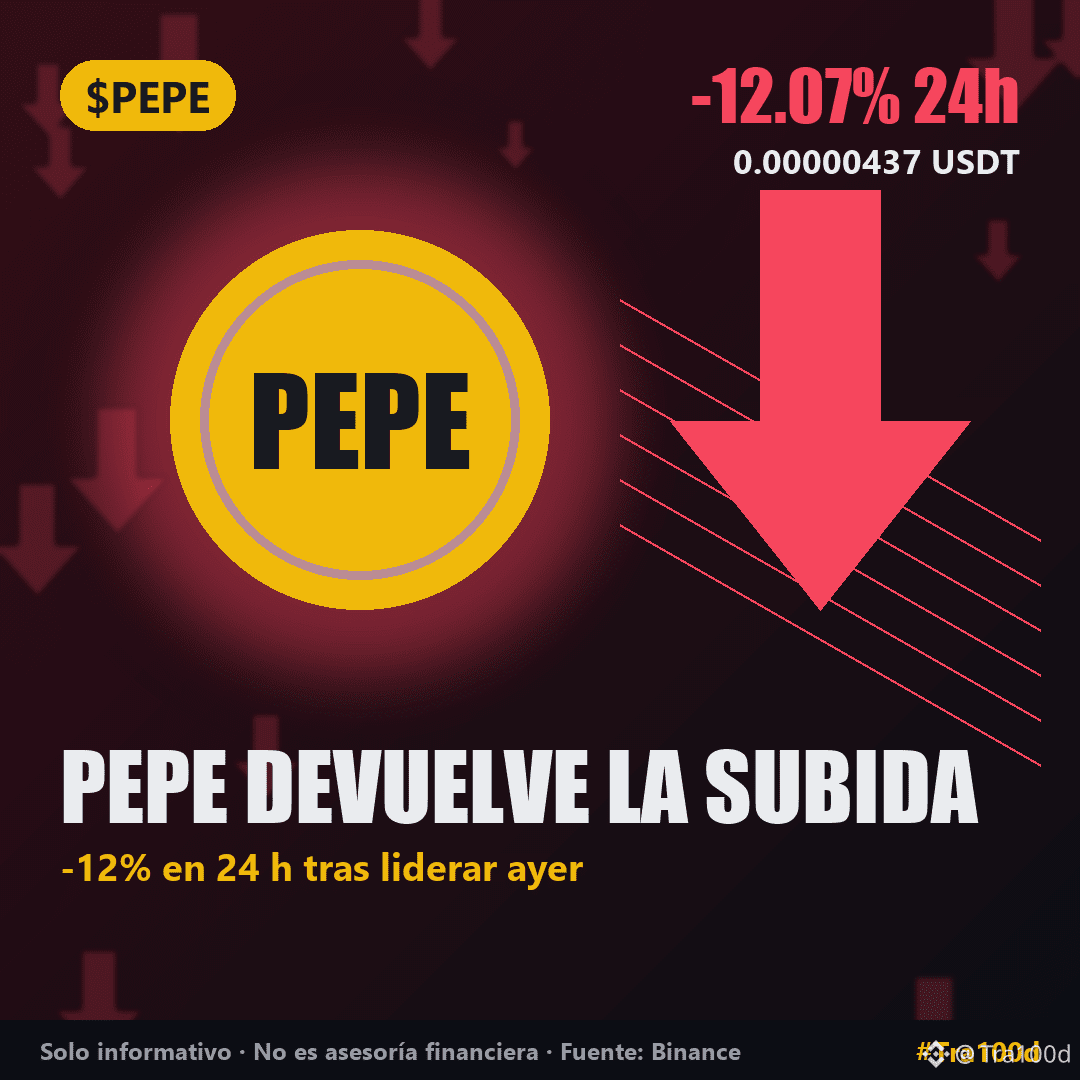
🐸 Yesterday it was leading with +12.9%. Today $PEPE is down −12.9% and trading at around $0.00000440.
Yesterday we warned you: its daily ATR was around 7%, so a sharp pullback was within the "normal" range. And it came.
📊 The data (Binance):
• 24h spot volume: $80M, still above yesterday’s $74M: the drop isn’t due to a lack of activity.
• Recent high around $0.0000051; today it fell below the 4h EMA 20, but remains above the 4h EMA 50 and the daily EMA 20.
• It’s still up +18% over 6 days.
• Funding +0.01% (standard) and open interest +4.3% → new positions are opening in the middle of the drop.
All the meme coins on the list are in the red: $DOGE −3.3%, SHIB −3.7%, FLOKI −4.2%, BONK −7.8%, WIF −7.9%, and PEPE −12.9%.
Healthy correction, or is the frog party over? 🐸👇
#PEPE #Memecoins #Cripto #Tra100d
⚠️ For informational and educational purposes only; this is not financial advice. Cryptocurrencies are volatile: do your own research and trade with caution.
492
Log in to explore more content
Join global crypto users on Binance Square
⚡️ Get latest and useful information about crypto.
💬 Trusted by the world’s largest crypto exchange.
👍 Discover real insights from verified creators.
Email / Phone number
Trending Topics
1
#CanMicrosoftDeliverOnAI
173,111 views
1,367 Discussing
2
#CanGoogleDefindItsCore
87,599 views
981 Discussing
3
#FOMCWatch
9.2M views
28,641 Discussing
4
#USGovSellsFTXLinkedAnthropicSharesFor$627M
150 views
13 Discussing
5
#SKHynixUnveils$45BShareholderReturns
465 views
16 Discussing
6
#OSMOPlansToBurn100MTokensFromCommunityPool
6,659 views
205 Discussing
7
#EthereumDropsBelow$2300
12,874 views
167 Discussing
8
#BitcoinSlipsBelow$80KAgain
36,748 views
138 Discussing
9
#ThailandLaunchesWORPTStablecoinToQRPaymentApp
83,770 views
1,002 Discussing
10
#StrategySkipsBitcoinPurchasesSpends$205MOnSTRCBuybacks
14,828 views
103 Discussing