
Tra100d
160 Posts

Tra100d
Report
Block User
3 Following
51 Followers
55 Liked
Posts
·
--
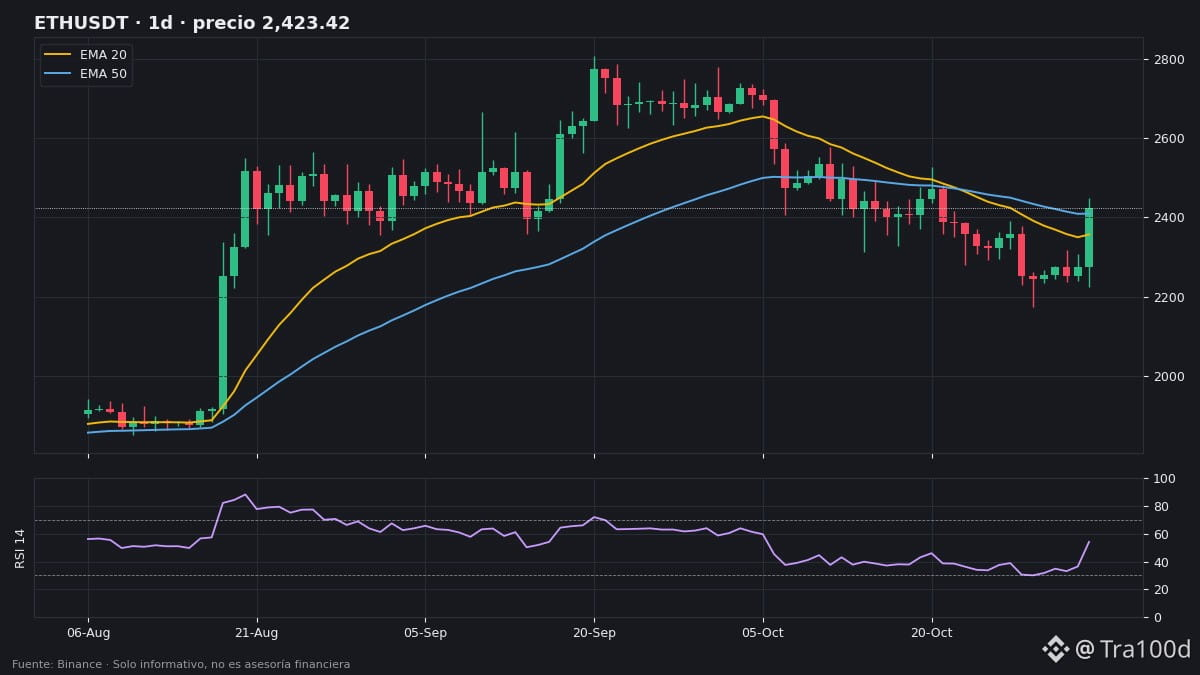
📊 $ETH is up +7.3% in 24 hours and is trading at $2,426, with $807.5M in volume. This morning, we said that breaking above the EMA 20 would open the way to the EMA 50: it has now crossed it.
🔎 Context: the fear and greed index rose from 34 to 50 (neutral), funding is at −0.002% (almost neutral), and open interest is down 0.3%. The rally isn’t accompanied by new leverage.
📊 Levels (daily):
• EMA 20: $2,357 and EMA 50: $2,410 (now below price, they become support)
• EMA 200: $2,230 (long-term support)
• RSI: 54 (neutral, with room to move)
• 20-day range: $2,172.85–$2,526.99
• ATR: $92.9 (~3.8% per day)
• Daily volume is 1.8 times the norm
⏱️ On the 4-hour chart, RSI reaches 70 (overbought territory) and the 20-candle high is $2,449.95: a pause wouldn’t be unusual.
🟢 Bullish scenario: holding the EMA 50 ($2,410) and breaking above $2,450 puts the 20-day high ($2,526.99) in sight.
🔴 Bearish scenario: losing $2,410 would send it back to the EMA 20 ($2,357); below that, the EMA 200 ($2,230).
👀 What to watch: the daily close relative to $2,410 and whether open interest starts to follow the rally.
Is ETH headed for $2,500, or will it give back some of its gains? 👇
#ETH #Ethereum #AnalisisTecnico #Cripto #Tra100d
⚠️ For informational and educational purposes only; this is not financial advice. Cryptocurrencies are volatile: do your own research and trade with caution.
📊 $ETH is up +7.3% in 24 hours and is trading at $2,426, with $807.5M in volume. This morning, we said that breaking above the EMA 20 would open the way to the EMA 50: it has now crossed it.
🔎 Context: the fear and greed index rose from 34 to 50 (neutral), funding is at −0.002% (almost neutral), and open interest is down 0.3%. The rally isn’t accompanied by new leverage.
📊 Levels (daily):
• EMA 20: $2,357 and EMA 50: $2,410 (now below price, they become support)
• EMA 200: $2,230 (long-term support)
• RSI: 54 (neutral, with room to move)
• 20-day range: $2,172.85–$2,526.99
• ATR: $92.9 (~3.8% per day)
• Daily volume is 1.8 times the norm
⏱️ On the 4-hour chart, RSI reaches 70 (overbought territory) and the 20-candle high is $2,449.95: a pause wouldn’t be unusual.
🟢 Bullish scenario: holding the EMA 50 ($2,410) and breaking above $2,450 puts the 20-day high ($2,526.99) in sight.
🔴 Bearish scenario: losing $2,410 would send it back to the EMA 20 ($2,357); below that, the EMA 200 ($2,230).
👀 What to watch: the daily close relative to $2,410 and whether open interest starts to follow the rally.
Is ETH headed for $2,500, or will it give back some of its gains? 👇
#ETH #Ethereum #AnalisisTecnico #Cripto #Tra100d
⚠️ For informational and educational purposes only; this is not financial advice. Cryptocurrencies are volatile: do your own research and trade with caution.
🔎 Context: the fear and greed index rose from 34 to 50 (neutral), funding is at −0.002% (almost neutral), and open interest is down 0.3%. The rally isn’t accompanied by new leverage.
📊 Levels (daily):
• EMA 20: $2,357 and EMA 50: $2,410 (now below price, they become support)
• EMA 200: $2,230 (long-term support)
• RSI: 54 (neutral, with room to move)
• 20-day range: $2,172.85–$2,526.99
• ATR: $92.9 (~3.8% per day)
• Daily volume is 1.8 times the norm
⏱️ On the 4-hour chart, RSI reaches 70 (overbought territory) and the 20-candle high is $2,449.95: a pause wouldn’t be unusual.
🟢 Bullish scenario: holding the EMA 50 ($2,410) and breaking above $2,450 puts the 20-day high ($2,526.99) in sight.
🔴 Bearish scenario: losing $2,410 would send it back to the EMA 20 ($2,357); below that, the EMA 200 ($2,230).
👀 What to watch: the daily close relative to $2,410 and whether open interest starts to follow the rally.
Is ETH headed for $2,500, or will it give back some of its gains? 👇
#ETH #Ethereum #AnalisisTecnico #Cripto #Tra100d
⚠️ For informational and educational purposes only; this is not financial advice. Cryptocurrencies are volatile: do your own research and trade with caution.
100
·
--
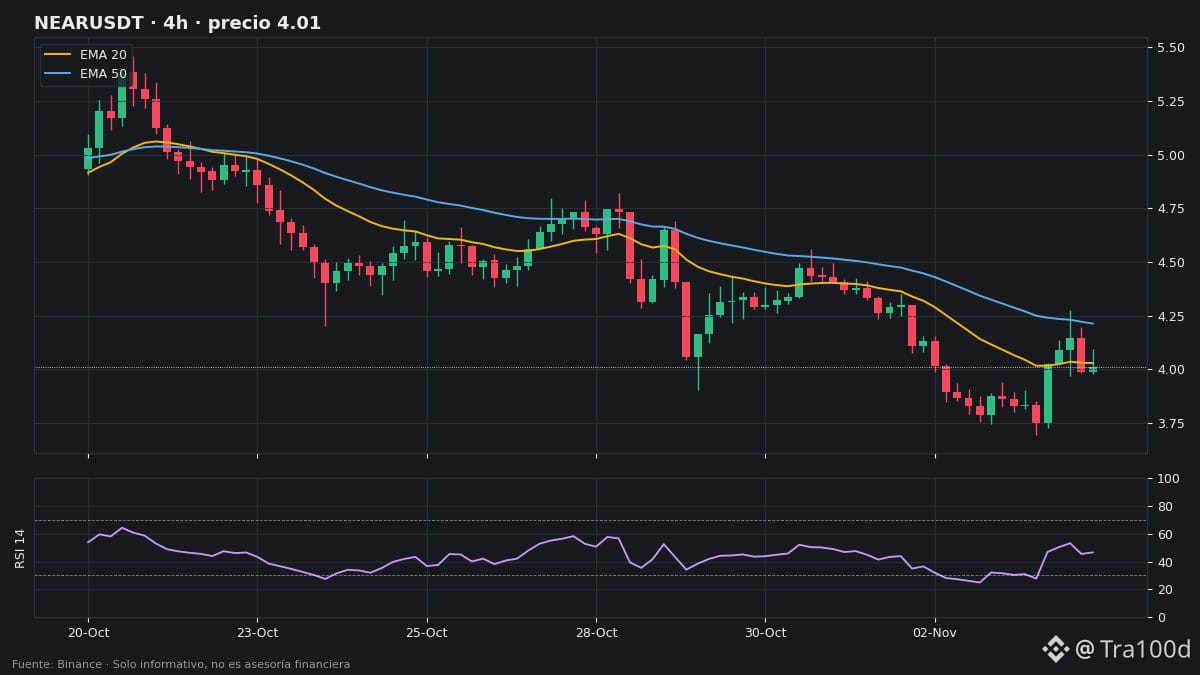
🚨 Yesterday we said the first reference for $NEAR was $4.04. It surpassed it this morning ($4.115), but now it's back to $4.01 (+6.6% in 24 hours), with $132M in volume.
The strange part: open interest is down 7.2% while the price is rising. That suggests short positions are being closed, rather than new buyers coming in. These rebounds can lose momentum once the short covering ends.
4-hour levels: it's fighting right at the 20 EMA ($4.03). If it holds, the next reference is the 50 EMA ($4.21); if it loses $4.00, pressure returns toward the 20-candle low ($3.695).
A strong rebound or just short covering? 👇
#NEAR #Alerta #Futuros #Tra100d
⚠️ For informational and educational purposes only; this is not financial advice. Cryptocurrencies are volatile: do your research and trade with caution.
🚨 Yesterday we said the first reference for $NEAR was $4.04. It surpassed it this morning ($4.115), but now it's back to $4.01 (+6.6% in 24 hours), with $132M in volume.
The strange part: open interest is down 7.2% while the price is rising. That suggests short positions are being closed, rather than new buyers coming in. These rebounds can lose momentum once the short covering ends.
4-hour levels: it's fighting right at the 20 EMA ($4.03). If it holds, the next reference is the 50 EMA ($4.21); if it loses $4.00, pressure returns toward the 20-candle low ($3.695).
A strong rebound or just short covering? 👇
#NEAR #Alerta #Futuros #Tra100d
⚠️ For informational and educational purposes only; this is not financial advice. Cryptocurrencies are volatile: do your research and trade with caution.
The strange part: open interest is down 7.2% while the price is rising. That suggests short positions are being closed, rather than new buyers coming in. These rebounds can lose momentum once the short covering ends.
4-hour levels: it's fighting right at the 20 EMA ($4.03). If it holds, the next reference is the 50 EMA ($4.21); if it loses $4.00, pressure returns toward the 20-candle low ($3.695).
A strong rebound or just short covering? 👇
#NEAR #Alerta #Futuros #Tra100d
⚠️ For informational and educational purposes only; this is not financial advice. Cryptocurrencies are volatile: do your research and trade with caution.
255
·
--
🧠 A price that rises without volume is like a car without gas: it moves, but it doesn’t get far. Relative volume helps measure it.
📘 What it is: the volume of a candle divided by the average volume of previous candles.
• 1.0 = normal volume
• More than 1.5 = genuine interest
• Less than 0.7 = dormant market
📊 Today’s example with $BTC :
• 4-hour candle: relative volume of 2.5 (2.5 times normal) while rising +1.7% over 6 candles.
• Daily candle: just 0.84, below normal.
Takeaway: the momentum of the last few hours is strong, but the broader market hasn’t joined in yet.
❌ Common mistake: looking at a candle’s volume without comparing it. “$100M in volume” means nothing if the norm for that pair is $300M.
✅ In one line: relative volume tells you whether a move has participation behind it or is just noise.
Do you check volume before entering a trade? YES or NO 👇
#BTC #Educacion #Trading #Volumen #Tra100d
⚠️ For informational and educational purposes only; this is not financial advice. Cryptocurrencies are volatile: do your research and trade with caution.
🧠 A price that rises without volume is like a car without gas: it moves, but it doesn’t get far. Relative volume helps measure it.
📘 What it is: the volume of a candle divided by the average volume of previous candles.
• 1.0 = normal volume
• More than 1.5 = genuine interest
• Less than 0.7 = dormant market
📊 Today’s example with $BTC :
• 4-hour candle: relative volume of 2.5 (2.5 times normal) while rising +1.7% over 6 candles.
• Daily candle: just 0.84, below normal.
Takeaway: the momentum of the last few hours is strong, but the broader market hasn’t joined in yet.
❌ Common mistake: looking at a candle’s volume without comparing it. “$100M in volume” means nothing if the norm for that pair is $300M.
✅ In one line: relative volume tells you whether a move has participation behind it or is just noise.
Do you check volume before entering a trade? YES or NO 👇
#BTC #Educacion #Trading #Volumen #Tra100d
⚠️ For informational and educational purposes only; this is not financial advice. Cryptocurrencies are volatile: do your research and trade with caution.
📘 What it is: the volume of a candle divided by the average volume of previous candles.
• 1.0 = normal volume
• More than 1.5 = genuine interest
• Less than 0.7 = dormant market
📊 Today’s example with $BTC :
• 4-hour candle: relative volume of 2.5 (2.5 times normal) while rising +1.7% over 6 candles.
• Daily candle: just 0.84, below normal.
Takeaway: the momentum of the last few hours is strong, but the broader market hasn’t joined in yet.
❌ Common mistake: looking at a candle’s volume without comparing it. “$100M in volume” means nothing if the norm for that pair is $300M.
✅ In one line: relative volume tells you whether a move has participation behind it or is just noise.
Do you check volume before entering a trade? YES or NO 👇
#BTC #Educacion #Trading #Volumen #Tra100d
⚠️ For informational and educational purposes only; this is not financial advice. Cryptocurrencies are volatile: do your research and trade with caution.
66
·
--
📈 A day after touching 26, the Fear and Greed Index rises to 34. It’s still in “fear,” but the market can breathe.
📌 3 facts today:
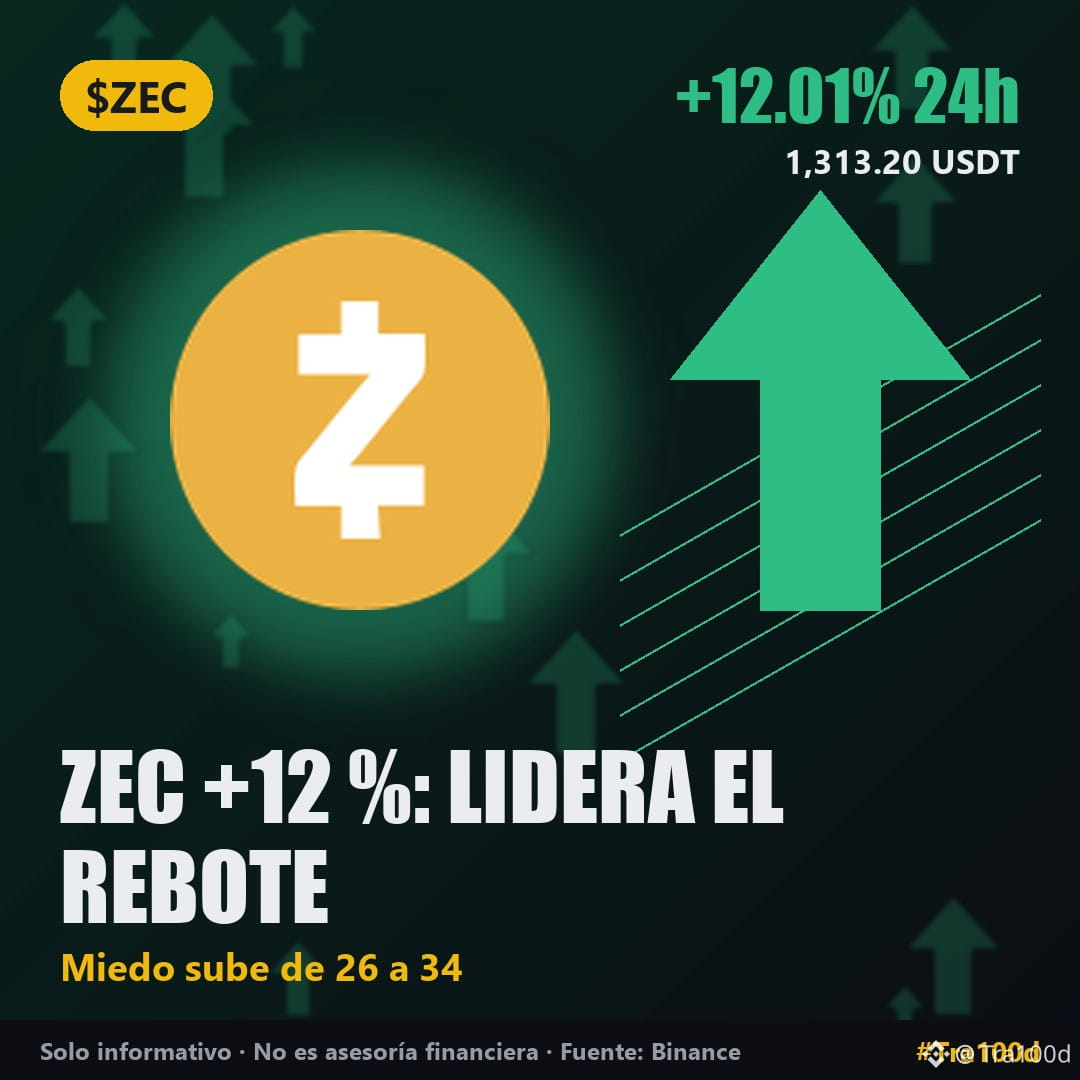
• $ZEC is up +12.0% to $1,313 and is the 3rd-highest-volume pair ($217M), behind only BTC and ETH.
• $BTC recovers to $78,641 (+1.8%) on $1,140M in volume.
• Among the large pairs we track, only TRX is in the red (−0.8%). ENA (+7.7%) and $NEAR (+6.9%) are also bouncing.
🔍 Why it matters: a bounce while fear is still at 34 doesn’t confirm a trend change. BTC remains below its 4-hour 200 EMA ($81,012), so the rebound still needs to prove it can hold.
A temporary bounce or the start of a recovery? 👇
#ZEC #BTC #MiedoYCodicia #Cripto #Tra100d
⚠️ For informational and educational purposes only; this is not financial advice. Cryptocurrencies are volatile: do your own research and trade with caution.
📈 A day after touching 26, the Fear and Greed Index rises to 34. It’s still in “fear,” but the market can breathe.
📌 3 facts today:
• $ZEC is up +12.0% to $1,313 and is the 3rd-highest-volume pair ($217M), behind only BTC and ETH.
• $BTC recovers to $78,641 (+1.8%) on $1,140M in volume.
• Among the large pairs we track, only TRX is in the red (−0.8%). ENA (+7.7%) and $NEAR (+6.9%) are also bouncing.
🔍 Why it matters: a bounce while fear is still at 34 doesn’t confirm a trend change. BTC remains below its 4-hour 200 EMA ($81,012), so the rebound still needs to prove it can hold.
A temporary bounce or the start of a recovery? 👇
#ZEC #BTC #MiedoYCodicia #Cripto #Tra100d
⚠️ For informational and educational purposes only; this is not financial advice. Cryptocurrencies are volatile: do your own research and trade with caution.
📌 3 facts today:
• $ZEC is up +12.0% to $1,313 and is the 3rd-highest-volume pair ($217M), behind only BTC and ETH.
• $BTC recovers to $78,641 (+1.8%) on $1,140M in volume.
• Among the large pairs we track, only TRX is in the red (−0.8%). ENA (+7.7%) and $NEAR (+6.9%) are also bouncing.
🔍 Why it matters: a bounce while fear is still at 34 doesn’t confirm a trend change. BTC remains below its 4-hour 200 EMA ($81,012), so the rebound still needs to prove it can hold.
A temporary bounce or the start of a recovery? 👇
#ZEC #BTC #MiedoYCodicia #Cripto #Tra100d
⚠️ For informational and educational purposes only; this is not financial advice. Cryptocurrencies are volatile: do your own research and trade with caution.
205
·
--
🔥 $BONK is the top-rising meme coin on Binance today: +10.4% in 24 hours. A real rebound or just a breather?
📊 The data (Binance):
• Spot price: $0.00000309 (+10.36% in 24 hours)
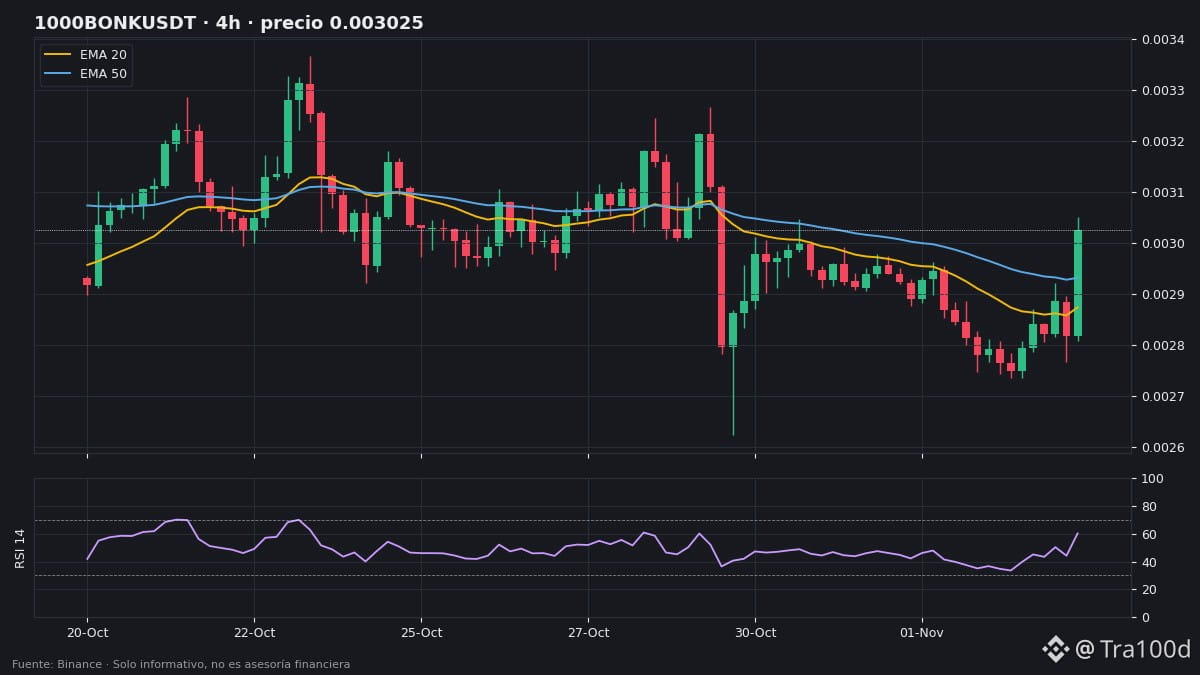
• On the 1000BONK perpetual (price per 1,000 tokens): $0.003025, +10.0% over the last 6 4-hour candles
• Last 4-hour candle volume: 2.9 times the average
• 4-hour RSI: 60 (neutral-to-high zone)
• Funding: 0.005% (neutral) and open interest −3.1%
📈 On the 4-hour chart, it has already moved above the 20 EMA (0.002874) and the 50 EMA (0.002932), but remains below the 200 EMA (0.003145). The 20-candle high is at 0.003051, just above.
📉 Keep in mind: the daily trend is still strongly bearish, and the daily ATR is 8.2%. For BONK, an 8% move in a day is normal.
Will BONK break above the 200 EMA or pull back? Reply "BREAKS" or "PULLS BACK" 👇
#BONK #Memecoin #Solana #Cripto #Tra100d
⚠️ For informational and educational purposes only; this is not financial advice. Cryptocurrencies are volatile: do your own research and trade with caution.
🔥 $BONK is the top-rising meme coin on Binance today: +10.4% in 24 hours. A real rebound or just a breather?
📊 The data (Binance):
• Spot price: $0.00000309 (+10.36% in 24 hours)
• On the 1000BONK perpetual (price per 1,000 tokens): $0.003025, +10.0% over the last 6 4-hour candles
• Last 4-hour candle volume: 2.9 times the average
• 4-hour RSI: 60 (neutral-to-high zone)
• Funding: 0.005% (neutral) and open interest −3.1%
📈 On the 4-hour chart, it has already moved above the 20 EMA (0.002874) and the 50 EMA (0.002932), but remains below the 200 EMA (0.003145). The 20-candle high is at 0.003051, just above.
📉 Keep in mind: the daily trend is still strongly bearish, and the daily ATR is 8.2%. For BONK, an 8% move in a day is normal.
Will BONK break above the 200 EMA or pull back? Reply "BREAKS" or "PULLS BACK" 👇
#BONK #Memecoin #Solana #Cripto #Tra100d
⚠️ For informational and educational purposes only; this is not financial advice. Cryptocurrencies are volatile: do your own research and trade with caution.
📊 The data (Binance):
• Spot price: $0.00000309 (+10.36% in 24 hours)
• On the 1000BONK perpetual (price per 1,000 tokens): $0.003025, +10.0% over the last 6 4-hour candles
• Last 4-hour candle volume: 2.9 times the average
• 4-hour RSI: 60 (neutral-to-high zone)
• Funding: 0.005% (neutral) and open interest −3.1%
📈 On the 4-hour chart, it has already moved above the 20 EMA (0.002874) and the 50 EMA (0.002932), but remains below the 200 EMA (0.003145). The 20-candle high is at 0.003051, just above.
📉 Keep in mind: the daily trend is still strongly bearish, and the daily ATR is 8.2%. For BONK, an 8% move in a day is normal.
Will BONK break above the 200 EMA or pull back? Reply "BREAKS" or "PULLS BACK" 👇
#BONK #Memecoin #Solana #Cripto #Tra100d
⚠️ For informational and educational purposes only; this is not financial advice. Cryptocurrencies are volatile: do your own research and trade with caution.
151
·
--
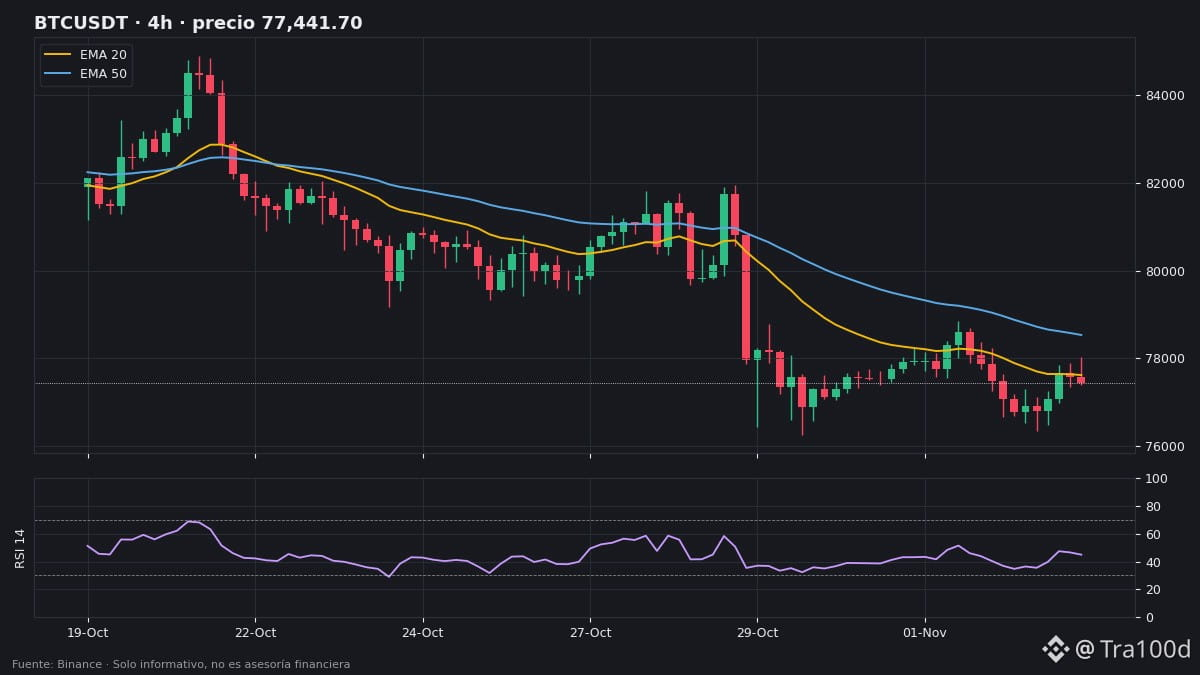
📉 $BTC is battling for $77,000 on the 4-hour chart. Where are the key levels?
🔎 Context: fear at 26/100, open interest flat (−0.4%) and funding at 0.01% (neutral).
📊 Levels (4h):
• Price: $77,020
• Below EMA 20 ($77,623), EMA 50 ($78,535) and EMA 200 ($81,054) → strong downtrend.
• RSI: 45 (recovering, neutral zone)
• Support: 20-candle low at $76,352 (on the daily chart, $76,270)
• Resistance: 20-candle high at $78,854
• ATR: $739 (~1% per candle)
🟢 Bullish scenario: reclaim the EMA 20 ($77,600), then challenge $78,500–$78,850.
🔴 Bearish scenario: losing $76,270 opens the door to the daily EMA 200 ($74,475), the major long-term benchmark.
👀 What to watch: open interest. If it starts rising again while price falls, a sharp move could trigger cascading liquidations.
Where do you see BTC tomorrow: above $78,000 or below $76,000? 👇
#BTC #Bitcoin #AnalisisTecnico #Cripto #Tra100d
⚠️ For informational and educational purposes only; this is not financial advice. Cryptocurrencies are volatile: do your own research and trade with caution.
📉 $BTC is battling for $77,000 on the 4-hour chart. Where are the key levels?
🔎 Context: fear at 26/100, open interest flat (−0.4%) and funding at 0.01% (neutral).
📊 Levels (4h):
• Price: $77,020
• Below EMA 20 ($77,623), EMA 50 ($78,535) and EMA 200 ($81,054) → strong downtrend.
• RSI: 45 (recovering, neutral zone)
• Support: 20-candle low at $76,352 (on the daily chart, $76,270)
• Resistance: 20-candle high at $78,854
• ATR: $739 (~1% per candle)
🟢 Bullish scenario: reclaim the EMA 20 ($77,600), then challenge $78,500–$78,850.
🔴 Bearish scenario: losing $76,270 opens the door to the daily EMA 200 ($74,475), the major long-term benchmark.
👀 What to watch: open interest. If it starts rising again while price falls, a sharp move could trigger cascading liquidations.
Where do you see BTC tomorrow: above $78,000 or below $76,000? 👇
#BTC #Bitcoin #AnalisisTecnico #Cripto #Tra100d
⚠️ For informational and educational purposes only; this is not financial advice. Cryptocurrencies are volatile: do your own research and trade with caution.
🔎 Context: fear at 26/100, open interest flat (−0.4%) and funding at 0.01% (neutral).
📊 Levels (4h):
• Price: $77,020
• Below EMA 20 ($77,623), EMA 50 ($78,535) and EMA 200 ($81,054) → strong downtrend.
• RSI: 45 (recovering, neutral zone)
• Support: 20-candle low at $76,352 (on the daily chart, $76,270)
• Resistance: 20-candle high at $78,854
• ATR: $739 (~1% per candle)
🟢 Bullish scenario: reclaim the EMA 20 ($77,600), then challenge $78,500–$78,850.
🔴 Bearish scenario: losing $76,270 opens the door to the daily EMA 200 ($74,475), the major long-term benchmark.
👀 What to watch: open interest. If it starts rising again while price falls, a sharp move could trigger cascading liquidations.
Where do you see BTC tomorrow: above $78,000 or below $76,000? 👇
#BTC #Bitcoin #AnalisisTecnico #Cripto #Tra100d
⚠️ For informational and educational purposes only; this is not financial advice. Cryptocurrencies are volatile: do your own research and trade with caution.
114
·
--
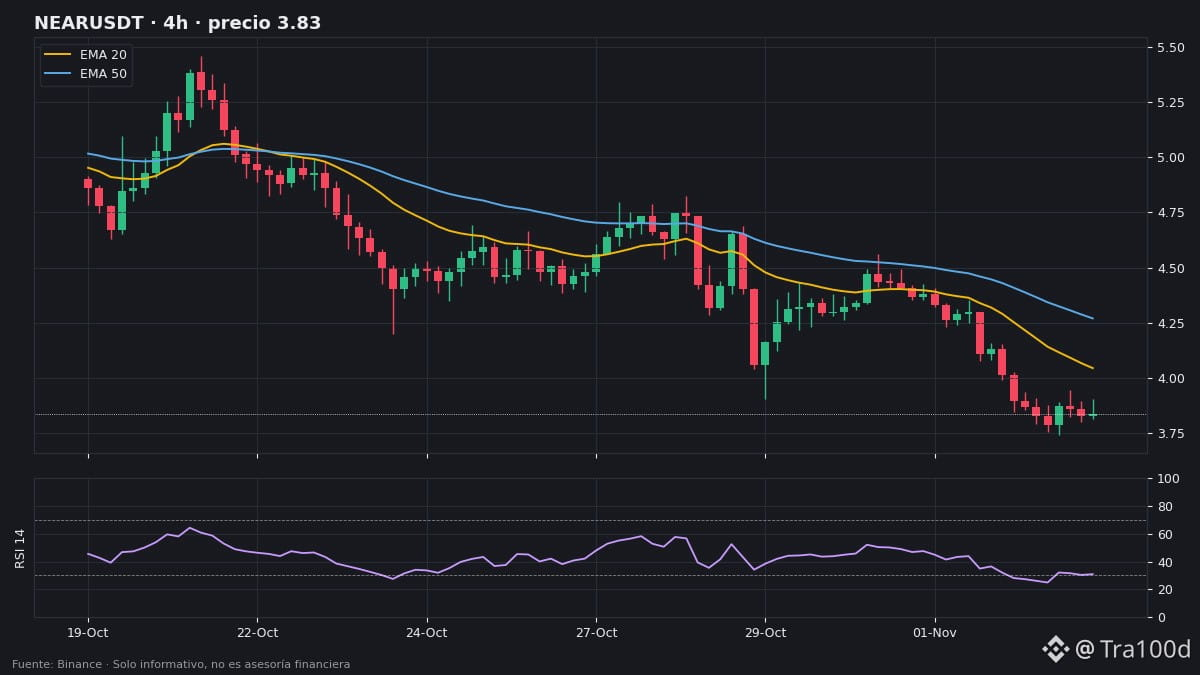
🚨 $NEAR halts the decline: trading at $3.832 (−1.1% in 24 h) with $75.5M in volume, just above the 20-candle low ($3.742).
Open interest is down −4.8%: positions opened during the decline are starting to close. The 4-hour RSI is coming out of oversold territory (30.9), but the trend remains strongly bearish: price is below the 20 EMA ($4.04), the 50 EMA ($4.27), and the 200 EMA ($4.62).
If it loses $3.742, expect more volatility; if it rebounds, the first reference point is the 4-hour 20 EMA ($4.04).
A bottom or a pause before another drop? 👇
#NEAR #Alerta #Futuros #Tra100d
⚠️ For informational and educational purposes only; this is not financial advice. Cryptocurrencies are volatile: do your own research and trade with caution.
🚨 $NEAR halts the decline: trading at $3.832 (−1.1% in 24 h) with $75.5M in volume, just above the 20-candle low ($3.742).
Open interest is down −4.8%: positions opened during the decline are starting to close. The 4-hour RSI is coming out of oversold territory (30.9), but the trend remains strongly bearish: price is below the 20 EMA ($4.04), the 50 EMA ($4.27), and the 200 EMA ($4.62).
If it loses $3.742, expect more volatility; if it rebounds, the first reference point is the 4-hour 20 EMA ($4.04).
A bottom or a pause before another drop? 👇
#NEAR #Alerta #Futuros #Tra100d
⚠️ For informational and educational purposes only; this is not financial advice. Cryptocurrencies are volatile: do your own research and trade with caution.
Open interest is down −4.8%: positions opened during the decline are starting to close. The 4-hour RSI is coming out of oversold territory (30.9), but the trend remains strongly bearish: price is below the 20 EMA ($4.04), the 50 EMA ($4.27), and the 200 EMA ($4.62).
If it loses $3.742, expect more volatility; if it rebounds, the first reference point is the 4-hour 20 EMA ($4.04).
A bottom or a pause before another drop? 👇
#NEAR #Alerta #Futuros #Tra100d
⚠️ For informational and educational purposes only; this is not financial advice. Cryptocurrencies are volatile: do your own research and trade with caution.
294
·
--
🧠 Today, the market is at 26/100 in “fear.” But what does that number measure, and how is it useful to you?
📘 What it is: an indicator from 0 to 100 that summarizes the mood of the crypto market (volatility, volume, social media, BTC dominance, among other factors).
• 0–24: extreme fear
• 25–49: fear
• 50: neutral
• 51–75: greed
• 76–100: extreme greed
📊 Today’s example: it fell from 37 to 26 in 24 hours while $BTC dropped to $77,205 (−0.83%) and is down −5% over 6 days. The index fell much more than the price: fear tends to move faster than the market.
❌ Common mistake: treating it as a buy or sell signal. “There’s fear, so I’ll buy” doesn’t always work: fear can last for weeks while the price keeps falling. Use it as a thermometer, together with price levels and risk management.
✅ In one line: the index tells you how the market feels, not where it’s headed.
Do you check it before trading? Reply YES or NO 👇
#BTC #Educacion #Trading #Cripto #Tra100d
⚠️ For informational and educational purposes only; this is not financial advice. Cryptocurrencies are volatile: do your research and trade with caution.
🧠 Today, the market is at 26/100 in “fear.” But what does that number measure, and how is it useful to you?
📘 What it is: an indicator from 0 to 100 that summarizes the mood of the crypto market (volatility, volume, social media, BTC dominance, among other factors).
• 0–24: extreme fear
• 25–49: fear
• 50: neutral
• 51–75: greed
• 76–100: extreme greed
📊 Today’s example: it fell from 37 to 26 in 24 hours while $BTC dropped to $77,205 (−0.83%) and is down −5% over 6 days. The index fell much more than the price: fear tends to move faster than the market.
❌ Common mistake: treating it as a buy or sell signal. “There’s fear, so I’ll buy” doesn’t always work: fear can last for weeks while the price keeps falling. Use it as a thermometer, together with price levels and risk management.
✅ In one line: the index tells you how the market feels, not where it’s headed.
Do you check it before trading? Reply YES or NO 👇
#BTC #Educacion #Trading #Cripto #Tra100d
⚠️ For informational and educational purposes only; this is not financial advice. Cryptocurrencies are volatile: do your research and trade with caution.
📘 What it is: an indicator from 0 to 100 that summarizes the mood of the crypto market (volatility, volume, social media, BTC dominance, among other factors).
• 0–24: extreme fear
• 25–49: fear
• 50: neutral
• 51–75: greed
• 76–100: extreme greed
📊 Today’s example: it fell from 37 to 26 in 24 hours while $BTC dropped to $77,205 (−0.83%) and is down −5% over 6 days. The index fell much more than the price: fear tends to move faster than the market.
❌ Common mistake: treating it as a buy or sell signal. “There’s fear, so I’ll buy” doesn’t always work: fear can last for weeks while the price keeps falling. Use it as a thermometer, together with price levels and risk management.
✅ In one line: the index tells you how the market feels, not where it’s headed.
Do you check it before trading? Reply YES or NO 👇
#BTC #Educacion #Trading #Cripto #Tra100d
⚠️ For informational and educational purposes only; this is not financial advice. Cryptocurrencies are volatile: do your research and trade with caution.
59
·
--
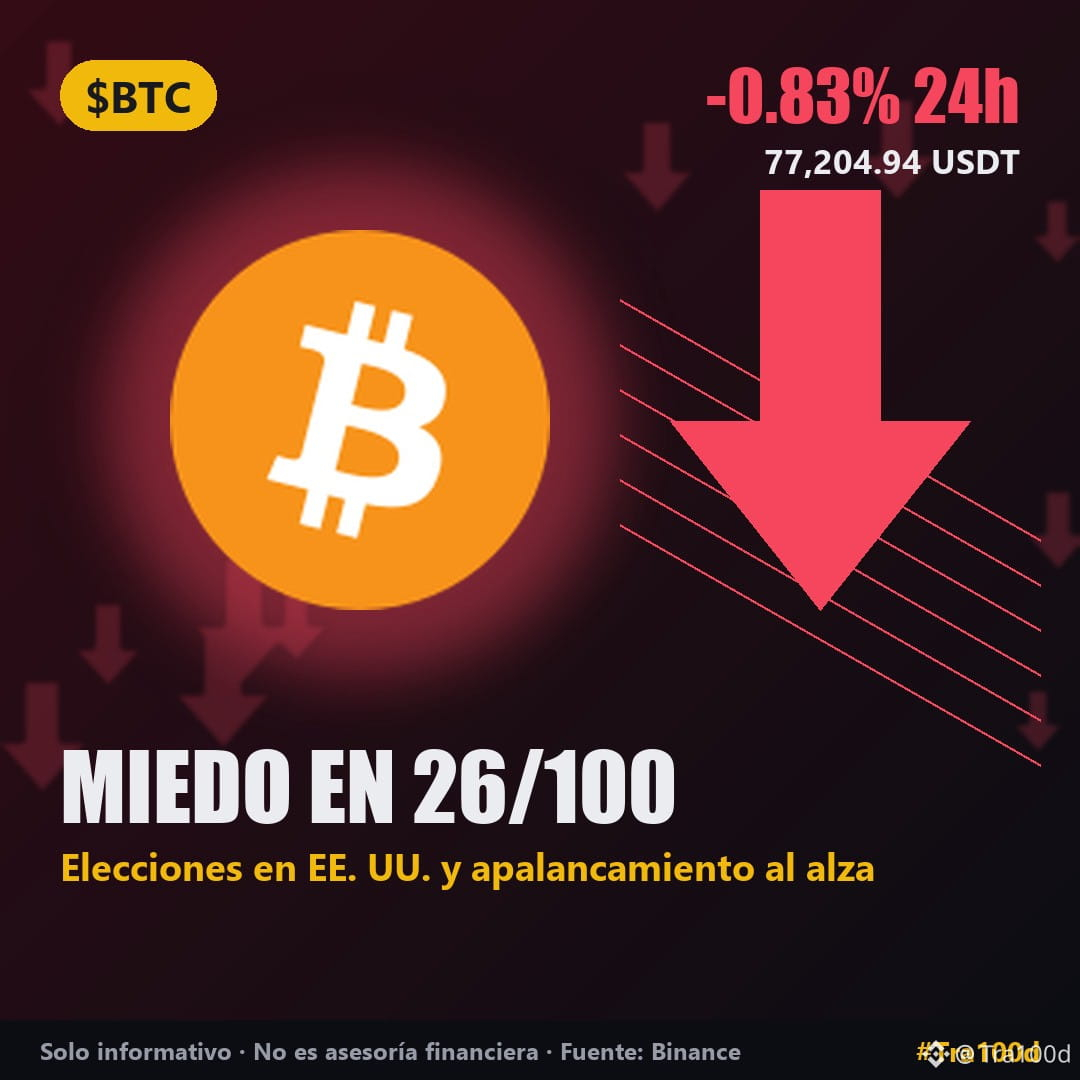
😨 The Fear and Greed Index fell from 37 to 26 in one day. The crypto market is approaching U.S. Election Day nervously.
📌 3 facts for today:
• $BTC at $77,205 (−0.83% in 24h), with $1,122M in volume, more than the next 4 pairs combined.
• BTC open interest: +5.0%. Positions are opening even as the price falls.
• $XRP is one of the few in the green (+0.66%), and its open interest jumped +19.9%.
🗳️ Why it matters: today is the U.S. midterm election, and October employment figures come out on Friday. With more leverage in the market, any surprise could trigger sharp moves and liquidations in both directions.
🔻 Biggest decliners: NEAR −6.6% and ZEC −5.6% (the latter ranks 3rd in daily volume, at $204M).
What are you doing with fear at 26: WAIT, ACCUMULATE, or EXIT? 👇
#BTC #XRP #EleccionesEEUU #Cripto #Tra100d
⚠️ For informational and educational purposes only; this is not financial advice. Cryptocurrencies are volatile: do your own research and trade with caution.
😨 The Fear and Greed Index fell from 37 to 26 in one day. The crypto market is approaching U.S. Election Day nervously.
📌 3 facts for today:
• $BTC at $77,205 (−0.83% in 24h), with $1,122M in volume, more than the next 4 pairs combined.
• BTC open interest: +5.0%. Positions are opening even as the price falls.
• $XRP is one of the few in the green (+0.66%), and its open interest jumped +19.9%.
🗳️ Why it matters: today is the U.S. midterm election, and October employment figures come out on Friday. With more leverage in the market, any surprise could trigger sharp moves and liquidations in both directions.
🔻 Biggest decliners: NEAR −6.6% and ZEC −5.6% (the latter ranks 3rd in daily volume, at $204M).
What are you doing with fear at 26: WAIT, ACCUMULATE, or EXIT? 👇
#BTC #XRP #EleccionesEEUU #Cripto #Tra100d
⚠️ For informational and educational purposes only; this is not financial advice. Cryptocurrencies are volatile: do your own research and trade with caution.
📌 3 facts for today:
• $BTC at $77,205 (−0.83% in 24h), with $1,122M in volume, more than the next 4 pairs combined.
• BTC open interest: +5.0%. Positions are opening even as the price falls.
• $XRP is one of the few in the green (+0.66%), and its open interest jumped +19.9%.
🗳️ Why it matters: today is the U.S. midterm election, and October employment figures come out on Friday. With more leverage in the market, any surprise could trigger sharp moves and liquidations in both directions.
🔻 Biggest decliners: NEAR −6.6% and ZEC −5.6% (the latter ranks 3rd in daily volume, at $204M).
What are you doing with fear at 26: WAIT, ACCUMULATE, or EXIT? 👇
#BTC #XRP #EleccionesEEUU #Cripto #Tra100d
⚠️ For informational and educational purposes only; this is not financial advice. Cryptocurrencies are volatile: do your own research and trade with caution.
152
·
--
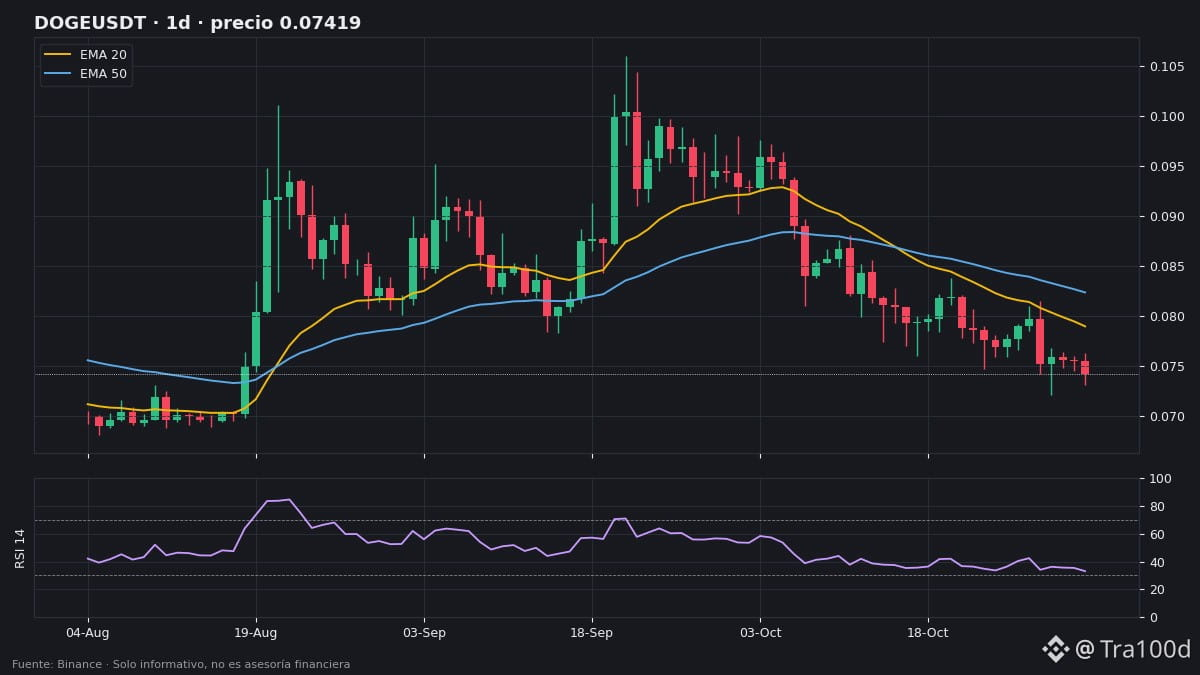
🐶 The king of memes has been falling for 6 days… so what now, community $DOGE ?
📊 The data (Binance):
• Price: $0.07462 (−0.97% in 24h)
• 24h volume: $26.0M
• Past 6 days: −6.1%
• Daily RSI: 33, nearing the oversold zone (30)
• Funding: 0.0069% (almost neutral) and open interest +5.0%
📉 On the daily chart, it remains below the EMA 20 ($0.0790) and the EMA 200 ($0.0851): a strong downtrend. The 20-day low is at $0.0722, just ~3% below the current price.
⚡ Volatility: daily ATR is 4.9%, meaning a move of around $0.0037 in a day is "normal" for DOGE.
Will it hold $0.072 or break below it? Reply "HOLDS" or "BREAKS" 👇
#DOGE #Memecoin #DOGECOİN #Cripto #Tra100d
⚠️ For informational and educational purposes only; this is not financial advice. Cryptocurrencies are volatile: do your own research and trade with caution.
🐶 The king of memes has been falling for 6 days… so what now, community $DOGE ?
📊 The data (Binance):
• Price: $0.07462 (−0.97% in 24h)
• 24h volume: $26.0M
• Past 6 days: −6.1%
• Daily RSI: 33, nearing the oversold zone (30)
• Funding: 0.0069% (almost neutral) and open interest +5.0%
📉 On the daily chart, it remains below the EMA 20 ($0.0790) and the EMA 200 ($0.0851): a strong downtrend. The 20-day low is at $0.0722, just ~3% below the current price.
⚡ Volatility: daily ATR is 4.9%, meaning a move of around $0.0037 in a day is "normal" for DOGE.
Will it hold $0.072 or break below it? Reply "HOLDS" or "BREAKS" 👇
#DOGE #Memecoin #DOGECOİN #Cripto #Tra100d
⚠️ For informational and educational purposes only; this is not financial advice. Cryptocurrencies are volatile: do your own research and trade with caution.
📊 The data (Binance):
• Price: $0.07462 (−0.97% in 24h)
• 24h volume: $26.0M
• Past 6 days: −6.1%
• Daily RSI: 33, nearing the oversold zone (30)
• Funding: 0.0069% (almost neutral) and open interest +5.0%
📉 On the daily chart, it remains below the EMA 20 ($0.0790) and the EMA 200 ($0.0851): a strong downtrend. The 20-day low is at $0.0722, just ~3% below the current price.
⚡ Volatility: daily ATR is 4.9%, meaning a move of around $0.0037 in a day is "normal" for DOGE.
Will it hold $0.072 or break below it? Reply "HOLDS" or "BREAKS" 👇
#DOGE #Memecoin #DOGECOİN #Cripto #Tra100d
⚠️ For informational and educational purposes only; this is not financial advice. Cryptocurrencies are volatile: do your own research and trade with caution.
81
·
--
📚 Today $NEAR is down −6% and its open interest is UP +3.8%. What does that tell us?
🔎 What it is: open interest (OI) is the total number of futures contracts that are still open. If it rises, new money is coming in; if it falls, positions are being closed.
🧭 How to read it alongside price:
• Price ↑ + OI ↑ → new longs (buyers) are entering.
• Price ↑ + OI ↓ → shorts are closing (covering) their positions.
• Price ↓ + OI ↑ → new shorts (sellers) are entering.
• Price ↓ + OI ↓ → longs are closing or being liquidated.
📊 Today's examples (Binance):
• NEAR: price −6.0%, OI +3.8% → the drop is accompanied by new positions.
• $TRX : price +2.1%, OI −6.9% → the rise is driven more by closing positions than by new buying.
• $BTC : price −0.1%, OI −2.3% → leverage is decreasing.
❌ Common mistake: reading OI on its own. High OI doesn't tell you whether longs or shorts are winning; use it alongside price, volume, and funding (we covered that yesterday).
💡 In one line: price tells you which way the market is moving; open interest tells you how many people are betting on that move.
Were you already looking at open interest? “YES” or “NO” 👇
#InteresAbierto #Futuros #Educacion #Cripto #Tra100d
⚠️ For informational and educational purposes only; this is not financial advice. Cryptocurrencies are volatile: do your own research and trade with caution.
📚 Today $NEAR is down −6% and its open interest is UP +3.8%. What does that tell us?
🔎 What it is: open interest (OI) is the total number of futures contracts that are still open. If it rises, new money is coming in; if it falls, positions are being closed.
🧭 How to read it alongside price:
• Price ↑ + OI ↑ → new longs (buyers) are entering.
• Price ↑ + OI ↓ → shorts are closing (covering) their positions.
• Price ↓ + OI ↑ → new shorts (sellers) are entering.
• Price ↓ + OI ↓ → longs are closing or being liquidated.
📊 Today's examples (Binance):
• NEAR: price −6.0%, OI +3.8% → the drop is accompanied by new positions.
• $TRX : price +2.1%, OI −6.9% → the rise is driven more by closing positions than by new buying.
• $BTC : price −0.1%, OI −2.3% → leverage is decreasing.
❌ Common mistake: reading OI on its own. High OI doesn't tell you whether longs or shorts are winning; use it alongside price, volume, and funding (we covered that yesterday).
💡 In one line: price tells you which way the market is moving; open interest tells you how many people are betting on that move.
Were you already looking at open interest? “YES” or “NO” 👇
#InteresAbierto #Futuros #Educacion #Cripto #Tra100d
⚠️ For informational and educational purposes only; this is not financial advice. Cryptocurrencies are volatile: do your own research and trade with caution.
🔎 What it is: open interest (OI) is the total number of futures contracts that are still open. If it rises, new money is coming in; if it falls, positions are being closed.
🧭 How to read it alongside price:
• Price ↑ + OI ↑ → new longs (buyers) are entering.
• Price ↑ + OI ↓ → shorts are closing (covering) their positions.
• Price ↓ + OI ↑ → new shorts (sellers) are entering.
• Price ↓ + OI ↓ → longs are closing or being liquidated.
📊 Today's examples (Binance):
• NEAR: price −6.0%, OI +3.8% → the drop is accompanied by new positions.
• $TRX : price +2.1%, OI −6.9% → the rise is driven more by closing positions than by new buying.
• $BTC : price −0.1%, OI −2.3% → leverage is decreasing.
❌ Common mistake: reading OI on its own. High OI doesn't tell you whether longs or shorts are winning; use it alongside price, volume, and funding (we covered that yesterday).
💡 In one line: price tells you which way the market is moving; open interest tells you how many people are betting on that move.
Were you already looking at open interest? “YES” or “NO” 👇
#InteresAbierto #Futuros #Educacion #Cripto #Tra100d
⚠️ For informational and educational purposes only; this is not financial advice. Cryptocurrencies are volatile: do your own research and trade with caution.
124
·
--
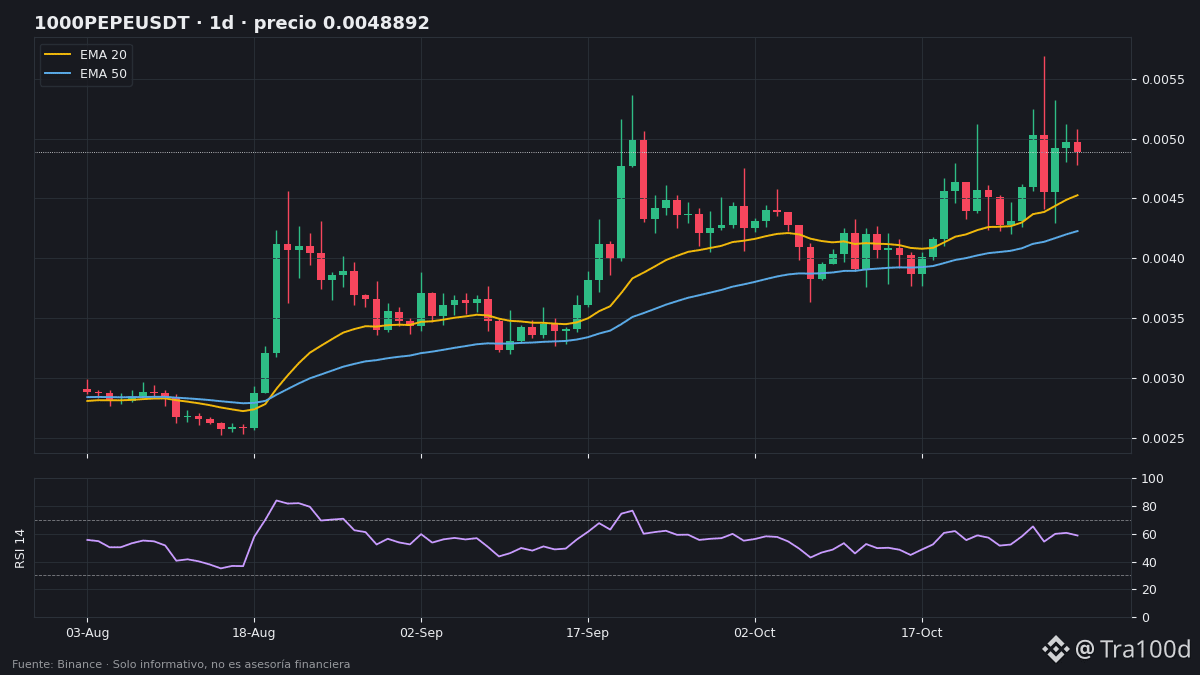
🐸 Red Monday for memes… but $PEPE is still the only one with a strong uptrend on the daily chart.
📊 The data (Binance):
• PEPE: ~$0.00000485 (−1.4% in 24h), but +13.3% over the last 6 daily candles.
• Once again, the most traded meme on the list: $34.6M in 24h.
• Still above the daily 20, 50, and 200 EMAs. RSI 59: strength without being overbought.
• Funding +0.01% and open interest +1.0%: calm positioning.
🎯 Yesterday’s challenge remains: it’s ~17% short of its 20-day high ($0.00000569).
Everything else is in the red: $DOGE −0.6%, SHIB −1.3%, FLOKI −2.9%, BONK −3.1%, WIF −3.2%.
⚠️ Note: PEPE’s daily ATR is 9.3%, so a −9% or +9% move in a day is “normal” for it.
What’s your meme pick for November? Write it below 👇
#PEPE #Memecoins #DOGE #Crypto #Tra100d
⚠️ For informational and educational purposes only; this is not financial advice. Cryptocurrencies are volatile: do your own research and trade with caution.
🐸 Red Monday for memes… but $PEPE is still the only one with a strong uptrend on the daily chart.
📊 The data (Binance):
• PEPE: ~$0.00000485 (−1.4% in 24h), but +13.3% over the last 6 daily candles.
• Once again, the most traded meme on the list: $34.6M in 24h.
• Still above the daily 20, 50, and 200 EMAs. RSI 59: strength without being overbought.
• Funding +0.01% and open interest +1.0%: calm positioning.
🎯 Yesterday’s challenge remains: it’s ~17% short of its 20-day high ($0.00000569).
Everything else is in the red: $DOGE −0.6%, SHIB −1.3%, FLOKI −2.9%, BONK −3.1%, WIF −3.2%.
⚠️ Note: PEPE’s daily ATR is 9.3%, so a −9% or +9% move in a day is “normal” for it.
What’s your meme pick for November? Write it below 👇
#PEPE #Memecoins #DOGE #Crypto #Tra100d
⚠️ For informational and educational purposes only; this is not financial advice. Cryptocurrencies are volatile: do your own research and trade with caution.
📊 The data (Binance):
• PEPE: ~$0.00000485 (−1.4% in 24h), but +13.3% over the last 6 daily candles.
• Once again, the most traded meme on the list: $34.6M in 24h.
• Still above the daily 20, 50, and 200 EMAs. RSI 59: strength without being overbought.
• Funding +0.01% and open interest +1.0%: calm positioning.
🎯 Yesterday’s challenge remains: it’s ~17% short of its 20-day high ($0.00000569).
Everything else is in the red: $DOGE −0.6%, SHIB −1.3%, FLOKI −2.9%, BONK −3.1%, WIF −3.2%.
⚠️ Note: PEPE’s daily ATR is 9.3%, so a −9% or +9% move in a day is “normal” for it.
What’s your meme pick for November? Write it below 👇
#PEPE #Memecoins #DOGE #Crypto #Tra100d
⚠️ For informational and educational purposes only; this is not financial advice. Cryptocurrencies are volatile: do your own research and trade with caution.
124
·
--
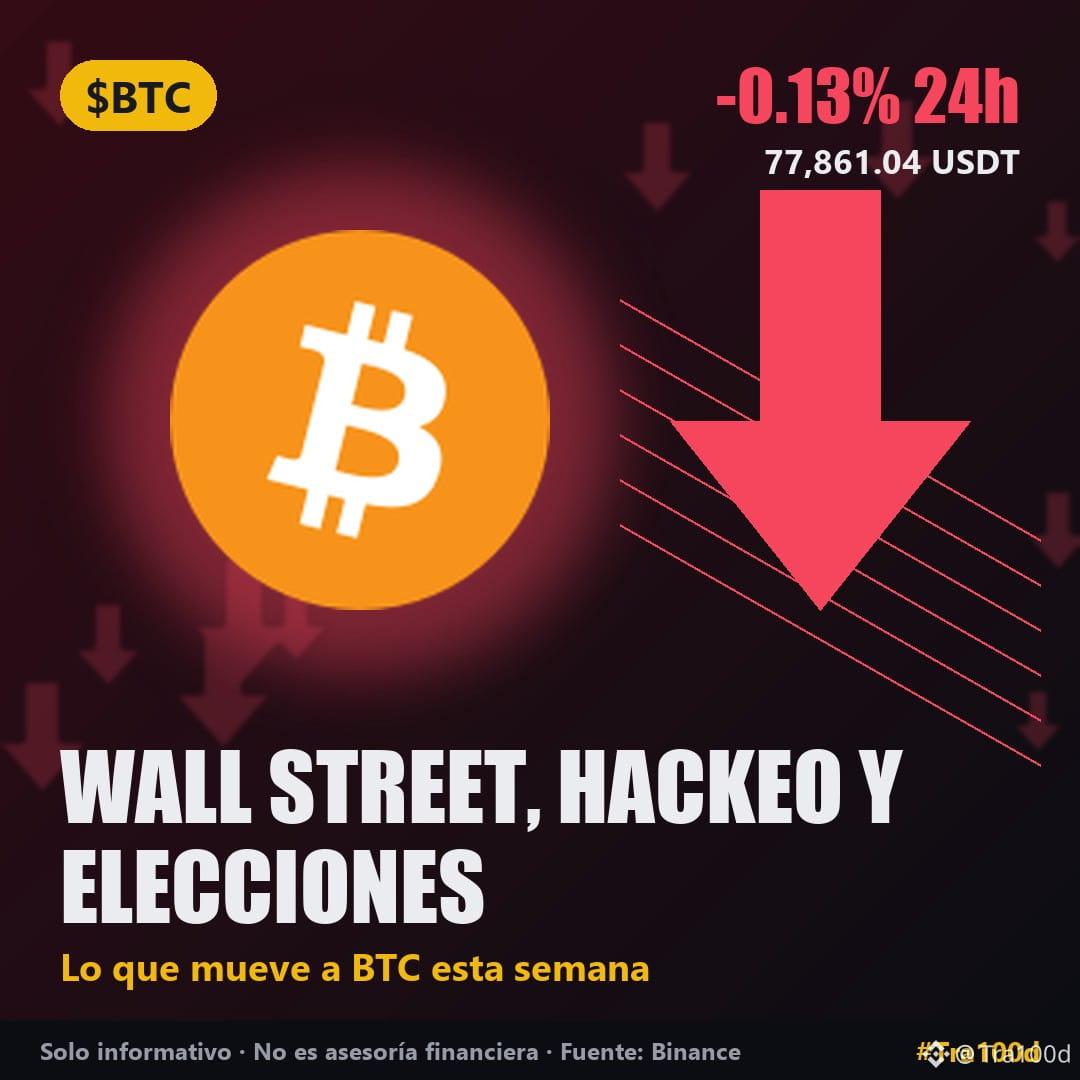
🗽 Wall Street closed Friday in the red, Binance suffered the biggest hack in crypto history… and $BTC remains near $78,000. Here’s what you need to know today.
📉 Friday’s close (Oct 30):
• S&P 500: 7,580 (−1.8%), its worst day since June.
• Nasdaq: 25,437 (−2.9%), hit by tech stocks: Intel −28.6% after lowering its forecast, and Nvidia −4.2%.
• Dow Jones: 51,770 (−1.1%).
• The S&P 500 and Nasdaq have now fallen for 3 straight weeks, their longest losing streak since March.
📈 Today’s open (9:30 a.m. New York = 10:30 a.m. Caracas): S&P 500 futures are up ~0.4–0.5% and Nasdaq-100 futures ~0.8%. Brent crude is down ~3%, near $110.
🔐 Binance hack (Oct 29): about $6.3 billion stolen, attributed to the North Korean group TraderTraitor, according to TRM Labs. Binance says it will cover the losses with its own funds and a $1 billion BTC reserve. BTC fell as low as ~$76,000 and is at ~$77,860 today (−0.1% in 24 hours). The Bitcoin network wasn’t hacked: an exchange was.
🗓️ The week in the U.S.:
• Today: Apple and Palantir earnings after the close.
• Tuesday the 3rd: midterm elections.
• Friday the 6th: October jobs report (+55,000 jobs expected).
• The Fed: markets see a rate hike in December as likely (75–85%).
😟 Crypto sentiment: 37/100, still in "fear" territory.
Will BTC follow Wall Street this week, or go its own way? "FOLLOW" or "SOLO" 👇
#BTC #WallStreet #Binance #Cripto #Tra100d
⚠️ For informational and educational purposes only; this is not financial advice. Cryptocurrencies are volatile: do your own research and trade with caution.
🗽 Wall Street closed Friday in the red, Binance suffered the biggest hack in crypto history… and $BTC remains near $78,000. Here’s what you need to know today.
📉 Friday’s close (Oct 30):
• S&P 500: 7,580 (−1.8%), its worst day since June.
• Nasdaq: 25,437 (−2.9%), hit by tech stocks: Intel −28.6% after lowering its forecast, and Nvidia −4.2%.
• Dow Jones: 51,770 (−1.1%).
• The S&P 500 and Nasdaq have now fallen for 3 straight weeks, their longest losing streak since March.
📈 Today’s open (9:30 a.m. New York = 10:30 a.m. Caracas): S&P 500 futures are up ~0.4–0.5% and Nasdaq-100 futures ~0.8%. Brent crude is down ~3%, near $110.
🔐 Binance hack (Oct 29): about $6.3 billion stolen, attributed to the North Korean group TraderTraitor, according to TRM Labs. Binance says it will cover the losses with its own funds and a $1 billion BTC reserve. BTC fell as low as ~$76,000 and is at ~$77,860 today (−0.1% in 24 hours). The Bitcoin network wasn’t hacked: an exchange was.
🗓️ The week in the U.S.:
• Today: Apple and Palantir earnings after the close.
• Tuesday the 3rd: midterm elections.
• Friday the 6th: October jobs report (+55,000 jobs expected).
• The Fed: markets see a rate hike in December as likely (75–85%).
😟 Crypto sentiment: 37/100, still in "fear" territory.
Will BTC follow Wall Street this week, or go its own way? "FOLLOW" or "SOLO" 👇
#BTC #WallStreet #Binance #Cripto #Tra100d
⚠️ For informational and educational purposes only; this is not financial advice. Cryptocurrencies are volatile: do your own research and trade with caution.
📉 Friday’s close (Oct 30):
• S&P 500: 7,580 (−1.8%), its worst day since June.
• Nasdaq: 25,437 (−2.9%), hit by tech stocks: Intel −28.6% after lowering its forecast, and Nvidia −4.2%.
• Dow Jones: 51,770 (−1.1%).
• The S&P 500 and Nasdaq have now fallen for 3 straight weeks, their longest losing streak since March.
📈 Today’s open (9:30 a.m. New York = 10:30 a.m. Caracas): S&P 500 futures are up ~0.4–0.5% and Nasdaq-100 futures ~0.8%. Brent crude is down ~3%, near $110.
🔐 Binance hack (Oct 29): about $6.3 billion stolen, attributed to the North Korean group TraderTraitor, according to TRM Labs. Binance says it will cover the losses with its own funds and a $1 billion BTC reserve. BTC fell as low as ~$76,000 and is at ~$77,860 today (−0.1% in 24 hours). The Bitcoin network wasn’t hacked: an exchange was.
🗓️ The week in the U.S.:
• Today: Apple and Palantir earnings after the close.
• Tuesday the 3rd: midterm elections.
• Friday the 6th: October jobs report (+55,000 jobs expected).
• The Fed: markets see a rate hike in December as likely (75–85%).
😟 Crypto sentiment: 37/100, still in "fear" territory.
Will BTC follow Wall Street this week, or go its own way? "FOLLOW" or "SOLO" 👇
#BTC #WallStreet #Binance #Cripto #Tra100d
⚠️ For informational and educational purposes only; this is not financial advice. Cryptocurrencies are volatile: do your own research and trade with caution.
51
·
--
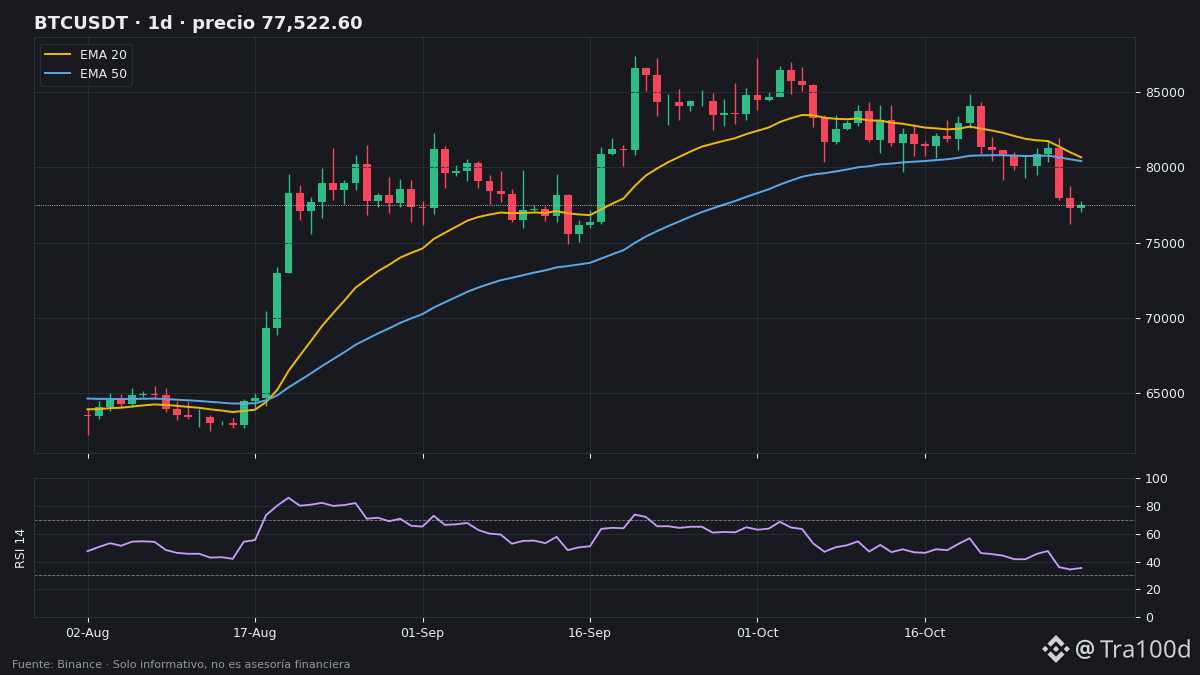
📉 $BTC heads into the weekly close with RSI at 35 and caught between its moving averages.
📍 Context: trading at ~$78,110 (+0.6% in 24h), but down 3.2% over the last 6 daily candles. Yesterday’s volume was just 0.37 times the average: an unconvincing weekend.
📊 Levels (daily candles, Binance):
• Support: 20-day low at $76,270 (~2.4% below) and 200 EMA at ~$74,467 (~4.7% below).
• Resistance: 50 EMA at ~$80,425 and 20 EMA at ~$80,675; 20-day high at $84,875.
• RSI: 35, close to oversold.
• ATR: ~$2,059 (2.7%).
• Funding +0.01% and open interest +0.3%: neutral positioning.
🟢 Bullish scenario: breaking above the 4-hour 20 EMA (~$78,230) and then the 4-hour 50 EMA (~$79,270) would bring the $80,400–$80,700 zone into reach. The 4-hour trend remains bearish, with the 4-hour 200 EMA at ~$81,000.
🔴 Bearish scenario: losing $76,270 would make the daily 200 EMA (~$74,470) the next level to watch.
✅ Yesterday’s question: for now, $ETH is holding above $2,220: ~$2,271 (+0.5%).
👀 What to watch: tonight’s weekly close and Monday’s volume.
Will BTC start November above $80,000? “YES” or “NO” 👇
#BTC #Bitcoin #AnalisisTecnico #Cripto #Tra100d
⚠️ For informational and educational purposes only; this is not financial advice. Cryptocurrencies are volatile: do your research and trade with caution.
📉 $BTC heads into the weekly close with RSI at 35 and caught between its moving averages.
📍 Context: trading at ~$78,110 (+0.6% in 24h), but down 3.2% over the last 6 daily candles. Yesterday’s volume was just 0.37 times the average: an unconvincing weekend.
📊 Levels (daily candles, Binance):
• Support: 20-day low at $76,270 (~2.4% below) and 200 EMA at ~$74,467 (~4.7% below).
• Resistance: 50 EMA at ~$80,425 and 20 EMA at ~$80,675; 20-day high at $84,875.
• RSI: 35, close to oversold.
• ATR: ~$2,059 (2.7%).
• Funding +0.01% and open interest +0.3%: neutral positioning.
🟢 Bullish scenario: breaking above the 4-hour 20 EMA (~$78,230) and then the 4-hour 50 EMA (~$79,270) would bring the $80,400–$80,700 zone into reach. The 4-hour trend remains bearish, with the 4-hour 200 EMA at ~$81,000.
🔴 Bearish scenario: losing $76,270 would make the daily 200 EMA (~$74,470) the next level to watch.
✅ Yesterday’s question: for now, $ETH is holding above $2,220: ~$2,271 (+0.5%).
👀 What to watch: tonight’s weekly close and Monday’s volume.
Will BTC start November above $80,000? “YES” or “NO” 👇
#BTC #Bitcoin #AnalisisTecnico #Cripto #Tra100d
⚠️ For informational and educational purposes only; this is not financial advice. Cryptocurrencies are volatile: do your research and trade with caution.
📍 Context: trading at ~$78,110 (+0.6% in 24h), but down 3.2% over the last 6 daily candles. Yesterday’s volume was just 0.37 times the average: an unconvincing weekend.
📊 Levels (daily candles, Binance):
• Support: 20-day low at $76,270 (~2.4% below) and 200 EMA at ~$74,467 (~4.7% below).
• Resistance: 50 EMA at ~$80,425 and 20 EMA at ~$80,675; 20-day high at $84,875.
• RSI: 35, close to oversold.
• ATR: ~$2,059 (2.7%).
• Funding +0.01% and open interest +0.3%: neutral positioning.
🟢 Bullish scenario: breaking above the 4-hour 20 EMA (~$78,230) and then the 4-hour 50 EMA (~$79,270) would bring the $80,400–$80,700 zone into reach. The 4-hour trend remains bearish, with the 4-hour 200 EMA at ~$81,000.
🔴 Bearish scenario: losing $76,270 would make the daily 200 EMA (~$74,470) the next level to watch.
✅ Yesterday’s question: for now, $ETH is holding above $2,220: ~$2,271 (+0.5%).
👀 What to watch: tonight’s weekly close and Monday’s volume.
Will BTC start November above $80,000? “YES” or “NO” 👇
#BTC #Bitcoin #AnalisisTecnico #Cripto #Tra100d
⚠️ For informational and educational purposes only; this is not financial advice. Cryptocurrencies are volatile: do your research and trade with caution.
81
·
--
🚨 $AVAX rose as much as +4.2% today, but has already given back much of its gains: ~$8.68 (+1.2%) with $22.4M traded.
On the 4-hour candles, it fell back below the 50 EMA (~$8.82) and is sitting right on the 20 EMA (~$8.67). Volume on the latest candle is back to normal (0.6 times the average). Key level above: the 20-candle 4-hour high at $9.08 (~4.6% higher), which it failed to break through.
Now $UNI takes the top spot: ~$7.19 (+1.3%) with $42M traded.
Will AVAX hold $8.67 tonight? “YES” or “NO” 👇
#AVAX #UNI #Altcoins #Tra100d
⚠️ For informational and educational purposes only; this is not financial advice. Cryptocurrencies are volatile: do your own research and trade with caution.
🚨 $AVAX rose as much as +4.2% today, but has already given back much of its gains: ~$8.68 (+1.2%) with $22.4M traded.
On the 4-hour candles, it fell back below the 50 EMA (~$8.82) and is sitting right on the 20 EMA (~$8.67). Volume on the latest candle is back to normal (0.6 times the average). Key level above: the 20-candle 4-hour high at $9.08 (~4.6% higher), which it failed to break through.
Now $UNI takes the top spot: ~$7.19 (+1.3%) with $42M traded.
Will AVAX hold $8.67 tonight? “YES” or “NO” 👇
#AVAX #UNI #Altcoins #Tra100d
⚠️ For informational and educational purposes only; this is not financial advice. Cryptocurrencies are volatile: do your own research and trade with caution.
On the 4-hour candles, it fell back below the 50 EMA (~$8.82) and is sitting right on the 20 EMA (~$8.67). Volume on the latest candle is back to normal (0.6 times the average). Key level above: the 20-candle 4-hour high at $9.08 (~4.6% higher), which it failed to break through.
Now $UNI takes the top spot: ~$7.19 (+1.3%) with $42M traded.
Will AVAX hold $8.67 tonight? “YES” or “NO” 👇
#AVAX #UNI #Altcoins #Tra100d
⚠️ For informational and educational purposes only; this is not financial advice. Cryptocurrencies are volatile: do your own research and trade with caution.
138
·
--
📚 Today, $LSK has a funding rate of −0.29% and $BTC has a rate of +0.01%. What does that mean?
🔎 What it is: In perpetual futures, funding is a periodic payment between traders to keep the contract price close to the spot price.
• Positive funding → longs (buyers) pay shorts.
• Negative funding → shorts (sellers) pay longs.
📊 Example using today's data (Binance):
• BTC and PEPE: +0.01%, the market's "normal" level.
• ETH: −0.0008%, practically neutral.
• LSK: −0.29%, about 29 times the normal level, but negative: a $100 short position pays about $0.29 each time funding is collected.
❌ Common mistake: thinking that very negative funding guarantees a rebound. It indicates there are many short positions, which could lead to a "short squeeze"… or to further declines if the sellers are right.
✅ Use it as a gauge of positioning, alongside open interest and volume.
💡 In one line: funding tells you which side is more heavily positioned, not who will win.
Do you check funding before opening a futures position?👇
#FundingRate #Futuros #Educacion #Cripto #Tra100d
⚠️ For informational and educational purposes only; not financial advice. Cryptocurrencies are volatile: do your research and trade with caution.
📚 Today, $LSK has a funding rate of −0.29% and $BTC has a rate of +0.01%. What does that mean?
🔎 What it is: In perpetual futures, funding is a periodic payment between traders to keep the contract price close to the spot price.
• Positive funding → longs (buyers) pay shorts.
• Negative funding → shorts (sellers) pay longs.
📊 Example using today's data (Binance):
• BTC and PEPE: +0.01%, the market's "normal" level.
• ETH: −0.0008%, practically neutral.
• LSK: −0.29%, about 29 times the normal level, but negative: a $100 short position pays about $0.29 each time funding is collected.
❌ Common mistake: thinking that very negative funding guarantees a rebound. It indicates there are many short positions, which could lead to a "short squeeze"… or to further declines if the sellers are right.
✅ Use it as a gauge of positioning, alongside open interest and volume.
💡 In one line: funding tells you which side is more heavily positioned, not who will win.
Do you check funding before opening a futures position?👇
#FundingRate #Futuros #Educacion #Cripto #Tra100d
⚠️ For informational and educational purposes only; not financial advice. Cryptocurrencies are volatile: do your research and trade with caution.
🔎 What it is: In perpetual futures, funding is a periodic payment between traders to keep the contract price close to the spot price.
• Positive funding → longs (buyers) pay shorts.
• Negative funding → shorts (sellers) pay longs.
📊 Example using today's data (Binance):
• BTC and PEPE: +0.01%, the market's "normal" level.
• ETH: −0.0008%, practically neutral.
• LSK: −0.29%, about 29 times the normal level, but negative: a $100 short position pays about $0.29 each time funding is collected.
❌ Common mistake: thinking that very negative funding guarantees a rebound. It indicates there are many short positions, which could lead to a "short squeeze"… or to further declines if the sellers are right.
✅ Use it as a gauge of positioning, alongside open interest and volume.
💡 In one line: funding tells you which side is more heavily positioned, not who will win.
Do you check funding before opening a futures position?👇
#FundingRate #Futuros #Educacion #Cripto #Tra100d
⚠️ For informational and educational purposes only; not financial advice. Cryptocurrencies are volatile: do your research and trade with caution.
SÍ
80%
NO
20%
5 votes • Voting closed
715
·
--
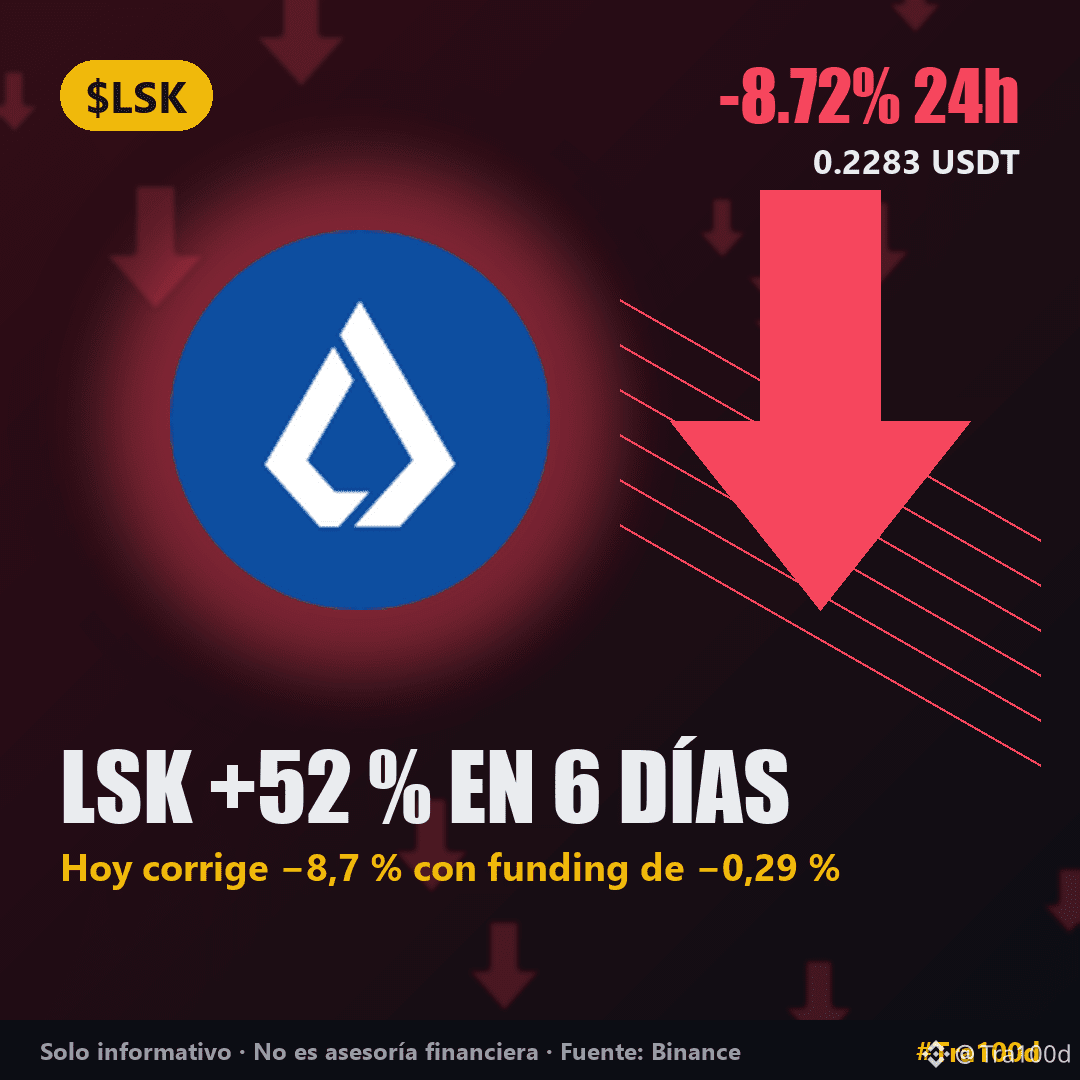
🗞️ $LSK rose +52% in 6 days… and today it’s the biggest decliner of the day.
1️⃣ Price ~ $0.2283 (−8.7% in 24 hours) with $23.3M traded. It’s ~28% below its 20-day high ($0.3188).
2️⃣ Yesterday, its volume was 13.3 times its average daily volume, and futures open interest is up +7.9%.
3️⃣ Its funding rate is −0.29%, very negative: many short sellers are betting it will keep falling, and they’re the ones paying the longs.
Meanwhile, $BTC is at ~$78,045 (+0.7%), and sentiment has risen from 30 to 34/100, still in "fear".
📌 Why it matters: after such a rapid rise, sharp corrections are normal. With a daily ATR of 16.8%, LSK can move ±17% on an ordinary day.
Will LSK return to $0.30 or keep correcting? "RETURNS" or "CORRECTS" 👇
#LSK #Altcoins #Cripto #Trading #Tra100d
⚠️ For informational and educational purposes only; this is not financial advice. Cryptocurrencies are volatile: do your research and trade with caution.
🗞️ $LSK rose +52% in 6 days… and today it’s the biggest decliner of the day.
1️⃣ Price ~ $0.2283 (−8.7% in 24 hours) with $23.3M traded. It’s ~28% below its 20-day high ($0.3188).
2️⃣ Yesterday, its volume was 13.3 times its average daily volume, and futures open interest is up +7.9%.
3️⃣ Its funding rate is −0.29%, very negative: many short sellers are betting it will keep falling, and they’re the ones paying the longs.
Meanwhile, $BTC is at ~$78,045 (+0.7%), and sentiment has risen from 30 to 34/100, still in "fear".
📌 Why it matters: after such a rapid rise, sharp corrections are normal. With a daily ATR of 16.8%, LSK can move ±17% on an ordinary day.
Will LSK return to $0.30 or keep correcting? "RETURNS" or "CORRECTS" 👇
#LSK #Altcoins #Cripto #Trading #Tra100d
⚠️ For informational and educational purposes only; this is not financial advice. Cryptocurrencies are volatile: do your research and trade with caution.
1️⃣ Price ~ $0.2283 (−8.7% in 24 hours) with $23.3M traded. It’s ~28% below its 20-day high ($0.3188).
2️⃣ Yesterday, its volume was 13.3 times its average daily volume, and futures open interest is up +7.9%.
3️⃣ Its funding rate is −0.29%, very negative: many short sellers are betting it will keep falling, and they’re the ones paying the longs.
Meanwhile, $BTC is at ~$78,045 (+0.7%), and sentiment has risen from 30 to 34/100, still in "fear".
📌 Why it matters: after such a rapid rise, sharp corrections are normal. With a daily ATR of 16.8%, LSK can move ±17% on an ordinary day.
Will LSK return to $0.30 or keep correcting? "RETURNS" or "CORRECTS" 👇
#LSK #Altcoins #Cripto #Trading #Tra100d
⚠️ For informational and educational purposes only; this is not financial advice. Cryptocurrencies are volatile: do your research and trade with caution.
116
·
--
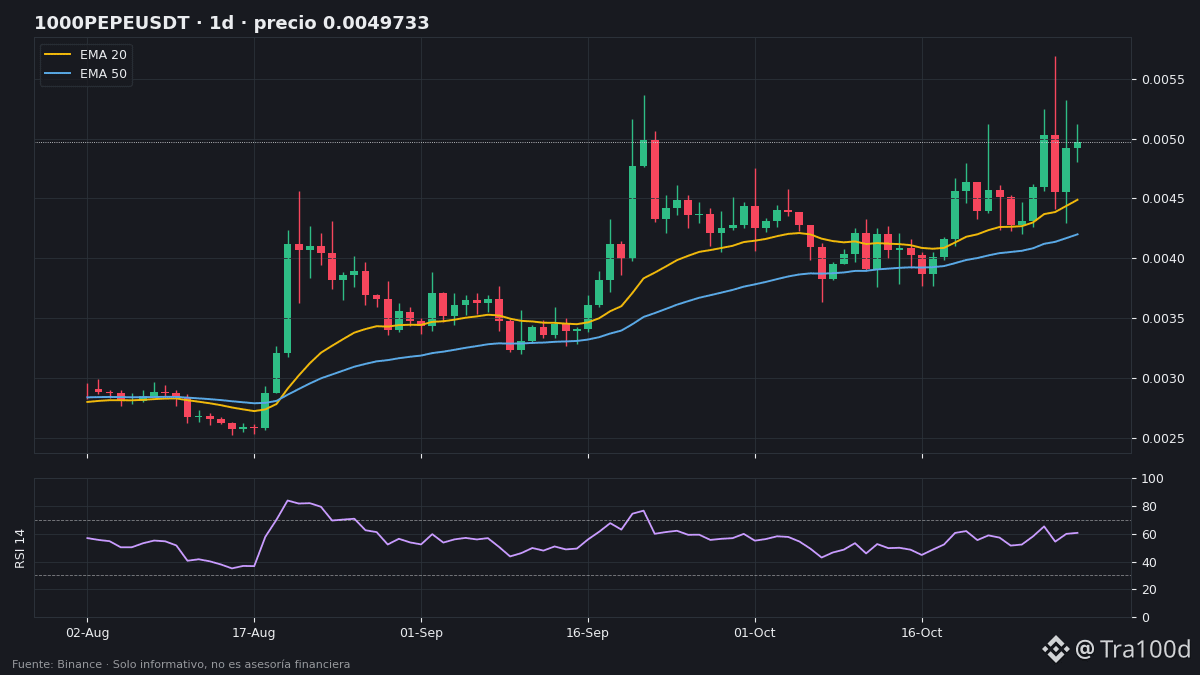
🐸 Meme Sunday: almost all are flat… but $PEPE is the only one in a strong uptrend.
📊 The data (Binance):
• PEPE: ~$0.00000494 (−1.8% in 24h), but +16.2% over the last 6 daily candles.
• By far the most traded meme coin on our list: $42.8M in 24h.
• On the daily chart, it’s above the 20, 50, and 200 EMAs. RSI at 61: strong, not overbought.
• Futures open interest +4.0% and funding +0.01%: positions are coming in without extreme euphoria.
🎯 The challenge is still alive: it’s ~15% below the 20-day high ($0.00000569).
The rest: WIF +1.9%, $DOGE +0.8%, BONK +0.7%, SHIB −0.2%, FLOKI −0.7%.
⚠️ Note: PEPE’s daily ATR is 9.3%: in a single day, it can move that much in either direction.
Will PEPE hit $0.00000569 this week? “YES” or “NO” 👇
#PEPE #Memecoins #DOGE #Cripto #Tra100d
⚠️ For informational and educational purposes only; this is not financial advice. Cryptocurrencies are volatile: do your own research and trade with caution.
🐸 Meme Sunday: almost all are flat… but $PEPE is the only one in a strong uptrend.
📊 The data (Binance):
• PEPE: ~$0.00000494 (−1.8% in 24h), but +16.2% over the last 6 daily candles.
• By far the most traded meme coin on our list: $42.8M in 24h.
• On the daily chart, it’s above the 20, 50, and 200 EMAs. RSI at 61: strong, not overbought.
• Futures open interest +4.0% and funding +0.01%: positions are coming in without extreme euphoria.
🎯 The challenge is still alive: it’s ~15% below the 20-day high ($0.00000569).
The rest: WIF +1.9%, $DOGE +0.8%, BONK +0.7%, SHIB −0.2%, FLOKI −0.7%.
⚠️ Note: PEPE’s daily ATR is 9.3%: in a single day, it can move that much in either direction.
Will PEPE hit $0.00000569 this week? “YES” or “NO” 👇
#PEPE #Memecoins #DOGE #Cripto #Tra100d
⚠️ For informational and educational purposes only; this is not financial advice. Cryptocurrencies are volatile: do your own research and trade with caution.
📊 The data (Binance):
• PEPE: ~$0.00000494 (−1.8% in 24h), but +16.2% over the last 6 daily candles.
• By far the most traded meme coin on our list: $42.8M in 24h.
• On the daily chart, it’s above the 20, 50, and 200 EMAs. RSI at 61: strong, not overbought.
• Futures open interest +4.0% and funding +0.01%: positions are coming in without extreme euphoria.
🎯 The challenge is still alive: it’s ~15% below the 20-day high ($0.00000569).
The rest: WIF +1.9%, $DOGE +0.8%, BONK +0.7%, SHIB −0.2%, FLOKI −0.7%.
⚠️ Note: PEPE’s daily ATR is 9.3%: in a single day, it can move that much in either direction.
Will PEPE hit $0.00000569 this week? “YES” or “NO” 👇
#PEPE #Memecoins #DOGE #Cripto #Tra100d
⚠️ For informational and educational purposes only; this is not financial advice. Cryptocurrencies are volatile: do your own research and trade with caution.
28
·
--
📉 $ETH reaches RSI 30 on the daily chart, but reclaimed a key line: the EMA 200.
📍 Context: two days ago, it lost the EMA 200 and the 20-day low. Today it’s trading at ~$2,246 (+0.03% in 24h), barely ~1% above the EMA 200 ($2,220). It’s down 4.8% over 6 daily candles.
📊 Levels (daily candles, Binance):
• Support: EMA 200 at ~$2,220 and 20-day low at $2,173 (~3% lower).
• Resistance: EMA 20 at ~$2,392 and EMA 50 at ~$2,434.
• RSI: 30, at the oversold threshold.
• ATR: ~$92 (4.1%): a single day could take it from one level to the other.
• Funding −0.006% and open interest +0.5%: positioning is almost neutral.
🟢 Bullish scenario: holding the EMA 200 and reclaiming the 4-hour EMA 20 (~$2,280) opens the way toward $2,324 (4-hour EMA 50), then $2,392. Note: the 4-hour trend is still strongly bearish, with the 4-hour EMA 200 acting as resistance at ~$2,454.
🔴 Bearish scenario: a daily close below $2,220 leaves the $2,173 low as the next level to watch.
👀 What to watch: tomorrow’s Sunday weekly close relative to the EMA 200, and sentiment, which remains in "fear" (30/100).
Will ETH close the week above $2,220? "YES" or "NO" 👇
#ETH #Ethereum #AnalisisTecnico #Cripto #Tra100d
⚠️ For informational and educational purposes only; this is not financial advice. Cryptocurrencies are volatile: do your own research and trade with caution.
📉 $ETH reaches RSI 30 on the daily chart, but reclaimed a key line: the EMA 200.
📍 Context: two days ago, it lost the EMA 200 and the 20-day low. Today it’s trading at ~$2,246 (+0.03% in 24h), barely ~1% above the EMA 200 ($2,220). It’s down 4.8% over 6 daily candles.
📊 Levels (daily candles, Binance):
• Support: EMA 200 at ~$2,220 and 20-day low at $2,173 (~3% lower).
• Resistance: EMA 20 at ~$2,392 and EMA 50 at ~$2,434.
• RSI: 30, at the oversold threshold.
• ATR: ~$92 (4.1%): a single day could take it from one level to the other.
• Funding −0.006% and open interest +0.5%: positioning is almost neutral.
🟢 Bullish scenario: holding the EMA 200 and reclaiming the 4-hour EMA 20 (~$2,280) opens the way toward $2,324 (4-hour EMA 50), then $2,392. Note: the 4-hour trend is still strongly bearish, with the 4-hour EMA 200 acting as resistance at ~$2,454.
🔴 Bearish scenario: a daily close below $2,220 leaves the $2,173 low as the next level to watch.
👀 What to watch: tomorrow’s Sunday weekly close relative to the EMA 200, and sentiment, which remains in "fear" (30/100).
Will ETH close the week above $2,220? "YES" or "NO" 👇
#ETH #Ethereum #AnalisisTecnico #Cripto #Tra100d
⚠️ For informational and educational purposes only; this is not financial advice. Cryptocurrencies are volatile: do your own research and trade with caution.
📍 Context: two days ago, it lost the EMA 200 and the 20-day low. Today it’s trading at ~$2,246 (+0.03% in 24h), barely ~1% above the EMA 200 ($2,220). It’s down 4.8% over 6 daily candles.
📊 Levels (daily candles, Binance):
• Support: EMA 200 at ~$2,220 and 20-day low at $2,173 (~3% lower).
• Resistance: EMA 20 at ~$2,392 and EMA 50 at ~$2,434.
• RSI: 30, at the oversold threshold.
• ATR: ~$92 (4.1%): a single day could take it from one level to the other.
• Funding −0.006% and open interest +0.5%: positioning is almost neutral.
🟢 Bullish scenario: holding the EMA 200 and reclaiming the 4-hour EMA 20 (~$2,280) opens the way toward $2,324 (4-hour EMA 50), then $2,392. Note: the 4-hour trend is still strongly bearish, with the 4-hour EMA 200 acting as resistance at ~$2,454.
🔴 Bearish scenario: a daily close below $2,220 leaves the $2,173 low as the next level to watch.
👀 What to watch: tomorrow’s Sunday weekly close relative to the EMA 200, and sentiment, which remains in "fear" (30/100).
Will ETH close the week above $2,220? "YES" or "NO" 👇
#ETH #Ethereum #AnalisisTecnico #Cripto #Tra100d
⚠️ For informational and educational purposes only; this is not financial advice. Cryptocurrencies are volatile: do your own research and trade with caution.
64
·
--
🚨 Yesterday we asked whether $HYPE was a safe haven or the next to correct: today it’s down −5.6% (~$87.84), about −5% from yesterday’s $92.39. Its volume fell from $185M yesterday morning to $33M.
$TRX is down the most for the second day in a row (−8.9% yesterday): ~$0.3162 (−6.7%), below the 20-candle, 4-hour low ($0.3213) and with funding at −0.102%: shorts are dominating.
Which will bounce first, HYPE or TRX? 👇
#HYPE #TRX #Altcoins #Tra100d
⚠️ For informational and educational purposes only; not financial advice. Cryptocurrencies are volatile: do your own research and trade with caution.
🚨 Yesterday we asked whether $HYPE was a safe haven or the next to correct: today it’s down −5.6% (~$87.84), about −5% from yesterday’s $92.39. Its volume fell from $185M yesterday morning to $33M.
$TRX is down the most for the second day in a row (−8.9% yesterday): ~$0.3162 (−6.7%), below the 20-candle, 4-hour low ($0.3213) and with funding at −0.102%: shorts are dominating.
Which will bounce first, HYPE or TRX? 👇
#HYPE #TRX #Altcoins #Tra100d
⚠️ For informational and educational purposes only; not financial advice. Cryptocurrencies are volatile: do your own research and trade with caution.
$TRX is down the most for the second day in a row (−8.9% yesterday): ~$0.3162 (−6.7%), below the 20-candle, 4-hour low ($0.3213) and with funding at −0.102%: shorts are dominating.
Which will bounce first, HYPE or TRX? 👇
#HYPE #TRX #Altcoins #Tra100d
⚠️ For informational and educational purposes only; not financial advice. Cryptocurrencies are volatile: do your own research and trade with caution.
361
Log in to explore more content
Join global crypto users on Binance Square
⚡️ Get latest and useful information about crypto.
💬 Trusted by the world’s largest crypto exchange.
👍 Discover real insights from verified creators.
Email / Phone number
Trending Topics
BinanceReopensWithdrawalsForMoreAssets
654,567 views
3,207 Discussing
Security Incident | Recovery Update #8: Withdrawals for More Assets to Reopen (2026-11-05)
Binance Announcement
·191 Likes
·668.9k views
BTCRebounds80K
153,956 views
1,480 Discussing
Binance98PercentReplenished
78,443 views
1,009 Discussing