

Marriam Insights
339 Publications

Marriam Insights
Signaler
Bloquer l’utilisateur
🧠 Macro & Crypto Market Analyst
📊 BTC • Gold • Oil • Smart Money Flow
🌍 Global Markets • Market Psychology
✅ Data-Driven Insights | No Hype. Just Facts.
128 Suivis
46 Abonnés
323 J’aime
Publications
Article
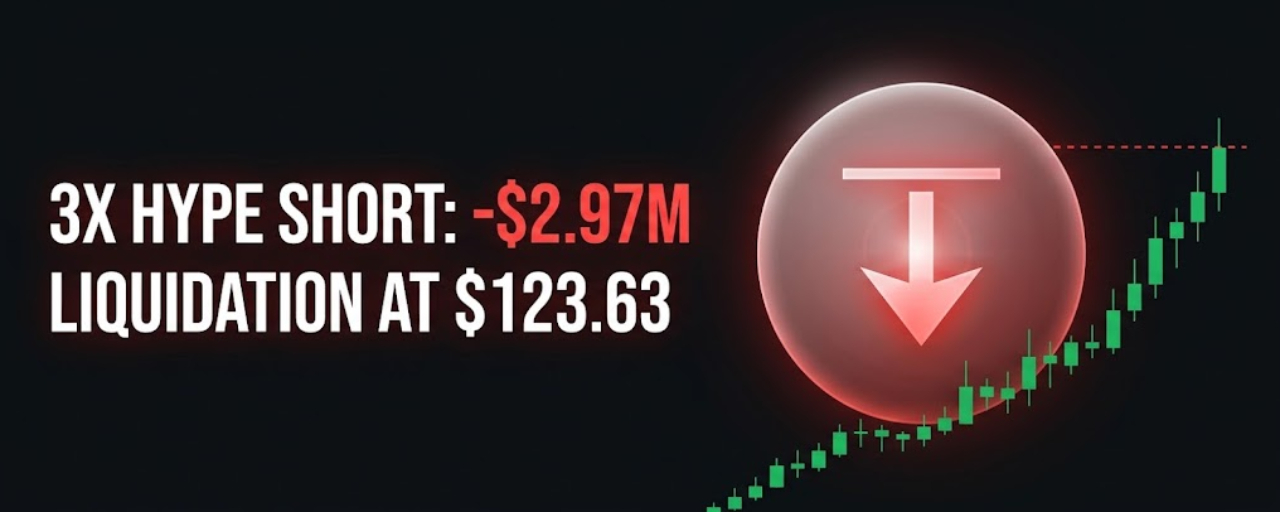
A 3x HYPE Short Is Down $2.97M, and Liquidation Sits at $123.63The trader has still collected over $550K in funding fees. Here's what one stubborn short says about the market.
🚀 HYPE hit a record high of $97.99 last week. While a corporate treasury was buying hundreds of millions of dollars' worth, one trader was quietly betting the other way, and is still doing it.
According to BlockBeats on-chain detection, citing TradingBeats monitoring on September 27, a trader tracked as Loracle holds a 3x leveraged short on 104,600 HYPE. The short was opened at $64.70, the position is worth $9.74 million, and it's showing an unrealized loss of $2.97 million.
🧮 Let's put some numbers around that.
Dividing the position value by the token count implies HYPE is trading around $93 (my own math), which means the price has climbed roughly 44% since this short was opened. The reported liquidation price is $123.63, about a third above that level, and about 26% above HYPE's record high. So, for this trader to get wiped out, HYPE would need to blow well past a peak it set only days ago.
💸 Here's the strange part: the position is losing and paying at the same time.
Perpetual futures have a funding fee, a regular payment between traders that keeps the contract close to the spot price. When more traders are long than short, the longs pay the shorts. This short has collected more than $550,000 in funding income, which tells you something about the market: people have been paying real money just to stay long HYPE. That's a sign of crowded bullish positioning. By my math, though, the income covers less than a fifth of the loss, so it softens the damage without fixing it.
🧠 Why can a position this far underwater stay open?
A plain 3x short with entry at $64.70 would have been liquidated long before the price reached $93. The fact that liquidation sits all the way up at $123.63 suggests the trader has posted a lot more collateral than the position alone needs (that's my inference, not something the tracker says). It's also worth knowing that the same tracker puts this wallet's total unrealized loss at $9.82 million, which it says has narrowed. The tracker doesn't say whether this short is a hedge, a conviction bet, or something else, so any story about the trader's motives is a guess.
📍 Why does this matter for HYPE?
Because a big, short is stored buying pressure. If HYPE keeps rising, shorts eventually have to buy tokens back to close, and that adds demand on the way up. This one is too far from liquidation to trigger a squeeze soon, but it's a visible sign that the record-setting run still has serious skeptics with serious capital.
✅ What this means for you
If you hold HYPE, one trader's short isn't a signal by itself, in either direction. What it tells you is that the market isn't one-sided, even while the price makes new highs.
If you're thinking about shorting a strong asset, this is a useful case study in why it hurts. A short has no ceiling on how much it can lose, and this position needs far more collateral than its size to survive. Nothing here is a recommendation to copy it.
If you're learning to read derivatives, funding rates are a free clue. When longs are paying shorts for weeks at a time, the trade is crowded, which can be a strength while prices rise and a weakness once they don't.
🟢 Bullish scenario (for HYPE)
The token keeps climbing, the short's loss grows, and eventual buybacks from shorts add fuel to a rally that already has treasury buying and protocol demand behind it.
🔴 Risk scenario (for HYPE)
Large holders sell into strength, the price turns back down, and this stubborn short flips from a loss into a profit, with the funding income already in the bank.
👀 Three things to watch
1️⃣ The position itself
Does the trader add, close, or keep holding, and does the reported loss keep changing with the price?
2️⃣ Funding rates
Do longs keep paying shorts, or does the crowded bullish positioning start to unwind?
3️⃣ HYPE versus its record
Does the token retest $97.99 and push through, or stall below it?
💡 The key takeaway
This is one trader's stubborn bet against a record-setting token, and the numbers show both sides of it: losing on price, earning on funding.
The real question is whether this short is early and will be proven right, or simply wrong for now while the trend keeps going.
That is the part worth watching.
This post is for informational and educational purposes only and is not financial advice. Crypto markets are volatile. Always conduct your own research before making financial decisions.
#BinanceSquare #HYPE #Hyperliquid #Whales #Crypto
{spot}(HYPEUSDT)
A 3x HYPE Short Is Down $2.97M, and Liquidation Sits at $123.63
The trader has still collected over $550K in funding fees. Here's what one stubborn short says about the market.
🚀 HYPE hit a record high of $97.99 last week. While a corporate treasury was buying hundreds of millions of dollars' worth, one trader was quietly betting the other way, and is still doing it.
According to BlockBeats on-chain detection, citing TradingBeats monitoring on September 27, a trader tracked as Loracle holds a 3x leveraged short on 104,600 HYPE. The short was opened at $64.70, the position is worth $9.74 million, and it's showing an unrealized loss of $2.97 million.
🧮 Let's put some numbers around that.
Dividing the position value by the token count implies HYPE is trading around $93 (my own math), which means the price has climbed roughly 44% since this short was opened. The reported liquidation price is $123.63, about a third above that level, and about 26% above HYPE's record high. So, for this trader to get wiped out, HYPE would need to blow well past a peak it set only days ago.
💸 Here's the strange part: the position is losing and paying at the same time.
Perpetual futures have a funding fee, a regular payment between traders that keeps the contract close to the spot price. When more traders are long than short, the longs pay the shorts. This short has collected more than $550,000 in funding income, which tells you something about the market: people have been paying real money just to stay long HYPE. That's a sign of crowded bullish positioning. By my math, though, the income covers less than a fifth of the loss, so it softens the damage without fixing it.
🧠 Why can a position this far underwater stay open?
A plain 3x short with entry at $64.70 would have been liquidated long before the price reached $93. The fact that liquidation sits all the way up at $123.63 suggests the trader has posted a lot more collateral than the position alone needs (that's my inference, not something the tracker says). It's also worth knowing that the same tracker puts this wallet's total unrealized loss at $9.82 million, which it says has narrowed. The tracker doesn't say whether this short is a hedge, a conviction bet, or something else, so any story about the trader's motives is a guess.
📍 Why does this matter for HYPE?
Because a big, short is stored buying pressure. If HYPE keeps rising, shorts eventually have to buy tokens back to close, and that adds demand on the way up. This one is too far from liquidation to trigger a squeeze soon, but it's a visible sign that the record-setting run still has serious skeptics with serious capital.
✅ What this means for you
If you hold HYPE, one trader's short isn't a signal by itself, in either direction. What it tells you is that the market isn't one-sided, even while the price makes new highs.
If you're thinking about shorting a strong asset, this is a useful case study in why it hurts. A short has no ceiling on how much it can lose, and this position needs far more collateral than its size to survive. Nothing here is a recommendation to copy it.
If you're learning to read derivatives, funding rates are a free clue. When longs are paying shorts for weeks at a time, the trade is crowded, which can be a strength while prices rise and a weakness once they don't.
🟢 Bullish scenario (for HYPE)
The token keeps climbing, the short's loss grows, and eventual buybacks from shorts add fuel to a rally that already has treasury buying and protocol demand behind it.
🔴 Risk scenario (for HYPE)
Large holders sell into strength, the price turns back down, and this stubborn short flips from a loss into a profit, with the funding income already in the bank.
👀 Three things to watch
1️⃣ The position itself
Does the trader add, close, or keep holding, and does the reported loss keep changing with the price?
2️⃣ Funding rates
Do longs keep paying shorts, or does the crowded bullish positioning start to unwind?
3️⃣ HYPE versus its record
Does the token retest $97.99 and push through, or stall below it?
💡 The key takeaway
This is one trader's stubborn bet against a record-setting token, and the numbers show both sides of it: losing on price, earning on funding.
The real question is whether this short is early and will be proven right, or simply wrong for now while the trend keeps going.
That is the part worth watching.
This post is for informational and educational purposes only and is not financial advice. Crypto markets are volatile. Always conduct your own research before making financial decisions.
#BinanceSquare #HYPE #Hyperliquid #Whales #Crypto
🚀 HYPE hit a record high of $97.99 last week. While a corporate treasury was buying hundreds of millions of dollars' worth, one trader was quietly betting the other way, and is still doing it.
According to BlockBeats on-chain detection, citing TradingBeats monitoring on September 27, a trader tracked as Loracle holds a 3x leveraged short on 104,600 HYPE. The short was opened at $64.70, the position is worth $9.74 million, and it's showing an unrealized loss of $2.97 million.
🧮 Let's put some numbers around that.
Dividing the position value by the token count implies HYPE is trading around $93 (my own math), which means the price has climbed roughly 44% since this short was opened. The reported liquidation price is $123.63, about a third above that level, and about 26% above HYPE's record high. So, for this trader to get wiped out, HYPE would need to blow well past a peak it set only days ago.
💸 Here's the strange part: the position is losing and paying at the same time.
Perpetual futures have a funding fee, a regular payment between traders that keeps the contract close to the spot price. When more traders are long than short, the longs pay the shorts. This short has collected more than $550,000 in funding income, which tells you something about the market: people have been paying real money just to stay long HYPE. That's a sign of crowded bullish positioning. By my math, though, the income covers less than a fifth of the loss, so it softens the damage without fixing it.
🧠 Why can a position this far underwater stay open?
A plain 3x short with entry at $64.70 would have been liquidated long before the price reached $93. The fact that liquidation sits all the way up at $123.63 suggests the trader has posted a lot more collateral than the position alone needs (that's my inference, not something the tracker says). It's also worth knowing that the same tracker puts this wallet's total unrealized loss at $9.82 million, which it says has narrowed. The tracker doesn't say whether this short is a hedge, a conviction bet, or something else, so any story about the trader's motives is a guess.
📍 Why does this matter for HYPE?
Because a big, short is stored buying pressure. If HYPE keeps rising, shorts eventually have to buy tokens back to close, and that adds demand on the way up. This one is too far from liquidation to trigger a squeeze soon, but it's a visible sign that the record-setting run still has serious skeptics with serious capital.
✅ What this means for you
If you hold HYPE, one trader's short isn't a signal by itself, in either direction. What it tells you is that the market isn't one-sided, even while the price makes new highs.
If you're thinking about shorting a strong asset, this is a useful case study in why it hurts. A short has no ceiling on how much it can lose, and this position needs far more collateral than its size to survive. Nothing here is a recommendation to copy it.
If you're learning to read derivatives, funding rates are a free clue. When longs are paying shorts for weeks at a time, the trade is crowded, which can be a strength while prices rise and a weakness once they don't.
🟢 Bullish scenario (for HYPE)
The token keeps climbing, the short's loss grows, and eventual buybacks from shorts add fuel to a rally that already has treasury buying and protocol demand behind it.
🔴 Risk scenario (for HYPE)
Large holders sell into strength, the price turns back down, and this stubborn short flips from a loss into a profit, with the funding income already in the bank.
👀 Three things to watch
1️⃣ The position itself
Does the trader add, close, or keep holding, and does the reported loss keep changing with the price?
2️⃣ Funding rates
Do longs keep paying shorts, or does the crowded bullish positioning start to unwind?
3️⃣ HYPE versus its record
Does the token retest $97.99 and push through, or stall below it?
💡 The key takeaway
This is one trader's stubborn bet against a record-setting token, and the numbers show both sides of it: losing on price, earning on funding.
The real question is whether this short is early and will be proven right, or simply wrong for now while the trend keeps going.
That is the part worth watching.
This post is for informational and educational purposes only and is not financial advice. Crypto markets are volatile. Always conduct your own research before making financial decisions.
#BinanceSquare #HYPE #Hyperliquid #Whales #Crypto
1
76
Vérifié
Article
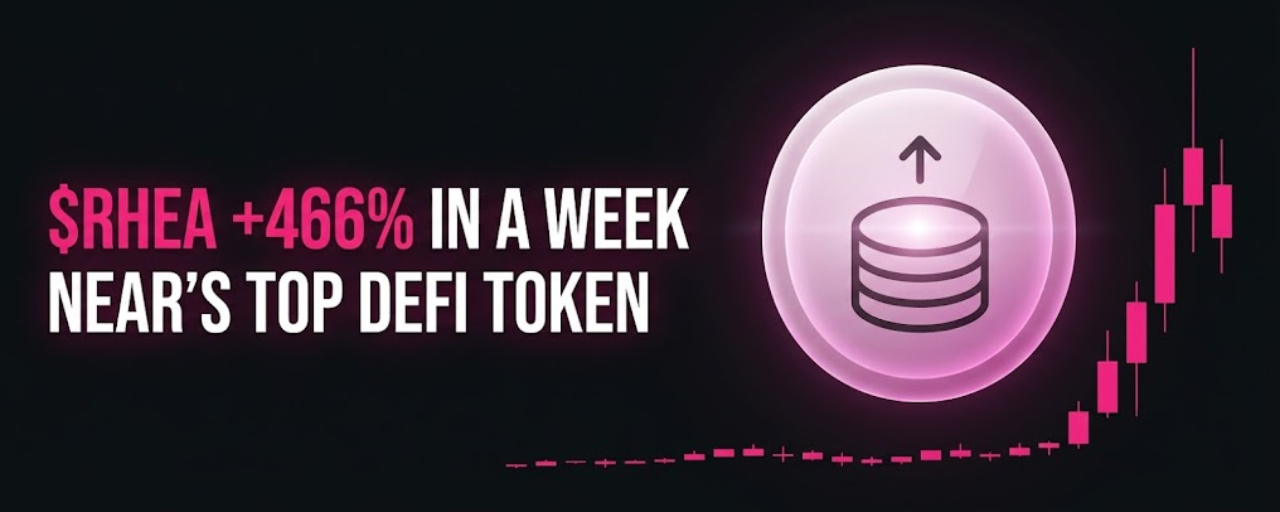
Rhea Finance Is Up 466% in a Week: Is NEAR's DeFi Rally Just Getting Started?The token behind NEAR's largest DeFi hub jumped 131% in 24 hours, right around Bitwise's final NEAR ETF filing. Here's how to read the two together.
🚀 When ETF paperwork lands for a coin, most eyes stay on the coin. This time, some of the sharpest action showed up one layer down.
Rhea Finance's token, RHEA, rose above $0.19, gaining 131% in 24 hours and 466% over seven days, according to Odaily. Odaily also describes the project as the largest DeFi ecosystem project on NEAR.
🧮 First, how big is a move like that?
By my own math, a 466% weekly gain means the token was trading somewhere around 3 to 4 cents a week ago. Percentages this large usually start from a small base, which is why they look dramatic on a chart and why they can reverse just as fast.
🏗️ So what is Rhea Finance?
It was formed in March 2025 when two of NEAR's core DeFi protocols merged: Ref Finance, the network's main decentralized exchange, and Burrow Finance, its main lending market. Rhea now offers lending, yield, a cross-chain bridge and perpetual trading on NEAR. In plain terms, it's one of the places where activity on the chain actually happens, which is why traders treat it as a bet on the whole ecosystem.
📄 Now the other headline.
Bitwise has filed the final prospectus for its NEAR spot ETF, along with a 39-page investment report co-authored by CIO Matt Hougan. According to ChainCatcher, the report lays out three scenarios: a base case of $155 by 2030, a bullish case of $562, and a bearish case of $1.63. In the most optimistic scenario, it compares NEAR to Visa, which processed $15.7 trillion in payments in 2024 and has a market value of about $701 billion.
That range is worth pausing on. Going from $1.63 to $562 covers more than two orders of magnitude, which says more about how uncertain the outcome is than about any single target. It's also a report from the firm that sells the product, so it's worth reading as a case being made, not a neutral forecast.
🧠 Do the two stories actually connect?
Nothing in the reports says the ETF filing drove Rhea's move, so treat any confident claim with caution. One plausible reading is that ETF news puts NEAR back in the spotlight, and traders look for higher-risk ways to play the ecosystem, which is where a DeFi token comes in. Another is simpler: a small token caught momentum and kept climbing. Both can be partly true.
✅ What this means for you
If you hold NEAR, watch what happens to the ecosystem, not just the coin. If activity on apps like Rhea keeps growing, that's a healthier sign than price alone.
If you're on the sidelines, a token that has multiplied several times in a week is a poor place to start. Moves like this tend to be fastest at the top, and small-cap tokens can fall as hard as they rose.
If you're learning to read DeFi tokens, ask whether usage is rising with the price. Lending, trading and fees tell you more about staying power than a percentage gain does.
🟢 Bullish scenario
ETF attention keeps drawing capital into NEAR, real usage on Rhea grows alongside the price, and RHEA consolidates at a higher level instead of fading.
🔴 Risk scenario
Momentum runs out, the small base amplifies the drop, and NEAR itself cools, dragging the ecosystem tokens down further than it moves the main coin.
👀 Three things to watch
1️⃣ Actual usage on Rhea
Does lending and trading activity on the protocol grow, or does only the price move?
2️⃣ NEAR's own trend
Does the main coin hold up as ETF news develops, or does the ecosystem lose its anchor?
3️⃣ Whether the gains hold
Does RHEA keep most of this week's move, or fade back after the 131% day?
💡 The key takeaway
An ETF filing puts a spotlight on a chain, and a DeFi token is one of the fastest, riskiest ways to trade that attention.
The real question is whether NEAR's ecosystem is starting to earn a lasting re-rating, or whether this is a small token riding a wave that will pass.
That is the part worth watching.
This post is for informational and educational purposes only and is not financial advice. Crypto markets are volatile. Always conduct your own research before making financial decisions.
#BinanceSquare #NEAR #DeFi #Altcoins #Crypto
{alpha}(560x4c067de26475e1cefee8b8d1f6e2266b33a2372e)
Rhea Finance Is Up 466% in a Week: Is NEAR's DeFi Rally Just Getting Started?
The token behind NEAR's largest DeFi hub jumped 131% in 24 hours, right around Bitwise's final NEAR ETF filing. Here's how to read the two together.
🚀 When ETF paperwork lands for a coin, most eyes stay on the coin. This time, some of the sharpest action showed up one layer down.
Rhea Finance's token, RHEA, rose above $0.19, gaining 131% in 24 hours and 466% over seven days, according to Odaily. Odaily also describes the project as the largest DeFi ecosystem project on NEAR.
🧮 First, how big is a move like that?
By my own math, a 466% weekly gain means the token was trading somewhere around 3 to 4 cents a week ago. Percentages this large usually start from a small base, which is why they look dramatic on a chart and why they can reverse just as fast.
🏗️ So what is Rhea Finance?
It was formed in March 2025 when two of NEAR's core DeFi protocols merged: Ref Finance, the network's main decentralized exchange, and Burrow Finance, its main lending market. Rhea now offers lending, yield, a cross-chain bridge and perpetual trading on NEAR. In plain terms, it's one of the places where activity on the chain actually happens, which is why traders treat it as a bet on the whole ecosystem.
📄 Now the other headline.
Bitwise has filed the final prospectus for its NEAR spot ETF, along with a 39-page investment report co-authored by CIO Matt Hougan. According to ChainCatcher, the report lays out three scenarios: a base case of $155 by 2030, a bullish case of $562, and a bearish case of $1.63. In the most optimistic scenario, it compares NEAR to Visa, which processed $15.7 trillion in payments in 2024 and has a market value of about $701 billion.
That range is worth pausing on. Going from $1.63 to $562 covers more than two orders of magnitude, which says more about how uncertain the outcome is than about any single target. It's also a report from the firm that sells the product, so it's worth reading as a case being made, not a neutral forecast.
🧠 Do the two stories actually connect?
Nothing in the reports says the ETF filing drove Rhea's move, so treat any confident claim with caution. One plausible reading is that ETF news puts NEAR back in the spotlight, and traders look for higher-risk ways to play the ecosystem, which is where a DeFi token comes in. Another is simpler: a small token caught momentum and kept climbing. Both can be partly true.
✅ What this means for you
If you hold NEAR, watch what happens to the ecosystem, not just the coin. If activity on apps like Rhea keeps growing, that's a healthier sign than price alone.
If you're on the sidelines, a token that has multiplied several times in a week is a poor place to start. Moves like this tend to be fastest at the top, and small-cap tokens can fall as hard as they rose.
If you're learning to read DeFi tokens, ask whether usage is rising with the price. Lending, trading and fees tell you more about staying power than a percentage gain does.
🟢 Bullish scenario
ETF attention keeps drawing capital into NEAR, real usage on Rhea grows alongside the price, and RHEA consolidates at a higher level instead of fading.
🔴 Risk scenario
Momentum runs out, the small base amplifies the drop, and NEAR itself cools, dragging the ecosystem tokens down further than it moves the main coin.
👀 Three things to watch
1️⃣ Actual usage on Rhea
Does lending and trading activity on the protocol grow, or does only the price move?
2️⃣ NEAR's own trend
Does the main coin hold up as ETF news develops, or does the ecosystem lose its anchor?
3️⃣ Whether the gains hold
Does RHEA keep most of this week's move, or fade back after the 131% day?
💡 The key takeaway
An ETF filing puts a spotlight on a chain, and a DeFi token is one of the fastest, riskiest ways to trade that attention.
The real question is whether NEAR's ecosystem is starting to earn a lasting re-rating, or whether this is a small token riding a wave that will pass.
That is the part worth watching.
This post is for informational and educational purposes only and is not financial advice. Crypto markets are volatile. Always conduct your own research before making financial decisions.
#BinanceSquare #NEAR #DeFi #Altcoins #Crypto
🚀 When ETF paperwork lands for a coin, most eyes stay on the coin. This time, some of the sharpest action showed up one layer down.
Rhea Finance's token, RHEA, rose above $0.19, gaining 131% in 24 hours and 466% over seven days, according to Odaily. Odaily also describes the project as the largest DeFi ecosystem project on NEAR.
🧮 First, how big is a move like that?
By my own math, a 466% weekly gain means the token was trading somewhere around 3 to 4 cents a week ago. Percentages this large usually start from a small base, which is why they look dramatic on a chart and why they can reverse just as fast.
🏗️ So what is Rhea Finance?
It was formed in March 2025 when two of NEAR's core DeFi protocols merged: Ref Finance, the network's main decentralized exchange, and Burrow Finance, its main lending market. Rhea now offers lending, yield, a cross-chain bridge and perpetual trading on NEAR. In plain terms, it's one of the places where activity on the chain actually happens, which is why traders treat it as a bet on the whole ecosystem.
📄 Now the other headline.
Bitwise has filed the final prospectus for its NEAR spot ETF, along with a 39-page investment report co-authored by CIO Matt Hougan. According to ChainCatcher, the report lays out three scenarios: a base case of $155 by 2030, a bullish case of $562, and a bearish case of $1.63. In the most optimistic scenario, it compares NEAR to Visa, which processed $15.7 trillion in payments in 2024 and has a market value of about $701 billion.
That range is worth pausing on. Going from $1.63 to $562 covers more than two orders of magnitude, which says more about how uncertain the outcome is than about any single target. It's also a report from the firm that sells the product, so it's worth reading as a case being made, not a neutral forecast.
🧠 Do the two stories actually connect?
Nothing in the reports says the ETF filing drove Rhea's move, so treat any confident claim with caution. One plausible reading is that ETF news puts NEAR back in the spotlight, and traders look for higher-risk ways to play the ecosystem, which is where a DeFi token comes in. Another is simpler: a small token caught momentum and kept climbing. Both can be partly true.
✅ What this means for you
If you hold NEAR, watch what happens to the ecosystem, not just the coin. If activity on apps like Rhea keeps growing, that's a healthier sign than price alone.
If you're on the sidelines, a token that has multiplied several times in a week is a poor place to start. Moves like this tend to be fastest at the top, and small-cap tokens can fall as hard as they rose.
If you're learning to read DeFi tokens, ask whether usage is rising with the price. Lending, trading and fees tell you more about staying power than a percentage gain does.
🟢 Bullish scenario
ETF attention keeps drawing capital into NEAR, real usage on Rhea grows alongside the price, and RHEA consolidates at a higher level instead of fading.
🔴 Risk scenario
Momentum runs out, the small base amplifies the drop, and NEAR itself cools, dragging the ecosystem tokens down further than it moves the main coin.
👀 Three things to watch
1️⃣ Actual usage on Rhea
Does lending and trading activity on the protocol grow, or does only the price move?
2️⃣ NEAR's own trend
Does the main coin hold up as ETF news develops, or does the ecosystem lose its anchor?
3️⃣ Whether the gains hold
Does RHEA keep most of this week's move, or fade back after the 131% day?
💡 The key takeaway
An ETF filing puts a spotlight on a chain, and a DeFi token is one of the fastest, riskiest ways to trade that attention.
The real question is whether NEAR's ecosystem is starting to earn a lasting re-rating, or whether this is a small token riding a wave that will pass.
That is the part worth watching.
This post is for informational and educational purposes only and is not financial advice. Crypto markets are volatile. Always conduct your own research before making financial decisions.
#BinanceSquare #NEAR #DeFi #Altcoins #Crypto
1
1
207
Article
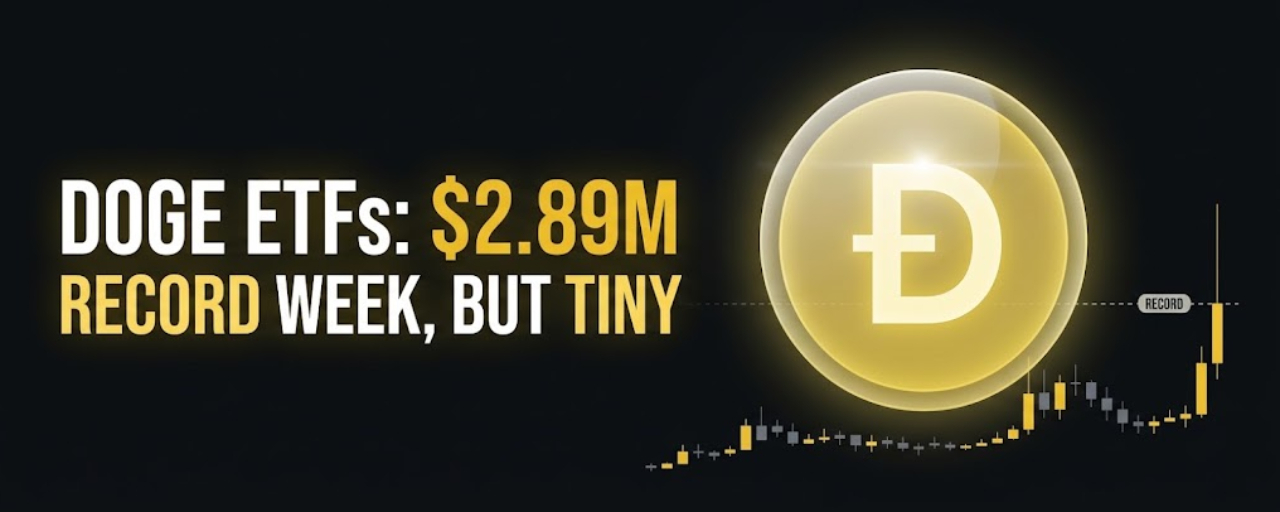
Dogecoin ETFs Just Had Their Best Week Ever at $2.89M, Weeks After Bitwise Moved to Close Its FundIt's a record, but Bitcoin ETFs took in roughly 800 times more. Here's how to read a record this small.
🚀 Two Dogecoin ETF headlines landed within weeks of each other, and both are true.
Headline one: spot Dogecoin ETFs just posted their best week ever, pulling in $2.89 million in net inflows. Headline two: Bitwise, one of the issuers behind the category, is shutting its Dogecoin fund down.
🧮 First, how big is a "record" here?
Smaller than it sounds. For context, all US Dogecoin ETFs combined took in only about $318,000 in net inflows for the whole month of August, according to SoSoValue. So, this week is roughly nine times that, by my math. But last week, Bitcoin ETFs took in $2.39 billion, which is about 800 times more. It's a record for Dogecoin, and a rounding error for the ETF market.
🚪 Now the exit.
Bitwise announced on September 10 that it will liquidate its Dogecoin ETF, ticker BWOW. Its last trading day is expected to be October 14, and remaining shareholders will get cash based on the October 21 net asset value, paid around October 22, with no action needed. The fund launched in late November 2025 and held only about $688,000 in net assets as of September 9. Bitwise said only that it's optimizing its product range and didn't cite assets or trading volume.
📉 The bigger picture is what makes this interesting.
Spot Dogecoin ETFs as a group have racked up about $300 million in trading volume since launching, according to The Block. Comparable Hyperliquid funds are at $2.1 billion, Zcash at $1.5 billion, and Chainlink at $680 million. Dogecoin has one of the biggest names in crypto and one of the loudest communities, yet its ETFs have drawn far less money than products for coins with smaller followings.
🧠 So why a record week right after a closure announcement?
The data doesn't say, so anyone giving you a confident answer is guessing. A few readings are plausible. A price move may have pulled in short-term buyers. Money may be shifting from the closing fund into the remaining ones. Or the base is so small that a few million dollars looks like a surge. What's clear is that a record on a tiny base doesn't prove lasting demand.
✅ What this means for you
If you hold DOGE, ETF flows are a small part of what drives the price, and these funds are too small to move it much either way. Community, liquidity and broader market mood still matter far more.
If you hold BWOW shares, you can sell on the market through October 14 or do nothing and receive the cash payout around October 22. The payout may be taxable, so it's worth checking with a tax professional.
If you're learning to read ETF data, get in the habit of asking "record compared to what?" A record can be a real shift, or just the biggest number in a very small series.
🟢 Bullish scenario
Inflows keep building after BWOW closes, the remaining funds gain traction, and this week turns out to be the start of steadier demand rather than a one-week spike.
🔴 Risk scenario
The record proves to be a one-off, weekly inflows drift back toward last month's levels, and more issuers decide the product isn't worth carrying, which would leave the category thinner still.
👀 Three things to watch
1️⃣ Flows after October 14
Once BWOW stops trading, do weekly inflows into the remaining funds hold up?
2️⃣ The other issuers
Do the remaining Dogecoin ETFs keep drawing money, or does demand stay concentrated in one or two funds?
3️⃣ More closures
Does another issuer follow Bitwise, or does this stay a one-off decision?
💡 The key takeaway
A record week and a fund closure can both be true. They describe a market that is small enough for a few million dollars to look like a milestone.
The question is whether this week marks the start of real ETF demand for Dogecoin, or just the highest point in a very small series.
That is the part worth watching.
This post is for informational and educational purposes only and is not financial advice. Crypto markets are volatile. Always conduct your own research before making financial decisions.
#BinanceSquare #DOGECOİN #DOGE #ETF #Crypto
{spot}(DOGEUSDT)
Dogecoin ETFs Just Had Their Best Week Ever at $2.89M, Weeks After Bitwise Moved to Close Its Fund
It's a record, but Bitcoin ETFs took in roughly 800 times more. Here's how to read a record this small.
🚀 Two Dogecoin ETF headlines landed within weeks of each other, and both are true.
Headline one: spot Dogecoin ETFs just posted their best week ever, pulling in $2.89 million in net inflows. Headline two: Bitwise, one of the issuers behind the category, is shutting its Dogecoin fund down.
🧮 First, how big is a "record" here?
Smaller than it sounds. For context, all US Dogecoin ETFs combined took in only about $318,000 in net inflows for the whole month of August, according to SoSoValue. So, this week is roughly nine times that, by my math. But last week, Bitcoin ETFs took in $2.39 billion, which is about 800 times more. It's a record for Dogecoin, and a rounding error for the ETF market.
🚪 Now the exit.
Bitwise announced on September 10 that it will liquidate its Dogecoin ETF, ticker BWOW. Its last trading day is expected to be October 14, and remaining shareholders will get cash based on the October 21 net asset value, paid around October 22, with no action needed. The fund launched in late November 2025 and held only about $688,000 in net assets as of September 9. Bitwise said only that it's optimizing its product range and didn't cite assets or trading volume.
📉 The bigger picture is what makes this interesting.
Spot Dogecoin ETFs as a group have racked up about $300 million in trading volume since launching, according to The Block. Comparable Hyperliquid funds are at $2.1 billion, Zcash at $1.5 billion, and Chainlink at $680 million. Dogecoin has one of the biggest names in crypto and one of the loudest communities, yet its ETFs have drawn far less money than products for coins with smaller followings.
🧠 So why a record week right after a closure announcement?
The data doesn't say, so anyone giving you a confident answer is guessing. A few readings are plausible. A price move may have pulled in short-term buyers. Money may be shifting from the closing fund into the remaining ones. Or the base is so small that a few million dollars looks like a surge. What's clear is that a record on a tiny base doesn't prove lasting demand.
✅ What this means for you
If you hold DOGE, ETF flows are a small part of what drives the price, and these funds are too small to move it much either way. Community, liquidity and broader market mood still matter far more.
If you hold BWOW shares, you can sell on the market through October 14 or do nothing and receive the cash payout around October 22. The payout may be taxable, so it's worth checking with a tax professional.
If you're learning to read ETF data, get in the habit of asking "record compared to what?" A record can be a real shift, or just the biggest number in a very small series.
🟢 Bullish scenario
Inflows keep building after BWOW closes, the remaining funds gain traction, and this week turns out to be the start of steadier demand rather than a one-week spike.
🔴 Risk scenario
The record proves to be a one-off, weekly inflows drift back toward last month's levels, and more issuers decide the product isn't worth carrying, which would leave the category thinner still.
👀 Three things to watch
1️⃣ Flows after October 14
Once BWOW stops trading, do weekly inflows into the remaining funds hold up?
2️⃣ The other issuers
Do the remaining Dogecoin ETFs keep drawing money, or does demand stay concentrated in one or two funds?
3️⃣ More closures
Does another issuer follow Bitwise, or does this stay a one-off decision?
💡 The key takeaway
A record week and a fund closure can both be true. They describe a market that is small enough for a few million dollars to look like a milestone.
The question is whether this week marks the start of real ETF demand for Dogecoin, or just the highest point in a very small series.
That is the part worth watching.
This post is for informational and educational purposes only and is not financial advice. Crypto markets are volatile. Always conduct your own research before making financial decisions.
#BinanceSquare #DOGECOİN #DOGE #ETF #Crypto
🚀 Two Dogecoin ETF headlines landed within weeks of each other, and both are true.
Headline one: spot Dogecoin ETFs just posted their best week ever, pulling in $2.89 million in net inflows. Headline two: Bitwise, one of the issuers behind the category, is shutting its Dogecoin fund down.
🧮 First, how big is a "record" here?
Smaller than it sounds. For context, all US Dogecoin ETFs combined took in only about $318,000 in net inflows for the whole month of August, according to SoSoValue. So, this week is roughly nine times that, by my math. But last week, Bitcoin ETFs took in $2.39 billion, which is about 800 times more. It's a record for Dogecoin, and a rounding error for the ETF market.
🚪 Now the exit.
Bitwise announced on September 10 that it will liquidate its Dogecoin ETF, ticker BWOW. Its last trading day is expected to be October 14, and remaining shareholders will get cash based on the October 21 net asset value, paid around October 22, with no action needed. The fund launched in late November 2025 and held only about $688,000 in net assets as of September 9. Bitwise said only that it's optimizing its product range and didn't cite assets or trading volume.
📉 The bigger picture is what makes this interesting.
Spot Dogecoin ETFs as a group have racked up about $300 million in trading volume since launching, according to The Block. Comparable Hyperliquid funds are at $2.1 billion, Zcash at $1.5 billion, and Chainlink at $680 million. Dogecoin has one of the biggest names in crypto and one of the loudest communities, yet its ETFs have drawn far less money than products for coins with smaller followings.
🧠 So why a record week right after a closure announcement?
The data doesn't say, so anyone giving you a confident answer is guessing. A few readings are plausible. A price move may have pulled in short-term buyers. Money may be shifting from the closing fund into the remaining ones. Or the base is so small that a few million dollars looks like a surge. What's clear is that a record on a tiny base doesn't prove lasting demand.
✅ What this means for you
If you hold DOGE, ETF flows are a small part of what drives the price, and these funds are too small to move it much either way. Community, liquidity and broader market mood still matter far more.
If you hold BWOW shares, you can sell on the market through October 14 or do nothing and receive the cash payout around October 22. The payout may be taxable, so it's worth checking with a tax professional.
If you're learning to read ETF data, get in the habit of asking "record compared to what?" A record can be a real shift, or just the biggest number in a very small series.
🟢 Bullish scenario
Inflows keep building after BWOW closes, the remaining funds gain traction, and this week turns out to be the start of steadier demand rather than a one-week spike.
🔴 Risk scenario
The record proves to be a one-off, weekly inflows drift back toward last month's levels, and more issuers decide the product isn't worth carrying, which would leave the category thinner still.
👀 Three things to watch
1️⃣ Flows after October 14
Once BWOW stops trading, do weekly inflows into the remaining funds hold up?
2️⃣ The other issuers
Do the remaining Dogecoin ETFs keep drawing money, or does demand stay concentrated in one or two funds?
3️⃣ More closures
Does another issuer follow Bitwise, or does this stay a one-off decision?
💡 The key takeaway
A record week and a fund closure can both be true. They describe a market that is small enough for a few million dollars to look like a milestone.
The question is whether this week marks the start of real ETF demand for Dogecoin, or just the highest point in a very small series.
That is the part worth watching.
This post is for informational and educational purposes only and is not financial advice. Crypto markets are volatile. Always conduct your own research before making financial decisions.
#BinanceSquare #DOGECOİN #DOGE #ETF #Crypto
1
1
36
Article
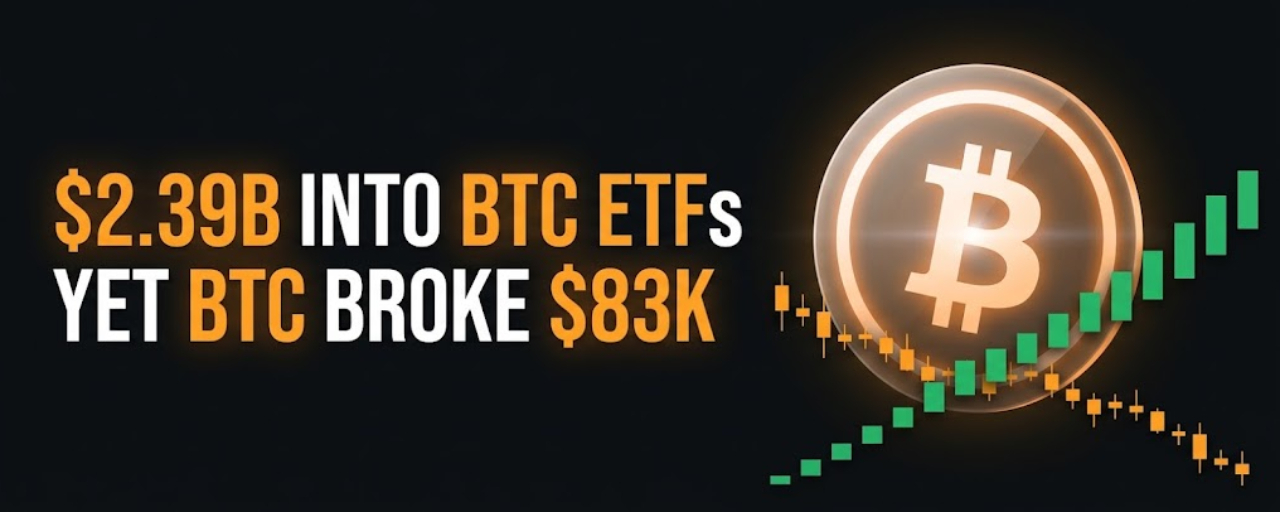
$2.39B Flowed into Bitcoin ETFs This Week, Yet BTC Just Broke Below $83KInstitutions are buying while the price slides. Here's what the split tells you.
🚀 Look at the ETF flow table for last week and you'd think Bitcoin was on a tear. Then you look at the price.
US spot Bitcoin ETFs pulled in $2.39 billion in net inflows across the trading week of September 21-25, according to SoSoValue. Bitcoin, meanwhile, has slipped under $83,000 and was last around $82,987, down about 1.74% on the day.
🏦 First, how lopsided the buying was.
BlackRock's IBIT took in $1.16 billion on its own, pushing its cumulative net inflows to $65.28 billion. Fidelity's FBTC added $702 million. By my math, those two funds alone made up nearly 78% of the week's total. Across the whole group, the biggest weekly outflow was WisdomTree's BTCW at just $4.02 million, basically a rounding error next to the inflows. Total net assets across all the funds now sit at $108.42 billion, about 6.43% of Bitcoin's entire market value.
📉 So why is the price falling anyway?
Part of it is timing, and it matters. The flow data covers Monday to Friday. The latest drop happened after that window closed. Bitcoin was trading around $84,647 on Sunday and briefly touched roughly $87,500 before sliding back, so we don't yet know whether the buying continued into this move. Weekly flows tell you what institutions did last week, not what they're doing on the way down today.
The other part is the backdrop. Bond yields have climbed to their highest levels in years, and traders have been pricing in a tighter path for the Fed. Money getting more expensive tends to weigh on risk assets, even when a big buyer is quietly absorbing supply underneath.
🧠 Why does the split matter?
Because price and flows measure different things. Price reflects everyone, including leveraged traders reacting to headlines within minutes. ETF flows reflect a slower, more deliberate group of buyers who don't have to decide anything in an afternoon. When the two disagree, it's a clue about who is in more of a hurry.
📍 One level keeps coming up.
Fidelity's Jurrien Timmer has said that holding above $80,000 would confirm a double bottom and point toward $100,000. That's one analyst's read, not a guarantee, but it explains why $80,000 has become the line traders are watching. According to BeInCrypto, futures speculators have also been adding to record bullish bets. That's supportive when things go well, and it's the kind of crowded positioning that can unwind quickly when they don't.
✅ What this means for you
If you hold BTC, don't read one weekly flow number as a floor under the price. It's a useful sign of demand, not a promise, and this week's numbers matter more than last weeks.
If you're on the sidelines, a falling price with steady institutional buying can look like an opportunity, but it can also mean sellers are simply bigger than buyers for now. The next few days of flow data will tell you which it is.
If you're learning to read the market, get in the habit of checking the date range on any flow figure. A number that ends Friday can't explain a move that happened on Sunday.
🟢 Bullish scenario
ETF inflows keep coming through this week's dip, Bitcoin holds above $80,000, and the double-bottom idea starts to look right as the rate scare cools.
🔴 Risk scenario
Yields keep climbing, ETF buying slows or flips to outflows, and crowded long positions unwind, pushing Bitcoin through $80,000 and undoing the bullish structure people have been pointing to.
👀 Three things to watch
1️⃣ This week's ETF flows
Do inflows continue while price is weak, or does the pace fade right when it's needed most?
2️⃣ The $80,000 level
Does Bitcoin hold it, or does a break turn the double-bottom view into a failed one?
3️⃣ Rates and Fed expectations
Do yields keep rising, or does the pressure ease and give risk assets some room?
💡 The key takeaway
The price is falling and the buying is real. Both are true, and they aren't necessarily in conflict, because they describe different weeks and different kinds of buyers.
The question is whether institutions keep buying into this weakness, or whether last week turns out to have been the high point of their appetite for now.
That is the part worth watching.
This post is for informational and educational purposes only and is not financial advice. Crypto markets are volatile. Always conduct your own research before making financial decisions.
#BinanceSquare #Bitcoin #BTC #ETF #Crypto
{spot}(BTCUSDT)
$2.39B Flowed into Bitcoin ETFs This Week, Yet BTC Just Broke Below $83K
Institutions are buying while the price slides. Here's what the split tells you.
🚀 Look at the ETF flow table for last week and you'd think Bitcoin was on a tear. Then you look at the price.
US spot Bitcoin ETFs pulled in $2.39 billion in net inflows across the trading week of September 21-25, according to SoSoValue. Bitcoin, meanwhile, has slipped under $83,000 and was last around $82,987, down about 1.74% on the day.
🏦 First, how lopsided the buying was.
BlackRock's IBIT took in $1.16 billion on its own, pushing its cumulative net inflows to $65.28 billion. Fidelity's FBTC added $702 million. By my math, those two funds alone made up nearly 78% of the week's total. Across the whole group, the biggest weekly outflow was WisdomTree's BTCW at just $4.02 million, basically a rounding error next to the inflows. Total net assets across all the funds now sit at $108.42 billion, about 6.43% of Bitcoin's entire market value.
📉 So why is the price falling anyway?
Part of it is timing, and it matters. The flow data covers Monday to Friday. The latest drop happened after that window closed. Bitcoin was trading around $84,647 on Sunday and briefly touched roughly $87,500 before sliding back, so we don't yet know whether the buying continued into this move. Weekly flows tell you what institutions did last week, not what they're doing on the way down today.
The other part is the backdrop. Bond yields have climbed to their highest levels in years, and traders have been pricing in a tighter path for the Fed. Money getting more expensive tends to weigh on risk assets, even when a big buyer is quietly absorbing supply underneath.
🧠 Why does the split matter?
Because price and flows measure different things. Price reflects everyone, including leveraged traders reacting to headlines within minutes. ETF flows reflect a slower, more deliberate group of buyers who don't have to decide anything in an afternoon. When the two disagree, it's a clue about who is in more of a hurry.
📍 One level keeps coming up.
Fidelity's Jurrien Timmer has said that holding above $80,000 would confirm a double bottom and point toward $100,000. That's one analyst's read, not a guarantee, but it explains why $80,000 has become the line traders are watching. According to BeInCrypto, futures speculators have also been adding to record bullish bets. That's supportive when things go well, and it's the kind of crowded positioning that can unwind quickly when they don't.
✅ What this means for you
If you hold BTC, don't read one weekly flow number as a floor under the price. It's a useful sign of demand, not a promise, and this week's numbers matter more than last weeks.
If you're on the sidelines, a falling price with steady institutional buying can look like an opportunity, but it can also mean sellers are simply bigger than buyers for now. The next few days of flow data will tell you which it is.
If you're learning to read the market, get in the habit of checking the date range on any flow figure. A number that ends Friday can't explain a move that happened on Sunday.
🟢 Bullish scenario
ETF inflows keep coming through this week's dip, Bitcoin holds above $80,000, and the double-bottom idea starts to look right as the rate scare cools.
🔴 Risk scenario
Yields keep climbing, ETF buying slows or flips to outflows, and crowded long positions unwind, pushing Bitcoin through $80,000 and undoing the bullish structure people have been pointing to.
👀 Three things to watch
1️⃣ This week's ETF flows
Do inflows continue while price is weak, or does the pace fade right when it's needed most?
2️⃣ The $80,000 level
Does Bitcoin hold it, or does a break turn the double-bottom view into a failed one?
3️⃣ Rates and Fed expectations
Do yields keep rising, or does the pressure ease and give risk assets some room?
💡 The key takeaway
The price is falling and the buying is real. Both are true, and they aren't necessarily in conflict, because they describe different weeks and different kinds of buyers.
The question is whether institutions keep buying into this weakness, or whether last week turns out to have been the high point of their appetite for now.
That is the part worth watching.
This post is for informational and educational purposes only and is not financial advice. Crypto markets are volatile. Always conduct your own research before making financial decisions.
#BinanceSquare #Bitcoin #BTC #ETF #Crypto
🚀 Look at the ETF flow table for last week and you'd think Bitcoin was on a tear. Then you look at the price.
US spot Bitcoin ETFs pulled in $2.39 billion in net inflows across the trading week of September 21-25, according to SoSoValue. Bitcoin, meanwhile, has slipped under $83,000 and was last around $82,987, down about 1.74% on the day.
🏦 First, how lopsided the buying was.
BlackRock's IBIT took in $1.16 billion on its own, pushing its cumulative net inflows to $65.28 billion. Fidelity's FBTC added $702 million. By my math, those two funds alone made up nearly 78% of the week's total. Across the whole group, the biggest weekly outflow was WisdomTree's BTCW at just $4.02 million, basically a rounding error next to the inflows. Total net assets across all the funds now sit at $108.42 billion, about 6.43% of Bitcoin's entire market value.
📉 So why is the price falling anyway?
Part of it is timing, and it matters. The flow data covers Monday to Friday. The latest drop happened after that window closed. Bitcoin was trading around $84,647 on Sunday and briefly touched roughly $87,500 before sliding back, so we don't yet know whether the buying continued into this move. Weekly flows tell you what institutions did last week, not what they're doing on the way down today.
The other part is the backdrop. Bond yields have climbed to their highest levels in years, and traders have been pricing in a tighter path for the Fed. Money getting more expensive tends to weigh on risk assets, even when a big buyer is quietly absorbing supply underneath.
🧠 Why does the split matter?
Because price and flows measure different things. Price reflects everyone, including leveraged traders reacting to headlines within minutes. ETF flows reflect a slower, more deliberate group of buyers who don't have to decide anything in an afternoon. When the two disagree, it's a clue about who is in more of a hurry.
📍 One level keeps coming up.
Fidelity's Jurrien Timmer has said that holding above $80,000 would confirm a double bottom and point toward $100,000. That's one analyst's read, not a guarantee, but it explains why $80,000 has become the line traders are watching. According to BeInCrypto, futures speculators have also been adding to record bullish bets. That's supportive when things go well, and it's the kind of crowded positioning that can unwind quickly when they don't.
✅ What this means for you
If you hold BTC, don't read one weekly flow number as a floor under the price. It's a useful sign of demand, not a promise, and this week's numbers matter more than last weeks.
If you're on the sidelines, a falling price with steady institutional buying can look like an opportunity, but it can also mean sellers are simply bigger than buyers for now. The next few days of flow data will tell you which it is.
If you're learning to read the market, get in the habit of checking the date range on any flow figure. A number that ends Friday can't explain a move that happened on Sunday.
🟢 Bullish scenario
ETF inflows keep coming through this week's dip, Bitcoin holds above $80,000, and the double-bottom idea starts to look right as the rate scare cools.
🔴 Risk scenario
Yields keep climbing, ETF buying slows or flips to outflows, and crowded long positions unwind, pushing Bitcoin through $80,000 and undoing the bullish structure people have been pointing to.
👀 Three things to watch
1️⃣ This week's ETF flows
Do inflows continue while price is weak, or does the pace fade right when it's needed most?
2️⃣ The $80,000 level
Does Bitcoin hold it, or does a break turn the double-bottom view into a failed one?
3️⃣ Rates and Fed expectations
Do yields keep rising, or does the pressure ease and give risk assets some room?
💡 The key takeaway
The price is falling and the buying is real. Both are true, and they aren't necessarily in conflict, because they describe different weeks and different kinds of buyers.
The question is whether institutions keep buying into this weakness, or whether last week turns out to have been the high point of their appetite for now.
That is the part worth watching.
This post is for informational and educational purposes only and is not financial advice. Crypto markets are volatile. Always conduct your own research before making financial decisions.
#BinanceSquare #Bitcoin #BTC #ETF #Crypto
1
1
39
Article
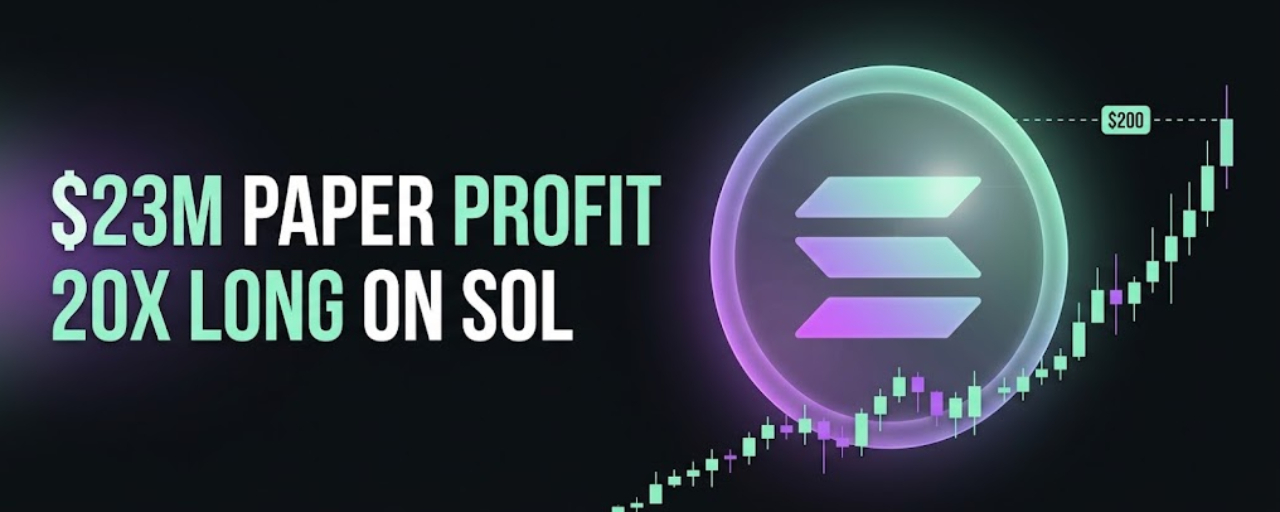
20x Long on 550,087 SOL: A $23M Paper Profit With a $200 TargetSpot SOL ETFs just had their second-biggest week ever. Here's what the whale and the flows say when you read them together.
🚀 Thirty days ago, someone put on a trade that most people would scroll past and call insane.
They went 20x long on 550,087 SOL. Today that position is showing more than $23 million in unrealized profit, and there's a take-profit order parked at $200. If SOL reaches it, Odaily says the gain could top $65 million.
💭 Let's be honest about what that $23 million is.
It's a paper number. Nothing is banked until the position closes, and at 20x leverage the margin for error is thin. A move of around 5% against the trade can be enough to trigger liquidation. So, this wallet isn't sitting on a comfortable cushion. It's winning right now on a very narrow ledge.
🏦 Here's what makes the story bigger than one gambler.
While that wallet was building its bet, slower and much bigger money was moving into Solana too. U.S. spot SOL ETFs pulled in about $188 million this week, per SoSoValue. Only the launch week, at roughly $199 million, was larger. Over the past month the funds have collected $264 million, with six straight days of inflows. Nearly 70% of SOL is now staked, and the price pushed back above $110.
🧠 Why put these two side by side?
Because they don't carry the same kind of risk. The whale can be wiped out by a sharp dip. An ETF buyer can't be liquidated in an afternoon. When a leveraged trader and steady institutional flow are leaning the same direction, it doesn't guarantee a rally, but it does tell you the bullish case isn't resting on one anonymous wallet.
📍 One small detail is worth noticing.
That $200 exit isn't hidden. The whole market can see where a position worth roughly $60 million (my own estimate at around $110 a coin) plans to sell. Levels like that tend to become reference points, and traders will watch how price behaves as SOL gets closer.
✅ What this means for you
If you hold SOL, keep an eye on the ETF flows more than the whale. Weekly inflows are slower and harder to fake than one wallet's trade, so they say more about where sustained demand is coming from.
If you're on the sidelines, don't read a winning 20x trade as a green light to copy it. Whale stories have a survivorship problem. You hear about the ones that worked, not the leveraged wallets that got liquidated without anyone noticing.
If you're learning to read on-chain data, remember that size and durability are different things. A big position shows confidence. Leverage shows how little room that trader has to be wrong.
🟢 Bullish scenario
ETF inflows keep coming, SOL holds above $110 and pushes toward $200, and the whale's target gets hit, which would show that the small trade and the big flows were pointing the same way all along.
🔴 Risk scenario
Broader weakness drags SOL lower (Bitcoin has already slipped under $83,000 today), the leveraged long gets squeezed, and a forced unwind adds selling pressure right when the trade looked strongest.
👀 Three things to watch
1️⃣ The whale itself
Does the wallet keep the long open, add to it, or begin cashing out before $200?
2️⃣ ETF flow direction
After a near-record week, do inflows keep building, or does the pace cool off?
3️⃣ The $110 level
Does Solana keep holding above it while the wider market wobbles?
💡 The key takeaway
This isn't just about one trader getting lucky. It's a leveraged whale bet and a near-record week of ETF inflows landing on the same coin at the same moment, each carrying a very different kind of risk.
The question is whether SOL's move is being carried by durable institutional demand, or by a leveraged position that only works as long as nothing goes wrong.
That is the part worth watching.
This post is for informational and educational purposes only and is not financial advice. Crypto markets are volatile. Always conduct your own research before making financial decisions.
#BinanceSquare #Solana #SOL #Whales #ETF
{spot}(SOLUSDT)
20x Long on 550,087 SOL: A $23M Paper Profit With a $200 Target
Spot SOL ETFs just had their second-biggest week ever. Here's what the whale and the flows say when you read them together.
🚀 Thirty days ago, someone put on a trade that most people would scroll past and call insane.
They went 20x long on 550,087 SOL. Today that position is showing more than $23 million in unrealized profit, and there's a take-profit order parked at $200. If SOL reaches it, Odaily says the gain could top $65 million.
💭 Let's be honest about what that $23 million is.
It's a paper number. Nothing is banked until the position closes, and at 20x leverage the margin for error is thin. A move of around 5% against the trade can be enough to trigger liquidation. So, this wallet isn't sitting on a comfortable cushion. It's winning right now on a very narrow ledge.
🏦 Here's what makes the story bigger than one gambler.
While that wallet was building its bet, slower and much bigger money was moving into Solana too. U.S. spot SOL ETFs pulled in about $188 million this week, per SoSoValue. Only the launch week, at roughly $199 million, was larger. Over the past month the funds have collected $264 million, with six straight days of inflows. Nearly 70% of SOL is now staked, and the price pushed back above $110.
🧠 Why put these two side by side?
Because they don't carry the same kind of risk. The whale can be wiped out by a sharp dip. An ETF buyer can't be liquidated in an afternoon. When a leveraged trader and steady institutional flow are leaning the same direction, it doesn't guarantee a rally, but it does tell you the bullish case isn't resting on one anonymous wallet.
📍 One small detail is worth noticing.
That $200 exit isn't hidden. The whole market can see where a position worth roughly $60 million (my own estimate at around $110 a coin) plans to sell. Levels like that tend to become reference points, and traders will watch how price behaves as SOL gets closer.
✅ What this means for you
If you hold SOL, keep an eye on the ETF flows more than the whale. Weekly inflows are slower and harder to fake than one wallet's trade, so they say more about where sustained demand is coming from.
If you're on the sidelines, don't read a winning 20x trade as a green light to copy it. Whale stories have a survivorship problem. You hear about the ones that worked, not the leveraged wallets that got liquidated without anyone noticing.
If you're learning to read on-chain data, remember that size and durability are different things. A big position shows confidence. Leverage shows how little room that trader has to be wrong.
🟢 Bullish scenario
ETF inflows keep coming, SOL holds above $110 and pushes toward $200, and the whale's target gets hit, which would show that the small trade and the big flows were pointing the same way all along.
🔴 Risk scenario
Broader weakness drags SOL lower (Bitcoin has already slipped under $83,000 today), the leveraged long gets squeezed, and a forced unwind adds selling pressure right when the trade looked strongest.
👀 Three things to watch
1️⃣ The whale itself
Does the wallet keep the long open, add to it, or begin cashing out before $200?
2️⃣ ETF flow direction
After a near-record week, do inflows keep building, or does the pace cool off?
3️⃣ The $110 level
Does Solana keep holding above it while the wider market wobbles?
💡 The key takeaway
This isn't just about one trader getting lucky. It's a leveraged whale bet and a near-record week of ETF inflows landing on the same coin at the same moment, each carrying a very different kind of risk.
The question is whether SOL's move is being carried by durable institutional demand, or by a leveraged position that only works as long as nothing goes wrong.
That is the part worth watching.
This post is for informational and educational purposes only and is not financial advice. Crypto markets are volatile. Always conduct your own research before making financial decisions.
#BinanceSquare #Solana #SOL #Whales #ETF
🚀 Thirty days ago, someone put on a trade that most people would scroll past and call insane.
They went 20x long on 550,087 SOL. Today that position is showing more than $23 million in unrealized profit, and there's a take-profit order parked at $200. If SOL reaches it, Odaily says the gain could top $65 million.
💭 Let's be honest about what that $23 million is.
It's a paper number. Nothing is banked until the position closes, and at 20x leverage the margin for error is thin. A move of around 5% against the trade can be enough to trigger liquidation. So, this wallet isn't sitting on a comfortable cushion. It's winning right now on a very narrow ledge.
🏦 Here's what makes the story bigger than one gambler.
While that wallet was building its bet, slower and much bigger money was moving into Solana too. U.S. spot SOL ETFs pulled in about $188 million this week, per SoSoValue. Only the launch week, at roughly $199 million, was larger. Over the past month the funds have collected $264 million, with six straight days of inflows. Nearly 70% of SOL is now staked, and the price pushed back above $110.
🧠 Why put these two side by side?
Because they don't carry the same kind of risk. The whale can be wiped out by a sharp dip. An ETF buyer can't be liquidated in an afternoon. When a leveraged trader and steady institutional flow are leaning the same direction, it doesn't guarantee a rally, but it does tell you the bullish case isn't resting on one anonymous wallet.
📍 One small detail is worth noticing.
That $200 exit isn't hidden. The whole market can see where a position worth roughly $60 million (my own estimate at around $110 a coin) plans to sell. Levels like that tend to become reference points, and traders will watch how price behaves as SOL gets closer.
✅ What this means for you
If you hold SOL, keep an eye on the ETF flows more than the whale. Weekly inflows are slower and harder to fake than one wallet's trade, so they say more about where sustained demand is coming from.
If you're on the sidelines, don't read a winning 20x trade as a green light to copy it. Whale stories have a survivorship problem. You hear about the ones that worked, not the leveraged wallets that got liquidated without anyone noticing.
If you're learning to read on-chain data, remember that size and durability are different things. A big position shows confidence. Leverage shows how little room that trader has to be wrong.
🟢 Bullish scenario
ETF inflows keep coming, SOL holds above $110 and pushes toward $200, and the whale's target gets hit, which would show that the small trade and the big flows were pointing the same way all along.
🔴 Risk scenario
Broader weakness drags SOL lower (Bitcoin has already slipped under $83,000 today), the leveraged long gets squeezed, and a forced unwind adds selling pressure right when the trade looked strongest.
👀 Three things to watch
1️⃣ The whale itself
Does the wallet keep the long open, add to it, or begin cashing out before $200?
2️⃣ ETF flow direction
After a near-record week, do inflows keep building, or does the pace cool off?
3️⃣ The $110 level
Does Solana keep holding above it while the wider market wobbles?
💡 The key takeaway
This isn't just about one trader getting lucky. It's a leveraged whale bet and a near-record week of ETF inflows landing on the same coin at the same moment, each carrying a very different kind of risk.
The question is whether SOL's move is being carried by durable institutional demand, or by a leveraged position that only works as long as nothing goes wrong.
That is the part worth watching.
This post is for informational and educational purposes only and is not financial advice. Crypto markets are volatile. Always conduct your own research before making financial decisions.
#BinanceSquare #Solana #SOL #Whales #ETF
1
1
31
Article
Bitget's Stolen Funds Are Moving Through THORChain: Can a Decentralized Protocol Say No?The loss grew to about 387.5 million dollars and the swaps have started. Here's the debate, plus a checklist every trader can run on their own exchange.
🚨 Getting hacked is the first problem. Watching your stolen money get swapped into something harder to trace is the second.
On September 24, Bitget detected unauthorized transfers from its hot wallets. The first estimate was 351.6 million dollars. After Zcash and TRON assets were counted, the confirmed loss was revised up to about 387.5 million dollars.
📋 Here's what Bitget has said so far.
Its User Protection Fund held more than 464 million dollars, and the exchange says that covers the loss and that customer balances are protected. The CEO said the attackers moved funds directly out of hot wallets, and that cold wallets and users' private keys were not compromised. She also said she suspects North Korea's Lazarus Group, but non technical evidence has been published yet. For now, that is a working theory, not a conclusion.
🔀 Here's where THORChain, and its token $RUNE, come in.
Stolen funds rarely sit still. They hop across chains and change form. One tracing firm, AMLBot, followed a path from TRX to USDT, across a bridge to Ethereum, into ETH, and then through THORChain into BTC. According to GoPlus Security, about 101.5 BTC, roughly 8.5 million dollars, has already left through THORChain, with about 43 million dollars of XRP mid-swap into BTC. Bitget has formally asked THORChain to deny service to the addresses tied to the breach.
⚖️ Now the real debate: can a decentralized protocol just say no?
GoPlus argues it can. Its case is that THORChain swaps are signed by a fairly small group of validators who coordinate in real time, so releasing funds is an active decision, not a neutral process nobody can stop. It points to the Bybit hack, where the attacker washed all 499,000 ETH in about ten days, mostly through THORChain, generating an estimated 5.9 billion dollars in volume and about 5.5 million dollars in fees.
The other side is the classic one. According to GoPlus, THORChain has likened itself to base layer chains like Bitcoin and Ethereum, which do not choose who uses them. Once a protocol starts blocking addresses, critics say, it stops being neutral infrastructure.
Both positions are serious. That is why this is still unresolved.
🧠 Why does this matter beyond one hack?
Because the same question will come back after every big theft. Where does the line sit between "nobody can censor this" and "we will not knowingly help launder stolen money"? Regulators, exchanges and users are all waiting to see how THORChain answers.
🛡️ Your quick safety checklist (it works on any exchange):
1️⃣ Keep only what you actively trade on an exchange. Long term holdings belong in a wallet where you hold the keys.
2️⃣ Turn on an authenticator app for 2FA, plus withdrawal address whitelisting and an anti-phishing code.
3️⃣ Check whether your exchange publishes proof of reserves and has a protection fund, and read how it actually works.
4️⃣ Have a plan for paused withdrawals. Know where else you could move funds if you had to.
5️⃣ Trust official channels only. After every hack, fake "compensation" and "recovery" links appear.
✅ What this means for you
If you use Bitget, follow its official incident updates and check the current withdrawal status directly, since it may have changed since this was written.
If you use any other exchange, treat this as a free stress test. The checklist above takes about ten minutes and covers most of the avoidable risk.
If you follow $RUNE or DeFi more broadly, this is a live test of how protocols handle stolen money. The outcome could shape how much regulators trust decentralized swaps.
🟢 Best case
THORChain's validators block the flagged addresses, more of the funds get frozen, and the industry gets a clear precedent for the next attack.
🔴 Worst case
The funds are fully laundered, the debate stays unresolved, and the same argument returns after the next hack.
👀 Three things to watch
1️⃣ THORChain's response
Do its validators act on Bitget's request, or stay neutral?
2️⃣ Bitget's full incident report
Does it explain how the hot wallets were breached, and confirm withdrawals are fully restored?
3️⃣ Evidence behind the attribution
Does any technical proof appear for the Lazarus Group theory?
💡 The key takeaway
The hack is one story. The way the money moves afterward is another, and it raises a question the industry has not settled: what does "decentralized" owe the people who get robbed?
Until that is answered, the best protection is the one you control yourself.
That is the part worth watching.
This post is for informational and educational purposes only and is not financial advice. Crypto markets are volatile. Always conduct your own research before making financial decisions.
#BinanceSquare #Bitget #THORChain #CryptoSecurity #Crypto
{spot}(RUNEUSDT)
Bitget's Stolen Funds Are Moving Through THORChain: Can a Decentralized Protocol Say No?
The loss grew to about 387.5 million dollars and the swaps have started. Here's the debate, plus a checklist every trader can run on their own exchange.
🚨 Getting hacked is the first problem. Watching your stolen money get swapped into something harder to trace is the second.
On September 24, Bitget detected unauthorized transfers from its hot wallets. The first estimate was 351.6 million dollars. After Zcash and TRON assets were counted, the confirmed loss was revised up to about 387.5 million dollars.
📋 Here's what Bitget has said so far.
Its User Protection Fund held more than 464 million dollars, and the exchange says that covers the loss and that customer balances are protected. The CEO said the attackers moved funds directly out of hot wallets, and that cold wallets and users' private keys were not compromised. She also said she suspects North Korea's Lazarus Group, but non technical evidence has been published yet. For now, that is a working theory, not a conclusion.
🔀 Here's where THORChain, and its token $RUNE, come in.
Stolen funds rarely sit still. They hop across chains and change form. One tracing firm, AMLBot, followed a path from TRX to USDT, across a bridge to Ethereum, into ETH, and then through THORChain into BTC. According to GoPlus Security, about 101.5 BTC, roughly 8.5 million dollars, has already left through THORChain, with about 43 million dollars of XRP mid-swap into BTC. Bitget has formally asked THORChain to deny service to the addresses tied to the breach.
⚖️ Now the real debate: can a decentralized protocol just say no?
GoPlus argues it can. Its case is that THORChain swaps are signed by a fairly small group of validators who coordinate in real time, so releasing funds is an active decision, not a neutral process nobody can stop. It points to the Bybit hack, where the attacker washed all 499,000 ETH in about ten days, mostly through THORChain, generating an estimated 5.9 billion dollars in volume and about 5.5 million dollars in fees.
The other side is the classic one. According to GoPlus, THORChain has likened itself to base layer chains like Bitcoin and Ethereum, which do not choose who uses them. Once a protocol starts blocking addresses, critics say, it stops being neutral infrastructure.
Both positions are serious. That is why this is still unresolved.
🧠 Why does this matter beyond one hack?
Because the same question will come back after every big theft. Where does the line sit between "nobody can censor this" and "we will not knowingly help launder stolen money"? Regulators, exchanges and users are all waiting to see how THORChain answers.
🛡️ Your quick safety checklist (it works on any exchange):
1️⃣ Keep only what you actively trade on an exchange. Long term holdings belong in a wallet where you hold the keys.
2️⃣ Turn on an authenticator app for 2FA, plus withdrawal address whitelisting and an anti-phishing code.
3️⃣ Check whether your exchange publishes proof of reserves and has a protection fund, and read how it actually works.
4️⃣ Have a plan for paused withdrawals. Know where else you could move funds if you had to.
5️⃣ Trust official channels only. After every hack, fake "compensation" and "recovery" links appear.
✅ What this means for you
If you use Bitget, follow its official incident updates and check the current withdrawal status directly, since it may have changed since this was written.
If you use any other exchange, treat this as a free stress test. The checklist above takes about ten minutes and covers most of the avoidable risk.
If you follow $RUNE or DeFi more broadly, this is a live test of how protocols handle stolen money. The outcome could shape how much regulators trust decentralized swaps.
🟢 Best case
THORChain's validators block the flagged addresses, more of the funds get frozen, and the industry gets a clear precedent for the next attack.
🔴 Worst case
The funds are fully laundered, the debate stays unresolved, and the same argument returns after the next hack.
👀 Three things to watch
1️⃣ THORChain's response
Do its validators act on Bitget's request, or stay neutral?
2️⃣ Bitget's full incident report
Does it explain how the hot wallets were breached, and confirm withdrawals are fully restored?
3️⃣ Evidence behind the attribution
Does any technical proof appear for the Lazarus Group theory?
💡 The key takeaway
The hack is one story. The way the money moves afterward is another, and it raises a question the industry has not settled: what does "decentralized" owe the people who get robbed?
Until that is answered, the best protection is the one you control yourself.
That is the part worth watching.
This post is for informational and educational purposes only and is not financial advice. Crypto markets are volatile. Always conduct your own research before making financial decisions.
#BinanceSquare #Bitget #THORChain #CryptoSecurity #Crypto
🚨 Getting hacked is the first problem. Watching your stolen money get swapped into something harder to trace is the second.
On September 24, Bitget detected unauthorized transfers from its hot wallets. The first estimate was 351.6 million dollars. After Zcash and TRON assets were counted, the confirmed loss was revised up to about 387.5 million dollars.
📋 Here's what Bitget has said so far.
Its User Protection Fund held more than 464 million dollars, and the exchange says that covers the loss and that customer balances are protected. The CEO said the attackers moved funds directly out of hot wallets, and that cold wallets and users' private keys were not compromised. She also said she suspects North Korea's Lazarus Group, but non technical evidence has been published yet. For now, that is a working theory, not a conclusion.
🔀 Here's where THORChain, and its token $RUNE, come in.
Stolen funds rarely sit still. They hop across chains and change form. One tracing firm, AMLBot, followed a path from TRX to USDT, across a bridge to Ethereum, into ETH, and then through THORChain into BTC. According to GoPlus Security, about 101.5 BTC, roughly 8.5 million dollars, has already left through THORChain, with about 43 million dollars of XRP mid-swap into BTC. Bitget has formally asked THORChain to deny service to the addresses tied to the breach.
⚖️ Now the real debate: can a decentralized protocol just say no?
GoPlus argues it can. Its case is that THORChain swaps are signed by a fairly small group of validators who coordinate in real time, so releasing funds is an active decision, not a neutral process nobody can stop. It points to the Bybit hack, where the attacker washed all 499,000 ETH in about ten days, mostly through THORChain, generating an estimated 5.9 billion dollars in volume and about 5.5 million dollars in fees.
The other side is the classic one. According to GoPlus, THORChain has likened itself to base layer chains like Bitcoin and Ethereum, which do not choose who uses them. Once a protocol starts blocking addresses, critics say, it stops being neutral infrastructure.
Both positions are serious. That is why this is still unresolved.
🧠 Why does this matter beyond one hack?
Because the same question will come back after every big theft. Where does the line sit between "nobody can censor this" and "we will not knowingly help launder stolen money"? Regulators, exchanges and users are all waiting to see how THORChain answers.
🛡️ Your quick safety checklist (it works on any exchange):
1️⃣ Keep only what you actively trade on an exchange. Long term holdings belong in a wallet where you hold the keys.
2️⃣ Turn on an authenticator app for 2FA, plus withdrawal address whitelisting and an anti-phishing code.
3️⃣ Check whether your exchange publishes proof of reserves and has a protection fund, and read how it actually works.
4️⃣ Have a plan for paused withdrawals. Know where else you could move funds if you had to.
5️⃣ Trust official channels only. After every hack, fake "compensation" and "recovery" links appear.
✅ What this means for you
If you use Bitget, follow its official incident updates and check the current withdrawal status directly, since it may have changed since this was written.
If you use any other exchange, treat this as a free stress test. The checklist above takes about ten minutes and covers most of the avoidable risk.
If you follow $RUNE or DeFi more broadly, this is a live test of how protocols handle stolen money. The outcome could shape how much regulators trust decentralized swaps.
🟢 Best case
THORChain's validators block the flagged addresses, more of the funds get frozen, and the industry gets a clear precedent for the next attack.
🔴 Worst case
The funds are fully laundered, the debate stays unresolved, and the same argument returns after the next hack.
👀 Three things to watch
1️⃣ THORChain's response
Do its validators act on Bitget's request, or stay neutral?
2️⃣ Bitget's full incident report
Does it explain how the hot wallets were breached, and confirm withdrawals are fully restored?
3️⃣ Evidence behind the attribution
Does any technical proof appear for the Lazarus Group theory?
💡 The key takeaway
The hack is one story. The way the money moves afterward is another, and it raises a question the industry has not settled: what does "decentralized" owe the people who get robbed?
Until that is answered, the best protection is the one you control yourself.
That is the part worth watching.
This post is for informational and educational purposes only and is not financial advice. Crypto markets are volatile. Always conduct your own research before making financial decisions.
#BinanceSquare #Bitget #THORChain #CryptoSecurity #Crypto
1
1
168

Article
China May Let Alibaba and ByteDance Buy Nvidia's New Chip: What It Means for AI and CryptoA report says Beijing intends to approve purchases of the RTX Pro 5500. It isn't confirmed yet, so here's what's known, what isn't, and how to read it.
🧩 A chip headline landed on a Sunday, when regular stock markets were closed. That alone makes it interesting for crypto traders.
On September 27, The Information reported that China may allow companies like Alibaba and ByteDance to buy Nvidia's new RTX Pro 5500. Reuters and Bloomberg carried the story, and Reuters said it could not verify it independently.
📋 Here's what is actually reported.
China's Ministry of Industry and Information Technology recently asked some companies how many of these chips they want and what they would use them for. According to the report, the ministry then told some of them it intends to approve the purchases. That is a strong signal, but it is not an approval.
⚠️ Here's what is not known yet.
Chinese authorities have not confirmed anything. The timing, the quantities and the approval rules are all unclear. Neither Alibaba nor ByteDance had commented when the story broke. Nvidia only said that US firms remain restricted by a mix of older US export controls and China's own limits on imports.
🔍 Here's why the chip itself matters.
The RTX Pro 5500 is a workstation graphics card released this month. It is not Nvidia's top data-center accelerator. But it can still run AI inference in servers, and some industry executives expect it to sit outside US export restrictions. That is why a card like this could open a door that flagship chips cannot.
🧠 Why should a crypto reader care?
Because AI is one of the strongest themes in this market right now, and chip news feeds into it fast. It also follows last week's US-China summit, where both sides extended their trade truce until January and set up a dialogue on AI risks and benefits, with the next exchange expected by November.
And there is a practical angle. Tokenized stocks like NVDAB trade around the clock, so they give traders a way to react to news like this when the normal stock market is shut.
✅ What this means for you
If you follow AI-related tokens, treat this as sentiment, not proof. A report about a workstation chip does not mean demand for any specific token has changed.
If you trade tokenized stocks, remember that weekend headlines can be unconfirmed. Moves on rumor can reverse fast once the facts arrive.
If you just want to understand the market, this is a good example of a chain of signals: Beijing's questions, a possible approval, then a market reaction. Only the first step has been reported so far.
🟢 Bullish scenario
Beijing approves the purchases, trade tensions keep easing, and the AI theme gets fresh support across tech and crypto.
🔴 Risk scenario
The approval never comes, or new limits appear on either side, and the headline fades as an unconfirmed report.
👀 Three things to watch
1️⃣ Official confirmation
Do Chinese authorities or the companies confirm any approval?
2️⃣ Size and timing
How many chips, and when? The report gives no numbers.
3️⃣ The November AI dialogue
Does the US-China exchange on AI risks move forward as planned?
💡 The key takeaway
This is a story about a door that might be opening, not one that has opened.
Until there is confirmation, the useful skill is separating what is reported, what is signaled and what is decided. Only the first two exist right now.
That is the part worth watching.
This post is for informational and educational purposes only and is not financial advice. Crypto markets are volatile. Always conduct your own research before making financial decisions.
#BinanceSquare #Nvidia #Aİ #China #Crypto
{spot}(NVDABUSDT)
China May Let Alibaba and ByteDance Buy Nvidia's New Chip: What It Means for AI and Crypto
A report says Beijing intends to approve purchases of the RTX Pro 5500. It isn't confirmed yet, so here's what's known, what isn't, and how to read it.
🧩 A chip headline landed on a Sunday, when regular stock markets were closed. That alone makes it interesting for crypto traders.
On September 27, The Information reported that China may allow companies like Alibaba and ByteDance to buy Nvidia's new RTX Pro 5500. Reuters and Bloomberg carried the story, and Reuters said it could not verify it independently.
📋 Here's what is actually reported.
China's Ministry of Industry and Information Technology recently asked some companies how many of these chips they want and what they would use them for. According to the report, the ministry then told some of them it intends to approve the purchases. That is a strong signal, but it is not an approval.
⚠️ Here's what is not known yet.
Chinese authorities have not confirmed anything. The timing, the quantities and the approval rules are all unclear. Neither Alibaba nor ByteDance had commented when the story broke. Nvidia only said that US firms remain restricted by a mix of older US export controls and China's own limits on imports.
🔍 Here's why the chip itself matters.
The RTX Pro 5500 is a workstation graphics card released this month. It is not Nvidia's top data-center accelerator. But it can still run AI inference in servers, and some industry executives expect it to sit outside US export restrictions. That is why a card like this could open a door that flagship chips cannot.
🧠 Why should a crypto reader care?
Because AI is one of the strongest themes in this market right now, and chip news feeds into it fast. It also follows last week's US-China summit, where both sides extended their trade truce until January and set up a dialogue on AI risks and benefits, with the next exchange expected by November.
And there is a practical angle. Tokenized stocks like NVDAB trade around the clock, so they give traders a way to react to news like this when the normal stock market is shut.
✅ What this means for you
If you follow AI-related tokens, treat this as sentiment, not proof. A report about a workstation chip does not mean demand for any specific token has changed.
If you trade tokenized stocks, remember that weekend headlines can be unconfirmed. Moves on rumor can reverse fast once the facts arrive.
If you just want to understand the market, this is a good example of a chain of signals: Beijing's questions, a possible approval, then a market reaction. Only the first step has been reported so far.
🟢 Bullish scenario
Beijing approves the purchases, trade tensions keep easing, and the AI theme gets fresh support across tech and crypto.
🔴 Risk scenario
The approval never comes, or new limits appear on either side, and the headline fades as an unconfirmed report.
👀 Three things to watch
1️⃣ Official confirmation
Do Chinese authorities or the companies confirm any approval?
2️⃣ Size and timing
How many chips, and when? The report gives no numbers.
3️⃣ The November AI dialogue
Does the US-China exchange on AI risks move forward as planned?
💡 The key takeaway
This is a story about a door that might be opening, not one that has opened.
Until there is confirmation, the useful skill is separating what is reported, what is signaled and what is decided. Only the first two exist right now.
That is the part worth watching.
This post is for informational and educational purposes only and is not financial advice. Crypto markets are volatile. Always conduct your own research before making financial decisions.
#BinanceSquare #Nvidia #Aİ #China #Crypto
🧩 A chip headline landed on a Sunday, when regular stock markets were closed. That alone makes it interesting for crypto traders.
On September 27, The Information reported that China may allow companies like Alibaba and ByteDance to buy Nvidia's new RTX Pro 5500. Reuters and Bloomberg carried the story, and Reuters said it could not verify it independently.
📋 Here's what is actually reported.
China's Ministry of Industry and Information Technology recently asked some companies how many of these chips they want and what they would use them for. According to the report, the ministry then told some of them it intends to approve the purchases. That is a strong signal, but it is not an approval.
⚠️ Here's what is not known yet.
Chinese authorities have not confirmed anything. The timing, the quantities and the approval rules are all unclear. Neither Alibaba nor ByteDance had commented when the story broke. Nvidia only said that US firms remain restricted by a mix of older US export controls and China's own limits on imports.
🔍 Here's why the chip itself matters.
The RTX Pro 5500 is a workstation graphics card released this month. It is not Nvidia's top data-center accelerator. But it can still run AI inference in servers, and some industry executives expect it to sit outside US export restrictions. That is why a card like this could open a door that flagship chips cannot.
🧠 Why should a crypto reader care?
Because AI is one of the strongest themes in this market right now, and chip news feeds into it fast. It also follows last week's US-China summit, where both sides extended their trade truce until January and set up a dialogue on AI risks and benefits, with the next exchange expected by November.
And there is a practical angle. Tokenized stocks like NVDAB trade around the clock, so they give traders a way to react to news like this when the normal stock market is shut.
✅ What this means for you
If you follow AI-related tokens, treat this as sentiment, not proof. A report about a workstation chip does not mean demand for any specific token has changed.
If you trade tokenized stocks, remember that weekend headlines can be unconfirmed. Moves on rumor can reverse fast once the facts arrive.
If you just want to understand the market, this is a good example of a chain of signals: Beijing's questions, a possible approval, then a market reaction. Only the first step has been reported so far.
🟢 Bullish scenario
Beijing approves the purchases, trade tensions keep easing, and the AI theme gets fresh support across tech and crypto.
🔴 Risk scenario
The approval never comes, or new limits appear on either side, and the headline fades as an unconfirmed report.
👀 Three things to watch
1️⃣ Official confirmation
Do Chinese authorities or the companies confirm any approval?
2️⃣ Size and timing
How many chips, and when? The report gives no numbers.
3️⃣ The November AI dialogue
Does the US-China exchange on AI risks move forward as planned?
💡 The key takeaway
This is a story about a door that might be opening, not one that has opened.
Until there is confirmation, the useful skill is separating what is reported, what is signaled and what is decided. Only the first two exist right now.
That is the part worth watching.
This post is for informational and educational purposes only and is not financial advice. Crypto markets are volatile. Always conduct your own research before making financial decisions.
#BinanceSquare #Nvidia #Aİ #China #Crypto
1
1
35
Article
The Fed Just Proposed Its Stablecoin Rulebook: What Changes for Stablecoin HoldersFull reserve backing, capital rules and a bank approval path under the GENIUS Act. Here's what the proposal actually says, and what it doesn't.
🏛️ A stablecoin looks simple. One token, one dollar. The rulebook behind it just got a lot more detailed.
On Thursday, September 24, the Federal Reserve Board asked the public for comment on two proposals. Together they turn the GENIUS Act, the stablecoin law signed in July 2025, into specific rules for the issuers the Fed supervises.
📋 Here's what the first proposal says.
Issuers would have to back every token fully with approved reserve assets. Think short-term Treasury bills and other high-quality, liquid assets. According to the Fed's staff memo, that includes cash, balances at the Fed, insured deposits, and Treasuries maturing within 93 days. The proposal also adds standard capital requirements, risk management standards, and rules for the firms that hold the reserves.
🏦 Here's what the second proposal says.
It creates an application process for banks that want to issue payment stablecoins. Applicants would submit a business plan and financial information, and the process includes appeals and hearings. An insured state member bank would need Fed approval before a subsidiary could issue stablecoins.
⚠️ Now the part most headlines skip.
This is a proposal, not a final rule. The 60-day comment period only starts once the notices are published in the Federal Register, and the rules can still change. It also applies to issuers under the Fed's supervision, so whether a specific stablecoin is covered depends on who issues it. And a payment stablecoin under these rules would not become an insured bank deposit.
🧠 Why does it still matter?
Because it is one piece of a bigger rollout. The OCC is reportedly racing to finalize its own rules by November, ahead of a January deadline in the law. The Treasury has separately proposed rules that would bar platforms from selling noncompliant stablecoins to US customers.
Put together, the direction is clear. Stablecoins are being pulled inside the regulated financial system, and banks are being given a formal path in. It fits what you have seen elsewhere this month, from the ECB's Pontes launch to the UK bank tokenized deposit pilot and the US Clearing House network. Banks are building their own digital money.
✅ What this means for you
If you hold stablecoins like $USDC, nothing changes today. But it is worth knowing that clear reserve rules are meant to make the "is it really backed?" question easier to answer over time.
If you park funds in stablecoins on exchanges, watch which tokens end up compliant once the rules are final. Platforms may have to stop selling ones that are not, so your choice of stablecoin could matter more than it does now.
If you follow tokenization and bank adoption, this is a signal, not a trade. It shows regulators building the road that bank-issued digital money will run on.
🟢 Bullish scenario
Clear, consistent rules give banks and large institutions the confidence to enter, more compliant stablecoins launch, and the whole category grows on firmer ground.
🔴 Risk scenario
Strict requirements raise costs and push smaller issuers out, final rules from different agencies do not line up, and the timeline drags on.
👀 Three things to watch
1️⃣ Federal Register publication
When does the 60-day comment window actually open, and what do issuers and banks push back on?
2️⃣ The OCC's final rules
Does the November target hold, and do its rules match the Fed's approach?
3️⃣ First bank applications
Which banks apply first once the process is final?
💡 The key takeaway
This is not the end of the stablecoin story. It is the rulebook being written in public.
The proposal sets a high bar on reserves and opens a door for banks, but nothing is final yet. The real question is whether the finished rules make stablecoins safer and easier to use, or simply narrower and more expensive.
That is the part worth watching.
This post is for informational and educational purposes only and is not financial advice. Crypto markets are volatile. Always conduct your own research before making financial decisions.
#BinanceSquare #Stablecoins #GENIUSAct #Fed #Crypto
{spot}(USDCUSDT)
The Fed Just Proposed Its Stablecoin Rulebook: What Changes for Stablecoin Holders
Full reserve backing, capital rules and a bank approval path under the GENIUS Act. Here's what the proposal actually says, and what it doesn't.
🏛️ A stablecoin looks simple. One token, one dollar. The rulebook behind it just got a lot more detailed.
On Thursday, September 24, the Federal Reserve Board asked the public for comment on two proposals. Together they turn the GENIUS Act, the stablecoin law signed in July 2025, into specific rules for the issuers the Fed supervises.
📋 Here's what the first proposal says.
Issuers would have to back every token fully with approved reserve assets. Think short-term Treasury bills and other high-quality, liquid assets. According to the Fed's staff memo, that includes cash, balances at the Fed, insured deposits, and Treasuries maturing within 93 days. The proposal also adds standard capital requirements, risk management standards, and rules for the firms that hold the reserves.
🏦 Here's what the second proposal says.
It creates an application process for banks that want to issue payment stablecoins. Applicants would submit a business plan and financial information, and the process includes appeals and hearings. An insured state member bank would need Fed approval before a subsidiary could issue stablecoins.
⚠️ Now the part most headlines skip.
This is a proposal, not a final rule. The 60-day comment period only starts once the notices are published in the Federal Register, and the rules can still change. It also applies to issuers under the Fed's supervision, so whether a specific stablecoin is covered depends on who issues it. And a payment stablecoin under these rules would not become an insured bank deposit.
🧠 Why does it still matter?
Because it is one piece of a bigger rollout. The OCC is reportedly racing to finalize its own rules by November, ahead of a January deadline in the law. The Treasury has separately proposed rules that would bar platforms from selling noncompliant stablecoins to US customers.
Put together, the direction is clear. Stablecoins are being pulled inside the regulated financial system, and banks are being given a formal path in. It fits what you have seen elsewhere this month, from the ECB's Pontes launch to the UK bank tokenized deposit pilot and the US Clearing House network. Banks are building their own digital money.
✅ What this means for you
If you hold stablecoins like $USDC, nothing changes today. But it is worth knowing that clear reserve rules are meant to make the "is it really backed?" question easier to answer over time.
If you park funds in stablecoins on exchanges, watch which tokens end up compliant once the rules are final. Platforms may have to stop selling ones that are not, so your choice of stablecoin could matter more than it does now.
If you follow tokenization and bank adoption, this is a signal, not a trade. It shows regulators building the road that bank-issued digital money will run on.
🟢 Bullish scenario
Clear, consistent rules give banks and large institutions the confidence to enter, more compliant stablecoins launch, and the whole category grows on firmer ground.
🔴 Risk scenario
Strict requirements raise costs and push smaller issuers out, final rules from different agencies do not line up, and the timeline drags on.
👀 Three things to watch
1️⃣ Federal Register publication
When does the 60-day comment window actually open, and what do issuers and banks push back on?
2️⃣ The OCC's final rules
Does the November target hold, and do its rules match the Fed's approach?
3️⃣ First bank applications
Which banks apply first once the process is final?
💡 The key takeaway
This is not the end of the stablecoin story. It is the rulebook being written in public.
The proposal sets a high bar on reserves and opens a door for banks, but nothing is final yet. The real question is whether the finished rules make stablecoins safer and easier to use, or simply narrower and more expensive.
That is the part worth watching.
This post is for informational and educational purposes only and is not financial advice. Crypto markets are volatile. Always conduct your own research before making financial decisions.
#BinanceSquare #Stablecoins #GENIUSAct #Fed #Crypto
🏛️ A stablecoin looks simple. One token, one dollar. The rulebook behind it just got a lot more detailed.
On Thursday, September 24, the Federal Reserve Board asked the public for comment on two proposals. Together they turn the GENIUS Act, the stablecoin law signed in July 2025, into specific rules for the issuers the Fed supervises.
📋 Here's what the first proposal says.
Issuers would have to back every token fully with approved reserve assets. Think short-term Treasury bills and other high-quality, liquid assets. According to the Fed's staff memo, that includes cash, balances at the Fed, insured deposits, and Treasuries maturing within 93 days. The proposal also adds standard capital requirements, risk management standards, and rules for the firms that hold the reserves.
🏦 Here's what the second proposal says.
It creates an application process for banks that want to issue payment stablecoins. Applicants would submit a business plan and financial information, and the process includes appeals and hearings. An insured state member bank would need Fed approval before a subsidiary could issue stablecoins.
⚠️ Now the part most headlines skip.
This is a proposal, not a final rule. The 60-day comment period only starts once the notices are published in the Federal Register, and the rules can still change. It also applies to issuers under the Fed's supervision, so whether a specific stablecoin is covered depends on who issues it. And a payment stablecoin under these rules would not become an insured bank deposit.
🧠 Why does it still matter?
Because it is one piece of a bigger rollout. The OCC is reportedly racing to finalize its own rules by November, ahead of a January deadline in the law. The Treasury has separately proposed rules that would bar platforms from selling noncompliant stablecoins to US customers.
Put together, the direction is clear. Stablecoins are being pulled inside the regulated financial system, and banks are being given a formal path in. It fits what you have seen elsewhere this month, from the ECB's Pontes launch to the UK bank tokenized deposit pilot and the US Clearing House network. Banks are building their own digital money.
✅ What this means for you
If you hold stablecoins like $USDC, nothing changes today. But it is worth knowing that clear reserve rules are meant to make the "is it really backed?" question easier to answer over time.
If you park funds in stablecoins on exchanges, watch which tokens end up compliant once the rules are final. Platforms may have to stop selling ones that are not, so your choice of stablecoin could matter more than it does now.
If you follow tokenization and bank adoption, this is a signal, not a trade. It shows regulators building the road that bank-issued digital money will run on.
🟢 Bullish scenario
Clear, consistent rules give banks and large institutions the confidence to enter, more compliant stablecoins launch, and the whole category grows on firmer ground.
🔴 Risk scenario
Strict requirements raise costs and push smaller issuers out, final rules from different agencies do not line up, and the timeline drags on.
👀 Three things to watch
1️⃣ Federal Register publication
When does the 60-day comment window actually open, and what do issuers and banks push back on?
2️⃣ The OCC's final rules
Does the November target hold, and do its rules match the Fed's approach?
3️⃣ First bank applications
Which banks apply first once the process is final?
💡 The key takeaway
This is not the end of the stablecoin story. It is the rulebook being written in public.
The proposal sets a high bar on reserves and opens a door for banks, but nothing is final yet. The real question is whether the finished rules make stablecoins safer and easier to use, or simply narrower and more expensive.
That is the part worth watching.
This post is for informational and educational purposes only and is not financial advice. Crypto markets are volatile. Always conduct your own research before making financial decisions.
#BinanceSquare #Stablecoins #GENIUSAct #Fed #Crypto
1
1
54

Article
Saylor Posts "Even More Orange": How to Read Strategy's Bitcoin Hint Before the FilingTwo of Strategy's last four weekly updates showed no Bitcoin purchase. Here's what the hint really signals, and what to check on filing day.
🟠 One caption can move a whole market. This time it was three words: "Even more orange."
Michael Saylor posted another Bitcoin Tracker update with that line, and Strategy has usually filed its holdings update the day after a post like this. At the time of writing, the filing is not out yet. So instead of guessing the result, let's look at how to read the hint properly.
📊 Here's the part most people skip: a hint is not a receipt.
Look at Strategy's last four weekly updates in its SEC filings:
Aug 31: bought 4,603 BTC
Sept 8: no Bitcoin purchase, only preferred stock buybacks
Sept 14: no Bitcoin purchase, only preferred stock buybacks
Sept 21: bought 950 BTC
Two buying weeks, two quiet ones. Whatever the caption says, the filing tells the real story.
💰 Here's what the last purchase looked like.
Strategy bought 950 BTC for about 75.7 million dollars, an average of roughly 79,670 per coin. That took its holdings to 846,000 BTC, close to 4% of the entire Bitcoin supply. It paid with cash on hand, not new share sales. In the same week it also spent 174 million dollars buying back its own STRC preferred shares, part of an effort to lift that stock back above par so it can help fund future Bitcoin purchases.
🧠 Why does that change how you read Monday's filing?
Because a filing has two layers. There's the Bitcoin line everyone screenshots, and there's the balance sheet activity underneath. A week can be quiet on Bitcoin and still be busy behind the scenes. As of Sept 20, Strategy held about 1.05 billion dollars in cash for purchases and buybacks, plus a reserve of about 5.04 billion dollars set aside for dividends and interest. Earlier this year it also sold Bitcoin four times to build that reserve.
So "more orange" is a good sign of intent. It is not a guarantee of a buy.
✅ What this means for you
If you're holding, treat the caption as sentiment and the filing as fact. Don't change your plan because of a chart post.
If you're on the sidelines, $BTC is trading around 83,000 after touching roughly 87,500 last week, and it is still above Strategy's average cost of about 75,400. Buying because Saylor posted a chart is buying a rumor. Waiting for the filing and watching how price reacts gives you real information.
If you're trading, watch the size, not just the yes or no. A small purchase after a big rally says something very different from a large one. Also check whether the money came from cash or from new share sales, since that tells you how comfortable the company is buying at these levels.
🟢 Bullish scenario
The filing confirms another purchase, holdings move closer to the June record of 847,363 BTC, and other treasury buyers read it as a sign that conviction is holding.
🔴 Risk scenario
The filing shows only buybacks or another sale, the hint gets written off as noise, and sentiment cools while Bitcoin is already slipping.
👀 Three things to watch
1️⃣ Did Strategy buy Bitcoin at all?
Or was it another week of preferred stock buybacks only?
2️⃣ Where did the money come from?
Cash on hand is a very different signal from new share sales.
3️⃣ Distance to the record
Holdings were 1,363 BTC below the June high at the last filing. Does this week close that gap?
💡 The key takeaway
The caption is the trailer. The filing is the movie.
Most traders react to the trailer. The edge is in reading both separately, and in remembering that two of the last four weeks had no Bitcoin buy at all.
That is the part worth watching.
This post is for informational and educational purposes only and is not financial advice. Crypto markets are volatile. Always conduct your own research before making financial decisions.
#BinanceSquare #Bitcoin #BTC #Strategy #Saylor
{spot}(BTCUSDT)
Saylor Posts "Even More Orange": How to Read Strategy's Bitcoin Hint Before the Filing
Two of Strategy's last four weekly updates showed no Bitcoin purchase. Here's what the hint really signals, and what to check on filing day.
🟠 One caption can move a whole market. This time it was three words: "Even more orange."
Michael Saylor posted another Bitcoin Tracker update with that line, and Strategy has usually filed its holdings update the day after a post like this. At the time of writing, the filing is not out yet. So instead of guessing the result, let's look at how to read the hint properly.
📊 Here's the part most people skip: a hint is not a receipt.
Look at Strategy's last four weekly updates in its SEC filings:
Aug 31: bought 4,603 BTC
Sept 8: no Bitcoin purchase, only preferred stock buybacks
Sept 14: no Bitcoin purchase, only preferred stock buybacks
Sept 21: bought 950 BTC
Two buying weeks, two quiet ones. Whatever the caption says, the filing tells the real story.
💰 Here's what the last purchase looked like.
Strategy bought 950 BTC for about 75.7 million dollars, an average of roughly 79,670 per coin. That took its holdings to 846,000 BTC, close to 4% of the entire Bitcoin supply. It paid with cash on hand, not new share sales. In the same week it also spent 174 million dollars buying back its own STRC preferred shares, part of an effort to lift that stock back above par so it can help fund future Bitcoin purchases.
🧠 Why does that change how you read Monday's filing?
Because a filing has two layers. There's the Bitcoin line everyone screenshots, and there's the balance sheet activity underneath. A week can be quiet on Bitcoin and still be busy behind the scenes. As of Sept 20, Strategy held about 1.05 billion dollars in cash for purchases and buybacks, plus a reserve of about 5.04 billion dollars set aside for dividends and interest. Earlier this year it also sold Bitcoin four times to build that reserve.
So "more orange" is a good sign of intent. It is not a guarantee of a buy.
✅ What this means for you
If you're holding, treat the caption as sentiment and the filing as fact. Don't change your plan because of a chart post.
If you're on the sidelines, $BTC is trading around 83,000 after touching roughly 87,500 last week, and it is still above Strategy's average cost of about 75,400. Buying because Saylor posted a chart is buying a rumor. Waiting for the filing and watching how price reacts gives you real information.
If you're trading, watch the size, not just the yes or no. A small purchase after a big rally says something very different from a large one. Also check whether the money came from cash or from new share sales, since that tells you how comfortable the company is buying at these levels.
🟢 Bullish scenario
The filing confirms another purchase, holdings move closer to the June record of 847,363 BTC, and other treasury buyers read it as a sign that conviction is holding.
🔴 Risk scenario
The filing shows only buybacks or another sale, the hint gets written off as noise, and sentiment cools while Bitcoin is already slipping.
👀 Three things to watch
1️⃣ Did Strategy buy Bitcoin at all?
Or was it another week of preferred stock buybacks only?
2️⃣ Where did the money come from?
Cash on hand is a very different signal from new share sales.
3️⃣ Distance to the record
Holdings were 1,363 BTC below the June high at the last filing. Does this week close that gap?
💡 The key takeaway
The caption is the trailer. The filing is the movie.
Most traders react to the trailer. The edge is in reading both separately, and in remembering that two of the last four weeks had no Bitcoin buy at all.
That is the part worth watching.
This post is for informational and educational purposes only and is not financial advice. Crypto markets are volatile. Always conduct your own research before making financial decisions.
#BinanceSquare #Bitcoin #BTC #Strategy #Saylor
🟠 One caption can move a whole market. This time it was three words: "Even more orange."
Michael Saylor posted another Bitcoin Tracker update with that line, and Strategy has usually filed its holdings update the day after a post like this. At the time of writing, the filing is not out yet. So instead of guessing the result, let's look at how to read the hint properly.
📊 Here's the part most people skip: a hint is not a receipt.
Look at Strategy's last four weekly updates in its SEC filings:
Aug 31: bought 4,603 BTC
Sept 8: no Bitcoin purchase, only preferred stock buybacks
Sept 14: no Bitcoin purchase, only preferred stock buybacks
Sept 21: bought 950 BTC
Two buying weeks, two quiet ones. Whatever the caption says, the filing tells the real story.
💰 Here's what the last purchase looked like.
Strategy bought 950 BTC for about 75.7 million dollars, an average of roughly 79,670 per coin. That took its holdings to 846,000 BTC, close to 4% of the entire Bitcoin supply. It paid with cash on hand, not new share sales. In the same week it also spent 174 million dollars buying back its own STRC preferred shares, part of an effort to lift that stock back above par so it can help fund future Bitcoin purchases.
🧠 Why does that change how you read Monday's filing?
Because a filing has two layers. There's the Bitcoin line everyone screenshots, and there's the balance sheet activity underneath. A week can be quiet on Bitcoin and still be busy behind the scenes. As of Sept 20, Strategy held about 1.05 billion dollars in cash for purchases and buybacks, plus a reserve of about 5.04 billion dollars set aside for dividends and interest. Earlier this year it also sold Bitcoin four times to build that reserve.
So "more orange" is a good sign of intent. It is not a guarantee of a buy.
✅ What this means for you
If you're holding, treat the caption as sentiment and the filing as fact. Don't change your plan because of a chart post.
If you're on the sidelines, $BTC is trading around 83,000 after touching roughly 87,500 last week, and it is still above Strategy's average cost of about 75,400. Buying because Saylor posted a chart is buying a rumor. Waiting for the filing and watching how price reacts gives you real information.
If you're trading, watch the size, not just the yes or no. A small purchase after a big rally says something very different from a large one. Also check whether the money came from cash or from new share sales, since that tells you how comfortable the company is buying at these levels.
🟢 Bullish scenario
The filing confirms another purchase, holdings move closer to the June record of 847,363 BTC, and other treasury buyers read it as a sign that conviction is holding.
🔴 Risk scenario
The filing shows only buybacks or another sale, the hint gets written off as noise, and sentiment cools while Bitcoin is already slipping.
👀 Three things to watch
1️⃣ Did Strategy buy Bitcoin at all?
Or was it another week of preferred stock buybacks only?
2️⃣ Where did the money come from?
Cash on hand is a very different signal from new share sales.
3️⃣ Distance to the record
Holdings were 1,363 BTC below the June high at the last filing. Does this week close that gap?
💡 The key takeaway
The caption is the trailer. The filing is the movie.
Most traders react to the trailer. The edge is in reading both separately, and in remembering that two of the last four weeks had no Bitcoin buy at all.
That is the part worth watching.
This post is for informational and educational purposes only and is not financial advice. Crypto markets are volatile. Always conduct your own research before making financial decisions.
#BinanceSquare #Bitcoin #BTC #Strategy #Saylor
1
1
108
Article
Quant Surges 87% After the Clearing House Picks It for US Bank Tokenized DepositsThe payments company owned by 25 major US banks just chose Quant to power its on-chain money network. Here's how it follows the UK pilot, and what to watch.
🏦 A week ago, Quant's story was about British banks. Now it's about the plumbing behind American ones.
$QNT jumped as much as 87% in 24 hours, briefly touching 373 USDT before easing back near 288. The trigger was not a listing or a rumor. It was a press release.
📄 Here's what was actually announced.
On Thursday, September 24, The Clearing House said it had selected Quant to power its On-Chain Money Initiative. The Clearing House is the payments company owned by 25 of the largest financial institutions in the country, and it runs the RTP and CHIPS networks, which together clear and settle more than 2 trillion dollars every day.
⚙️ Here's what Quant will actually do.
Quant will handle the interoperability, orchestration and transaction management layer of a new network where banks can clear and settle tokenized deposits with each other. It will also connect that network to the fiat payment systems banks already use. The goal is payments that settle instantly and trigger automatically when agreed conditions are met, with the network targeted to open to participating institutions in the first half of 2027.
🔗 This is chapter two of a story you may have already seen.
Quant provides a similar layer for the UK bank pilot, where Barclays, HSBC, NatWest and others ran real tokenized sterling deposit transactions. Now the same infrastructure provider has been picked by the clearing house behind US bank payments. Two of the biggest banking systems in the world, one technology name in the middle.
🧠 Why does this matter beyond one price spike?
Tokenized deposits are different from stablecoins. They are ordinary bank deposits in digital form, with the same regulatory treatment as the money already in your account. Banks are building this path partly as their own answer to stablecoins, and whoever provides the connective layer between banks could end up as important infrastructure.
That is the bet the market is making on $QNT right now.
✅ What this means for you
If you hold QNT, this is a real institutional catalyst but remember that a move of up to 87% in a day is not a normal pace. Sharp pullbacks after moves like this are common, even when the news behind them is genuine.
If you are on the sidelines, chasing after a move this size is where most people get hurt. Watching whether QNT holds a meaningful part of its gains over several days tells you far more than the spike itself.
If you follow tokenization as a theme, this is the third major data point in a few weeks, alongside the ECB's Pontes system and the UK bank pilot. The pattern is worth tracking: traditional finance is building its own version of on-chain money, and it needs technology partners to do it.
🟢 Bullish scenario
The network launches on schedule, more banks join, and Quant becomes a core connective layer across several major banking systems.
🔴 Risk scenario
Bank demand turns out slower than expected (one large bank executive has said clients are not yet demanding these products in big numbers), the launch slips past 2027, and QNT gives back much of this rally.
👀 Three things to watch
1️⃣ Launch timeline
Does the network stay on track for the first half of 2027?
2️⃣ Bank participation
Do more banks beyond the initial group commit to the network?
3️⃣ Price behavior
Does QNT hold a solid part of this move, or retrace sharply once the excitement fades?
💡 The key takeaway
This was not a random pump. A major US clearing house named Quant as the technology behind its tokenized deposit network, and the market reacted fast.
The real question is whether banks actually adopt what is being built, or whether this stays an impressive announcement waiting for demand. Watching $QNT alone would miss that. Watch the launch.
That is the part worth watching.
This post is for informational and educational purposes only and is not financial advice. Crypto markets are volatile. Always conduct your own research before making financial decisions.
#BinanceSquare #Quant #QNT #Tokenization #Crypto
{spot}(QNTUSDT)
Quant Surges 87% After the Clearing House Picks It for US Bank Tokenized Deposits
The payments company owned by 25 major US banks just chose Quant to power its on-chain money network. Here's how it follows the UK pilot, and what to watch.
🏦 A week ago, Quant's story was about British banks. Now it's about the plumbing behind American ones.
$QNT jumped as much as 87% in 24 hours, briefly touching 373 USDT before easing back near 288. The trigger was not a listing or a rumor. It was a press release.
📄 Here's what was actually announced.
On Thursday, September 24, The Clearing House said it had selected Quant to power its On-Chain Money Initiative. The Clearing House is the payments company owned by 25 of the largest financial institutions in the country, and it runs the RTP and CHIPS networks, which together clear and settle more than 2 trillion dollars every day.
⚙️ Here's what Quant will actually do.
Quant will handle the interoperability, orchestration and transaction management layer of a new network where banks can clear and settle tokenized deposits with each other. It will also connect that network to the fiat payment systems banks already use. The goal is payments that settle instantly and trigger automatically when agreed conditions are met, with the network targeted to open to participating institutions in the first half of 2027.
🔗 This is chapter two of a story you may have already seen.
Quant provides a similar layer for the UK bank pilot, where Barclays, HSBC, NatWest and others ran real tokenized sterling deposit transactions. Now the same infrastructure provider has been picked by the clearing house behind US bank payments. Two of the biggest banking systems in the world, one technology name in the middle.
🧠 Why does this matter beyond one price spike?
Tokenized deposits are different from stablecoins. They are ordinary bank deposits in digital form, with the same regulatory treatment as the money already in your account. Banks are building this path partly as their own answer to stablecoins, and whoever provides the connective layer between banks could end up as important infrastructure.
That is the bet the market is making on $QNT right now.
✅ What this means for you
If you hold QNT, this is a real institutional catalyst but remember that a move of up to 87% in a day is not a normal pace. Sharp pullbacks after moves like this are common, even when the news behind them is genuine.
If you are on the sidelines, chasing after a move this size is where most people get hurt. Watching whether QNT holds a meaningful part of its gains over several days tells you far more than the spike itself.
If you follow tokenization as a theme, this is the third major data point in a few weeks, alongside the ECB's Pontes system and the UK bank pilot. The pattern is worth tracking: traditional finance is building its own version of on-chain money, and it needs technology partners to do it.
🟢 Bullish scenario
The network launches on schedule, more banks join, and Quant becomes a core connective layer across several major banking systems.
🔴 Risk scenario
Bank demand turns out slower than expected (one large bank executive has said clients are not yet demanding these products in big numbers), the launch slips past 2027, and QNT gives back much of this rally.
👀 Three things to watch
1️⃣ Launch timeline
Does the network stay on track for the first half of 2027?
2️⃣ Bank participation
Do more banks beyond the initial group commit to the network?
3️⃣ Price behavior
Does QNT hold a solid part of this move, or retrace sharply once the excitement fades?
💡 The key takeaway
This was not a random pump. A major US clearing house named Quant as the technology behind its tokenized deposit network, and the market reacted fast.
The real question is whether banks actually adopt what is being built, or whether this stays an impressive announcement waiting for demand. Watching $QNT alone would miss that. Watch the launch.
That is the part worth watching.
This post is for informational and educational purposes only and is not financial advice. Crypto markets are volatile. Always conduct your own research before making financial decisions.
#BinanceSquare #Quant #QNT #Tokenization #Crypto
🏦 A week ago, Quant's story was about British banks. Now it's about the plumbing behind American ones.
$QNT jumped as much as 87% in 24 hours, briefly touching 373 USDT before easing back near 288. The trigger was not a listing or a rumor. It was a press release.
📄 Here's what was actually announced.
On Thursday, September 24, The Clearing House said it had selected Quant to power its On-Chain Money Initiative. The Clearing House is the payments company owned by 25 of the largest financial institutions in the country, and it runs the RTP and CHIPS networks, which together clear and settle more than 2 trillion dollars every day.
⚙️ Here's what Quant will actually do.
Quant will handle the interoperability, orchestration and transaction management layer of a new network where banks can clear and settle tokenized deposits with each other. It will also connect that network to the fiat payment systems banks already use. The goal is payments that settle instantly and trigger automatically when agreed conditions are met, with the network targeted to open to participating institutions in the first half of 2027.
🔗 This is chapter two of a story you may have already seen.
Quant provides a similar layer for the UK bank pilot, where Barclays, HSBC, NatWest and others ran real tokenized sterling deposit transactions. Now the same infrastructure provider has been picked by the clearing house behind US bank payments. Two of the biggest banking systems in the world, one technology name in the middle.
🧠 Why does this matter beyond one price spike?
Tokenized deposits are different from stablecoins. They are ordinary bank deposits in digital form, with the same regulatory treatment as the money already in your account. Banks are building this path partly as their own answer to stablecoins, and whoever provides the connective layer between banks could end up as important infrastructure.
That is the bet the market is making on $QNT right now.
✅ What this means for you
If you hold QNT, this is a real institutional catalyst but remember that a move of up to 87% in a day is not a normal pace. Sharp pullbacks after moves like this are common, even when the news behind them is genuine.
If you are on the sidelines, chasing after a move this size is where most people get hurt. Watching whether QNT holds a meaningful part of its gains over several days tells you far more than the spike itself.
If you follow tokenization as a theme, this is the third major data point in a few weeks, alongside the ECB's Pontes system and the UK bank pilot. The pattern is worth tracking: traditional finance is building its own version of on-chain money, and it needs technology partners to do it.
🟢 Bullish scenario
The network launches on schedule, more banks join, and Quant becomes a core connective layer across several major banking systems.
🔴 Risk scenario
Bank demand turns out slower than expected (one large bank executive has said clients are not yet demanding these products in big numbers), the launch slips past 2027, and QNT gives back much of this rally.
👀 Three things to watch
1️⃣ Launch timeline
Does the network stay on track for the first half of 2027?
2️⃣ Bank participation
Do more banks beyond the initial group commit to the network?
3️⃣ Price behavior
Does QNT hold a solid part of this move, or retrace sharply once the excitement fades?
💡 The key takeaway
This was not a random pump. A major US clearing house named Quant as the technology behind its tokenized deposit network, and the market reacted fast.
The real question is whether banks actually adopt what is being built, or whether this stays an impressive announcement waiting for demand. Watching $QNT alone would miss that. Watch the launch.
That is the part worth watching.
This post is for informational and educational purposes only and is not financial advice. Crypto markets are volatile. Always conduct your own research before making financial decisions.
#BinanceSquare #Quant #QNT #Tokenization #Crypto
1
1
228
Article
Ondo Finance Surges 31% as RWA Tokenization Hits Record ScaleOver 1 million tokenized asset holders and $36.6B in on-chain value later, Ondo just broke a key resistance level. Here's what's driving it.
📈 A single number rarely tells the whole story. But when tokenized asset holders cross one million for the first time, it's worth stopping to understand why.
ONDO surged over 31% as the real-world asset tokenization sector Ondo Finance has helped build hit a genuine milestone, more than one million holders of tokenized assets, with total on-chain RWA value reaching roughly 36.6 billion dollars.
🏦 Here's why Ondo specifically keeps benefiting from this trend.
Ondo has positioned itself as one of the leading institutional infrastructure providers in tokenized finance, not just issuing its own products but building the rails other institutions plug into. The ecosystem spans OUSG, USDY, Flux Finance, and the upcoming Ondo Chain, alongside real partnerships tied to J.P. Morgan, Mastercard, Ripple, and a DTCC-backed tokenized assets initiative.
⚙️ Here's what's actually feeding this specific rally.
Several institutional catalysts are stacking on top of each other right now, BNY's plans to enable 24/7 Treasury settlement by 2027, tokenized Treasury pilots launching later this year, Samsung Wallet adding stablecoin support, and continued regulatory coordination between the US and UK. Individually, each is a modest headline. Together, they paint a picture of tokenization infrastructure genuinely maturing across multiple major institutions at once.
🧠 Why does crossing one million holders actually matter here?
Early in any sector's growth, the numbers are small enough that they feel experimental. One million tokenized asset holders is a genuinely different scale, it signals real, sustained user adoption rather than a handful of institutional pilots. That distinction matters because it suggests demand for tokenized real-world assets is becoming durable, not just a narrative crypto traders are excited about this month.
✅ What this means for you
If you're holding ONDO, understand what's actually driving this move, genuine sector-wide adoption metrics crossing a real milestone, not a single announcement or listing pump. That tends to support more durable price action than a typical news-driven spike.
If you're on the sidelines, a 31% move is a significant single-day jump, and Ondo's own price history shows it's had sharp pullbacks after past rallies even when the underlying fundamentals kept improving. Watching whether ONDO holds above its recent resistance level over the following days tells you more than the move itself.
If you're trying to understand the RWA sector broadly, Ondo is a genuinely useful bellwether to watch, its partnerships with major institutions and its role as infrastructure, not just a single product, make it a reasonable proxy for how seriously traditional finance is actually engaging with tokenization right now.
🟢 Bullish scenario
The one million holder milestone proves to be an inflection point, institutional partnerships keep expanding, and RWA tokenization volume continues compounding, with Ondo capturing a meaningful share as core infrastructure.
🔴 Risk scenario
This rally mirrors Ondo's past sharp moves that later cooled, momentum fades once the initial excitement around the milestone passes, and ONDO retraces toward prior support levels.
👀 Three things to watch
1️⃣ Holder growth continuation
Does the pace of new tokenized asset holders keep accelerating, or does growth plateau after this milestone?
2️⃣ Institutional partnership follow-through
Do BNY's 24/7 settlement plans and other announced initiatives actually launch on schedule, reinforcing the fundamental thesis?
3️⃣ Price stability above resistance
Does ONDO hold its breakout level, or does it retrace as it has after several past rallies this year?
💡 The key takeaway
Crossing one million tokenized asset holders isn't just a vanity metric, it's a real signal that RWA tokenization is moving from institutional pilot programs into genuine, sustained adoption.
The real question is whether Ondo, as one of the sector's key infrastructure providers, keeps capturing that growth as it scales, or whether this rally cools the way several of its past sharp moves eventually have.
That is the part worth watching.
This post is for informational and educational purposes only and is not financial advice. Crypto markets are volatile. Always conduct your own research before making financial decisions.
#BinanceSquare #Ondo #RWA #Tokenization #Crypto
{spot}(ONDOUSDT)
Ondo Finance Surges 31% as RWA Tokenization Hits Record Scale
Over 1 million tokenized asset holders and $36.6B in on-chain value later, Ondo just broke a key resistance level. Here's what's driving it.
📈 A single number rarely tells the whole story. But when tokenized asset holders cross one million for the first time, it's worth stopping to understand why.
ONDO surged over 31% as the real-world asset tokenization sector Ondo Finance has helped build hit a genuine milestone, more than one million holders of tokenized assets, with total on-chain RWA value reaching roughly 36.6 billion dollars.
🏦 Here's why Ondo specifically keeps benefiting from this trend.
Ondo has positioned itself as one of the leading institutional infrastructure providers in tokenized finance, not just issuing its own products but building the rails other institutions plug into. The ecosystem spans OUSG, USDY, Flux Finance, and the upcoming Ondo Chain, alongside real partnerships tied to J.P. Morgan, Mastercard, Ripple, and a DTCC-backed tokenized assets initiative.
⚙️ Here's what's actually feeding this specific rally.
Several institutional catalysts are stacking on top of each other right now, BNY's plans to enable 24/7 Treasury settlement by 2027, tokenized Treasury pilots launching later this year, Samsung Wallet adding stablecoin support, and continued regulatory coordination between the US and UK. Individually, each is a modest headline. Together, they paint a picture of tokenization infrastructure genuinely maturing across multiple major institutions at once.
🧠 Why does crossing one million holders actually matter here?
Early in any sector's growth, the numbers are small enough that they feel experimental. One million tokenized asset holders is a genuinely different scale, it signals real, sustained user adoption rather than a handful of institutional pilots. That distinction matters because it suggests demand for tokenized real-world assets is becoming durable, not just a narrative crypto traders are excited about this month.
✅ What this means for you
If you're holding ONDO, understand what's actually driving this move, genuine sector-wide adoption metrics crossing a real milestone, not a single announcement or listing pump. That tends to support more durable price action than a typical news-driven spike.
If you're on the sidelines, a 31% move is a significant single-day jump, and Ondo's own price history shows it's had sharp pullbacks after past rallies even when the underlying fundamentals kept improving. Watching whether ONDO holds above its recent resistance level over the following days tells you more than the move itself.
If you're trying to understand the RWA sector broadly, Ondo is a genuinely useful bellwether to watch, its partnerships with major institutions and its role as infrastructure, not just a single product, make it a reasonable proxy for how seriously traditional finance is actually engaging with tokenization right now.
🟢 Bullish scenario
The one million holder milestone proves to be an inflection point, institutional partnerships keep expanding, and RWA tokenization volume continues compounding, with Ondo capturing a meaningful share as core infrastructure.
🔴 Risk scenario
This rally mirrors Ondo's past sharp moves that later cooled, momentum fades once the initial excitement around the milestone passes, and ONDO retraces toward prior support levels.
👀 Three things to watch
1️⃣ Holder growth continuation
Does the pace of new tokenized asset holders keep accelerating, or does growth plateau after this milestone?
2️⃣ Institutional partnership follow-through
Do BNY's 24/7 settlement plans and other announced initiatives actually launch on schedule, reinforcing the fundamental thesis?
3️⃣ Price stability above resistance
Does ONDO hold its breakout level, or does it retrace as it has after several past rallies this year?
💡 The key takeaway
Crossing one million tokenized asset holders isn't just a vanity metric, it's a real signal that RWA tokenization is moving from institutional pilot programs into genuine, sustained adoption.
The real question is whether Ondo, as one of the sector's key infrastructure providers, keeps capturing that growth as it scales, or whether this rally cools the way several of its past sharp moves eventually have.
That is the part worth watching.
This post is for informational and educational purposes only and is not financial advice. Crypto markets are volatile. Always conduct your own research before making financial decisions.
#BinanceSquare #Ondo #RWA #Tokenization #Crypto
📈 A single number rarely tells the whole story. But when tokenized asset holders cross one million for the first time, it's worth stopping to understand why.
ONDO surged over 31% as the real-world asset tokenization sector Ondo Finance has helped build hit a genuine milestone, more than one million holders of tokenized assets, with total on-chain RWA value reaching roughly 36.6 billion dollars.
🏦 Here's why Ondo specifically keeps benefiting from this trend.
Ondo has positioned itself as one of the leading institutional infrastructure providers in tokenized finance, not just issuing its own products but building the rails other institutions plug into. The ecosystem spans OUSG, USDY, Flux Finance, and the upcoming Ondo Chain, alongside real partnerships tied to J.P. Morgan, Mastercard, Ripple, and a DTCC-backed tokenized assets initiative.
⚙️ Here's what's actually feeding this specific rally.
Several institutional catalysts are stacking on top of each other right now, BNY's plans to enable 24/7 Treasury settlement by 2027, tokenized Treasury pilots launching later this year, Samsung Wallet adding stablecoin support, and continued regulatory coordination between the US and UK. Individually, each is a modest headline. Together, they paint a picture of tokenization infrastructure genuinely maturing across multiple major institutions at once.
🧠 Why does crossing one million holders actually matter here?
Early in any sector's growth, the numbers are small enough that they feel experimental. One million tokenized asset holders is a genuinely different scale, it signals real, sustained user adoption rather than a handful of institutional pilots. That distinction matters because it suggests demand for tokenized real-world assets is becoming durable, not just a narrative crypto traders are excited about this month.
✅ What this means for you
If you're holding ONDO, understand what's actually driving this move, genuine sector-wide adoption metrics crossing a real milestone, not a single announcement or listing pump. That tends to support more durable price action than a typical news-driven spike.
If you're on the sidelines, a 31% move is a significant single-day jump, and Ondo's own price history shows it's had sharp pullbacks after past rallies even when the underlying fundamentals kept improving. Watching whether ONDO holds above its recent resistance level over the following days tells you more than the move itself.
If you're trying to understand the RWA sector broadly, Ondo is a genuinely useful bellwether to watch, its partnerships with major institutions and its role as infrastructure, not just a single product, make it a reasonable proxy for how seriously traditional finance is actually engaging with tokenization right now.
🟢 Bullish scenario
The one million holder milestone proves to be an inflection point, institutional partnerships keep expanding, and RWA tokenization volume continues compounding, with Ondo capturing a meaningful share as core infrastructure.
🔴 Risk scenario
This rally mirrors Ondo's past sharp moves that later cooled, momentum fades once the initial excitement around the milestone passes, and ONDO retraces toward prior support levels.
👀 Three things to watch
1️⃣ Holder growth continuation
Does the pace of new tokenized asset holders keep accelerating, or does growth plateau after this milestone?
2️⃣ Institutional partnership follow-through
Do BNY's 24/7 settlement plans and other announced initiatives actually launch on schedule, reinforcing the fundamental thesis?
3️⃣ Price stability above resistance
Does ONDO hold its breakout level, or does it retrace as it has after several past rallies this year?
💡 The key takeaway
Crossing one million tokenized asset holders isn't just a vanity metric, it's a real signal that RWA tokenization is moving from institutional pilot programs into genuine, sustained adoption.
The real question is whether Ondo, as one of the sector's key infrastructure providers, keeps capturing that growth as it scales, or whether this rally cools the way several of its past sharp moves eventually have.
That is the part worth watching.
This post is for informational and educational purposes only and is not financial advice. Crypto markets are volatile. Always conduct your own research before making financial decisions.
#BinanceSquare #Ondo #RWA #Tokenization #Crypto
1
2
59

Article
Quant Surges 39% as the Infrastructure Behind Bank Tokenization Gets NoticedQNT jumped right after UK banks used Quant's platform for real tokenized deposit transactions. Here's the connection.
⚡ Sometimes the market takes a few days to connect the dots. When it finally does, the move can be sharp.
QNT surged 39% to $99.02, its biggest single day move in months, and it landed right on the heels of a story most crypto traders initially skimmed past, Britain's biggest banks running real transactions on tokenized sterling deposits.
🔗 Here's the connection that just clicked for the market.
Quant is the infrastructure provider chosen by UK Finance's tokenization pilot, the same one involving Barclays, HSBC, Lloyds, NatWest, Nationwide, and Santander. When that story broke, most coverage focused on the banks. What took a bit longer to register is that Quant is the technology actually running underneath all of it.
🧠 Why does that distinction matter enough to move price 39%?
A bank running a pilot is one story. The infrastructure company powering that pilot across six of Britain's largest financial institutions simultaneously is a different, much bigger story for that company specifically. This isn't Quant announcing a partnership, it's Quant's technology already live, processing real transactions for real banks, at scale.
⚙️ This also fits a broader pattern for Quant specifically.
Quant has seen sharp moves before tied to real institutional adoption, including a notable breakout earlier this year that coincided with falling exchange reserves as investors moved tokens into self-custody, a sign of holders positioning for the long term rather than trading short-term. This latest surge follows a similar shape, a real catalyst, not just speculation.
✅ What this means for you
If you're holding QNT, understand what's actually driving this move, genuine infrastructure adoption by major regulated banks, not hype or a listing announcement. That tends to be a far more durable kind of catalyst than sentiment-driven pumps.
If you're on the sidelines, a 39% single-day move is a lot to chase, and pullbacks after moves this sharp are common even when the underlying catalyst is real. Watching whether QNT holds a meaningful portion of this gain over the coming days tells you more than the spike itself.
If you're trying to understand the bigger opportunity here, this is a genuine case study in how infrastructure plays can move sharply once the market actually connects a broader news story to the specific company powering it. Worth watching for similar setups as more institutional tokenization pilots go live elsewhere.
🟢 Bullish scenario
The UK pilot expands successfully, more banks and jurisdictions adopt Quant's infrastructure for their own tokenization efforts, and this becomes the start of sustained institutional demand for QNT.
🔴 Risk scenario
This was mostly a delayed reaction that already priced in the news, momentum fades quickly, and QNT gives back a meaningful portion of this surge without new catalysts to sustain it.
👀 Three things to watch
1️⃣ Pilot expansion
Does the UK Finance pilot expand beyond its initial six banks, using more of Quant's infrastructure?
2️⃣ New institutional deals
Does Quant announce additional bank or institutional partnerships building on this momentum?
3️⃣ Price stability
Does QNT hold a meaningful portion of this 39% move over the following week, or does it retrace sharply?
💡 The key takeaway
This wasn't a random pump, it was the market finally pricing in a connection that was hiding in plain sight, Quant's infrastructure running underneath one of the biggest bank tokenization stories of the year.
The real question is whether this becomes the start of sustained institutional demand for Quant's technology, or a sharp, one-time repricing that already reflected the news everyone eventually caught up to.
That is the part worth watching.
This post is for informational and educational purposes only and is not financial advice. Crypto markets are volatile. Always conduct your own research before making financial decisions.
#BinanceSquare #Quant #QNT #Tokenization #Crypto
{spot}(QNTUSDT)
Quant Surges 39% as the Infrastructure Behind Bank Tokenization Gets Noticed
QNT jumped right after UK banks used Quant's platform for real tokenized deposit transactions. Here's the connection.
⚡ Sometimes the market takes a few days to connect the dots. When it finally does, the move can be sharp.
QNT surged 39% to $99.02, its biggest single day move in months, and it landed right on the heels of a story most crypto traders initially skimmed past, Britain's biggest banks running real transactions on tokenized sterling deposits.
🔗 Here's the connection that just clicked for the market.
Quant is the infrastructure provider chosen by UK Finance's tokenization pilot, the same one involving Barclays, HSBC, Lloyds, NatWest, Nationwide, and Santander. When that story broke, most coverage focused on the banks. What took a bit longer to register is that Quant is the technology actually running underneath all of it.
🧠 Why does that distinction matter enough to move price 39%?
A bank running a pilot is one story. The infrastructure company powering that pilot across six of Britain's largest financial institutions simultaneously is a different, much bigger story for that company specifically. This isn't Quant announcing a partnership, it's Quant's technology already live, processing real transactions for real banks, at scale.
⚙️ This also fits a broader pattern for Quant specifically.
Quant has seen sharp moves before tied to real institutional adoption, including a notable breakout earlier this year that coincided with falling exchange reserves as investors moved tokens into self-custody, a sign of holders positioning for the long term rather than trading short-term. This latest surge follows a similar shape, a real catalyst, not just speculation.
✅ What this means for you
If you're holding QNT, understand what's actually driving this move, genuine infrastructure adoption by major regulated banks, not hype or a listing announcement. That tends to be a far more durable kind of catalyst than sentiment-driven pumps.
If you're on the sidelines, a 39% single-day move is a lot to chase, and pullbacks after moves this sharp are common even when the underlying catalyst is real. Watching whether QNT holds a meaningful portion of this gain over the coming days tells you more than the spike itself.
If you're trying to understand the bigger opportunity here, this is a genuine case study in how infrastructure plays can move sharply once the market actually connects a broader news story to the specific company powering it. Worth watching for similar setups as more institutional tokenization pilots go live elsewhere.
🟢 Bullish scenario
The UK pilot expands successfully, more banks and jurisdictions adopt Quant's infrastructure for their own tokenization efforts, and this becomes the start of sustained institutional demand for QNT.
🔴 Risk scenario
This was mostly a delayed reaction that already priced in the news, momentum fades quickly, and QNT gives back a meaningful portion of this surge without new catalysts to sustain it.
👀 Three things to watch
1️⃣ Pilot expansion
Does the UK Finance pilot expand beyond its initial six banks, using more of Quant's infrastructure?
2️⃣ New institutional deals
Does Quant announce additional bank or institutional partnerships building on this momentum?
3️⃣ Price stability
Does QNT hold a meaningful portion of this 39% move over the following week, or does it retrace sharply?
💡 The key takeaway
This wasn't a random pump, it was the market finally pricing in a connection that was hiding in plain sight, Quant's infrastructure running underneath one of the biggest bank tokenization stories of the year.
The real question is whether this becomes the start of sustained institutional demand for Quant's technology, or a sharp, one-time repricing that already reflected the news everyone eventually caught up to.
That is the part worth watching.
This post is for informational and educational purposes only and is not financial advice. Crypto markets are volatile. Always conduct your own research before making financial decisions.
#BinanceSquare #Quant #QNT #Tokenization #Crypto
⚡ Sometimes the market takes a few days to connect the dots. When it finally does, the move can be sharp.
QNT surged 39% to $99.02, its biggest single day move in months, and it landed right on the heels of a story most crypto traders initially skimmed past, Britain's biggest banks running real transactions on tokenized sterling deposits.
🔗 Here's the connection that just clicked for the market.
Quant is the infrastructure provider chosen by UK Finance's tokenization pilot, the same one involving Barclays, HSBC, Lloyds, NatWest, Nationwide, and Santander. When that story broke, most coverage focused on the banks. What took a bit longer to register is that Quant is the technology actually running underneath all of it.
🧠 Why does that distinction matter enough to move price 39%?
A bank running a pilot is one story. The infrastructure company powering that pilot across six of Britain's largest financial institutions simultaneously is a different, much bigger story for that company specifically. This isn't Quant announcing a partnership, it's Quant's technology already live, processing real transactions for real banks, at scale.
⚙️ This also fits a broader pattern for Quant specifically.
Quant has seen sharp moves before tied to real institutional adoption, including a notable breakout earlier this year that coincided with falling exchange reserves as investors moved tokens into self-custody, a sign of holders positioning for the long term rather than trading short-term. This latest surge follows a similar shape, a real catalyst, not just speculation.
✅ What this means for you
If you're holding QNT, understand what's actually driving this move, genuine infrastructure adoption by major regulated banks, not hype or a listing announcement. That tends to be a far more durable kind of catalyst than sentiment-driven pumps.
If you're on the sidelines, a 39% single-day move is a lot to chase, and pullbacks after moves this sharp are common even when the underlying catalyst is real. Watching whether QNT holds a meaningful portion of this gain over the coming days tells you more than the spike itself.
If you're trying to understand the bigger opportunity here, this is a genuine case study in how infrastructure plays can move sharply once the market actually connects a broader news story to the specific company powering it. Worth watching for similar setups as more institutional tokenization pilots go live elsewhere.
🟢 Bullish scenario
The UK pilot expands successfully, more banks and jurisdictions adopt Quant's infrastructure for their own tokenization efforts, and this becomes the start of sustained institutional demand for QNT.
🔴 Risk scenario
This was mostly a delayed reaction that already priced in the news, momentum fades quickly, and QNT gives back a meaningful portion of this surge without new catalysts to sustain it.
👀 Three things to watch
1️⃣ Pilot expansion
Does the UK Finance pilot expand beyond its initial six banks, using more of Quant's infrastructure?
2️⃣ New institutional deals
Does Quant announce additional bank or institutional partnerships building on this momentum?
3️⃣ Price stability
Does QNT hold a meaningful portion of this 39% move over the following week, or does it retrace sharply?
💡 The key takeaway
This wasn't a random pump, it was the market finally pricing in a connection that was hiding in plain sight, Quant's infrastructure running underneath one of the biggest bank tokenization stories of the year.
The real question is whether this becomes the start of sustained institutional demand for Quant's technology, or a sharp, one-time repricing that already reflected the news everyone eventually caught up to.
That is the part worth watching.
This post is for informational and educational purposes only and is not financial advice. Crypto markets are volatile. Always conduct your own research before making financial decisions.
#BinanceSquare #Quant #QNT #Tokenization #Crypto
1
2
51

Article
Falcon Finance Surges as fUSD Launches: A Stablecoin That Actually Shares Reserve YieldInstitutions holding fUSD can now earn roughly 3% annually, something no other regulated dollar stablecoin currently offers. Here's how it works.
💵 Stablecoin issuers have quietly collected billions in yield for years while holders earned nothing. Falcon Finance just built a stablecoin that flips that arrangement.
FF surged nearly 5% as Falcon Finance launched fUSD, a new U.S. dollar payment stablecoin issued by Anchorage Digital Bank, the first federally chartered crypto bank in the country.
🏦 Here's the actual problem this stablecoin is built to solve.
With over 320 billion dollars in dollar stablecoins now circulating and short-dated Treasury yields sitting near 4%, holders collectively forgo well over 10 billion dollars a year in potential returns. That income has historically gone entirely to issuers, not the people actually holding the tokens. fUSD is designed specifically to close that gap.
⚙️ Here's how it actually works.
fUSD is issued by Anchorage Digital Bank under direct federal oversight, built to be GENIUS Act ready, the federal framework for payment stablecoins. Because that law restricts stablecoin issuers from paying interest directly, Falcon Finance operates a separate institutional rewards program, targeting roughly 3% annually, tied to the stablecoin's underlying Treasury-backed reserves. It's a structure no other regulated U.S. dollar stablecoin currently offers.
🔐 This also extends something Falcon Finance already had running.
fUSD sits alongside USDf, Falcon's existing crypto-native synthetic dollar with over 1.6 billion dollars in circulating supply, already ranked among the top ten stablecoins on Ethereum. fUSD is positioned as its regulated counterpart, purpose-built for institutional trading, collateral, and treasury use cases rather than DeFi composability.
🧠 Why does this actually matter beyond one token launch?
This is a genuine structural innovation in a space that's mostly competed on trust and distribution rather than economics. Most major stablecoins keep 100% of their reserve yield as issuer profit. fUSD sharing a portion of that yield with institutional holders is a real, differentiated model, not just a new logo on the same product.
✅ What this means for you
If you're holding FF, understand what's actually driving this move, a genuine product differentiation in a crowded stablecoin market, not speculative hype. That kind of structural advantage tends to be more durable than a typical listing pump.
If you're an institutional user evaluating stablecoin options, fUSD's yield-sharing model is worth understanding directly, roughly 3% annually is a meaningful difference compared to holding a stablecoin that pays you nothing while the issuer earns Treasury yield on your deposits.
If you're trying to spot where stablecoin competition is heading next, this is a genuine signal, expect more issuers to eventually face pressure to share reserve economics as products like fUSD demonstrate it's both possible and in demand.
🟢 Bullish scenario
fUSD gains real institutional adoption, its yield-sharing model becomes a genuine competitive advantage, and Falcon Finance's broader stablecoin ecosystem, both USDf and fUSD, sees compounding demand.
🔴 Risk scenario
Institutional adoption stays limited to early partners, competing stablecoin issuers don't feel pressured to match the yield-sharing model, and this remains a niche product rather than reshaping the broader market.
👀 Three things to watch
1️⃣ Institutional adoption
Do major trading firms and treasury desks beyond Falcon's own initial deployment actually adopt fUSD at scale?
2️⃣ Competitor response
Do other major stablecoin issuers introduce similar yield-sharing structures in response, or does fUSD stay a unique offering?
3️⃣ USDf and fUSD synergy
Does the combined ecosystem of Falcon's regulated and synthetic stablecoins grow together, reinforcing each other's adoption?
💡 The key takeaway
This wasn't a hype-driven token pump. It was a real structural innovation, a stablecoin that finally shares reserve economics with the people actually holding it, launching with real institutional infrastructure behind it.
The real question is whether this yield-sharing model becomes the new institutional standard, forcing competitors to follow, or stays a differentiated niche product in a market that's historically kept all the yield for issuers alone.
That is the part worth watching.
This post is for informational and educational purposes only and is not financial advice. Crypto markets are volatile. Always conduct your own research before making financial decisions.
#BinanceSquare #FalconFinance #Stablecoin #fUSD #Crypto
{spot}(FFUSDT)
Falcon Finance Surges as fUSD Launches: A Stablecoin That Actually Shares Reserve Yield
Institutions holding fUSD can now earn roughly 3% annually, something no other regulated dollar stablecoin currently offers. Here's how it works.
💵 Stablecoin issuers have quietly collected billions in yield for years while holders earned nothing. Falcon Finance just built a stablecoin that flips that arrangement.
FF surged nearly 5% as Falcon Finance launched fUSD, a new U.S. dollar payment stablecoin issued by Anchorage Digital Bank, the first federally chartered crypto bank in the country.
🏦 Here's the actual problem this stablecoin is built to solve.
With over 320 billion dollars in dollar stablecoins now circulating and short-dated Treasury yields sitting near 4%, holders collectively forgo well over 10 billion dollars a year in potential returns. That income has historically gone entirely to issuers, not the people actually holding the tokens. fUSD is designed specifically to close that gap.
⚙️ Here's how it actually works.
fUSD is issued by Anchorage Digital Bank under direct federal oversight, built to be GENIUS Act ready, the federal framework for payment stablecoins. Because that law restricts stablecoin issuers from paying interest directly, Falcon Finance operates a separate institutional rewards program, targeting roughly 3% annually, tied to the stablecoin's underlying Treasury-backed reserves. It's a structure no other regulated U.S. dollar stablecoin currently offers.
🔐 This also extends something Falcon Finance already had running.
fUSD sits alongside USDf, Falcon's existing crypto-native synthetic dollar with over 1.6 billion dollars in circulating supply, already ranked among the top ten stablecoins on Ethereum. fUSD is positioned as its regulated counterpart, purpose-built for institutional trading, collateral, and treasury use cases rather than DeFi composability.
🧠 Why does this actually matter beyond one token launch?
This is a genuine structural innovation in a space that's mostly competed on trust and distribution rather than economics. Most major stablecoins keep 100% of their reserve yield as issuer profit. fUSD sharing a portion of that yield with institutional holders is a real, differentiated model, not just a new logo on the same product.
✅ What this means for you
If you're holding FF, understand what's actually driving this move, a genuine product differentiation in a crowded stablecoin market, not speculative hype. That kind of structural advantage tends to be more durable than a typical listing pump.
If you're an institutional user evaluating stablecoin options, fUSD's yield-sharing model is worth understanding directly, roughly 3% annually is a meaningful difference compared to holding a stablecoin that pays you nothing while the issuer earns Treasury yield on your deposits.
If you're trying to spot where stablecoin competition is heading next, this is a genuine signal, expect more issuers to eventually face pressure to share reserve economics as products like fUSD demonstrate it's both possible and in demand.
🟢 Bullish scenario
fUSD gains real institutional adoption, its yield-sharing model becomes a genuine competitive advantage, and Falcon Finance's broader stablecoin ecosystem, both USDf and fUSD, sees compounding demand.
🔴 Risk scenario
Institutional adoption stays limited to early partners, competing stablecoin issuers don't feel pressured to match the yield-sharing model, and this remains a niche product rather than reshaping the broader market.
👀 Three things to watch
1️⃣ Institutional adoption
Do major trading firms and treasury desks beyond Falcon's own initial deployment actually adopt fUSD at scale?
2️⃣ Competitor response
Do other major stablecoin issuers introduce similar yield-sharing structures in response, or does fUSD stay a unique offering?
3️⃣ USDf and fUSD synergy
Does the combined ecosystem of Falcon's regulated and synthetic stablecoins grow together, reinforcing each other's adoption?
💡 The key takeaway
This wasn't a hype-driven token pump. It was a real structural innovation, a stablecoin that finally shares reserve economics with the people actually holding it, launching with real institutional infrastructure behind it.
The real question is whether this yield-sharing model becomes the new institutional standard, forcing competitors to follow, or stays a differentiated niche product in a market that's historically kept all the yield for issuers alone.
That is the part worth watching.
This post is for informational and educational purposes only and is not financial advice. Crypto markets are volatile. Always conduct your own research before making financial decisions.
#BinanceSquare #FalconFinance #Stablecoin #fUSD #Crypto
💵 Stablecoin issuers have quietly collected billions in yield for years while holders earned nothing. Falcon Finance just built a stablecoin that flips that arrangement.
FF surged nearly 5% as Falcon Finance launched fUSD, a new U.S. dollar payment stablecoin issued by Anchorage Digital Bank, the first federally chartered crypto bank in the country.
🏦 Here's the actual problem this stablecoin is built to solve.
With over 320 billion dollars in dollar stablecoins now circulating and short-dated Treasury yields sitting near 4%, holders collectively forgo well over 10 billion dollars a year in potential returns. That income has historically gone entirely to issuers, not the people actually holding the tokens. fUSD is designed specifically to close that gap.
⚙️ Here's how it actually works.
fUSD is issued by Anchorage Digital Bank under direct federal oversight, built to be GENIUS Act ready, the federal framework for payment stablecoins. Because that law restricts stablecoin issuers from paying interest directly, Falcon Finance operates a separate institutional rewards program, targeting roughly 3% annually, tied to the stablecoin's underlying Treasury-backed reserves. It's a structure no other regulated U.S. dollar stablecoin currently offers.
🔐 This also extends something Falcon Finance already had running.
fUSD sits alongside USDf, Falcon's existing crypto-native synthetic dollar with over 1.6 billion dollars in circulating supply, already ranked among the top ten stablecoins on Ethereum. fUSD is positioned as its regulated counterpart, purpose-built for institutional trading, collateral, and treasury use cases rather than DeFi composability.
🧠 Why does this actually matter beyond one token launch?
This is a genuine structural innovation in a space that's mostly competed on trust and distribution rather than economics. Most major stablecoins keep 100% of their reserve yield as issuer profit. fUSD sharing a portion of that yield with institutional holders is a real, differentiated model, not just a new logo on the same product.
✅ What this means for you
If you're holding FF, understand what's actually driving this move, a genuine product differentiation in a crowded stablecoin market, not speculative hype. That kind of structural advantage tends to be more durable than a typical listing pump.
If you're an institutional user evaluating stablecoin options, fUSD's yield-sharing model is worth understanding directly, roughly 3% annually is a meaningful difference compared to holding a stablecoin that pays you nothing while the issuer earns Treasury yield on your deposits.
If you're trying to spot where stablecoin competition is heading next, this is a genuine signal, expect more issuers to eventually face pressure to share reserve economics as products like fUSD demonstrate it's both possible and in demand.
🟢 Bullish scenario
fUSD gains real institutional adoption, its yield-sharing model becomes a genuine competitive advantage, and Falcon Finance's broader stablecoin ecosystem, both USDf and fUSD, sees compounding demand.
🔴 Risk scenario
Institutional adoption stays limited to early partners, competing stablecoin issuers don't feel pressured to match the yield-sharing model, and this remains a niche product rather than reshaping the broader market.
👀 Three things to watch
1️⃣ Institutional adoption
Do major trading firms and treasury desks beyond Falcon's own initial deployment actually adopt fUSD at scale?
2️⃣ Competitor response
Do other major stablecoin issuers introduce similar yield-sharing structures in response, or does fUSD stay a unique offering?
3️⃣ USDf and fUSD synergy
Does the combined ecosystem of Falcon's regulated and synthetic stablecoins grow together, reinforcing each other's adoption?
💡 The key takeaway
This wasn't a hype-driven token pump. It was a real structural innovation, a stablecoin that finally shares reserve economics with the people actually holding it, launching with real institutional infrastructure behind it.
The real question is whether this yield-sharing model becomes the new institutional standard, forcing competitors to follow, or stays a differentiated niche product in a market that's historically kept all the yield for issuers alone.
That is the part worth watching.
This post is for informational and educational purposes only and is not financial advice. Crypto markets are volatile. Always conduct your own research before making financial decisions.
#BinanceSquare #FalconFinance #Stablecoin #fUSD #Crypto
1
2
142

Article
Britain's Biggest Banks Just Ran Real Tokenized Deposit Transactions: What It MeansBarclays, HSBC, NatWest and others are testing programmable bank money. Here's how this compares to stablecoins, and why it matters.
🏦 While the crypto world debates stablecoins, Britain's biggest banks quietly launched something different, and it's actually live.
UK Finance, alongside Barclays, HSBC, Lloyds Banking Group, NatWest, Nationwide, and Santander, has launched an industry-wide pilot delivering the first real UK transactions of tokenized sterling deposits. This isn't a whitepaper or a proposal; actual money is moving through this system now.
💷 Here's what a tokenized deposit actually is, and why it's different from a stablecoin.
A tokenized deposit is a digital representation of ordinary commercial bank money, the same pounds sitting in a regular bank account, just issued in programmable, blockchain-based form. Unlike a stablecoin, it sits fully within existing bank regulation and deposit protection rules. It's not a new kind of money; it's your existing bank balance made faster and programmable.
⚖️ Here's why banks and regulators are choosing this path specifically.
Bank of England Governor Andrew Bailey has been explicit about this, he's urged banks to prioritize tokenization over issuing their own stablecoins, warning that widespread bank-issued stablecoins could actually threaten financial stability. Tokenized deposits let banks gain the speed and programmability benefits of blockchain technology while keeping money inside the existing, regulated banking system rather than creating a new, separate form of currency.
🔧 Here's what's actually being tested.
The pilot covers three real use cases, peer-to-peer payments through online marketplaces with stronger fraud protection, remortgaging processes designed to speed up conveyancing, and digital asset settlement connecting tokenized bank money directly to tokenized assets. Quant is providing the underlying infrastructure, with EY and Linklaters supporting on the advisory side. The pilot runs through mid-2026.
🧠 Why should this matter to you, even outside the UK?
This is a genuine signal about which model traditional finance is choosing as tokenization becomes mainstream, bank-controlled, regulator-approved digital money, rather than the private stablecoin model that's dominated crypto's own growth. HSBC has also already completed a live cross-border interbank transaction with Standard Chartered using tokenized deposits through Swift's blockchain-based ledger, with 17 banks across six continents preparing similar pilots. This isn't an isolated UK experiment; it's part of a broader global shift in how banks are approaching digital money.
✅ What this means for you
If you're focused on crypto and stablecoins specifically, this is a genuine competing model worth understanding, not a threat to dismiss. Bank-issued tokenized deposits and crypto-native stablecoins may end up serving different purposes, tokenized deposits for regulated, bank-anchored payments, stablecoins for crypto-native and cross-border use cases.
If you're interested in tokenization broadly, this is another major data point alongside the ECB's Pontes system, traditional finance isn't just watching tokenization happen, it's actively building competing infrastructure for it right now, at scale, with major institutions involved.
If you're trying to understand where global finance is heading, watching how this pilot performs through mid-2026, and whether it expands beyond the UK, tells you a lot about whether bank-led tokenization becomes a serious competitor to crypto-native stablecoins, or stays a niche institutional tool.
🟢 Bullish scenario
The pilot succeeds, expands beyond its initial six banks, and tokenized deposits become a genuine parallel infrastructure to stablecoins, accelerating broader tokenization adoption across traditional finance.
🔴 Risk scenario
Adoption stays limited to pilot participants, the complexity of integrating across multiple banks slows progress, and tokenized deposits remain a niche experiment rather than mainstream infrastructure.
👀 Three things to watch
1️⃣ Pilot results at mid-2026
Does the program show clear success across its three use cases, or reveal real friction points?
2️⃣ Expansion beyond initial banks
Do more UK institutions join through the tokenization-as-a-service model, or does participation stay limited?
3️⃣ Global coordination
Does this connect meaningfully with similar efforts like HSBC and Standard Chartered's Swift-based transaction, building genuine cross-border interoperability?
💡 The key takeaway
This isn't crypto adoption in the way most people think of it. It's traditional banks building their own tokenized infrastructure, deliberately choosing regulated, bank-anchored digital money over the stablecoin model crypto has embraced.
The real question is whether this becomes a genuine parallel system that coexists with crypto-native stablecoins, or whether it ends up competing directly for the same use cases tokenization was supposed to unlock.
That is the part worth watching.
This post is for informational and educational purposes only and is not financial advice. Crypto markets are volatile. Always conduct your own research before making financial decisions.
#BinanceSquare #Tokenization #Banking #UKFinance #Crypto
{spot}(QNTUSDT)
Britain's Biggest Banks Just Ran Real Tokenized Deposit Transactions: What It Means
Barclays, HSBC, NatWest and others are testing programmable bank money. Here's how this compares to stablecoins, and why it matters.
🏦 While the crypto world debates stablecoins, Britain's biggest banks quietly launched something different, and it's actually live.
UK Finance, alongside Barclays, HSBC, Lloyds Banking Group, NatWest, Nationwide, and Santander, has launched an industry-wide pilot delivering the first real UK transactions of tokenized sterling deposits. This isn't a whitepaper or a proposal; actual money is moving through this system now.
💷 Here's what a tokenized deposit actually is, and why it's different from a stablecoin.
A tokenized deposit is a digital representation of ordinary commercial bank money, the same pounds sitting in a regular bank account, just issued in programmable, blockchain-based form. Unlike a stablecoin, it sits fully within existing bank regulation and deposit protection rules. It's not a new kind of money; it's your existing bank balance made faster and programmable.
⚖️ Here's why banks and regulators are choosing this path specifically.
Bank of England Governor Andrew Bailey has been explicit about this, he's urged banks to prioritize tokenization over issuing their own stablecoins, warning that widespread bank-issued stablecoins could actually threaten financial stability. Tokenized deposits let banks gain the speed and programmability benefits of blockchain technology while keeping money inside the existing, regulated banking system rather than creating a new, separate form of currency.
🔧 Here's what's actually being tested.
The pilot covers three real use cases, peer-to-peer payments through online marketplaces with stronger fraud protection, remortgaging processes designed to speed up conveyancing, and digital asset settlement connecting tokenized bank money directly to tokenized assets. Quant is providing the underlying infrastructure, with EY and Linklaters supporting on the advisory side. The pilot runs through mid-2026.
🧠 Why should this matter to you, even outside the UK?
This is a genuine signal about which model traditional finance is choosing as tokenization becomes mainstream, bank-controlled, regulator-approved digital money, rather than the private stablecoin model that's dominated crypto's own growth. HSBC has also already completed a live cross-border interbank transaction with Standard Chartered using tokenized deposits through Swift's blockchain-based ledger, with 17 banks across six continents preparing similar pilots. This isn't an isolated UK experiment; it's part of a broader global shift in how banks are approaching digital money.
✅ What this means for you
If you're focused on crypto and stablecoins specifically, this is a genuine competing model worth understanding, not a threat to dismiss. Bank-issued tokenized deposits and crypto-native stablecoins may end up serving different purposes, tokenized deposits for regulated, bank-anchored payments, stablecoins for crypto-native and cross-border use cases.
If you're interested in tokenization broadly, this is another major data point alongside the ECB's Pontes system, traditional finance isn't just watching tokenization happen, it's actively building competing infrastructure for it right now, at scale, with major institutions involved.
If you're trying to understand where global finance is heading, watching how this pilot performs through mid-2026, and whether it expands beyond the UK, tells you a lot about whether bank-led tokenization becomes a serious competitor to crypto-native stablecoins, or stays a niche institutional tool.
🟢 Bullish scenario
The pilot succeeds, expands beyond its initial six banks, and tokenized deposits become a genuine parallel infrastructure to stablecoins, accelerating broader tokenization adoption across traditional finance.
🔴 Risk scenario
Adoption stays limited to pilot participants, the complexity of integrating across multiple banks slows progress, and tokenized deposits remain a niche experiment rather than mainstream infrastructure.
👀 Three things to watch
1️⃣ Pilot results at mid-2026
Does the program show clear success across its three use cases, or reveal real friction points?
2️⃣ Expansion beyond initial banks
Do more UK institutions join through the tokenization-as-a-service model, or does participation stay limited?
3️⃣ Global coordination
Does this connect meaningfully with similar efforts like HSBC and Standard Chartered's Swift-based transaction, building genuine cross-border interoperability?
💡 The key takeaway
This isn't crypto adoption in the way most people think of it. It's traditional banks building their own tokenized infrastructure, deliberately choosing regulated, bank-anchored digital money over the stablecoin model crypto has embraced.
The real question is whether this becomes a genuine parallel system that coexists with crypto-native stablecoins, or whether it ends up competing directly for the same use cases tokenization was supposed to unlock.
That is the part worth watching.
This post is for informational and educational purposes only and is not financial advice. Crypto markets are volatile. Always conduct your own research before making financial decisions.
#BinanceSquare #Tokenization #Banking #UKFinance #Crypto
🏦 While the crypto world debates stablecoins, Britain's biggest banks quietly launched something different, and it's actually live.
UK Finance, alongside Barclays, HSBC, Lloyds Banking Group, NatWest, Nationwide, and Santander, has launched an industry-wide pilot delivering the first real UK transactions of tokenized sterling deposits. This isn't a whitepaper or a proposal; actual money is moving through this system now.
💷 Here's what a tokenized deposit actually is, and why it's different from a stablecoin.
A tokenized deposit is a digital representation of ordinary commercial bank money, the same pounds sitting in a regular bank account, just issued in programmable, blockchain-based form. Unlike a stablecoin, it sits fully within existing bank regulation and deposit protection rules. It's not a new kind of money; it's your existing bank balance made faster and programmable.
⚖️ Here's why banks and regulators are choosing this path specifically.
Bank of England Governor Andrew Bailey has been explicit about this, he's urged banks to prioritize tokenization over issuing their own stablecoins, warning that widespread bank-issued stablecoins could actually threaten financial stability. Tokenized deposits let banks gain the speed and programmability benefits of blockchain technology while keeping money inside the existing, regulated banking system rather than creating a new, separate form of currency.
🔧 Here's what's actually being tested.
The pilot covers three real use cases, peer-to-peer payments through online marketplaces with stronger fraud protection, remortgaging processes designed to speed up conveyancing, and digital asset settlement connecting tokenized bank money directly to tokenized assets. Quant is providing the underlying infrastructure, with EY and Linklaters supporting on the advisory side. The pilot runs through mid-2026.
🧠 Why should this matter to you, even outside the UK?
This is a genuine signal about which model traditional finance is choosing as tokenization becomes mainstream, bank-controlled, regulator-approved digital money, rather than the private stablecoin model that's dominated crypto's own growth. HSBC has also already completed a live cross-border interbank transaction with Standard Chartered using tokenized deposits through Swift's blockchain-based ledger, with 17 banks across six continents preparing similar pilots. This isn't an isolated UK experiment; it's part of a broader global shift in how banks are approaching digital money.
✅ What this means for you
If you're focused on crypto and stablecoins specifically, this is a genuine competing model worth understanding, not a threat to dismiss. Bank-issued tokenized deposits and crypto-native stablecoins may end up serving different purposes, tokenized deposits for regulated, bank-anchored payments, stablecoins for crypto-native and cross-border use cases.
If you're interested in tokenization broadly, this is another major data point alongside the ECB's Pontes system, traditional finance isn't just watching tokenization happen, it's actively building competing infrastructure for it right now, at scale, with major institutions involved.
If you're trying to understand where global finance is heading, watching how this pilot performs through mid-2026, and whether it expands beyond the UK, tells you a lot about whether bank-led tokenization becomes a serious competitor to crypto-native stablecoins, or stays a niche institutional tool.
🟢 Bullish scenario
The pilot succeeds, expands beyond its initial six banks, and tokenized deposits become a genuine parallel infrastructure to stablecoins, accelerating broader tokenization adoption across traditional finance.
🔴 Risk scenario
Adoption stays limited to pilot participants, the complexity of integrating across multiple banks slows progress, and tokenized deposits remain a niche experiment rather than mainstream infrastructure.
👀 Three things to watch
1️⃣ Pilot results at mid-2026
Does the program show clear success across its three use cases, or reveal real friction points?
2️⃣ Expansion beyond initial banks
Do more UK institutions join through the tokenization-as-a-service model, or does participation stay limited?
3️⃣ Global coordination
Does this connect meaningfully with similar efforts like HSBC and Standard Chartered's Swift-based transaction, building genuine cross-border interoperability?
💡 The key takeaway
This isn't crypto adoption in the way most people think of it. It's traditional banks building their own tokenized infrastructure, deliberately choosing regulated, bank-anchored digital money over the stablecoin model crypto has embraced.
The real question is whether this becomes a genuine parallel system that coexists with crypto-native stablecoins, or whether it ends up competing directly for the same use cases tokenization was supposed to unlock.
That is the part worth watching.
This post is for informational and educational purposes only and is not financial advice. Crypto markets are volatile. Always conduct your own research before making financial decisions.
#BinanceSquare #Tokenization #Banking #UKFinance #Crypto
1
2
38
Article
Zcash Pulls Back 10.9%: Is the Rally Over, or Just Catching Its Breath?No new bad news, just profit-taking after a massive run. Here's how to read this kind of correction.
📉 Red day after weeks of green always feels alarming. Here's why this one probably isn't what it looks like.
ZEC dropped nearly 11% in 24 hours this week, the sharpest pullback since its historic run began. Before you panic, here's the important detail, there's no new negative news behind it.
🔍 Here's what actually happened.
This was a technical correction following an overextended rally, amplified by roughly 12 million dollars in long liquidations as leveraged traders got squeezed out. No regulatory action, no security issue, no bad development news, just a market that ran hot and is now cooling off.
🧠 Here's why that distinction actually matters.
There are two completely different kinds of pullbacks in crypto, and confusing them leads to bad decisions. One kind happens because something genuinely changed, bad news, a hack, a broken thesis. The other happens simply because price moved too far too fast, and the market needs to breathe before its next move, whichever direction that turns out to be.
This pullback is clearly the second kind. Understanding that difference is the single most useful thing you can take from this move.
📊 Here's the bigger context worth remembering.
ZEC has had multiple sharp corrections throughout its 2026 run, sometimes 15-20% pullbacks, and each time it eventually found support and continued higher as the underlying privacy-coin narrative kept building. Volatility like this has been a consistent feature of this rally, not a sign it's breaking down.
✅ What this means for you
If you're holding ZEC from lower levels, a correction like this after a massive run is a completely normal part of a strong trend, not evidence the thesis has changed. Panic selling into a pullback with no fundamental trigger is exactly how people give back gains unnecessarily.
If you're on the sidelines wishing you'd bought earlier, corrections like this are often exactly the entry point patient buyers wait for, though nobody can call the exact bottom. Watching whether ZEC finds support and stabilizes over the next few days tells you more than trying to guess the exact low.
If you're actively trading, this is a textbook example of leverage amplifying a normal move into something that looks scarier than it is. The 12 million dollars in liquidations reflects overleveraged positions getting cleared out, not a change in ZEC's actual demand story.
🟢 Bullish scenario
This correction fully clears out excess leverage, ZEC finds support, and the underlying privacy coin narrative resumes driving price higher from a healthier, less overextended base.
🔴 Risk scenario
This pullback deepens beyond typical correction territory, the broader privacy coin narrative loses momentum, and ZEC struggles to reclaim its recent highs.
👀 Three things to watch
1️⃣ Support levels
Does ZEC find a clear floor and stabilize, or does the pullback continue deepening?
2️⃣ Futures open interest
Does leveraged positioning reset to healthier levels, reducing the risk of another sharp liquidation-driven move?
3️⃣ ETF flow data
Do inflows into the Grayscale ZCSH fund, the actual catalyst behind this rally, continue, or do they slow alongside the price pullback?
💡 The key takeaway
A double-digit drop looks scary on a chart. But without a real negative catalyst behind it, this reads as a normal, healthy correction after an extraordinary run, not a breakdown in the thesis that drove ZEC into the top 10 in the first place.
The real question isn't whether this pullback happened, corrections like this are a normal part of strong rallies. It's whether ZEC finds support and resumes its trend, or whether this becomes the start of something bigger.
That is the part worth watching.
This post is for informational and educational purposes only and is not financial advice. Crypto markets are volatile. Always conduct your own research before making financial decisions.
#BinanceSquare #Zcash #ZEC #Privacy #Crypto
{spot}(ZECUSDT)
Zcash Pulls Back 10.9%: Is the Rally Over, or Just Catching Its Breath?
No new bad news, just profit-taking after a massive run. Here's how to read this kind of correction.
📉 Red day after weeks of green always feels alarming. Here's why this one probably isn't what it looks like.
ZEC dropped nearly 11% in 24 hours this week, the sharpest pullback since its historic run began. Before you panic, here's the important detail, there's no new negative news behind it.
🔍 Here's what actually happened.
This was a technical correction following an overextended rally, amplified by roughly 12 million dollars in long liquidations as leveraged traders got squeezed out. No regulatory action, no security issue, no bad development news, just a market that ran hot and is now cooling off.
🧠 Here's why that distinction actually matters.
There are two completely different kinds of pullbacks in crypto, and confusing them leads to bad decisions. One kind happens because something genuinely changed, bad news, a hack, a broken thesis. The other happens simply because price moved too far too fast, and the market needs to breathe before its next move, whichever direction that turns out to be.
This pullback is clearly the second kind. Understanding that difference is the single most useful thing you can take from this move.
📊 Here's the bigger context worth remembering.
ZEC has had multiple sharp corrections throughout its 2026 run, sometimes 15-20% pullbacks, and each time it eventually found support and continued higher as the underlying privacy-coin narrative kept building. Volatility like this has been a consistent feature of this rally, not a sign it's breaking down.
✅ What this means for you
If you're holding ZEC from lower levels, a correction like this after a massive run is a completely normal part of a strong trend, not evidence the thesis has changed. Panic selling into a pullback with no fundamental trigger is exactly how people give back gains unnecessarily.
If you're on the sidelines wishing you'd bought earlier, corrections like this are often exactly the entry point patient buyers wait for, though nobody can call the exact bottom. Watching whether ZEC finds support and stabilizes over the next few days tells you more than trying to guess the exact low.
If you're actively trading, this is a textbook example of leverage amplifying a normal move into something that looks scarier than it is. The 12 million dollars in liquidations reflects overleveraged positions getting cleared out, not a change in ZEC's actual demand story.
🟢 Bullish scenario
This correction fully clears out excess leverage, ZEC finds support, and the underlying privacy coin narrative resumes driving price higher from a healthier, less overextended base.
🔴 Risk scenario
This pullback deepens beyond typical correction territory, the broader privacy coin narrative loses momentum, and ZEC struggles to reclaim its recent highs.
👀 Three things to watch
1️⃣ Support levels
Does ZEC find a clear floor and stabilize, or does the pullback continue deepening?
2️⃣ Futures open interest
Does leveraged positioning reset to healthier levels, reducing the risk of another sharp liquidation-driven move?
3️⃣ ETF flow data
Do inflows into the Grayscale ZCSH fund, the actual catalyst behind this rally, continue, or do they slow alongside the price pullback?
💡 The key takeaway
A double-digit drop looks scary on a chart. But without a real negative catalyst behind it, this reads as a normal, healthy correction after an extraordinary run, not a breakdown in the thesis that drove ZEC into the top 10 in the first place.
The real question isn't whether this pullback happened, corrections like this are a normal part of strong rallies. It's whether ZEC finds support and resumes its trend, or whether this becomes the start of something bigger.
That is the part worth watching.
This post is for informational and educational purposes only and is not financial advice. Crypto markets are volatile. Always conduct your own research before making financial decisions.
#BinanceSquare #Zcash #ZEC #Privacy #Crypto
📉 Red day after weeks of green always feels alarming. Here's why this one probably isn't what it looks like.
ZEC dropped nearly 11% in 24 hours this week, the sharpest pullback since its historic run began. Before you panic, here's the important detail, there's no new negative news behind it.
🔍 Here's what actually happened.
This was a technical correction following an overextended rally, amplified by roughly 12 million dollars in long liquidations as leveraged traders got squeezed out. No regulatory action, no security issue, no bad development news, just a market that ran hot and is now cooling off.
🧠 Here's why that distinction actually matters.
There are two completely different kinds of pullbacks in crypto, and confusing them leads to bad decisions. One kind happens because something genuinely changed, bad news, a hack, a broken thesis. The other happens simply because price moved too far too fast, and the market needs to breathe before its next move, whichever direction that turns out to be.
This pullback is clearly the second kind. Understanding that difference is the single most useful thing you can take from this move.
📊 Here's the bigger context worth remembering.
ZEC has had multiple sharp corrections throughout its 2026 run, sometimes 15-20% pullbacks, and each time it eventually found support and continued higher as the underlying privacy-coin narrative kept building. Volatility like this has been a consistent feature of this rally, not a sign it's breaking down.
✅ What this means for you
If you're holding ZEC from lower levels, a correction like this after a massive run is a completely normal part of a strong trend, not evidence the thesis has changed. Panic selling into a pullback with no fundamental trigger is exactly how people give back gains unnecessarily.
If you're on the sidelines wishing you'd bought earlier, corrections like this are often exactly the entry point patient buyers wait for, though nobody can call the exact bottom. Watching whether ZEC finds support and stabilizes over the next few days tells you more than trying to guess the exact low.
If you're actively trading, this is a textbook example of leverage amplifying a normal move into something that looks scarier than it is. The 12 million dollars in liquidations reflects overleveraged positions getting cleared out, not a change in ZEC's actual demand story.
🟢 Bullish scenario
This correction fully clears out excess leverage, ZEC finds support, and the underlying privacy coin narrative resumes driving price higher from a healthier, less overextended base.
🔴 Risk scenario
This pullback deepens beyond typical correction territory, the broader privacy coin narrative loses momentum, and ZEC struggles to reclaim its recent highs.
👀 Three things to watch
1️⃣ Support levels
Does ZEC find a clear floor and stabilize, or does the pullback continue deepening?
2️⃣ Futures open interest
Does leveraged positioning reset to healthier levels, reducing the risk of another sharp liquidation-driven move?
3️⃣ ETF flow data
Do inflows into the Grayscale ZCSH fund, the actual catalyst behind this rally, continue, or do they slow alongside the price pullback?
💡 The key takeaway
A double-digit drop looks scary on a chart. But without a real negative catalyst behind it, this reads as a normal, healthy correction after an extraordinary run, not a breakdown in the thesis that drove ZEC into the top 10 in the first place.
The real question isn't whether this pullback happened, corrections like this are a normal part of strong rallies. It's whether ZEC finds support and resumes its trend, or whether this becomes the start of something bigger.
That is the part worth watching.
This post is for informational and educational purposes only and is not financial advice. Crypto markets are volatile. Always conduct your own research before making financial decisions.
#BinanceSquare #Zcash #ZEC #Privacy #Crypto
1
2
195
Article
Bitcoin's Bear Markets Keep Getting Milder: Is This Cycle Structurally Different?ETFs and institutional capital may be smoothing out crypto's wildest swings. Here's the data behind the thesis, and where it could break down.
📉 Every crash used to feel catastrophic. The last one didn't, and that's not a coincidence, it's a trend you can actually measure.
Bitcoin has now been through seven distinct bear markets since 2014. Line them upside by side and one pattern stands out immediately, each one has hit less hard than the last.
📊 Let's look at the actual numbers.
The two worst drawdowns in Bitcoin's history, 2014-2015 and 2018-2019, both wiped out roughly 83% of its value, triggered by real structural failures, the Mt. Gox collapse and the ICO bubble bursting. The 2022-2023 bear market, following Terra's implosion and FTX's collapse, was still painful, but noticeably shallower than those earlier crashes. Every major down cycle since has softened compared to the one before it.
🏦 So why does this keep happening?
The leading theory ties directly to how much the market has broadened. More institutional money, spot ETFs, corporate balance sheets holding BTC, regulated custody solutions, tends to dampen extreme price swings in both directions. Pantera Capital's founder has argued this explicitly, calling brutal 80%+ crashes a relic of Bitcoin's early, thinly traded past now that the asset has entered a genuinely different era.
⚖️ Here's the trade-off that comes with this thesis, and it's worth sitting with.
If bear markets are shrinking because the market is maturing, the explosive upside probably shrinks right along with it. The wild 100x rallies that made crypto's early years legendary and the brutal 80% crashes tend to be two sides of the same volatility coin, you rarely get one without the other fading too. A calmer market cuts both ways.
🧠 Why does this actually matter for how you invest?
This reshapes what a realistic expectation looks like going forward. If part of your thesis still assumes 2017-style, life-changing overnight gains, that assumption may need updating as the market structurally shifts. And if your biggest fear is another Terra or FTX-style 80% wipeout, the historical trend suggests that exact severity has become less likely, though "less likely" is never the same as "impossible."
✅ What this means for you
If you're holding long-term, this pattern offers real, data-backed reassurance, but treat it as context, not a guarantee. The base rate for severe drawdowns has genuinely shifted lower over time, which is useful for how you size risk, not a reason to stop planning for one.
If you built your strategy around chasing extreme volatility, recognize that a maturing market likely offers fewer of the dramatic swings that created those outsized historical returns. It's worth genuinely reconsidering whether your approach still fits where the market actually is now.
If you're forming a longer-term view on Bitcoin, this milder-cycles pattern is one of the stronger, data-supported cases for real structural maturity, worth taking seriously rather than writing off as wishful narrative.
🟢 Bullish scenario
Institutional involvement keeps expanding, volatility keeps compressing in both directions, and Bitcoin increasingly trades like a maturing macro-asset rather than a purely speculative one.
🔴 Risk scenario
A genuine structural shock, a major regulatory crackdown or a systemic failure at a large institutional holder, breaks the milder-cycles pattern right when the market has stopped bracing for severe downside.
👀 Three things to watch
1️⃣ Institutional participation trends
Does ETF and corporate treasury involvement keep climbing, reinforcing the maturity argument?
2️⃣ Volatility metrics over time
Does Bitcoin's realized volatility keep compressing cycle over cycle, or does a future shock reverse the trend?
3️⃣ The next real bear market
When it eventually arrives, does its severity actually follow this shallowing pattern, or does something break it?
💡 The key takeaway
Seven cycles in, Bitcoin's bear markets have gotten measurably milder each time, and there's a real structural case for why, institutional maturity smoothing out extreme swings on both ends.
The real question isn't whether this pattern has held, the data says it has. It's whether you're actually prepared for what comes bundled with it, steadier cycles, but likely fewer of the explosive rallies that defined crypto's wildest early years.
That is the part worth watching.
This post is for informational and educational purposes only and is not financial advice. Crypto markets are volatile. Always conduct your own research before making financial decisions.
#BinanceSquare #Bitcoin #BTC #MarketCycles #Crypto
{spot}(BTCUSDT)
Bitcoin's Bear Markets Keep Getting Milder: Is This Cycle Structurally Different?
ETFs and institutional capital may be smoothing out crypto's wildest swings. Here's the data behind the thesis, and where it could break down.
📉 Every crash used to feel catastrophic. The last one didn't, and that's not a coincidence, it's a trend you can actually measure.
Bitcoin has now been through seven distinct bear markets since 2014. Line them upside by side and one pattern stands out immediately, each one has hit less hard than the last.
📊 Let's look at the actual numbers.
The two worst drawdowns in Bitcoin's history, 2014-2015 and 2018-2019, both wiped out roughly 83% of its value, triggered by real structural failures, the Mt. Gox collapse and the ICO bubble bursting. The 2022-2023 bear market, following Terra's implosion and FTX's collapse, was still painful, but noticeably shallower than those earlier crashes. Every major down cycle since has softened compared to the one before it.
🏦 So why does this keep happening?
The leading theory ties directly to how much the market has broadened. More institutional money, spot ETFs, corporate balance sheets holding BTC, regulated custody solutions, tends to dampen extreme price swings in both directions. Pantera Capital's founder has argued this explicitly, calling brutal 80%+ crashes a relic of Bitcoin's early, thinly traded past now that the asset has entered a genuinely different era.
⚖️ Here's the trade-off that comes with this thesis, and it's worth sitting with.
If bear markets are shrinking because the market is maturing, the explosive upside probably shrinks right along with it. The wild 100x rallies that made crypto's early years legendary and the brutal 80% crashes tend to be two sides of the same volatility coin, you rarely get one without the other fading too. A calmer market cuts both ways.
🧠 Why does this actually matter for how you invest?
This reshapes what a realistic expectation looks like going forward. If part of your thesis still assumes 2017-style, life-changing overnight gains, that assumption may need updating as the market structurally shifts. And if your biggest fear is another Terra or FTX-style 80% wipeout, the historical trend suggests that exact severity has become less likely, though "less likely" is never the same as "impossible."
✅ What this means for you
If you're holding long-term, this pattern offers real, data-backed reassurance, but treat it as context, not a guarantee. The base rate for severe drawdowns has genuinely shifted lower over time, which is useful for how you size risk, not a reason to stop planning for one.
If you built your strategy around chasing extreme volatility, recognize that a maturing market likely offers fewer of the dramatic swings that created those outsized historical returns. It's worth genuinely reconsidering whether your approach still fits where the market actually is now.
If you're forming a longer-term view on Bitcoin, this milder-cycles pattern is one of the stronger, data-supported cases for real structural maturity, worth taking seriously rather than writing off as wishful narrative.
🟢 Bullish scenario
Institutional involvement keeps expanding, volatility keeps compressing in both directions, and Bitcoin increasingly trades like a maturing macro-asset rather than a purely speculative one.
🔴 Risk scenario
A genuine structural shock, a major regulatory crackdown or a systemic failure at a large institutional holder, breaks the milder-cycles pattern right when the market has stopped bracing for severe downside.
👀 Three things to watch
1️⃣ Institutional participation trends
Does ETF and corporate treasury involvement keep climbing, reinforcing the maturity argument?
2️⃣ Volatility metrics over time
Does Bitcoin's realized volatility keep compressing cycle over cycle, or does a future shock reverse the trend?
3️⃣ The next real bear market
When it eventually arrives, does its severity actually follow this shallowing pattern, or does something break it?
💡 The key takeaway
Seven cycles in, Bitcoin's bear markets have gotten measurably milder each time, and there's a real structural case for why, institutional maturity smoothing out extreme swings on both ends.
The real question isn't whether this pattern has held, the data says it has. It's whether you're actually prepared for what comes bundled with it, steadier cycles, but likely fewer of the explosive rallies that defined crypto's wildest early years.
That is the part worth watching.
This post is for informational and educational purposes only and is not financial advice. Crypto markets are volatile. Always conduct your own research before making financial decisions.
#BinanceSquare #Bitcoin #BTC #MarketCycles #Crypto
📉 Every crash used to feel catastrophic. The last one didn't, and that's not a coincidence, it's a trend you can actually measure.
Bitcoin has now been through seven distinct bear markets since 2014. Line them upside by side and one pattern stands out immediately, each one has hit less hard than the last.
📊 Let's look at the actual numbers.
The two worst drawdowns in Bitcoin's history, 2014-2015 and 2018-2019, both wiped out roughly 83% of its value, triggered by real structural failures, the Mt. Gox collapse and the ICO bubble bursting. The 2022-2023 bear market, following Terra's implosion and FTX's collapse, was still painful, but noticeably shallower than those earlier crashes. Every major down cycle since has softened compared to the one before it.
🏦 So why does this keep happening?
The leading theory ties directly to how much the market has broadened. More institutional money, spot ETFs, corporate balance sheets holding BTC, regulated custody solutions, tends to dampen extreme price swings in both directions. Pantera Capital's founder has argued this explicitly, calling brutal 80%+ crashes a relic of Bitcoin's early, thinly traded past now that the asset has entered a genuinely different era.
⚖️ Here's the trade-off that comes with this thesis, and it's worth sitting with.
If bear markets are shrinking because the market is maturing, the explosive upside probably shrinks right along with it. The wild 100x rallies that made crypto's early years legendary and the brutal 80% crashes tend to be two sides of the same volatility coin, you rarely get one without the other fading too. A calmer market cuts both ways.
🧠 Why does this actually matter for how you invest?
This reshapes what a realistic expectation looks like going forward. If part of your thesis still assumes 2017-style, life-changing overnight gains, that assumption may need updating as the market structurally shifts. And if your biggest fear is another Terra or FTX-style 80% wipeout, the historical trend suggests that exact severity has become less likely, though "less likely" is never the same as "impossible."
✅ What this means for you
If you're holding long-term, this pattern offers real, data-backed reassurance, but treat it as context, not a guarantee. The base rate for severe drawdowns has genuinely shifted lower over time, which is useful for how you size risk, not a reason to stop planning for one.
If you built your strategy around chasing extreme volatility, recognize that a maturing market likely offers fewer of the dramatic swings that created those outsized historical returns. It's worth genuinely reconsidering whether your approach still fits where the market actually is now.
If you're forming a longer-term view on Bitcoin, this milder-cycles pattern is one of the stronger, data-supported cases for real structural maturity, worth taking seriously rather than writing off as wishful narrative.
🟢 Bullish scenario
Institutional involvement keeps expanding, volatility keeps compressing in both directions, and Bitcoin increasingly trades like a maturing macro-asset rather than a purely speculative one.
🔴 Risk scenario
A genuine structural shock, a major regulatory crackdown or a systemic failure at a large institutional holder, breaks the milder-cycles pattern right when the market has stopped bracing for severe downside.
👀 Three things to watch
1️⃣ Institutional participation trends
Does ETF and corporate treasury involvement keep climbing, reinforcing the maturity argument?
2️⃣ Volatility metrics over time
Does Bitcoin's realized volatility keep compressing cycle over cycle, or does a future shock reverse the trend?
3️⃣ The next real bear market
When it eventually arrives, does its severity actually follow this shallowing pattern, or does something break it?
💡 The key takeaway
Seven cycles in, Bitcoin's bear markets have gotten measurably milder each time, and there's a real structural case for why, institutional maturity smoothing out extreme swings on both ends.
The real question isn't whether this pattern has held, the data says it has. It's whether you're actually prepared for what comes bundled with it, steadier cycles, but likely fewer of the explosive rallies that defined crypto's wildest early years.
That is the part worth watching.
This post is for informational and educational purposes only and is not financial advice. Crypto markets are volatile. Always conduct your own research before making financial decisions.
#BinanceSquare #Bitcoin #BTC #MarketCycles #Crypto
1
2
11
Article
Morpho Surges as Coinbase Builds Fixed-Rate Loans on Its InfrastructureA DeFi lending protocol just became the backbone for a major exchange's new product. Here's why that matters more than the price move.
🏗️ Most crypto integrations are announced with fanfare. This one just quietly became one of the largest DeFi-to-fintech bridges in the industry.
$MORPHO surged over 3% as Coinbase rolled out USDC lending directly inside its app, letting users earn yields up to 10.8% through an on-chain integration with Morpho's protocol.
⚙️ Here's what's actually happening under the hood.
When Coinbase users deposit USDC, funds route through Morpho Vaults, curated by Steakhouse Financial, which actively manage risk and allocate liquidity across multiple lending markets to optimize returns. Users earn yield from real borrowers on the other side, including Coinbase customers taking USDC loans against their Bitcoin, a separate Morpho-powered product that's already originated over 900 million dollars in loans.
🧩 Why does this matter more than a single feature launch?
This isn't Coinbase experimenting with DeFi on the side. Lending and borrowing now form a complete on chain product suite for the exchange, built entirely on Morpho's infrastructure. Morpho's own team calls this pattern the "DeFi Mullet," fintech user experience up front, institutional-grade DeFi infrastructure running underneath. It's becoming the blueprint other major platforms are starting to copy.
🧠 Here's the part that actually matters for how you think about this.
Most retail users interacting with this new Coinbase feature will never know Morpho's name, they'll just see a clean lending product inside an app they already trust. That's exactly the point, and exactly why it's significant. Morpho isn't trying to become the next retail-facing brand, it's becoming the infrastructure layer other trusted brands build on top of.
That's a fundamentally different growth path than a typical DeFi protocol chasing its own user base directly.
✅ What this means for you
If you're holding MORPHO, understand what's actually driving demand here, real integration volume from a major exchange, not speculative hype. That tends to be a more durable kind of growth, tied to genuine usage rather than sentiment alone.
If you're a Coinbase user, this is directly relevant even if you've never touched MORPHO the token, you can now earn meaningfully higher yield on idle USDC than the platform's standard rewards rate, worth understanding the mechanics before depositing.
If you're trying to spot the next infrastructure play, this is a genuine pattern worth tracking, protocols becoming the invisible backend for trusted consumer platforms, rather than competing head-on for retail attention themselves.
🟢 Bullish scenario
More fintech and exchange platforms adopt the same "DeFi Mullet" model, Morpho's total integrated volume keeps growing, and this becomes a template other major players replicate.
🔴 Risk scenario
Growth stays concentrated around Coinbase specifically, broader adoption from other platforms doesn't materialize, and Morpho's token demand cools once this integration's initial excitement fades.
👀 Three things to watch
1️⃣ Deposit volume growth
Does real USDC lending volume through this integration keep climbing after the initial rollout?
2️⃣ Additional platform adoption
Do other major exchanges or fintechs announce similar Morpho-powered products?
3️⃣ Yield sustainability
Do advertised yields hold steady, or do they compress as more capital flows in and competes for the same borrowing demand?
💡 The key takeaway
This wasn't hype-driven speculation, it was a real institutional integration going live, and the price reaction reflects the market pricing in what that actually means for demand.
The real question is whether this becomes the first of many major platforms building on Morpho's infrastructure, or a single high-profile partnership that doesn't repeat elsewhere.
That is the part worth watching.
This post is for informational and educational purposes only and is not financial advice. Crypto markets are volatile. Always conduct your own research before making financial decisions.
#BinanceSquare #Morpho #DeFi #Coinbase #Crypto
{spot}(MORPHOUSDT)
Morpho Surges as Coinbase Builds Fixed-Rate Loans on Its Infrastructure
A DeFi lending protocol just became the backbone for a major exchange's new product. Here's why that matters more than the price move.
🏗️ Most crypto integrations are announced with fanfare. This one just quietly became one of the largest DeFi-to-fintech bridges in the industry.
$MORPHO surged over 3% as Coinbase rolled out USDC lending directly inside its app, letting users earn yields up to 10.8% through an on-chain integration with Morpho's protocol.
⚙️ Here's what's actually happening under the hood.
When Coinbase users deposit USDC, funds route through Morpho Vaults, curated by Steakhouse Financial, which actively manage risk and allocate liquidity across multiple lending markets to optimize returns. Users earn yield from real borrowers on the other side, including Coinbase customers taking USDC loans against their Bitcoin, a separate Morpho-powered product that's already originated over 900 million dollars in loans.
🧩 Why does this matter more than a single feature launch?
This isn't Coinbase experimenting with DeFi on the side. Lending and borrowing now form a complete on chain product suite for the exchange, built entirely on Morpho's infrastructure. Morpho's own team calls this pattern the "DeFi Mullet," fintech user experience up front, institutional-grade DeFi infrastructure running underneath. It's becoming the blueprint other major platforms are starting to copy.
🧠 Here's the part that actually matters for how you think about this.
Most retail users interacting with this new Coinbase feature will never know Morpho's name, they'll just see a clean lending product inside an app they already trust. That's exactly the point, and exactly why it's significant. Morpho isn't trying to become the next retail-facing brand, it's becoming the infrastructure layer other trusted brands build on top of.
That's a fundamentally different growth path than a typical DeFi protocol chasing its own user base directly.
✅ What this means for you
If you're holding MORPHO, understand what's actually driving demand here, real integration volume from a major exchange, not speculative hype. That tends to be a more durable kind of growth, tied to genuine usage rather than sentiment alone.
If you're a Coinbase user, this is directly relevant even if you've never touched MORPHO the token, you can now earn meaningfully higher yield on idle USDC than the platform's standard rewards rate, worth understanding the mechanics before depositing.
If you're trying to spot the next infrastructure play, this is a genuine pattern worth tracking, protocols becoming the invisible backend for trusted consumer platforms, rather than competing head-on for retail attention themselves.
🟢 Bullish scenario
More fintech and exchange platforms adopt the same "DeFi Mullet" model, Morpho's total integrated volume keeps growing, and this becomes a template other major players replicate.
🔴 Risk scenario
Growth stays concentrated around Coinbase specifically, broader adoption from other platforms doesn't materialize, and Morpho's token demand cools once this integration's initial excitement fades.
👀 Three things to watch
1️⃣ Deposit volume growth
Does real USDC lending volume through this integration keep climbing after the initial rollout?
2️⃣ Additional platform adoption
Do other major exchanges or fintechs announce similar Morpho-powered products?
3️⃣ Yield sustainability
Do advertised yields hold steady, or do they compress as more capital flows in and competes for the same borrowing demand?
💡 The key takeaway
This wasn't hype-driven speculation, it was a real institutional integration going live, and the price reaction reflects the market pricing in what that actually means for demand.
The real question is whether this becomes the first of many major platforms building on Morpho's infrastructure, or a single high-profile partnership that doesn't repeat elsewhere.
That is the part worth watching.
This post is for informational and educational purposes only and is not financial advice. Crypto markets are volatile. Always conduct your own research before making financial decisions.
#BinanceSquare #Morpho #DeFi #Coinbase #Crypto
🏗️ Most crypto integrations are announced with fanfare. This one just quietly became one of the largest DeFi-to-fintech bridges in the industry.
$MORPHO surged over 3% as Coinbase rolled out USDC lending directly inside its app, letting users earn yields up to 10.8% through an on-chain integration with Morpho's protocol.
⚙️ Here's what's actually happening under the hood.
When Coinbase users deposit USDC, funds route through Morpho Vaults, curated by Steakhouse Financial, which actively manage risk and allocate liquidity across multiple lending markets to optimize returns. Users earn yield from real borrowers on the other side, including Coinbase customers taking USDC loans against their Bitcoin, a separate Morpho-powered product that's already originated over 900 million dollars in loans.
🧩 Why does this matter more than a single feature launch?
This isn't Coinbase experimenting with DeFi on the side. Lending and borrowing now form a complete on chain product suite for the exchange, built entirely on Morpho's infrastructure. Morpho's own team calls this pattern the "DeFi Mullet," fintech user experience up front, institutional-grade DeFi infrastructure running underneath. It's becoming the blueprint other major platforms are starting to copy.
🧠 Here's the part that actually matters for how you think about this.
Most retail users interacting with this new Coinbase feature will never know Morpho's name, they'll just see a clean lending product inside an app they already trust. That's exactly the point, and exactly why it's significant. Morpho isn't trying to become the next retail-facing brand, it's becoming the infrastructure layer other trusted brands build on top of.
That's a fundamentally different growth path than a typical DeFi protocol chasing its own user base directly.
✅ What this means for you
If you're holding MORPHO, understand what's actually driving demand here, real integration volume from a major exchange, not speculative hype. That tends to be a more durable kind of growth, tied to genuine usage rather than sentiment alone.
If you're a Coinbase user, this is directly relevant even if you've never touched MORPHO the token, you can now earn meaningfully higher yield on idle USDC than the platform's standard rewards rate, worth understanding the mechanics before depositing.
If you're trying to spot the next infrastructure play, this is a genuine pattern worth tracking, protocols becoming the invisible backend for trusted consumer platforms, rather than competing head-on for retail attention themselves.
🟢 Bullish scenario
More fintech and exchange platforms adopt the same "DeFi Mullet" model, Morpho's total integrated volume keeps growing, and this becomes a template other major players replicate.
🔴 Risk scenario
Growth stays concentrated around Coinbase specifically, broader adoption from other platforms doesn't materialize, and Morpho's token demand cools once this integration's initial excitement fades.
👀 Three things to watch
1️⃣ Deposit volume growth
Does real USDC lending volume through this integration keep climbing after the initial rollout?
2️⃣ Additional platform adoption
Do other major exchanges or fintechs announce similar Morpho-powered products?
3️⃣ Yield sustainability
Do advertised yields hold steady, or do they compress as more capital flows in and competes for the same borrowing demand?
💡 The key takeaway
This wasn't hype-driven speculation, it was a real institutional integration going live, and the price reaction reflects the market pricing in what that actually means for demand.
The real question is whether this becomes the first of many major platforms building on Morpho's infrastructure, or a single high-profile partnership that doesn't repeat elsewhere.
That is the part worth watching.
This post is for informational and educational purposes only and is not financial advice. Crypto markets are volatile. Always conduct your own research before making financial decisions.
#BinanceSquare #Morpho #DeFi #Coinbase #Crypto
1
2
82
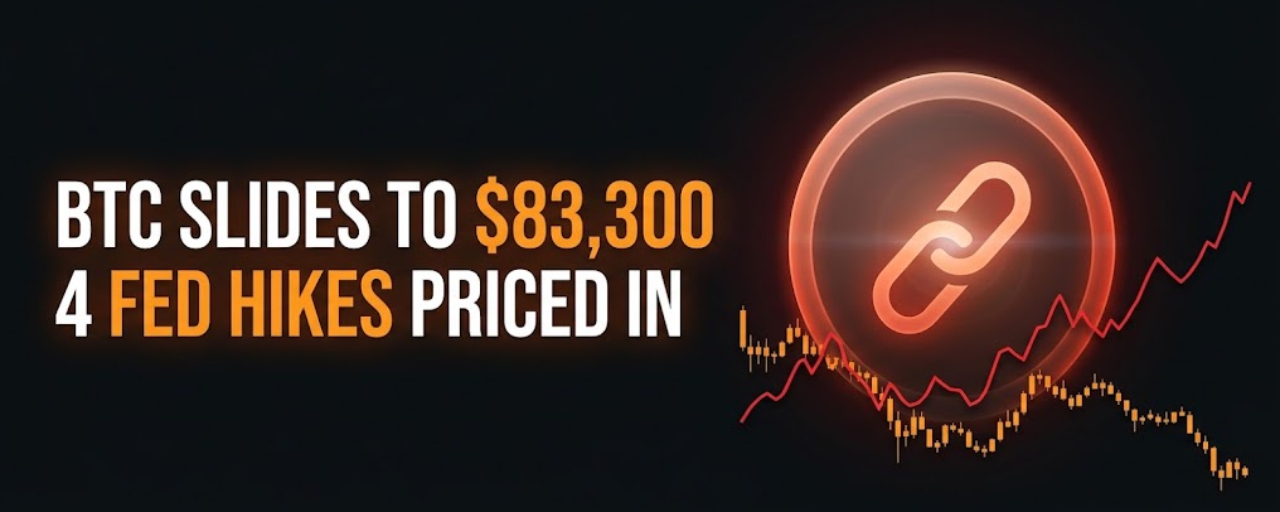
Article
BTC Slides to $83,300 as Traders Price In 4 Fed Hikes by 2027 Real Correlation This TimeUnlike the 30-year story from earlier this week, this one comes with an actual price move attached.
🚀 A few days ago we covered the 30-year Treasury yield hitting a 2004 high, and Bitcoin barely blinked. Two whales even opened a $171 million long position right into that macro headwind.
This time is different. The 10-year Treasury yield just climbed to its highest level since 2007, and Bitcoin actually moved with it, sliding down toward $83,300.
🔐 What changed between then and now?
The catalyst this time is more concrete. A stronger-than-expected US September PMI reading came in at 58.4, the fastest pace of expansion since 2021, with the Input Prices Index hitting its highest level since October 2022. That's a signal of persistent inflationary pressure, and markets reacted immediately. CME data showed the probability of a 25-basis-point rate hike in October rising to roughly 69.7%. Treasury yields surged in response, gold and silver sold off sharply too, silver fell more than 3%, gold dropped below $4,300, and US equity indices closed lower across the board, ending the Nasdaq's streak of record closes.
🧠 Why does this move matter more than the 30-year story did?
Because correlation isn't constant, it comes and goes depending on what's actually driving the yield move. The 30-year yield story earlier this week was more of a slow-burning structural story, fiscal concerns, heavy government borrowing, a grinding multi-month repricing. This 10-year move is sharper and more directly tied to a single fresh data point, the PMI report, that changes near-term Fed expectations in a way markets can price immediately. When the catalyst is that immediate and concrete, risk assets tend to react faster and more visibly, and that's exactly what happened here.
📊 The rate expectations have shifted meaningfully too.
Traders are now pricing in four separate Fed rate hikes by June 2027. That's a materially more hawkish path than markets were positioned for even a few weeks ago, and it reflects a genuine repricing of how long tighter monetary policy is expected to stick around, not just a one-day reaction to a single data point.
✅ What this means for you
If you're holding BTC, this is a cleaner real-world test of the "does Bitcoin actually trade like a rate-sensitive risk asset" question than the 30-year story gave us. Watch how BTC behaves over the coming sessions as this repricing settles, does it stabilize and decouple again, or does it continue tracking the broader risk-off move across equities, gold, and silver?
If you're on the sidelines, remember that not every yield headline moves crypto the same way. The specific catalyst matters, a slow structural yield climb and a sharp PMI-driven repricing of Fed hike odds are different kinds of macro-events, even when the underlying number (a rising yield) looks similar on the surface.
If you're building a habit of reading macro correctly, this is a genuinely useful comparison case. Two yield stories, one that BTC shrugged off and one it reacted sharply to, in the same week. The difference tells you something real about what actually moves this market versus what's just a headline.
🟢 Bullish scenario
The PMI-driven repricing proves temporary, upcoming inflation data comes in softer than feared, rate hike odds ease back down, and Bitcoin recovers toward its recent range as the immediate catalyst fades.
🔴 Risk scenario
Inflation data continues running hot, the market fully prices in the four-hike path through 2027, and Bitcoin extends its slide alongside gold, silver, and equities as tighter-for-longer policy becomes the base case rather than a risk scenario.
👀 Three things to watch
1️⃣ Upcoming inflation data
Do the next CPI and PCE readings confirm the inflationary signal from this PMI report, or does it prove to be a one-off spike?
2️⃣ Whether the four-hike pricing holds
Does the market keep pricing in this more hawkish path, or does it walk it back as more data comes in over the following weeks?
3️⃣ Bitcoin's behavior relative to gold and silver
Does BTC keep moving in tandem with traditional safe-haven assets during this repricing, or does it eventually decouple again the way it did during the 30-year story?
💡 The key takeaway
Not every macro-headline hit crypto the same way. A slow-moving 30-year yield story barely dented Bitcoin earlier this week. A sharp, data-driven repricing of near-term Fed hike odds just sent it sliding toward $83,300, alongside gold, silver, and equities.
The real question is whether this is the start of a genuinely tighter-for-longer macro-regime reasserting real correlation between Bitcoin and traditional risk assets, or a short-term reaction to one strong PMI print that fades once the next data point lands.
That is the part worth watching.
This post is for informational and educational purposes only and is not financial advice. Crypto markets are volatile. Always conduct your own research before making financial decisions.
#BinanceSquare #Bitcoin #Macro #Fed #Crypto
{spot}(BTCUSDT)
BTC Slides to $83,300 as Traders Price In 4 Fed Hikes by 2027 Real Correlation This Time
Unlike the 30-year story from earlier this week, this one comes with an actual price move attached.
🚀 A few days ago we covered the 30-year Treasury yield hitting a 2004 high, and Bitcoin barely blinked. Two whales even opened a $171 million long position right into that macro headwind.
This time is different. The 10-year Treasury yield just climbed to its highest level since 2007, and Bitcoin actually moved with it, sliding down toward $83,300.
🔐 What changed between then and now?
The catalyst this time is more concrete. A stronger-than-expected US September PMI reading came in at 58.4, the fastest pace of expansion since 2021, with the Input Prices Index hitting its highest level since October 2022. That's a signal of persistent inflationary pressure, and markets reacted immediately. CME data showed the probability of a 25-basis-point rate hike in October rising to roughly 69.7%. Treasury yields surged in response, gold and silver sold off sharply too, silver fell more than 3%, gold dropped below $4,300, and US equity indices closed lower across the board, ending the Nasdaq's streak of record closes.
🧠 Why does this move matter more than the 30-year story did?
Because correlation isn't constant, it comes and goes depending on what's actually driving the yield move. The 30-year yield story earlier this week was more of a slow-burning structural story, fiscal concerns, heavy government borrowing, a grinding multi-month repricing. This 10-year move is sharper and more directly tied to a single fresh data point, the PMI report, that changes near-term Fed expectations in a way markets can price immediately. When the catalyst is that immediate and concrete, risk assets tend to react faster and more visibly, and that's exactly what happened here.
📊 The rate expectations have shifted meaningfully too.
Traders are now pricing in four separate Fed rate hikes by June 2027. That's a materially more hawkish path than markets were positioned for even a few weeks ago, and it reflects a genuine repricing of how long tighter monetary policy is expected to stick around, not just a one-day reaction to a single data point.
✅ What this means for you
If you're holding BTC, this is a cleaner real-world test of the "does Bitcoin actually trade like a rate-sensitive risk asset" question than the 30-year story gave us. Watch how BTC behaves over the coming sessions as this repricing settles, does it stabilize and decouple again, or does it continue tracking the broader risk-off move across equities, gold, and silver?
If you're on the sidelines, remember that not every yield headline moves crypto the same way. The specific catalyst matters, a slow structural yield climb and a sharp PMI-driven repricing of Fed hike odds are different kinds of macro-events, even when the underlying number (a rising yield) looks similar on the surface.
If you're building a habit of reading macro correctly, this is a genuinely useful comparison case. Two yield stories, one that BTC shrugged off and one it reacted sharply to, in the same week. The difference tells you something real about what actually moves this market versus what's just a headline.
🟢 Bullish scenario
The PMI-driven repricing proves temporary, upcoming inflation data comes in softer than feared, rate hike odds ease back down, and Bitcoin recovers toward its recent range as the immediate catalyst fades.
🔴 Risk scenario
Inflation data continues running hot, the market fully prices in the four-hike path through 2027, and Bitcoin extends its slide alongside gold, silver, and equities as tighter-for-longer policy becomes the base case rather than a risk scenario.
👀 Three things to watch
1️⃣ Upcoming inflation data
Do the next CPI and PCE readings confirm the inflationary signal from this PMI report, or does it prove to be a one-off spike?
2️⃣ Whether the four-hike pricing holds
Does the market keep pricing in this more hawkish path, or does it walk it back as more data comes in over the following weeks?
3️⃣ Bitcoin's behavior relative to gold and silver
Does BTC keep moving in tandem with traditional safe-haven assets during this repricing, or does it eventually decouple again the way it did during the 30-year story?
💡 The key takeaway
Not every macro-headline hit crypto the same way. A slow-moving 30-year yield story barely dented Bitcoin earlier this week. A sharp, data-driven repricing of near-term Fed hike odds just sent it sliding toward $83,300, alongside gold, silver, and equities.
The real question is whether this is the start of a genuinely tighter-for-longer macro-regime reasserting real correlation between Bitcoin and traditional risk assets, or a short-term reaction to one strong PMI print that fades once the next data point lands.
That is the part worth watching.
This post is for informational and educational purposes only and is not financial advice. Crypto markets are volatile. Always conduct your own research before making financial decisions.
#BinanceSquare #Bitcoin #Macro #Fed #Crypto
🚀 A few days ago we covered the 30-year Treasury yield hitting a 2004 high, and Bitcoin barely blinked. Two whales even opened a $171 million long position right into that macro headwind.
This time is different. The 10-year Treasury yield just climbed to its highest level since 2007, and Bitcoin actually moved with it, sliding down toward $83,300.
🔐 What changed between then and now?
The catalyst this time is more concrete. A stronger-than-expected US September PMI reading came in at 58.4, the fastest pace of expansion since 2021, with the Input Prices Index hitting its highest level since October 2022. That's a signal of persistent inflationary pressure, and markets reacted immediately. CME data showed the probability of a 25-basis-point rate hike in October rising to roughly 69.7%. Treasury yields surged in response, gold and silver sold off sharply too, silver fell more than 3%, gold dropped below $4,300, and US equity indices closed lower across the board, ending the Nasdaq's streak of record closes.
🧠 Why does this move matter more than the 30-year story did?
Because correlation isn't constant, it comes and goes depending on what's actually driving the yield move. The 30-year yield story earlier this week was more of a slow-burning structural story, fiscal concerns, heavy government borrowing, a grinding multi-month repricing. This 10-year move is sharper and more directly tied to a single fresh data point, the PMI report, that changes near-term Fed expectations in a way markets can price immediately. When the catalyst is that immediate and concrete, risk assets tend to react faster and more visibly, and that's exactly what happened here.
📊 The rate expectations have shifted meaningfully too.
Traders are now pricing in four separate Fed rate hikes by June 2027. That's a materially more hawkish path than markets were positioned for even a few weeks ago, and it reflects a genuine repricing of how long tighter monetary policy is expected to stick around, not just a one-day reaction to a single data point.
✅ What this means for you
If you're holding BTC, this is a cleaner real-world test of the "does Bitcoin actually trade like a rate-sensitive risk asset" question than the 30-year story gave us. Watch how BTC behaves over the coming sessions as this repricing settles, does it stabilize and decouple again, or does it continue tracking the broader risk-off move across equities, gold, and silver?
If you're on the sidelines, remember that not every yield headline moves crypto the same way. The specific catalyst matters, a slow structural yield climb and a sharp PMI-driven repricing of Fed hike odds are different kinds of macro-events, even when the underlying number (a rising yield) looks similar on the surface.
If you're building a habit of reading macro correctly, this is a genuinely useful comparison case. Two yield stories, one that BTC shrugged off and one it reacted sharply to, in the same week. The difference tells you something real about what actually moves this market versus what's just a headline.
🟢 Bullish scenario
The PMI-driven repricing proves temporary, upcoming inflation data comes in softer than feared, rate hike odds ease back down, and Bitcoin recovers toward its recent range as the immediate catalyst fades.
🔴 Risk scenario
Inflation data continues running hot, the market fully prices in the four-hike path through 2027, and Bitcoin extends its slide alongside gold, silver, and equities as tighter-for-longer policy becomes the base case rather than a risk scenario.
👀 Three things to watch
1️⃣ Upcoming inflation data
Do the next CPI and PCE readings confirm the inflationary signal from this PMI report, or does it prove to be a one-off spike?
2️⃣ Whether the four-hike pricing holds
Does the market keep pricing in this more hawkish path, or does it walk it back as more data comes in over the following weeks?
3️⃣ Bitcoin's behavior relative to gold and silver
Does BTC keep moving in tandem with traditional safe-haven assets during this repricing, or does it eventually decouple again the way it did during the 30-year story?
💡 The key takeaway
Not every macro-headline hit crypto the same way. A slow-moving 30-year yield story barely dented Bitcoin earlier this week. A sharp, data-driven repricing of near-term Fed hike odds just sent it sliding toward $83,300, alongside gold, silver, and equities.
The real question is whether this is the start of a genuinely tighter-for-longer macro-regime reasserting real correlation between Bitcoin and traditional risk assets, or a short-term reaction to one strong PMI print that fades once the next data point lands.
That is the part worth watching.
This post is for informational and educational purposes only and is not financial advice. Crypto markets are volatile. Always conduct your own research before making financial decisions.
#BinanceSquare #Bitcoin #Macro #Fed #Crypto
1
2
27
Article
BitMEX Is Shutting Down: What the End of a Crypto Pioneer Means for the IndustryNo hack, no insolvency, no regulatory action. The exchange that invented 100x leverage just walked away anyway.
🚀 Eleven years ago, BitMEX didn't just launch an exchange, it invented a product that reshaped how the entire industry trades. The 100x leverage perpetual swap, now the most-traded financial instrument in crypto, started here.
As of 04:00 UTC on September 23, that story is over. BitMEX has fully shut down trading operations. Not paused, not restructured, shut down.
🔐 Here's the part that makes this genuinely unusual.
BitMEX didn't collapse the way exchanges usually collapse. There's no hack behind this; the company points to a flawless 11-year record of zero customer funds lost to security breaches. There's no insolvency. There's no fresh regulatory enforcement action forcing the closure. HDR Global Trading Limited, BitMEX's owner, attributed the decision entirely to a "strategic review of the business and the wider crypto industry." A profitable-sounding, security-clean exchange chose to walk away on its own terms.
🕵️ So why would a pioneer with that track record just... stop?
That's the real question worth sitting with. Multiple industry analysts have pointed to a broader consolidation trend, one commentator noted that the top five exchanges now control an estimated 80% of global spot trading volume. Mid-sized platforms are increasingly squeezed between rising regulatory compliance costs and shrinking market share as liquidity concentrates on fewer, larger venues. BitMEX may not have been in danger, but the math of staying competitive at its size may have simply stopped adding up.
🧠 Why does this matter beyond one company's decision?
Because BitMEX exiting cleanly, without scandal, is arguably a more important signal than if it had collapsed. A dramatic failure gets dismissed as an isolated bad actor. A voluntary wind-down from an exchange with a clean security record is harder to explain away, it suggests the competitive pressure on mid-tier centralized exchanges is real and structural, not just a story about one company's mistakes.
✅ What this means for you
If you had funds on BitMEX, the shutdown process was staged carefully, registrations stopped in July, reduce-only trading began in late August, and full closure hit September 23 with forced liquidation of any remaining open positions. Users can still log in and withdraw balances, but idle KYC-verified accounts now face an ongoing fee, 1% annually or $50 monthly minimum, whichever is greater. If you still have a balance there, the priority is getting it out, not waiting.
If you're not a BitMEX user, this is still worth watching as an industry signal. When a pioneer with an unblemished security record and no regulatory scandal decides the business no longer makes sense to run, it's worth asking whether the exchanges you use do are positioned in that same squeezed middle tier, or genuinely part of the consolidating top handful.
If you're building a habit of evaluating platform risk, this is a useful reminder that "no hack, no scandal" doesn't mean "no risk." Business viability itself is a risk factor, and it's one that's much harder to see coming than a security breach.
🟢 Bullish scenario
BitMEX's exit is simply healthy consolidation, capital and liquidity concentrate further into the strongest, most trusted platforms, and the overall market becomes more efficient and secure as a result.
🔴 Risk scenario
This is the first of several mid-sized exchange exits to come, signaling deeper structural pressure across the industry, and users on other similarly positioned platforms face the same kind of abrupt wind-down with less notice.
👀 Three things to watch
1️⃣ Whether other mid-sized exchanges follow
Does BitMEX's exit turn out to be an isolated strategic choice, or the start of a broader wave of consolidation among exchanges outside the top five?
2️⃣ Where BitMEX's trading volume and users migrate
Which platforms absorb the liquidity and users leaving BitMEX, and does that further concentrate volume among the largest exchanges?
3️⃣ How the exit is remembered
Does the crypto industry treat this as a clean, well-managed wind-down worth learning from, or does more information emerge that complicates the "just a strategic review" explanation?
💡 The key takeaway
This wasn't a hack. It wasn't insolvency. It was a profitable-sounding pioneer with a spotless security record choosing to close because the competitive math of being a mid-sized exchange stopped working.
The real question isn't why BitMEX specifically made this choice, it's whether this becomes the first visible sign of a consolidation wave that reshapes which exchanges survive the next few years.
That is the part worth watching.
This post is for informational and educational purposes only and is not financial advice. Crypto markets are volatile. Always conduct your own research before making financial decisions.
#BinanceSquare #BitMEX #CryptoExchange #Crypto #Industry
BitMEX Is Shutting Down: What the End of a Crypto Pioneer Means for the Industry
No hack, no insolvency, no regulatory action. The exchange that invented 100x leverage just walked away anyway.
🚀 Eleven years ago, BitMEX didn't just launch an exchange, it invented a product that reshaped how the entire industry trades. The 100x leverage perpetual swap, now the most-traded financial instrument in crypto, started here.
As of 04:00 UTC on September 23, that story is over. BitMEX has fully shut down trading operations. Not paused, not restructured, shut down.
🔐 Here's the part that makes this genuinely unusual.
BitMEX didn't collapse the way exchanges usually collapse. There's no hack behind this; the company points to a flawless 11-year record of zero customer funds lost to security breaches. There's no insolvency. There's no fresh regulatory enforcement action forcing the closure. HDR Global Trading Limited, BitMEX's owner, attributed the decision entirely to a "strategic review of the business and the wider crypto industry." A profitable-sounding, security-clean exchange chose to walk away on its own terms.
🕵️ So why would a pioneer with that track record just... stop?
That's the real question worth sitting with. Multiple industry analysts have pointed to a broader consolidation trend, one commentator noted that the top five exchanges now control an estimated 80% of global spot trading volume. Mid-sized platforms are increasingly squeezed between rising regulatory compliance costs and shrinking market share as liquidity concentrates on fewer, larger venues. BitMEX may not have been in danger, but the math of staying competitive at its size may have simply stopped adding up.
🧠 Why does this matter beyond one company's decision?
Because BitMEX exiting cleanly, without scandal, is arguably a more important signal than if it had collapsed. A dramatic failure gets dismissed as an isolated bad actor. A voluntary wind-down from an exchange with a clean security record is harder to explain away, it suggests the competitive pressure on mid-tier centralized exchanges is real and structural, not just a story about one company's mistakes.
✅ What this means for you
If you had funds on BitMEX, the shutdown process was staged carefully, registrations stopped in July, reduce-only trading began in late August, and full closure hit September 23 with forced liquidation of any remaining open positions. Users can still log in and withdraw balances, but idle KYC-verified accounts now face an ongoing fee, 1% annually or $50 monthly minimum, whichever is greater. If you still have a balance there, the priority is getting it out, not waiting.
If you're not a BitMEX user, this is still worth watching as an industry signal. When a pioneer with an unblemished security record and no regulatory scandal decides the business no longer makes sense to run, it's worth asking whether the exchanges you use do are positioned in that same squeezed middle tier, or genuinely part of the consolidating top handful.
If you're building a habit of evaluating platform risk, this is a useful reminder that "no hack, no scandal" doesn't mean "no risk." Business viability itself is a risk factor, and it's one that's much harder to see coming than a security breach.
🟢 Bullish scenario
BitMEX's exit is simply healthy consolidation, capital and liquidity concentrate further into the strongest, most trusted platforms, and the overall market becomes more efficient and secure as a result.
🔴 Risk scenario
This is the first of several mid-sized exchange exits to come, signaling deeper structural pressure across the industry, and users on other similarly positioned platforms face the same kind of abrupt wind-down with less notice.
👀 Three things to watch
1️⃣ Whether other mid-sized exchanges follow
Does BitMEX's exit turn out to be an isolated strategic choice, or the start of a broader wave of consolidation among exchanges outside the top five?
2️⃣ Where BitMEX's trading volume and users migrate
Which platforms absorb the liquidity and users leaving BitMEX, and does that further concentrate volume among the largest exchanges?
3️⃣ How the exit is remembered
Does the crypto industry treat this as a clean, well-managed wind-down worth learning from, or does more information emerge that complicates the "just a strategic review" explanation?
💡 The key takeaway
This wasn't a hack. It wasn't insolvency. It was a profitable-sounding pioneer with a spotless security record choosing to close because the competitive math of being a mid-sized exchange stopped working.
The real question isn't why BitMEX specifically made this choice, it's whether this becomes the first visible sign of a consolidation wave that reshapes which exchanges survive the next few years.
That is the part worth watching.
This post is for informational and educational purposes only and is not financial advice. Crypto markets are volatile. Always conduct your own research before making financial decisions.
#BinanceSquare #BitMEX #CryptoExchange #Crypto #Industry
🚀 Eleven years ago, BitMEX didn't just launch an exchange, it invented a product that reshaped how the entire industry trades. The 100x leverage perpetual swap, now the most-traded financial instrument in crypto, started here.
As of 04:00 UTC on September 23, that story is over. BitMEX has fully shut down trading operations. Not paused, not restructured, shut down.
🔐 Here's the part that makes this genuinely unusual.
BitMEX didn't collapse the way exchanges usually collapse. There's no hack behind this; the company points to a flawless 11-year record of zero customer funds lost to security breaches. There's no insolvency. There's no fresh regulatory enforcement action forcing the closure. HDR Global Trading Limited, BitMEX's owner, attributed the decision entirely to a "strategic review of the business and the wider crypto industry." A profitable-sounding, security-clean exchange chose to walk away on its own terms.
🕵️ So why would a pioneer with that track record just... stop?
That's the real question worth sitting with. Multiple industry analysts have pointed to a broader consolidation trend, one commentator noted that the top five exchanges now control an estimated 80% of global spot trading volume. Mid-sized platforms are increasingly squeezed between rising regulatory compliance costs and shrinking market share as liquidity concentrates on fewer, larger venues. BitMEX may not have been in danger, but the math of staying competitive at its size may have simply stopped adding up.
🧠 Why does this matter beyond one company's decision?
Because BitMEX exiting cleanly, without scandal, is arguably a more important signal than if it had collapsed. A dramatic failure gets dismissed as an isolated bad actor. A voluntary wind-down from an exchange with a clean security record is harder to explain away, it suggests the competitive pressure on mid-tier centralized exchanges is real and structural, not just a story about one company's mistakes.
✅ What this means for you
If you had funds on BitMEX, the shutdown process was staged carefully, registrations stopped in July, reduce-only trading began in late August, and full closure hit September 23 with forced liquidation of any remaining open positions. Users can still log in and withdraw balances, but idle KYC-verified accounts now face an ongoing fee, 1% annually or $50 monthly minimum, whichever is greater. If you still have a balance there, the priority is getting it out, not waiting.
If you're not a BitMEX user, this is still worth watching as an industry signal. When a pioneer with an unblemished security record and no regulatory scandal decides the business no longer makes sense to run, it's worth asking whether the exchanges you use do are positioned in that same squeezed middle tier, or genuinely part of the consolidating top handful.
If you're building a habit of evaluating platform risk, this is a useful reminder that "no hack, no scandal" doesn't mean "no risk." Business viability itself is a risk factor, and it's one that's much harder to see coming than a security breach.
🟢 Bullish scenario
BitMEX's exit is simply healthy consolidation, capital and liquidity concentrate further into the strongest, most trusted platforms, and the overall market becomes more efficient and secure as a result.
🔴 Risk scenario
This is the first of several mid-sized exchange exits to come, signaling deeper structural pressure across the industry, and users on other similarly positioned platforms face the same kind of abrupt wind-down with less notice.
👀 Three things to watch
1️⃣ Whether other mid-sized exchanges follow
Does BitMEX's exit turn out to be an isolated strategic choice, or the start of a broader wave of consolidation among exchanges outside the top five?
2️⃣ Where BitMEX's trading volume and users migrate
Which platforms absorb the liquidity and users leaving BitMEX, and does that further concentrate volume among the largest exchanges?
3️⃣ How the exit is remembered
Does the crypto industry treat this as a clean, well-managed wind-down worth learning from, or does more information emerge that complicates the "just a strategic review" explanation?
💡 The key takeaway
This wasn't a hack. It wasn't insolvency. It was a profitable-sounding pioneer with a spotless security record choosing to close because the competitive math of being a mid-sized exchange stopped working.
The real question isn't why BitMEX specifically made this choice, it's whether this becomes the first visible sign of a consolidation wave that reshapes which exchanges survive the next few years.
That is the part worth watching.
This post is for informational and educational purposes only and is not financial advice. Crypto markets are volatile. Always conduct your own research before making financial decisions.
#BinanceSquare #BitMEX #CryptoExchange #Crypto #Industry
1
1
3
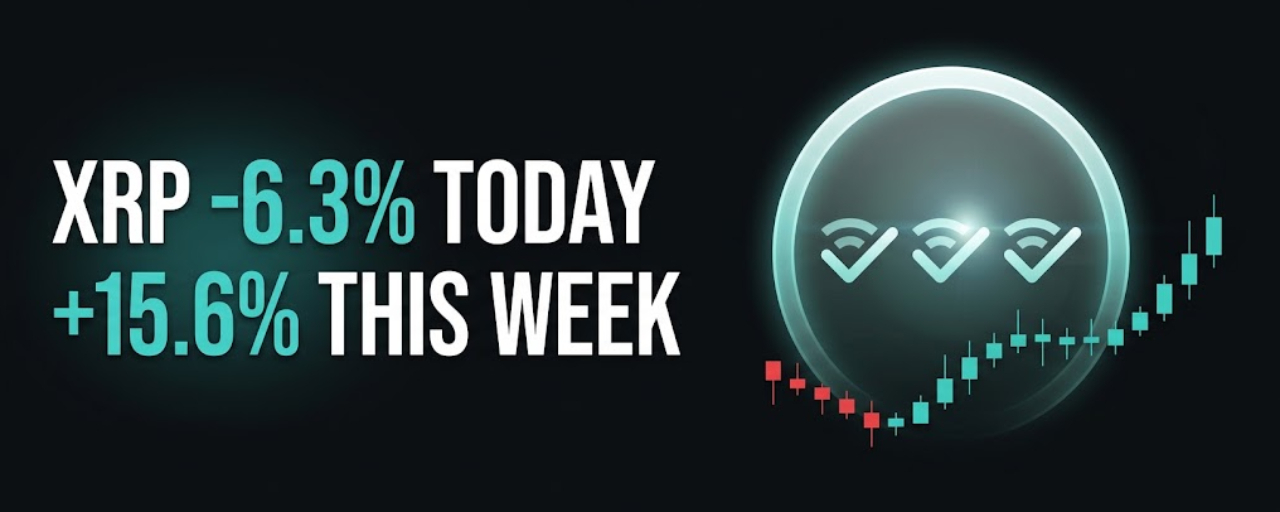
Article
XRP Falls 6.3% in a Day, Still Up 15.6% on the Week, 3 Bullish Signals Say WhyHolder, derivatives, and ETF data all point the same direction. Here's what the daily red candle is hiding.
🚀 Open a 24-hour chart of XRP right now and you'd think something went wrong.
XRP fell about 6.3% over the past day, trading near $1.50. On its own, that's the kind of red candle that gets people nervous. But zoom out to the weekly view and the story flips entirely, XRP is still up more than 15.6% over the past seven days. The daily drop isn't the trend; it's a pullback inside a stronger move.
🕵️ Here's why that distinction actually matters.
A single bad day inside a strong week is one of the most common (and most misread) patterns in crypto. Traders who only check the 24-hour number see red and assume the run is over. Traders who check the week see a token still holding most of its recent gains, and start asking a different question, is this a healthy cooldown, or the start of something worse?
🔐 So what's actually supporting XRP beneath the daily noise?
The bullish case here isn't built on one data point, it's built on three separate categories lining up: holder behavior, derivatives positioning, and ETF flows. Large XRP holders have historically tended to accumulate during pullbacks like this rather than sell into them, a pattern that shows up repeatedly in on-chain data when the weekly trend stays positive. Derivatives markets, futures and options activity, tend to reflect real conviction rather than just spot speculation, since traders there are putting capital behind a directional view, not just reacting to headlines. And ETF flow data has become one of the clearest institutional signals available for XRP specifically, sustained inflows tend to mean real capital is entering, not just short-term momentum chasing.
🧠 Why does this three-part framework matter more than the price alone?
Because price alone doesn't tell you who's driving the move. A 6.3% daily drop on thin, retail-driven selling looks very different from the same drop with holders accumulating, derivatives staying constructive, and ETF inflows continuing underneath it. The former is often just noise. The latter tends to mean the pullback is being absorbed by stronger hands, not signaling a trend reversal.
📅 There's also a seasonal wrinkle worth knowing.
CryptoRank data shows XRP has actually closed October lower in eight of the past 13 years. That's not a reason to panic, seasonality is a soft pattern, not a rule, but it's a useful piece of context heading into next month. If XRP holds its current strength through a historically weaker month, that itself would be a meaningful signal.
✅ What this means for you
If you're holding XRP, don't let a single red day override what the weekly and structural data are showing. Check whether the three signals, holder accumulation, derivatives positioning, and ETF flows, are still pointing the same direction before reacting to one day's price action.
If you're on the sidelines, remember that a 6.3% daily pullback inside a 15.6% weekly gain isn't automatically a buying opportunity or a warning sign on its own. Watch whether the underlying signals hold up over the next several sessions, that tells you more than the daily candle does.
If you're building a habit of reading crypto data well, this is a clean example of why timeframe matters as much as direction. The same price move can look completely different depending on whether you're looking at 24 hours or 7 days, and the more durable signals usually live in the slower-moving data.
🟢 Bullish scenario
Holder accumulation continues, derivatives positioning stays constructive, and ETF inflows keep coming in, confirming this was a healthy pullback inside a longer uptrend, one that holds up even through XRP's historically weaker October.
🔴 Risk scenario
The daily weakness extends, holders start distributing instead of accumulating, and ETF flows slow or reverse, turning what looked like a pullback into the start of a real reversal, right as XRP enters a seasonally difficult month.
👀 Three things to watch
1️⃣ Holder behavior over the next week
Do large wallets keep accumulating through this dip, or does distribution start showing up in the data?
2️⃣ ETF flow direction
Do inflows continue at a healthy pace, or does the pace slow as October approaches?
3️⃣ Whether XRP breaks its October pattern
Does XRP hold its weekly strength into next month, or does it follow the historical trend of closing October lower?
💡 The key takeaway
A 6.3% daily drop looks alarming in isolation. A 15.6% weekly gain, backed by holder accumulation, constructive derivatives data, and continued ETF inflows, tells a very different story.
The real question isn't whether XRP had a red day, it clearly did. It's whether the three underlying signals keep holding up through a month that's historically been unkind to the token.
That is the part worth watching.
This post is for informational and educational purposes only and is not financial advice. Crypto markets are volatile. Always conduct your own research before making financial decisions.
#BinanceSquare #XRP #Crypto #Altcoins #ETF
{spot}(XRPUSDT)
XRP Falls 6.3% in a Day, Still Up 15.6% on the Week, 3 Bullish Signals Say Why
Holder, derivatives, and ETF data all point the same direction. Here's what the daily red candle is hiding.
🚀 Open a 24-hour chart of XRP right now and you'd think something went wrong.
XRP fell about 6.3% over the past day, trading near $1.50. On its own, that's the kind of red candle that gets people nervous. But zoom out to the weekly view and the story flips entirely, XRP is still up more than 15.6% over the past seven days. The daily drop isn't the trend; it's a pullback inside a stronger move.
🕵️ Here's why that distinction actually matters.
A single bad day inside a strong week is one of the most common (and most misread) patterns in crypto. Traders who only check the 24-hour number see red and assume the run is over. Traders who check the week see a token still holding most of its recent gains, and start asking a different question, is this a healthy cooldown, or the start of something worse?
🔐 So what's actually supporting XRP beneath the daily noise?
The bullish case here isn't built on one data point, it's built on three separate categories lining up: holder behavior, derivatives positioning, and ETF flows. Large XRP holders have historically tended to accumulate during pullbacks like this rather than sell into them, a pattern that shows up repeatedly in on-chain data when the weekly trend stays positive. Derivatives markets, futures and options activity, tend to reflect real conviction rather than just spot speculation, since traders there are putting capital behind a directional view, not just reacting to headlines. And ETF flow data has become one of the clearest institutional signals available for XRP specifically, sustained inflows tend to mean real capital is entering, not just short-term momentum chasing.
🧠 Why does this three-part framework matter more than the price alone?
Because price alone doesn't tell you who's driving the move. A 6.3% daily drop on thin, retail-driven selling looks very different from the same drop with holders accumulating, derivatives staying constructive, and ETF inflows continuing underneath it. The former is often just noise. The latter tends to mean the pullback is being absorbed by stronger hands, not signaling a trend reversal.
📅 There's also a seasonal wrinkle worth knowing.
CryptoRank data shows XRP has actually closed October lower in eight of the past 13 years. That's not a reason to panic, seasonality is a soft pattern, not a rule, but it's a useful piece of context heading into next month. If XRP holds its current strength through a historically weaker month, that itself would be a meaningful signal.
✅ What this means for you
If you're holding XRP, don't let a single red day override what the weekly and structural data are showing. Check whether the three signals, holder accumulation, derivatives positioning, and ETF flows, are still pointing the same direction before reacting to one day's price action.
If you're on the sidelines, remember that a 6.3% daily pullback inside a 15.6% weekly gain isn't automatically a buying opportunity or a warning sign on its own. Watch whether the underlying signals hold up over the next several sessions, that tells you more than the daily candle does.
If you're building a habit of reading crypto data well, this is a clean example of why timeframe matters as much as direction. The same price move can look completely different depending on whether you're looking at 24 hours or 7 days, and the more durable signals usually live in the slower-moving data.
🟢 Bullish scenario
Holder accumulation continues, derivatives positioning stays constructive, and ETF inflows keep coming in, confirming this was a healthy pullback inside a longer uptrend, one that holds up even through XRP's historically weaker October.
🔴 Risk scenario
The daily weakness extends, holders start distributing instead of accumulating, and ETF flows slow or reverse, turning what looked like a pullback into the start of a real reversal, right as XRP enters a seasonally difficult month.
👀 Three things to watch
1️⃣ Holder behavior over the next week
Do large wallets keep accumulating through this dip, or does distribution start showing up in the data?
2️⃣ ETF flow direction
Do inflows continue at a healthy pace, or does the pace slow as October approaches?
3️⃣ Whether XRP breaks its October pattern
Does XRP hold its weekly strength into next month, or does it follow the historical trend of closing October lower?
💡 The key takeaway
A 6.3% daily drop looks alarming in isolation. A 15.6% weekly gain, backed by holder accumulation, constructive derivatives data, and continued ETF inflows, tells a very different story.
The real question isn't whether XRP had a red day, it clearly did. It's whether the three underlying signals keep holding up through a month that's historically been unkind to the token.
That is the part worth watching.
This post is for informational and educational purposes only and is not financial advice. Crypto markets are volatile. Always conduct your own research before making financial decisions.
#BinanceSquare #XRP #Crypto #Altcoins #ETF
🚀 Open a 24-hour chart of XRP right now and you'd think something went wrong.
XRP fell about 6.3% over the past day, trading near $1.50. On its own, that's the kind of red candle that gets people nervous. But zoom out to the weekly view and the story flips entirely, XRP is still up more than 15.6% over the past seven days. The daily drop isn't the trend; it's a pullback inside a stronger move.
🕵️ Here's why that distinction actually matters.
A single bad day inside a strong week is one of the most common (and most misread) patterns in crypto. Traders who only check the 24-hour number see red and assume the run is over. Traders who check the week see a token still holding most of its recent gains, and start asking a different question, is this a healthy cooldown, or the start of something worse?
🔐 So what's actually supporting XRP beneath the daily noise?
The bullish case here isn't built on one data point, it's built on three separate categories lining up: holder behavior, derivatives positioning, and ETF flows. Large XRP holders have historically tended to accumulate during pullbacks like this rather than sell into them, a pattern that shows up repeatedly in on-chain data when the weekly trend stays positive. Derivatives markets, futures and options activity, tend to reflect real conviction rather than just spot speculation, since traders there are putting capital behind a directional view, not just reacting to headlines. And ETF flow data has become one of the clearest institutional signals available for XRP specifically, sustained inflows tend to mean real capital is entering, not just short-term momentum chasing.
🧠 Why does this three-part framework matter more than the price alone?
Because price alone doesn't tell you who's driving the move. A 6.3% daily drop on thin, retail-driven selling looks very different from the same drop with holders accumulating, derivatives staying constructive, and ETF inflows continuing underneath it. The former is often just noise. The latter tends to mean the pullback is being absorbed by stronger hands, not signaling a trend reversal.
📅 There's also a seasonal wrinkle worth knowing.
CryptoRank data shows XRP has actually closed October lower in eight of the past 13 years. That's not a reason to panic, seasonality is a soft pattern, not a rule, but it's a useful piece of context heading into next month. If XRP holds its current strength through a historically weaker month, that itself would be a meaningful signal.
✅ What this means for you
If you're holding XRP, don't let a single red day override what the weekly and structural data are showing. Check whether the three signals, holder accumulation, derivatives positioning, and ETF flows, are still pointing the same direction before reacting to one day's price action.
If you're on the sidelines, remember that a 6.3% daily pullback inside a 15.6% weekly gain isn't automatically a buying opportunity or a warning sign on its own. Watch whether the underlying signals hold up over the next several sessions, that tells you more than the daily candle does.
If you're building a habit of reading crypto data well, this is a clean example of why timeframe matters as much as direction. The same price move can look completely different depending on whether you're looking at 24 hours or 7 days, and the more durable signals usually live in the slower-moving data.
🟢 Bullish scenario
Holder accumulation continues, derivatives positioning stays constructive, and ETF inflows keep coming in, confirming this was a healthy pullback inside a longer uptrend, one that holds up even through XRP's historically weaker October.
🔴 Risk scenario
The daily weakness extends, holders start distributing instead of accumulating, and ETF flows slow or reverse, turning what looked like a pullback into the start of a real reversal, right as XRP enters a seasonally difficult month.
👀 Three things to watch
1️⃣ Holder behavior over the next week
Do large wallets keep accumulating through this dip, or does distribution start showing up in the data?
2️⃣ ETF flow direction
Do inflows continue at a healthy pace, or does the pace slow as October approaches?
3️⃣ Whether XRP breaks its October pattern
Does XRP hold its weekly strength into next month, or does it follow the historical trend of closing October lower?
💡 The key takeaway
A 6.3% daily drop looks alarming in isolation. A 15.6% weekly gain, backed by holder accumulation, constructive derivatives data, and continued ETF inflows, tells a very different story.
The real question isn't whether XRP had a red day, it clearly did. It's whether the three underlying signals keep holding up through a month that's historically been unkind to the token.
That is the part worth watching.
This post is for informational and educational purposes only and is not financial advice. Crypto markets are volatile. Always conduct your own research before making financial decisions.
#BinanceSquare #XRP #Crypto #Altcoins #ETF
1
1
58
Connectez-vous pour découvrir plus de contenu
Rejoignez la communauté mondiale des adeptes de cryptomonnaies sur Binance Square
⚡️ Suviez les dernières informations importantes sur les cryptomonnaies.
💬 Jugé digne de confiance par la plus grande plateforme d’échange de cryptomonnaies au monde.
👍 Découvrez les connaissances que partagent les créateurs vérifiés.
Adresse e-mail/Nº de téléphone
Sujets d’actualité
UKFCAWinsCourtOrderToRecover851400Pounds
37,747 vues
823 mentions
🚨 CRYPTO REGULATION JUST ENTERED A NEW PHASE: THEY’RE NOT ONLY WRITING RULES — THEY’RE TAKING MONEY BACK.
The UK’s FCA has secured another court-backed asset recovery, reinforcing a broader enforcement push against unauthorized financial and crypto-related activity.
And look at what’s happening simultaneously:
🇬🇧 FCA → enforcement + asset recovery
🇺🇸 SEC → clearer rules for functional crypto assets
🇺🇸 Fed → formal stablecoin supervision under the GENIUS Act
That combination matters.
Regulators are no longer debating whether crypto belongs inside the financial system.
They’re increasingly deciding who gets access, what rules they follow, and what happens when those rules are broken.
The next crypto cycle may not be “regulation vs innovation.”
It may be regulated crypto vs everyone who can’t meet the standard. 👀
$COIN $CRCL $BTC
#ukfcawinscourtordertorecover851400pounds #ChainlinkLaunchesCCIP2WithEnterpriseVerification #GoldFallsTo$4144 #QNTFallsOver40%FromMorningHigh #USDTAdds845900HoldersInPast7Days
KimHotbae
·3 mentions J’aime
·4.4k vues
ChainlinkLaunchesCCIP2WithEnterpriseVerification
50,041 vues
990 mentions
GoldFallsTo$4144
17,071 vues
165 mentions