
Lina Indicators
448 Posts
Lina Indicators
Report
Block User
Data-driven crypto research | Market structure • Momentum • Risk education | Personal views, not financial advice | X: @Lina_Indicator
221 Following
496 Followers
2.4K+ Liked
Posts
All
Quotes
Videos
PINNED
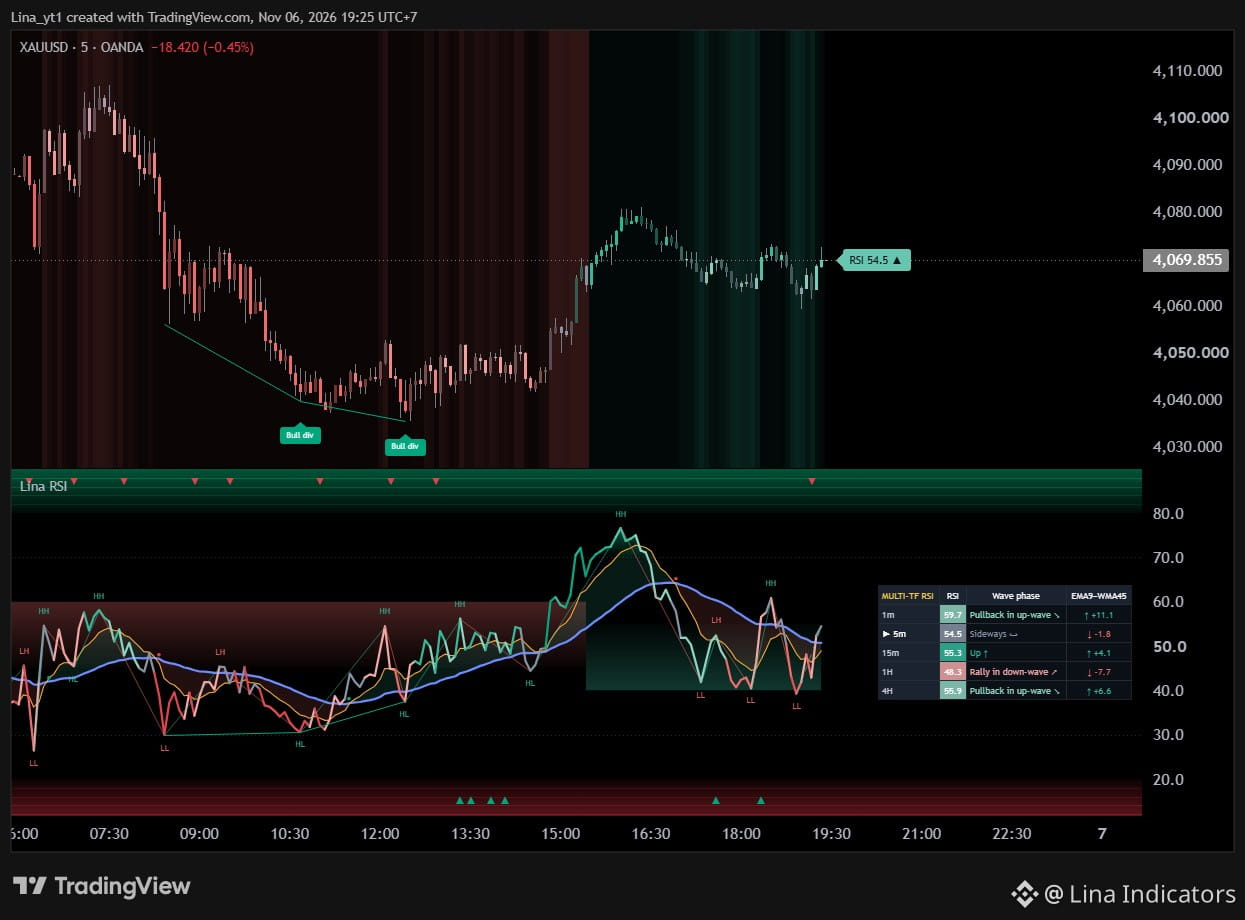
**Free indicator: Lina RSI is now on TradingView**
Most traders use RSI only for overbought / oversold. Lina RSI reads it as waves, so trend, pullbacks and exhaustion are visible at a glance.
What you get:
• 7-phase RSI line, from strong up to strong down
• Trend pullback band where with-trend entries usually form
• Smooth extreme-zone fill
• RSI zigzag with HH / HL / LH / LL labels
• Regular divergence on RSI and price
• Pullback completed / failed marks
• Candle colors and trend background on the price chart
• Auto 5-timeframe RSI table
• 6 alerts
How to use it: green candles = look for longs, red = look for shorts. Wait for RSI to pull back into the band and complete before joining the trend. Don't chase in the extreme zone.
100% free. No sign-up, no conditions.
→ tradingview.com/script/qFbYduhk-Lina-RSI-Wave-Phase-RSI-with-Trend-Pullback-Zones/
$BTC $ETH #Gold #TradingView #RSI #TechnicalAnalysis
Not financial advice. Always manage your risk.
**Free indicator: Lina RSI is now on TradingView**
Most traders use RSI only for overbought / oversold. Lina RSI reads it as waves, so trend, pullbacks and exhaustion are visible at a glance.
What you get:
• 7-phase RSI line, from strong up to strong down
• Trend pullback band where with-trend entries usually form
• Smooth extreme-zone fill
• RSI zigzag with HH / HL / LH / LL labels
• Regular divergence on RSI and price
• Pullback completed / failed marks
• Candle colors and trend background on the price chart
• Auto 5-timeframe RSI table
• 6 alerts
How to use it: green candles = look for longs, red = look for shorts. Wait for RSI to pull back into the band and complete before joining the trend. Don't chase in the extreme zone.
100% free. No sign-up, no conditions.
→ tradingview.com/script/qFbYduhk-Lina-RSI-Wave-Phase-RSI-with-Trend-Pullback-Zones/
$BTC $ETH #Gold #TradingView #RSI #TechnicalAnalysis
Not financial advice. Always manage your risk.
Most traders use RSI only for overbought / oversold. Lina RSI reads it as waves, so trend, pullbacks and exhaustion are visible at a glance.
What you get:
• 7-phase RSI line, from strong up to strong down
• Trend pullback band where with-trend entries usually form
• Smooth extreme-zone fill
• RSI zigzag with HH / HL / LH / LL labels
• Regular divergence on RSI and price
• Pullback completed / failed marks
• Candle colors and trend background on the price chart
• Auto 5-timeframe RSI table
• 6 alerts
How to use it: green candles = look for longs, red = look for shorts. Wait for RSI to pull back into the band and complete before joining the trend. Don't chase in the extreme zone.
100% free. No sign-up, no conditions.
→ tradingview.com/script/qFbYduhk-Lina-RSI-Wave-Phase-RSI-with-Trend-Pullback-Zones/
$BTC $ETH #Gold #TradingView #RSI #TechnicalAnalysis
Not financial advice. Always manage your risk.
3
1
3
383
PINNED
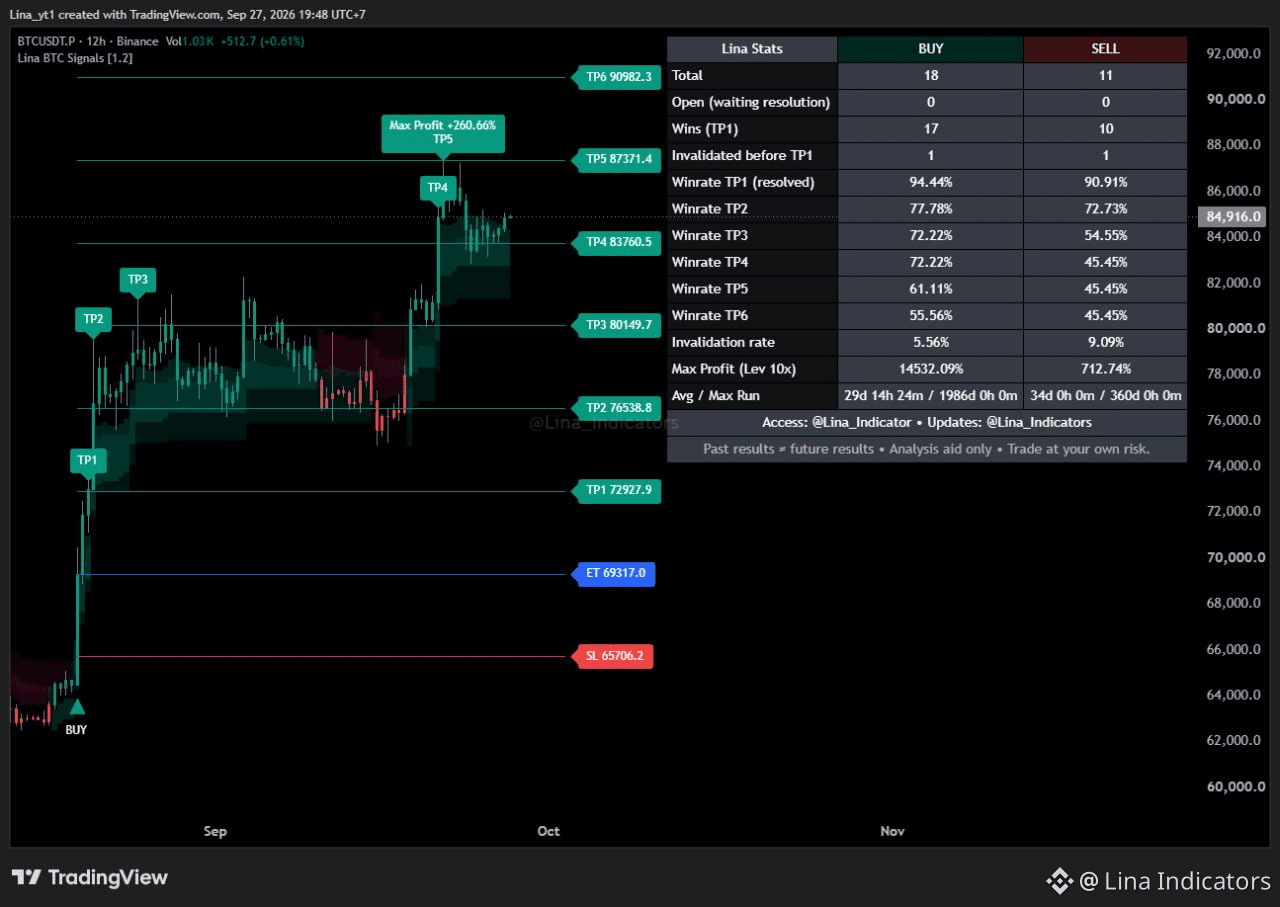
🔥 LINA BTC SIGNALS
A private TradingView indicator built specifically for $BTC.
• BUY / SELL
• Entry & Stop Loss
• TP1 → TP6
• Multi-timeframe structure
• Historical performance tracking
Each timeframe can have its own setup, allowing BTC market structure to be followed from multiple perspectives.
Private access:
1 Year • 3 Years • Lifetime
Lina BTC Signals
Built for BTC.
For analysis and educational purposes only. Past results do not guarantee future results.
$BTC #bitcoin #tradingview
🔥 LINA BTC SIGNALS
A private TradingView indicator built specifically for $BTC .
• BUY / SELL
• Entry & Stop Loss
• TP1 → TP6
• Multi-timeframe structure
• Historical performance tracking
Each timeframe can have its own setup, allowing BTC market structure to be followed from multiple perspectives.
Private access:
1 Year • 3 Years • Lifetime
Lina BTC Signals
Built for BTC.
For analysis and educational purposes only. Past results do not guarantee future results.
$BTC #bitcoin #tradingview
A private TradingView indicator built specifically for $BTC .
• BUY / SELL
• Entry & Stop Loss
• TP1 → TP6
• Multi-timeframe structure
• Historical performance tracking
Each timeframe can have its own setup, allowing BTC market structure to be followed from multiple perspectives.
Private access:
1 Year • 3 Years • Lifetime
Lina BTC Signals
Built for BTC.
For analysis and educational purposes only. Past results do not guarantee future results.
$BTC #bitcoin #tradingview
2
116
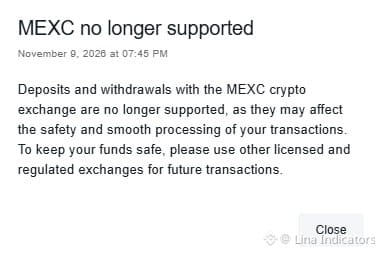
Some platforms have started restricting deposits and withdrawals involving MEXC.
Important distinction: this does not mean MEXC itself has suspended operations. MEXC currently states that its platform remains operational.
However, following recent U.S. regulatory action, additional transfer restrictions from third-party platforms may appear.
Users should verify supported deposit and withdrawal routes before transferring funds.
Some platforms have started restricting deposits and withdrawals involving MEXC.
Important distinction: this does not mean MEXC itself has suspended operations. MEXC currently states that its platform remains operational.
However, following recent U.S. regulatory action, additional transfer restrictions from third-party platforms may appear.
Users should verify supported deposit and withdrawal routes before transferring funds.
Important distinction: this does not mean MEXC itself has suspended operations. MEXC currently states that its platform remains operational.
However, following recent U.S. regulatory action, additional transfer restrictions from third-party platforms may appear.
Users should verify supported deposit and withdrawal routes before transferring funds.
1
1
758
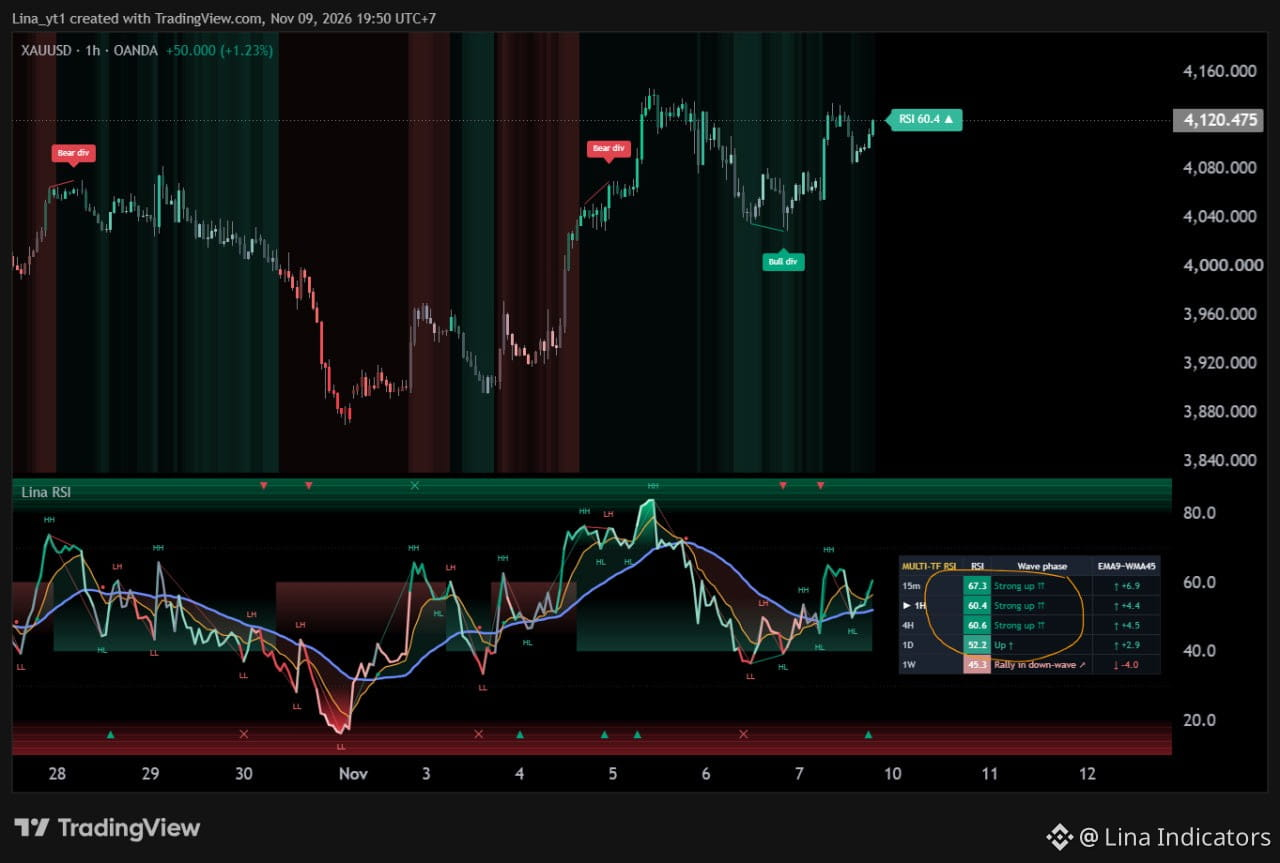
XAUUSD | Multi-Timeframe RSI Update
Gold is trading near 4,118.
RSI structure:
• 15M: 65.5 — Strong up
• 1H: 59.7 — Up
• 4H: 60.3 — Strong up
• 1D: 52.0 — Up
• 1W: 45.2 — Rally in down-wave
Short- and medium-term momentum is improving after the recent bullish divergence, while the weekly structure remains less convincing.
The key is whether H1 and H4 RSI can maintain strength above the neutral zone.
For market analysis and educational purposes only.
XAUUSD | Multi-Timeframe RSI Update
Gold is trading near 4,118.
RSI structure:
• 15M: 65.5 — Strong up
• 1H: 59.7 — Up
• 4H: 60.3 — Strong up
• 1D: 52.0 — Up
• 1W: 45.2 — Rally in down-wave
Short- and medium-term momentum is improving after the recent bullish divergence, while the weekly structure remains less convincing.
The key is whether H1 and H4 RSI can maintain strength above the neutral zone.
For market analysis and educational purposes only.
Gold is trading near 4,118.
RSI structure:
• 15M: 65.5 — Strong up
• 1H: 59.7 — Up
• 4H: 60.3 — Strong up
• 1D: 52.0 — Up
• 1W: 45.2 — Rally in down-wave
Short- and medium-term momentum is improving after the recent bullish divergence, while the weekly structure remains less convincing.
The key is whether H1 and H4 RSI can maintain strength above the neutral zone.
For market analysis and educational purposes only.
1
1
250
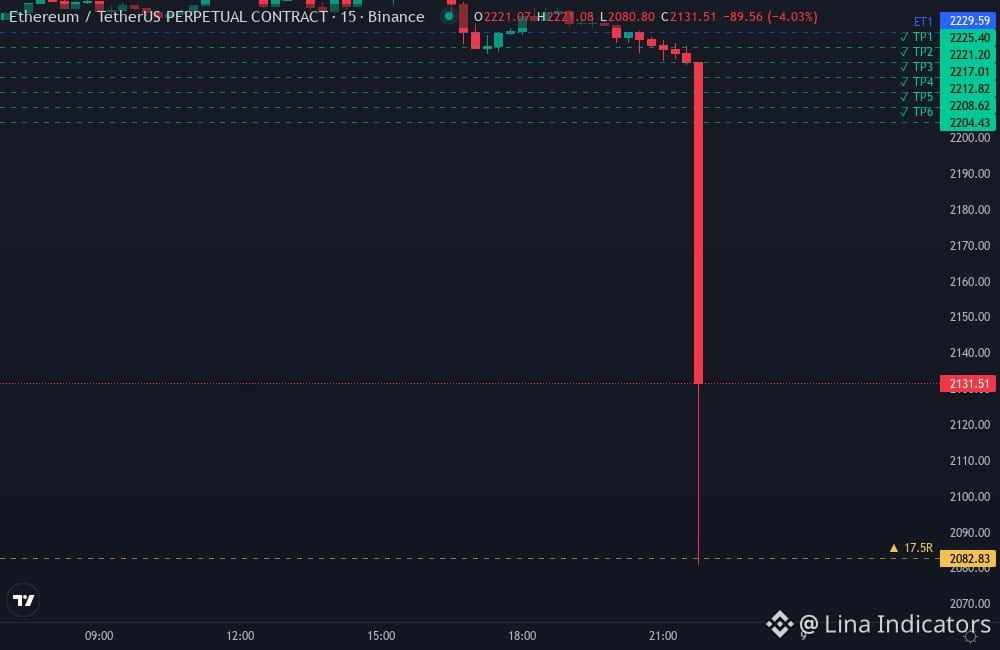
🚀 STILL RUNNING · +$147 · +17.5R
#ETH0014 · ETHUSDT.P · SELL · 15M
Entry 2229.59 → 2082.83
Duration: 4h 56m
Time 04:56 · 09/11/2026
🚀 STILL RUNNING · +$147 · +17.5R
#ETH0014 · ETHUSDT.P · SELL · 15M
Entry 2229.59 → 2082.83
Duration: 4h 56m
Time 04:56 · 09/11/2026
#ETH0014 · ETHUSDT.P · SELL · 15M
Entry 2229.59 → 2082.83
Duration: 4h 56m
Time 04:56 · 09/11/2026
3
282
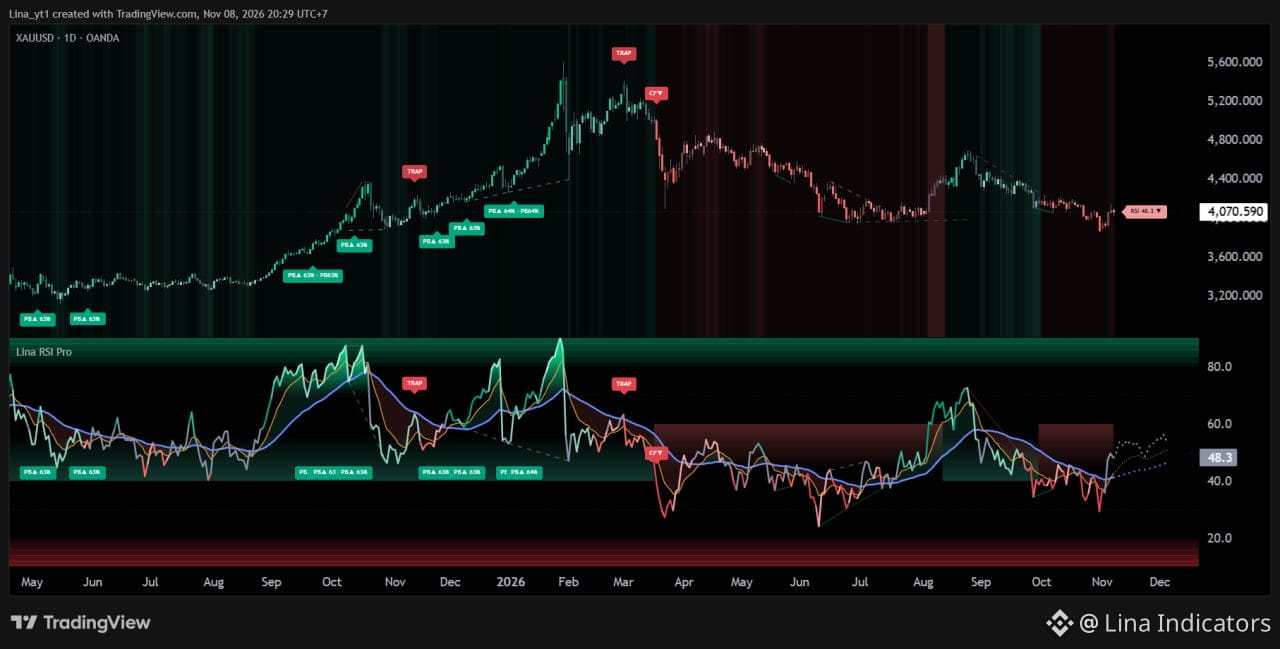
Lina RSI Pro — Wave Traps & Multi-Timeframe Signals 🚀
A new RSI tool focused on:
• RSI Wave structure
• Trap detection
• Multi-Timeframe analysis
• Pullback behavior
The goal is to read momentum structure more clearly instead of relying only on traditional overbought/oversold levels.
Which market should I show first: BTC or XAU?
For market analysis and educational purposes only.
Lina RSI Pro — Wave Traps & Multi-Timeframe Signals 🚀
A new RSI tool focused on:
• RSI Wave structure
• Trap detection
• Multi-Timeframe analysis
• Pullback behavior
The goal is to read momentum structure more clearly instead of relying only on traditional overbought/oversold levels.
Which market should I show first: BTC or XAU?
For market analysis and educational purposes only.
A new RSI tool focused on:
• RSI Wave structure
• Trap detection
• Multi-Timeframe analysis
• Pullback behavior
The goal is to read momentum structure more clearly instead of relying only on traditional overbought/oversold levels.
Which market should I show first: BTC or XAU?
For market analysis and educational purposes only.
1
1
290
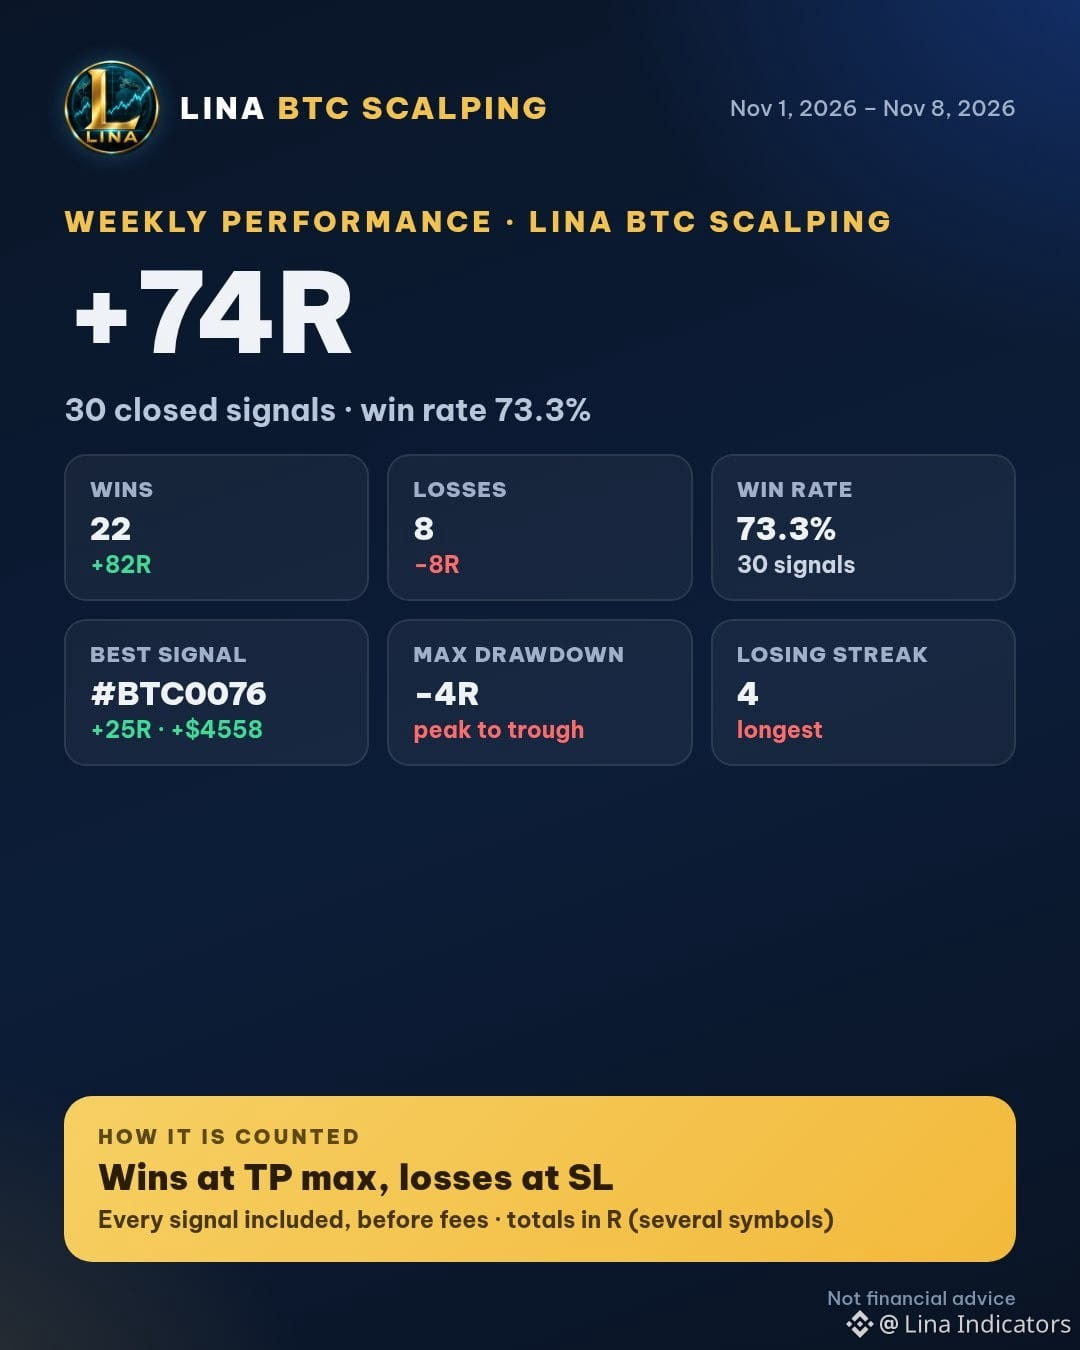
📊 Weekly performance · Lina BTC Scalping
✅ Wins: 22 · +82R
❌ Losses: 8 · −8R
🟠 BTC: 18 signals · +$15394 · +54R
🔷 ETH: 12 signals · +$380 · +20R
💰 Net: +74R after stop losses
🎯 Win rate: 73.3%
📉 Max drawdown: −4R · Longest losing streak: 4
🏆 Best: #BTC0076 SELL · +25R · +$4558 · TP max
👇 Every signal, in order, in the reply below.
Wins counted at TP max (highest point reached), before fees.
#BTC #TradingResults #Transparency
📊 Weekly performance · Lina BTC Scalping
✅ Wins: 22 · +82R
❌ Losses: 8 · −8R
🟠 BTC: 18 signals · +$15394 · +54R
🔷 ETH: 12 signals · +$380 · +20R
💰 Net: +74R after stop losses
🎯 Win rate: 73.3%
📉 Max drawdown: −4R · Longest losing streak: 4
🏆 Best: #BTC0076 SELL · +25R · +$4558 · TP max
👇 Every signal, in order, in the reply below.
Wins counted at TP max (highest point reached), before fees.
#BTC #TradingResults #Transparency
✅ Wins: 22 · +82R
❌ Losses: 8 · −8R
🟠 BTC: 18 signals · +$15394 · +54R
🔷 ETH: 12 signals · +$380 · +20R
💰 Net: +74R after stop losses
🎯 Win rate: 73.3%
📉 Max drawdown: −4R · Longest losing streak: 4
🏆 Best: #BTC0076 SELL · +25R · +$4558 · TP max
👇 Every signal, in order, in the reply below.
Wins counted at TP max (highest point reached), before fees.
#BTC #TradingResults #Transparency
1
199
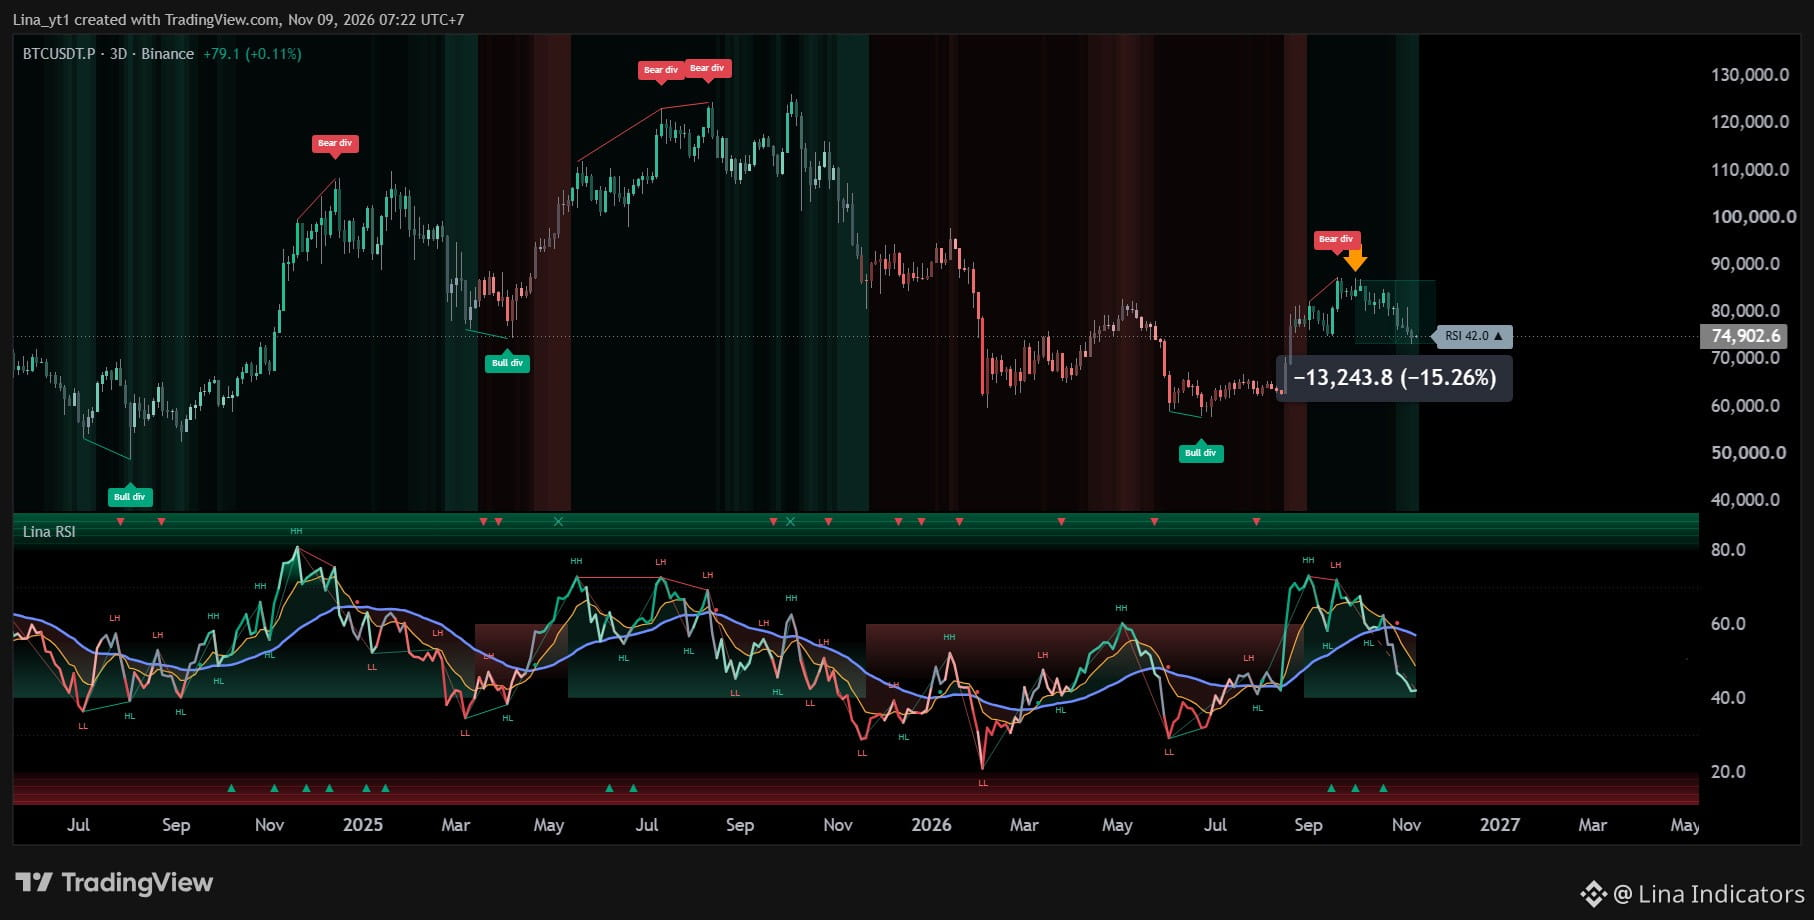
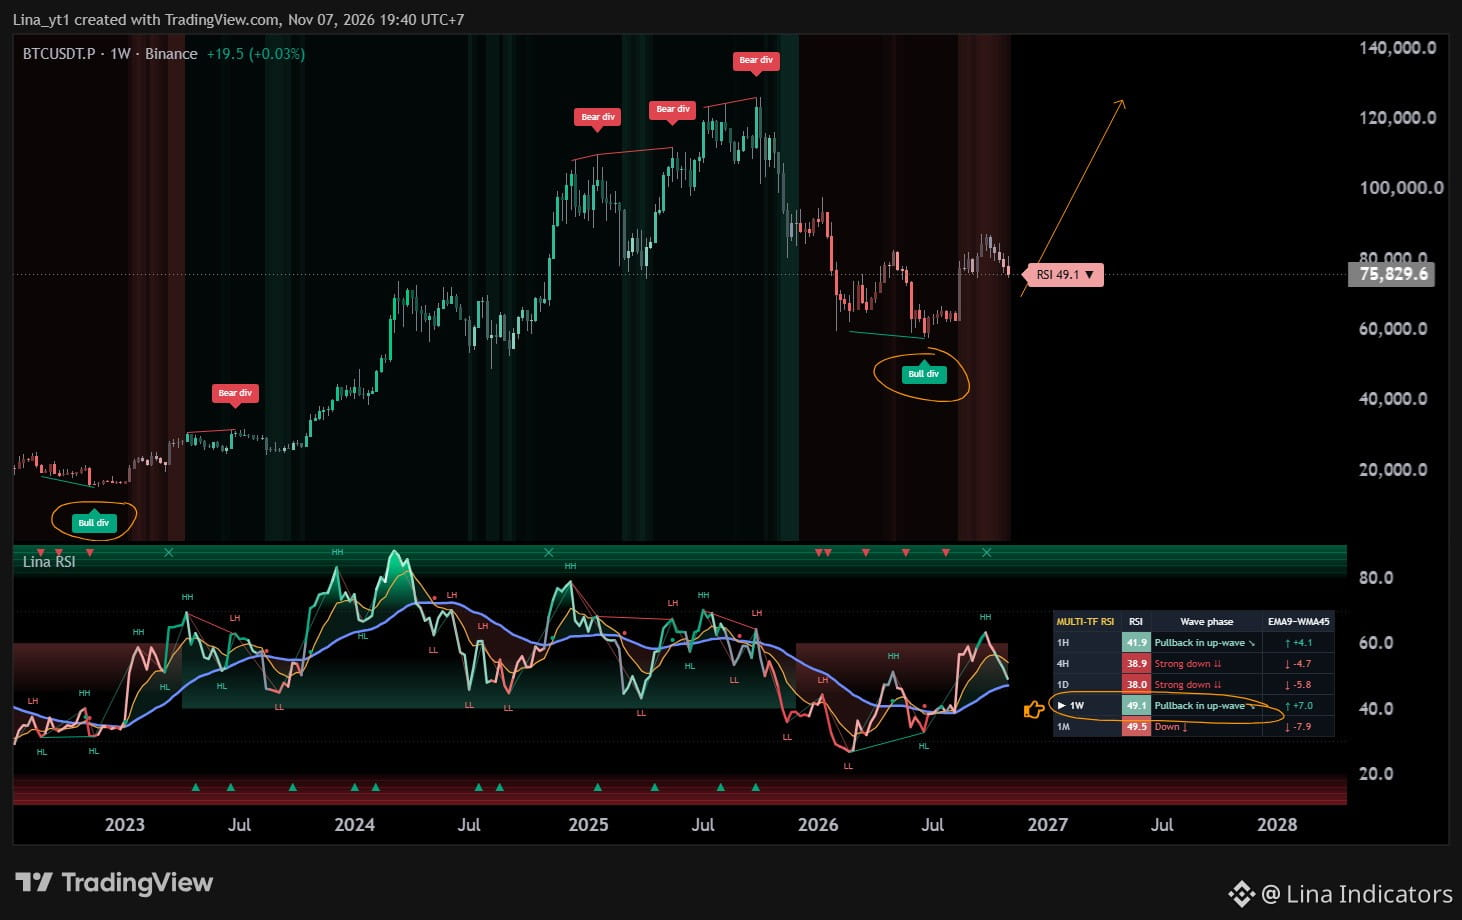
#BTC | 1W
BTC is showing a bullish RSI divergence on the weekly chart.
Weekly RSI: ~49.3
1W: Pullback in up-wave
4H / 1D: Still weak
This may be an early medium-term recovery signal, but confirmation is still needed.
Watch the multi-timeframe RSI structure.
$BTC
{future}(BTCUSDT)
#BTC | 1W
BTC is showing a bullish RSI divergence on the weekly chart.
Weekly RSI: ~49.3
1W: Pullback in up-wave
4H / 1D: Still weak
This may be an early medium-term recovery signal, but confirmation is still needed.
Watch the multi-timeframe RSI structure.
$BTC
BTC is showing a bullish RSI divergence on the weekly chart.
Weekly RSI: ~49.3
1W: Pullback in up-wave
4H / 1D: Still weak
This may be an early medium-term recovery signal, but confirmation is still needed.
Watch the multi-timeframe RSI structure.
$BTC
1
1
136
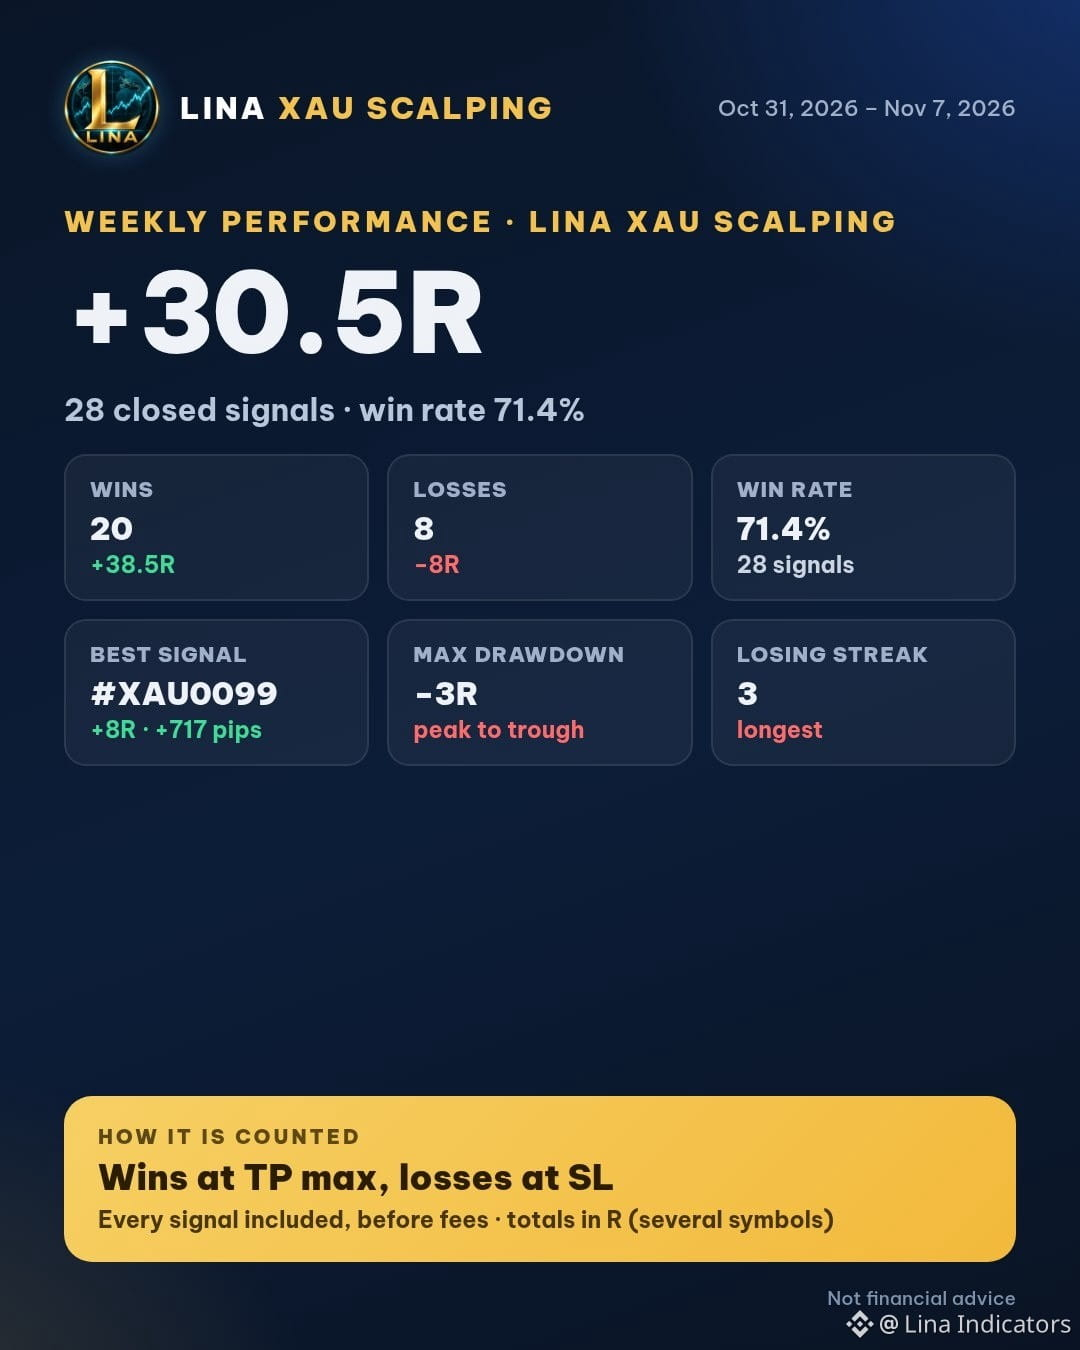
📊 Weekly performance · Lina XAU Scalping
✅ Wins: 20 · +38.5R
❌ Losses: 8 · −8R
🟡 XAU: 26 signals · +7385 pips · +32.5R
▫️ USOIL: 1 signal · −5 pips · −1R
▫️ XAG: 1 signal · −4 pips · −1R
💰 Net: +30.5R after stop losses
🎯 Win rate: 71.4%
📉 Max drawdown: −3R · Longest losing streak: 3
🏆 Best: #XAU0099 BUY · +8R · +717 pips · TP max
👇 Every signal, in order, in the reply below.
Wins counted at TP max (highest point reached), before fees.
#XAUUSD #TradingResults #Transparency
📊 Weekly performance · Lina XAU Scalping
✅ Wins: 20 · +38.5R
❌ Losses: 8 · −8R
🟡 XAU: 26 signals · +7385 pips · +32.5R
▫️ USOIL: 1 signal · −5 pips · −1R
▫️ XAG: 1 signal · −4 pips · −1R
💰 Net: +30.5R after stop losses
🎯 Win rate: 71.4%
📉 Max drawdown: −3R · Longest losing streak: 3
🏆 Best: #XAU0099 BUY · +8R · +717 pips · TP max
👇 Every signal, in order, in the reply below.
Wins counted at TP max (highest point reached), before fees.
#XAUUSD #TradingResults #Transparency
✅ Wins: 20 · +38.5R
❌ Losses: 8 · −8R
🟡 XAU: 26 signals · +7385 pips · +32.5R
▫️ USOIL: 1 signal · −5 pips · −1R
▫️ XAG: 1 signal · −4 pips · −1R
💰 Net: +30.5R after stop losses
🎯 Win rate: 71.4%
📉 Max drawdown: −3R · Longest losing streak: 3
🏆 Best: #XAU0099 BUY · +8R · +717 pips · TP max
👇 Every signal, in order, in the reply below.
Wins counted at TP max (highest point reached), before fees.
#XAUUSD #TradingResults #Transparency
3
2
957
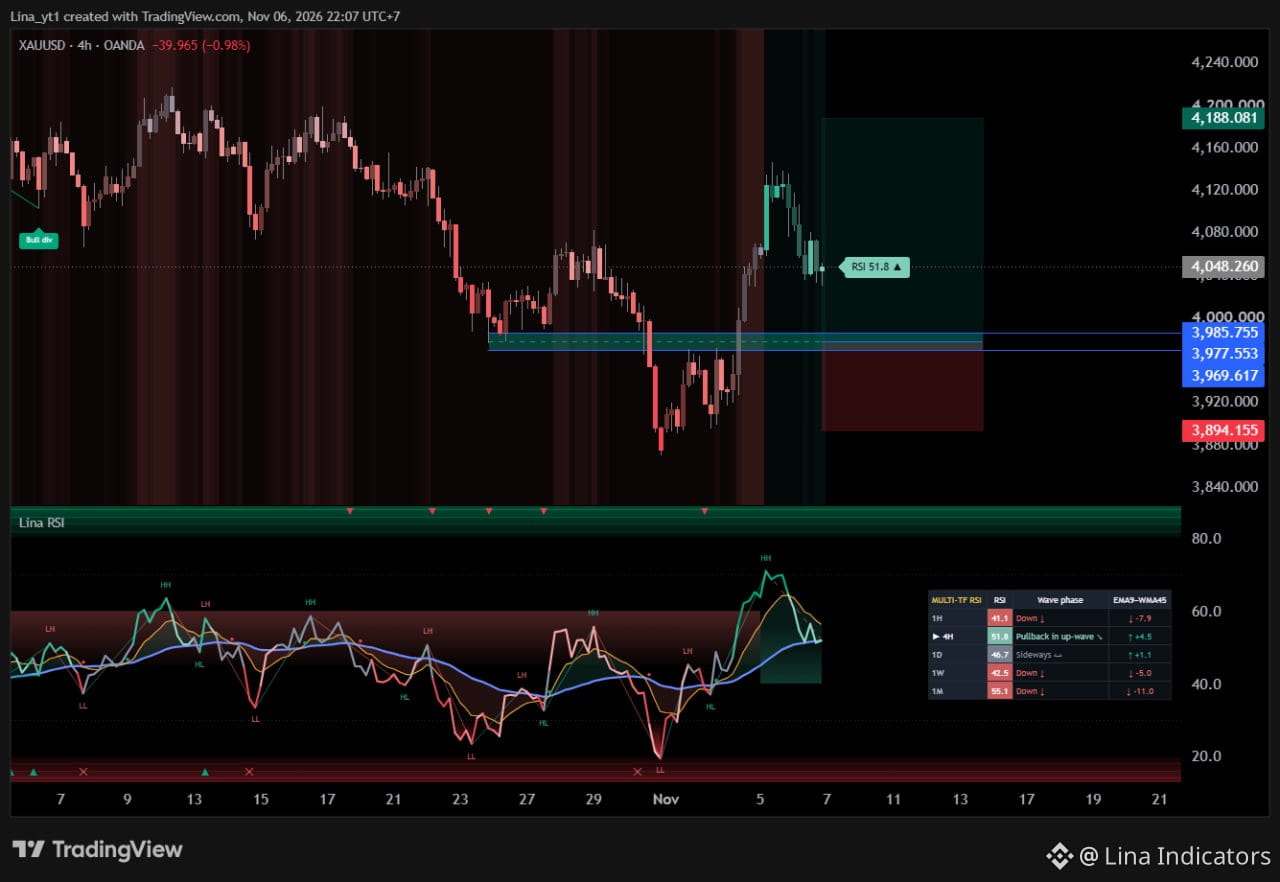
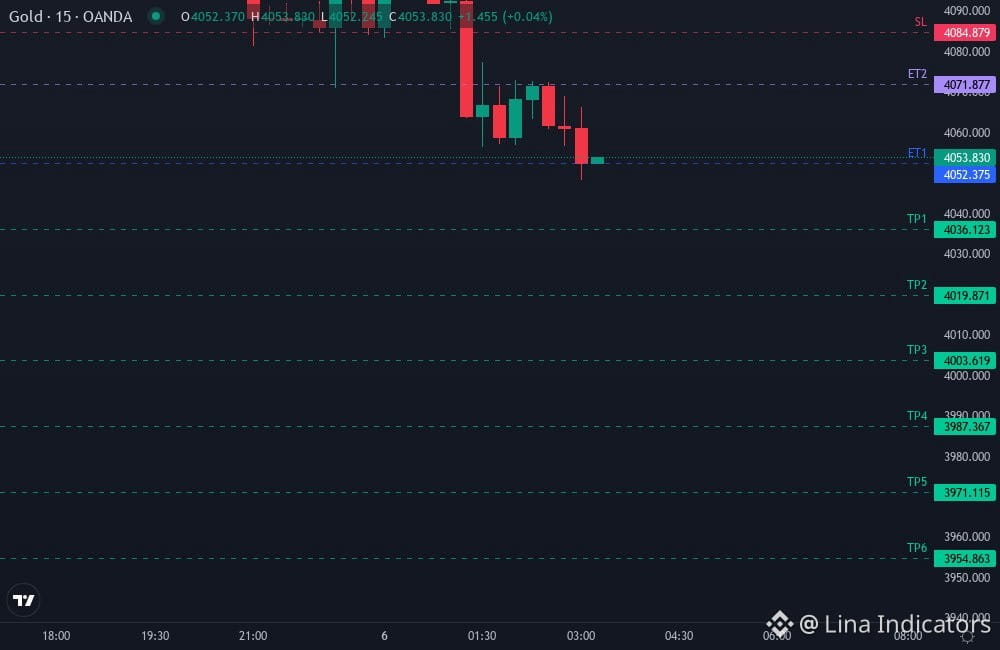
🔴 SELL XAUUSD · 15M
#XAU0105 #XAUUSD #XAU
Entry: 4052.375 - 4071.877
Stop Loss: 4084.879
TP1: 4036.123 · TP2: 4019.871 · TP3: 4003.619 · TP4: 3987.367 · TP5: 3971.115 · TP6: 3954.863
Win rate: 75.6% TP1 · 62.8% TP2
Time 10:15 · 06/11/2026
Risk max 0.5–1% of capital per trade.
For informational purposes only. Not financial advice.
🔴 SELL XAUUSD · 15M
#XAU0105 #XAUUSD #XAU
Entry: 4052.375 - 4071.877
Stop Loss: 4084.879
TP1: 4036.123 · TP2: 4019.871 · TP3: 4003.619 · TP4: 3987.367 · TP5: 3971.115 · TP6: 3954.863
Win rate: 75.6% TP1 · 62.8% TP2
Time 10:15 · 06/11/2026
Risk max 0.5–1% of capital per trade.
For informational purposes only. Not financial advice.
#XAU0105 #XAUUSD #XAU
Entry: 4052.375 - 4071.877
Stop Loss: 4084.879
TP1: 4036.123 · TP2: 4019.871 · TP3: 4003.619 · TP4: 3987.367 · TP5: 3971.115 · TP6: 3954.863
Win rate: 75.6% TP1 · 62.8% TP2
Time 10:15 · 06/11/2026
Risk max 0.5–1% of capital per trade.
For informational purposes only. Not financial advice.
1
1
524
·
--
Bearish
🚀 STILL RUNNING · +$1823 · +10R
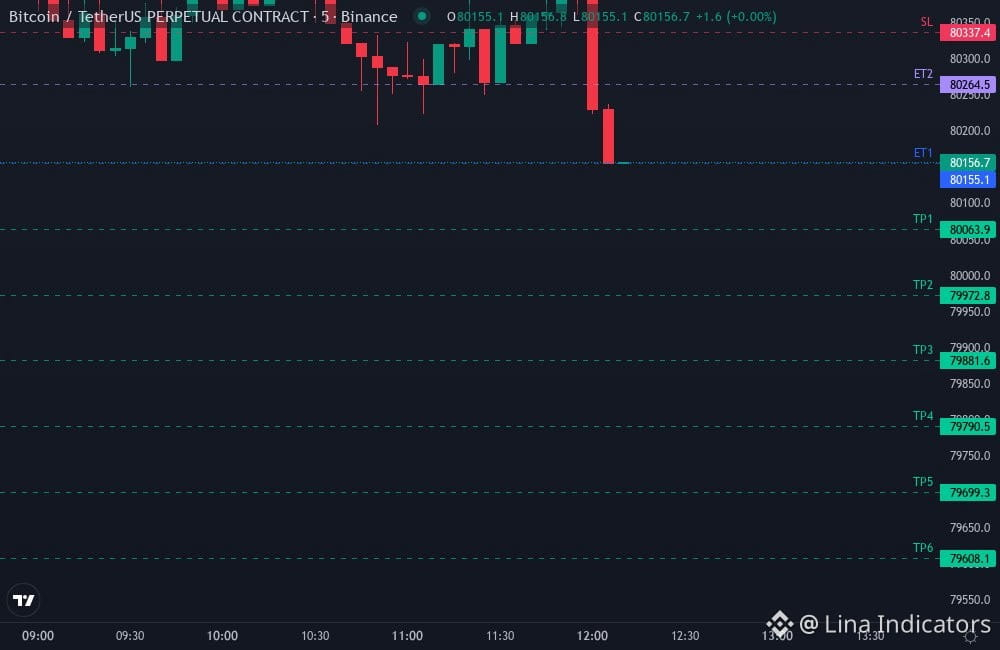
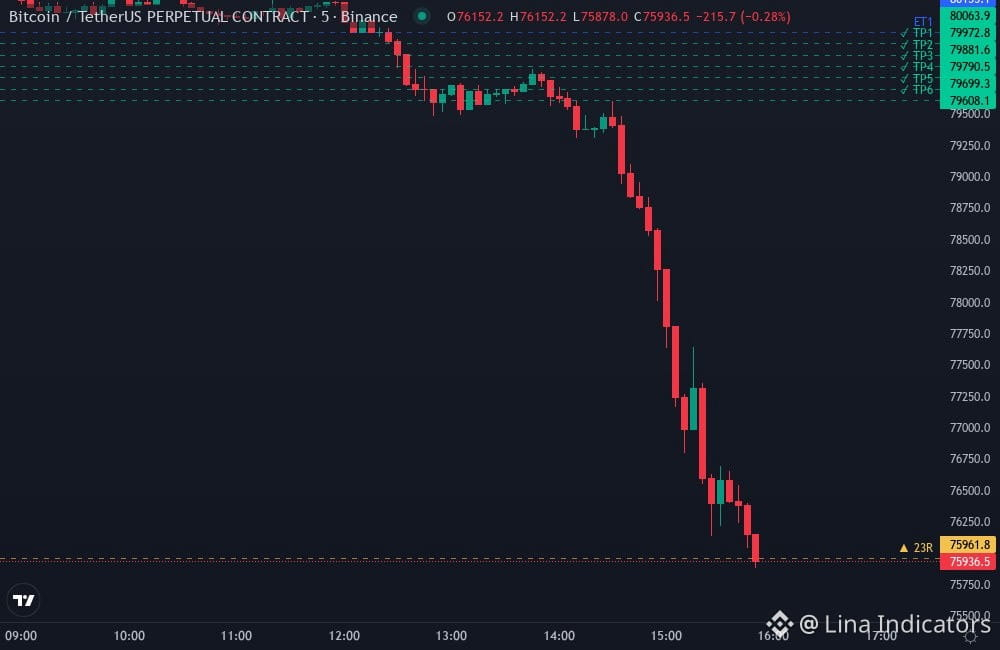
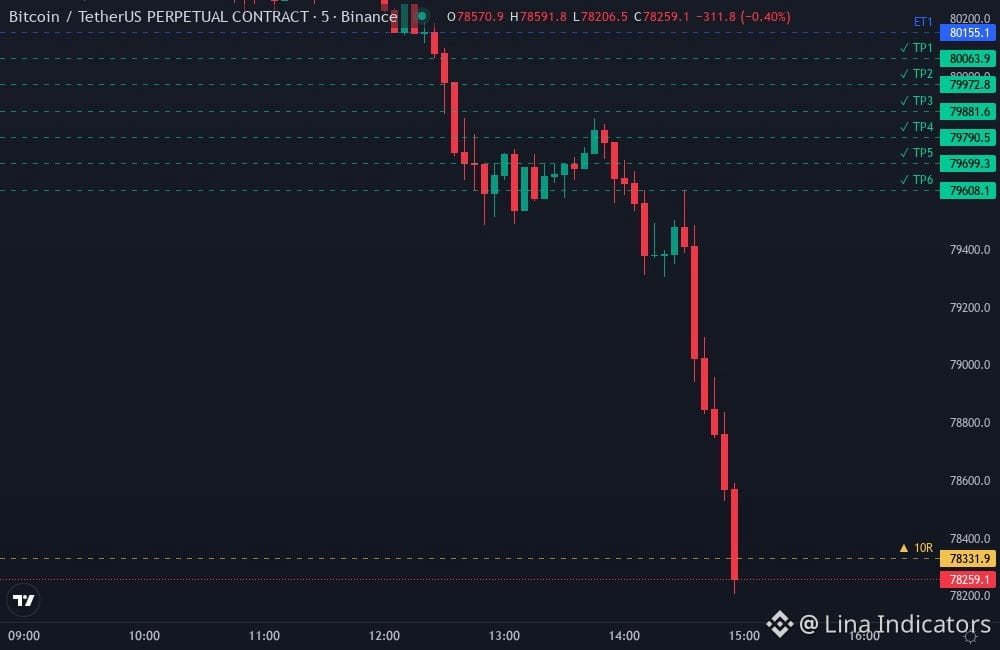
#BTC0076 · BTCUSDT.P · SELL · 5M
Entry 80155.1 → 78331.9
Duration: 2h 47m
Time 21:57 · 05/11/2026
🚀 STILL RUNNING · +$1823 · +10R
#BTC0076 · BTCUSDT.P · SELL · 5M
Entry 80155.1 → 78331.9
Duration: 2h 47m
Time 21:57 · 05/11/2026
#BTC0076 · BTCUSDT.P · SELL · 5M
Entry 80155.1 → 78331.9
Duration: 2h 47m
Time 21:57 · 05/11/2026
1
81
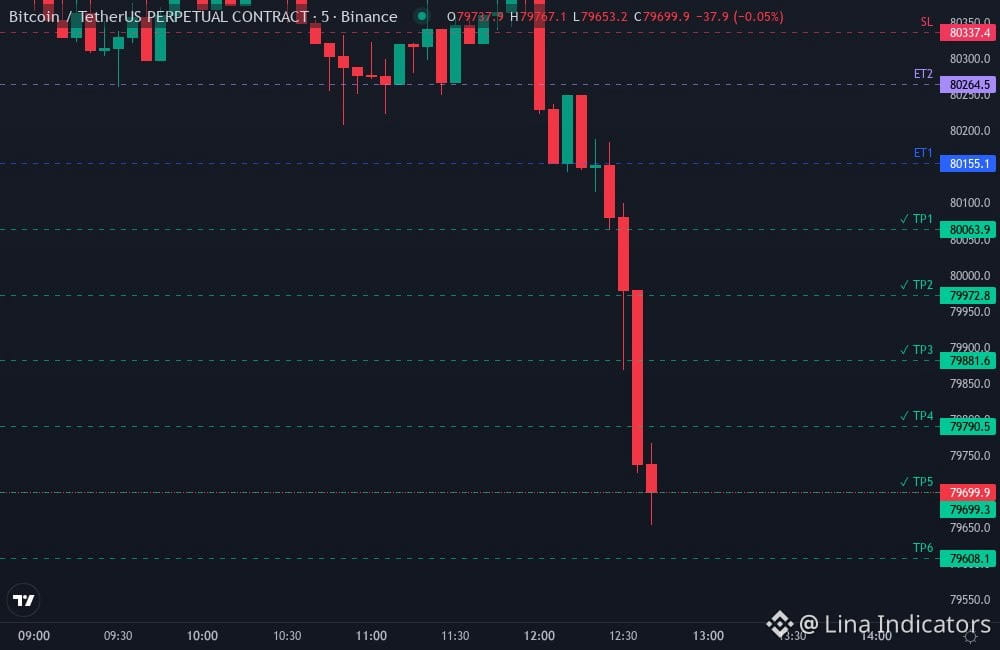
✅ TP5 HIT · +$456 · +2.5R
#BTC0076 · BTCUSDT.P · SELL · 5M
Entry 80155.1 → 79699.3
Duration: 31m
Time 19:41 · 05/11/2026
✅ TP5 HIT · +$456 · +2.5R
#BTC0076 · BTCUSDT.P · SELL · 5M
Entry 80155.1 → 79699.3
Duration: 31m
Time 19:41 · 05/11/2026
#BTC0076 · BTCUSDT.P · SELL · 5M
Entry 80155.1 → 79699.3
Duration: 31m
Time 19:41 · 05/11/2026
1
104
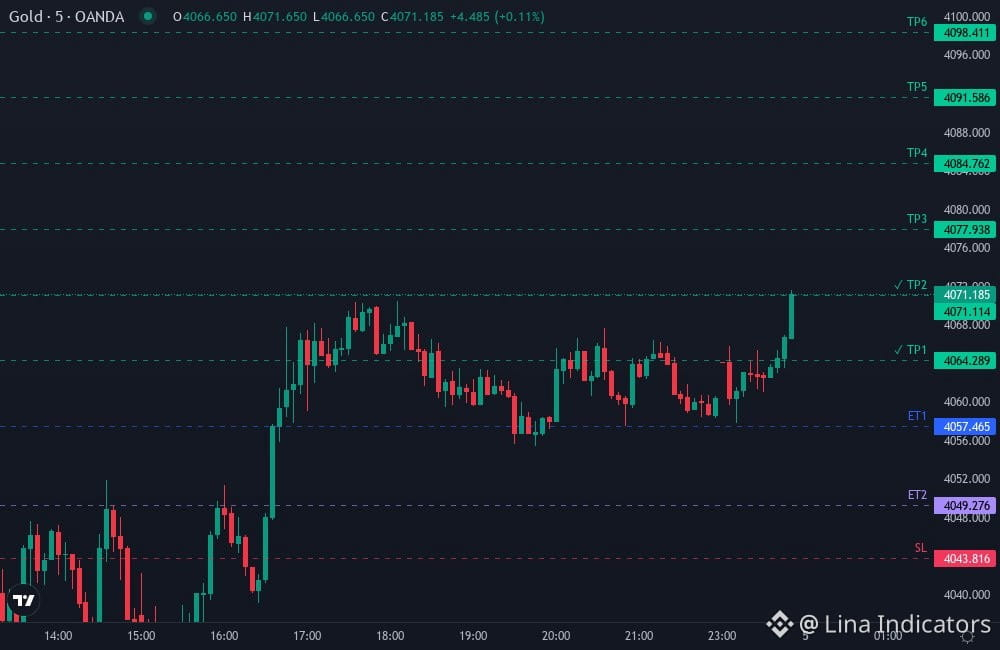
✅ TP2 HIT · +136 pips · +1R
#XAU0098 · XAUUSD · BUY · 5M
Entry 4057.465 → 4071.114
Duration: 7h 12m
✅ TP2 HIT · +136 pips · +1R
#XAU0098 · XAUUSD · BUY · 5M
Entry 4057.465 → 4071.114
Duration: 7h 12m
#XAU0098 · XAUUSD · BUY · 5M
Entry 4057.465 → 4071.114
Duration: 7h 12m
1
268
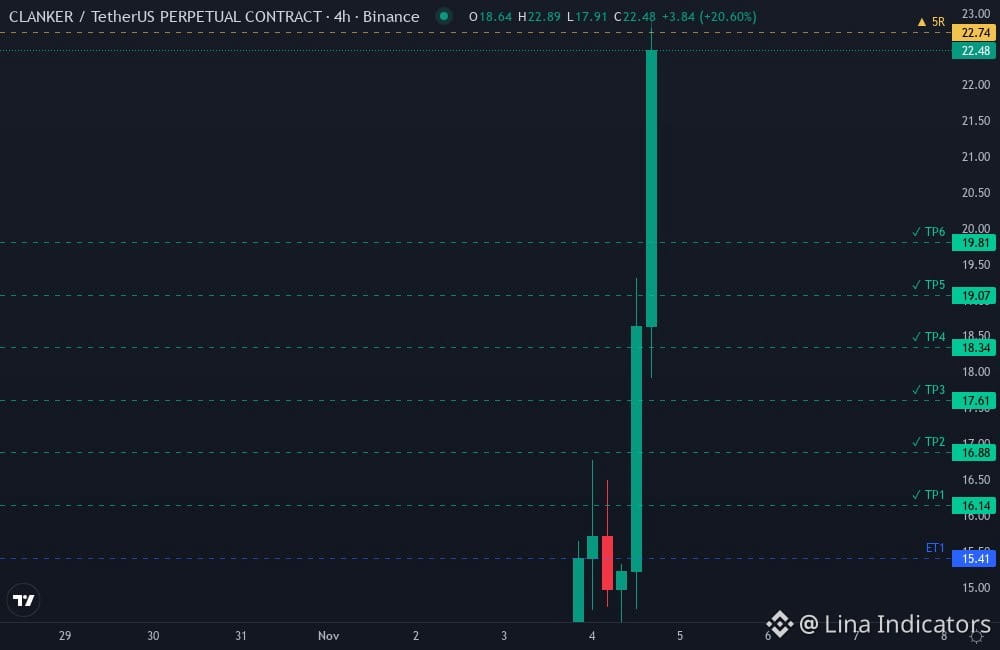
🚀 STILL RUNNING · +476% (10x) · +5R
#CLANKER0001 · CLANKERUSDT.P · LONG
Entry 15.41 → 22.74
Duration: 18h 34m
🚀 STILL RUNNING · +476% (10x) · +5R
#CLANKER0001 · CLANKERUSDT.P · LONG
Entry 15.41 → 22.74
Duration: 18h 34m
#CLANKER0001 · CLANKERUSDT.P · LONG
Entry 15.41 → 22.74
Duration: 18h 34m
1
1
333
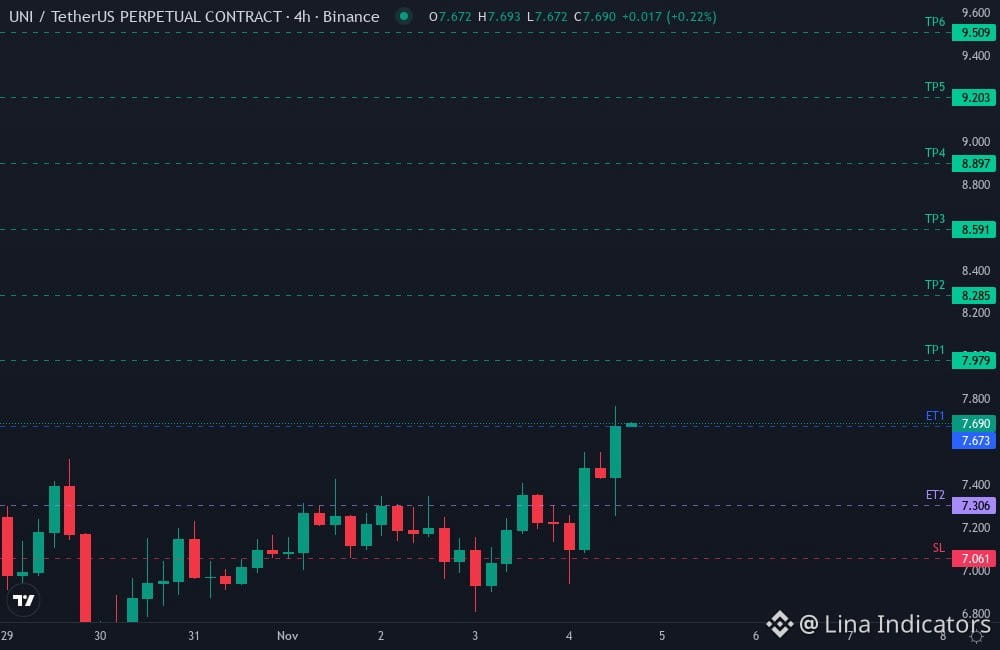
🟢 LONG UNIUSDT.P
#UNIUSDT.P #UNI
Entry: 7.306 - 7.673
Stop Loss: 7.061 (−80%)
Leverage: 10x (% shown on margin)
TP1: 7.979 (+40%)
TP2: 8.285 (+80%)
TP3: 8.591 (+120%)
TP4: 8.897 (+160%)
TP5: 9.203 (+199%)
TP6: 9.509 (+239%)
Win rate: 75.3% TP1 · 60.3% TP2
Time 23:00 · 04/11/2026
Risk max 0.5–1% of capital per trade.
For informational purposes only. Not financial advice.
🟢 LONG UNIUSDT.P
#UNIUSDT.P #UNI
Entry: 7.306 - 7.673
Stop Loss: 7.061 (−80%)
Leverage: 10x (% shown on margin)
TP1: 7.979 (+40%)
TP2: 8.285 (+80%)
TP3: 8.591 (+120%)
TP4: 8.897 (+160%)
TP5: 9.203 (+199%)
TP6: 9.509 (+239%)
Win rate: 75.3% TP1 · 60.3% TP2
Time 23:00 · 04/11/2026
Risk max 0.5–1% of capital per trade.
For informational purposes only. Not financial advice.
#UNIUSDT.P #UNI
Entry: 7.306 - 7.673
Stop Loss: 7.061 (−80%)
Leverage: 10x (% shown on margin)
TP1: 7.979 (+40%)
TP2: 8.285 (+80%)
TP3: 8.591 (+120%)
TP4: 8.897 (+160%)
TP5: 9.203 (+199%)
TP6: 9.509 (+239%)
Win rate: 75.3% TP1 · 60.3% TP2
Time 23:00 · 04/11/2026
Risk max 0.5–1% of capital per trade.
For informational purposes only. Not financial advice.
1
246
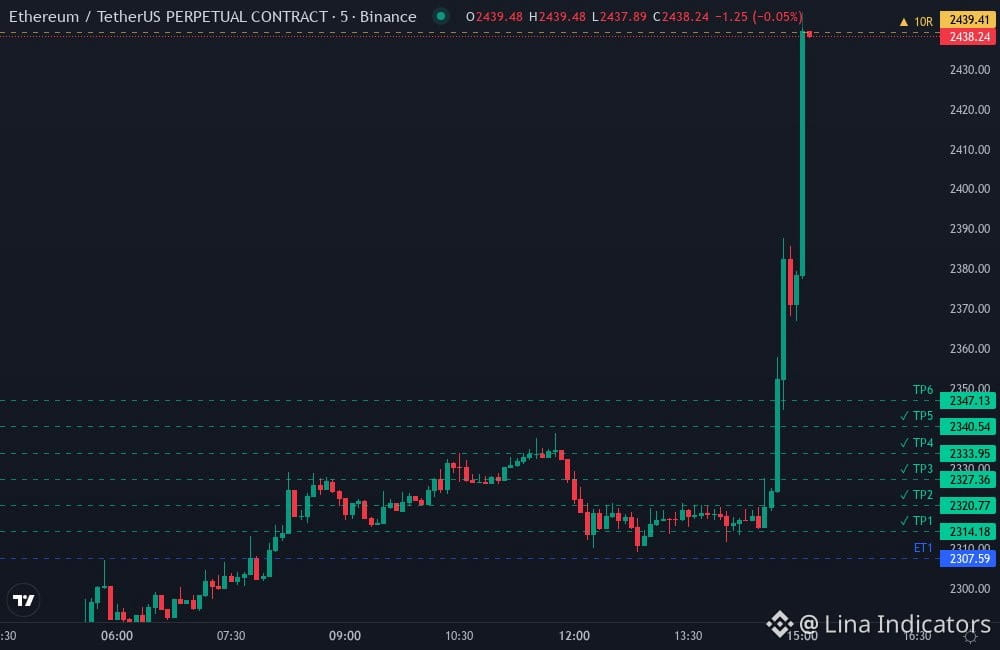
🚀 STILL RUNNING · +$132 · +10R
#ETH0007 · ETHUSDT.P · BUY · 5M
Entry 2307.59 → 2439.41
Duration: 7h 15m
Time 22:05 · 04/11/2026
🚀 STILL RUNNING · +$132 · +10R
#ETH0007 · ETHUSDT.P · BUY · 5M
Entry 2307.59 → 2439.41
Duration: 7h 15m
Time 22:05 · 04/11/2026
#ETH0007 · ETHUSDT.P · BUY · 5M
Entry 2307.59 → 2439.41
Duration: 7h 15m
Time 22:05 · 04/11/2026
1
123
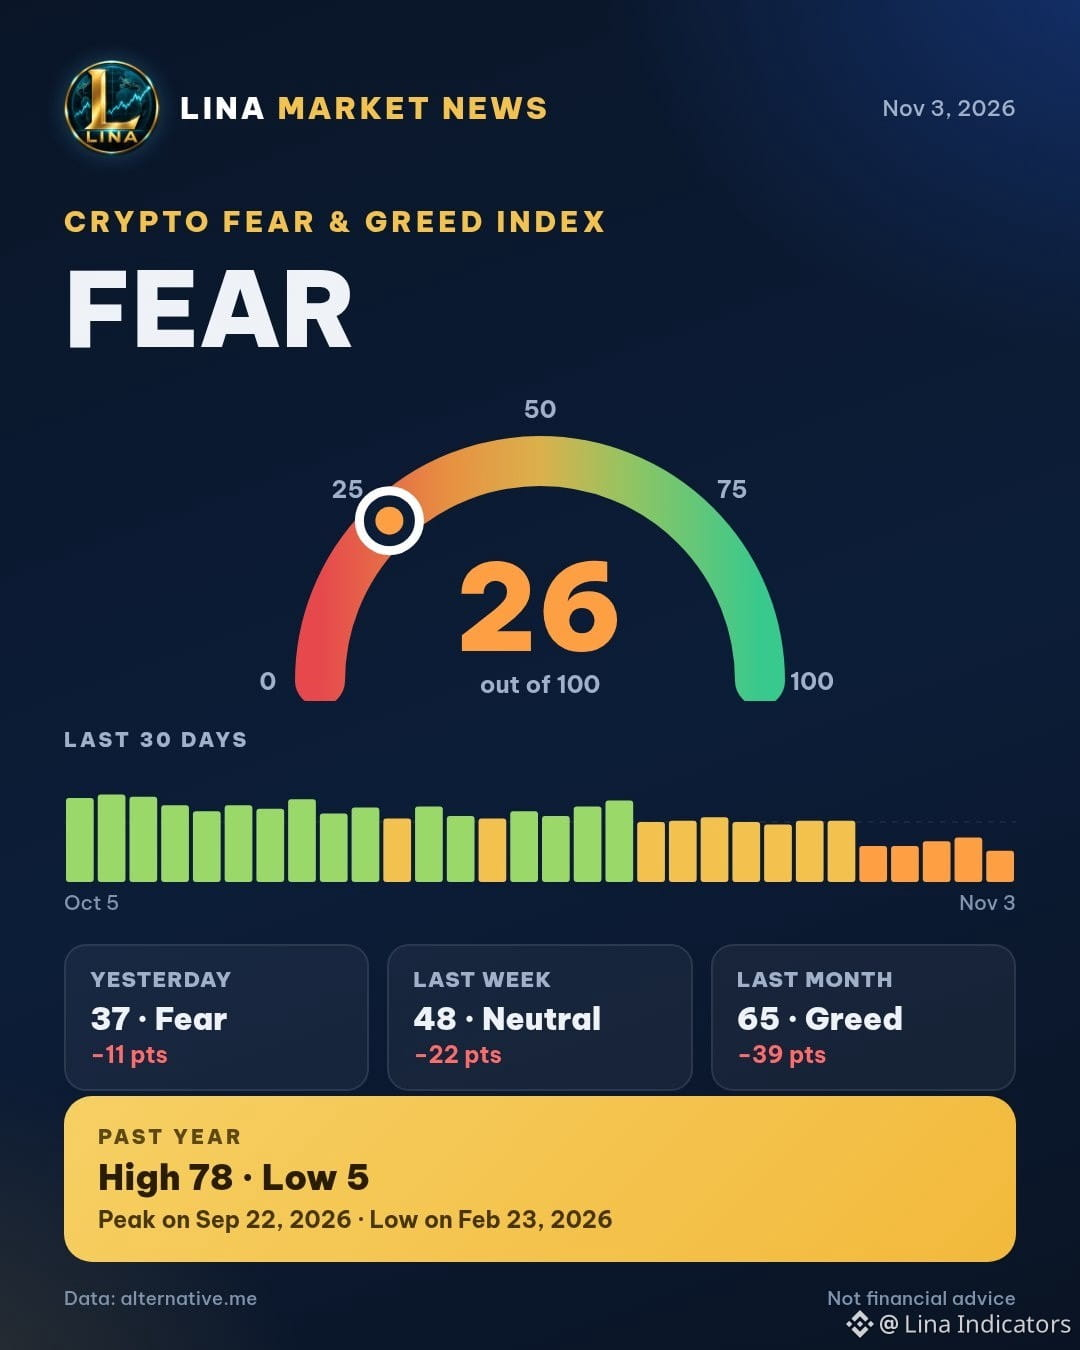
🇬🇧 Crypto Fear & Greed Index: 26/100 – Fear
Yesterday 37 (−11 points) · Last week 48 (−22 points) · Last month 65 (−39 points)
Past 1 year: high 78 · low 5
#FearAndGreed #Crypto #Bitcoin
🇬🇧 Crypto Fear & Greed Index: 26/100 – Fear
Yesterday 37 (−11 points) · Last week 48 (−22 points) · Last month 65 (−39 points)
Past 1 year: high 78 · low 5
#FearAndGreed #Crypto #Bitcoin
Yesterday 37 (−11 points) · Last week 48 (−22 points) · Last month 65 (−39 points)
Past 1 year: high 78 · low 5
#FearAndGreed #Crypto #Bitcoin
1
135
Log in to explore more content
Join global crypto users on Binance Square
⚡️ Get latest and useful information about crypto.
💬 Trusted by the world’s largest crypto exchange.
👍 Discover real insights from verified creators.
Email / Phone number
Trending Topics
NvidiaInvestigatesAfterHuang’sAffairApology
172,641 views
1,592 Discussing
Nvidia Board Opens Probe Into Whether Huang Was Target of Foreign Intelligence Effort
Binance News
·19 Likes
·54k views
BitcoinFiveWeeklyLosses
200,106 views
2,048 Discussing
AIChipSlumpNasdaq
106,291 views
1,273 Discussing