This week's movements in the crypto market can be described as 'the ultimate interpretation of the bull-bear contest': from the panic sell-off triggered by whale dumping to the unexpected rebound and subsequent accelerated decline after the technical breakdown, each node is accompanied by the resonance of funding and macro factors. Ultimately, Bitcoin (BTC) failed to hold the key support, and altcoins fell into a 'general decline', with market sentiment shifting from cautious optimism at the beginning of the month to a significant cooling. The following is a deep analysis from four aspects: market context, core funding indicators, altcoin market dynamics, and future outlook.
I. Market context: A three-step leap from 'rebound testing' to 'breakdown downward'.
The core logic of this week's market can be summarized as 'divergence between technical and funding aspects → resonance leading to a drop', specifically divided into three stages:
Panic sell-off (July 25)
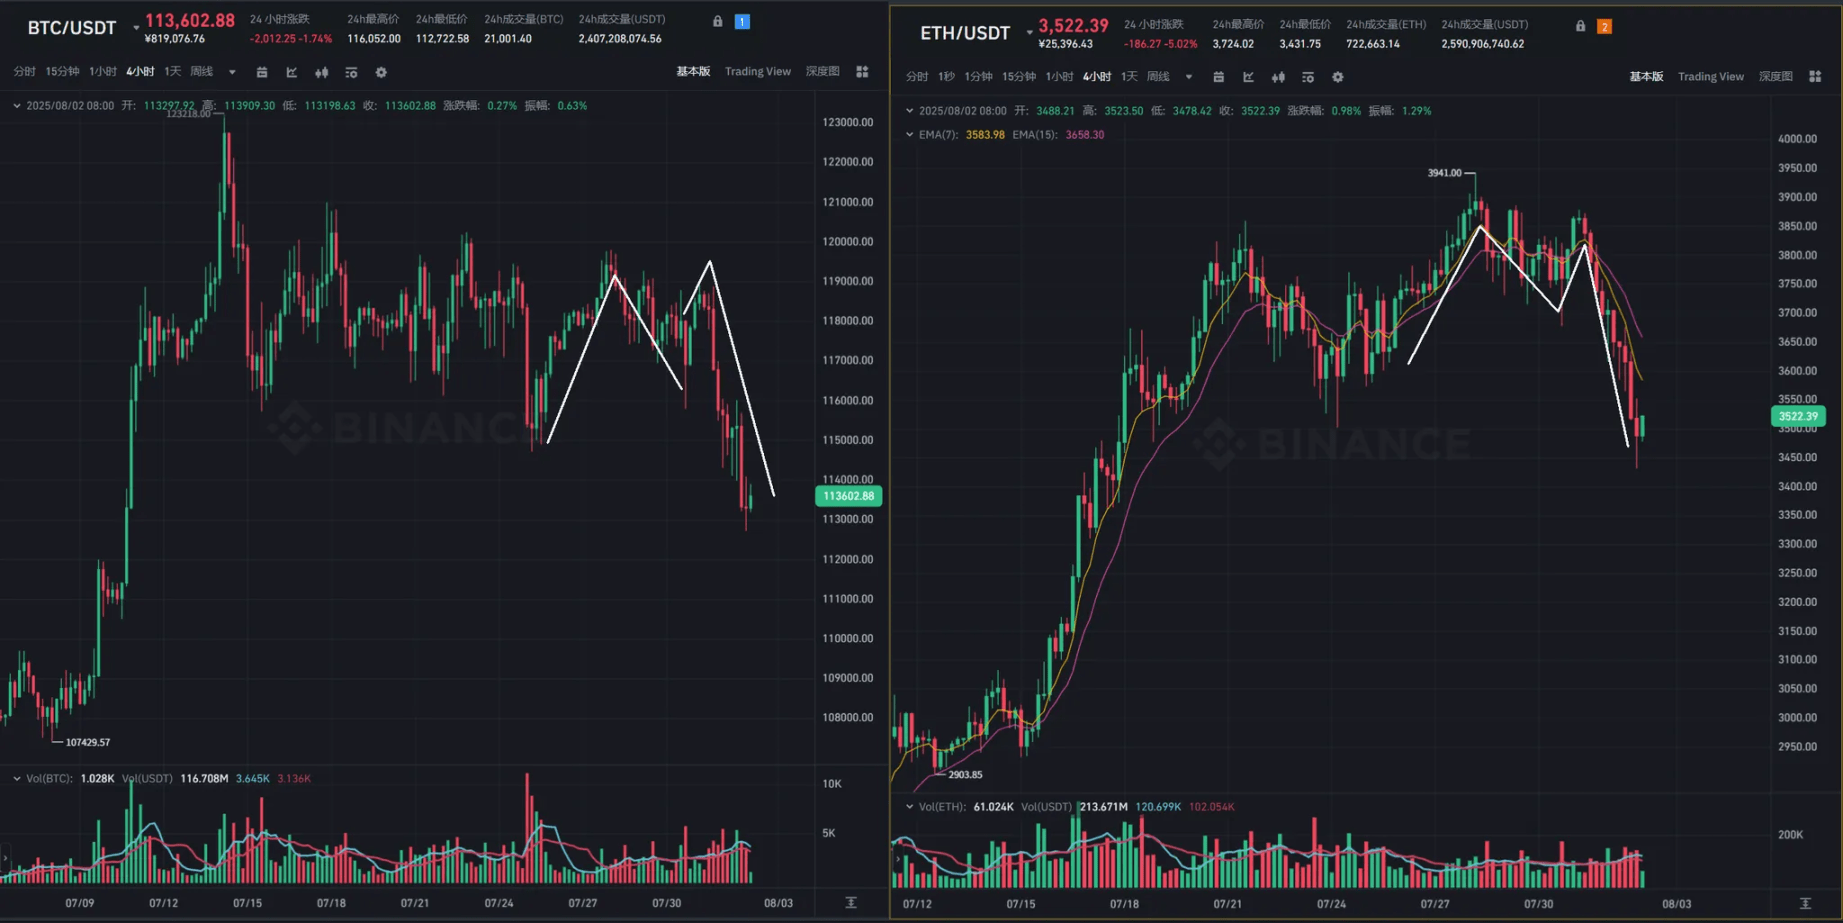
On the morning of July 25, concentrated selling by whales triggered a chain reaction in the market, causing BTC to briefly drop below the key support level of $115,000, reaching a temporary low. Behind this decline was a factor of profit-taking near the previous resistance level of $120,000, and it also reflects the market's sensitivity to macro uncertainty — at the time, the market had already digested the Fed's hawkish expectations ahead of the interest rate meeting, combined with the impending expiration of Trump's tariff policy, increasing risk aversion among funds.
Unexpected rebound (July 26)
On July 26, the market experienced a technical recovery, with BTC rebounding over $3,000 from its low, recovering to $118,000, and briefly surging to $120,000. The impetus for this rebound mainly came from two aspects: first, funds replenished after a short-term overselling; second, the news that MicroStrategy added 21,000 BTC near $117,000 boosted market confidence. However, from a technical perspective, $120,000, as a previously dense trading zone, presents obvious resistance, making the inability of the rebound to last understandable.
Acceleration of breakdown (July 31 - August 1)
In the early morning of July 31, the Fed's interest rate meeting released hawkish signals (indicating the possibility of another rate hike within the year). Although it did not directly trigger a crash, the technical aspect has shown fatigue — BTC, which was expected to challenge the previous high, failed to break through and instead experienced a breakdown in the evening, falling below the $115,000 support. On August 1, coupled with the decline in U.S. stocks (the Dow fell over 300 points in a single day) and the formal implementation of Trump's tariff policy (imposing tariffs on some imported goods), market panic spread, causing BTC to accelerate downward, touching below $110,000, forming a 'macro + technical' double kill pattern.
II. Core funding indicators: Three dimensions reveal the 'cooling truth' of the market.
The funding aspect is the 'blood' of the market. This week, multiple indicators show that market capital inflow has experienced a 'cliff-like cooling', which is also the core reason why the market is difficult to sustain rebounds.
2.1 Stablecoins: Issuance plummeted by 97%, with capital inflow nearly halted.
This week, the total market value of stablecoins reached $227.777 billion, with a weekly issuance of only $7.2 million, a 97% decrease compared to last week's $2.623 billion, and the daily average issuance dropped from $375 million to $10 million. This data marks the lowest value in nearly 12 weeks, indicating that incremental funds have almost 'stopped flowing'.
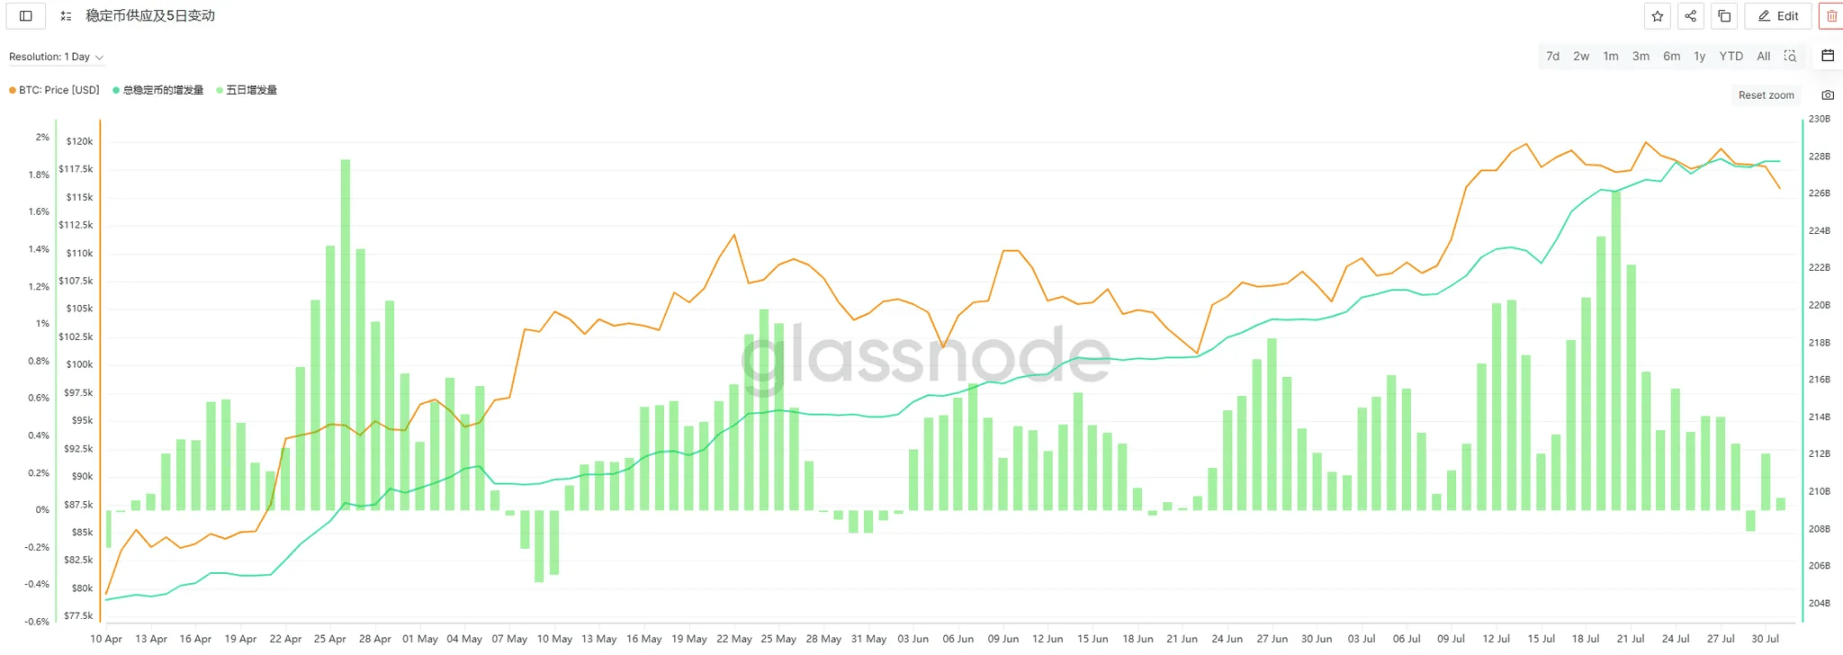
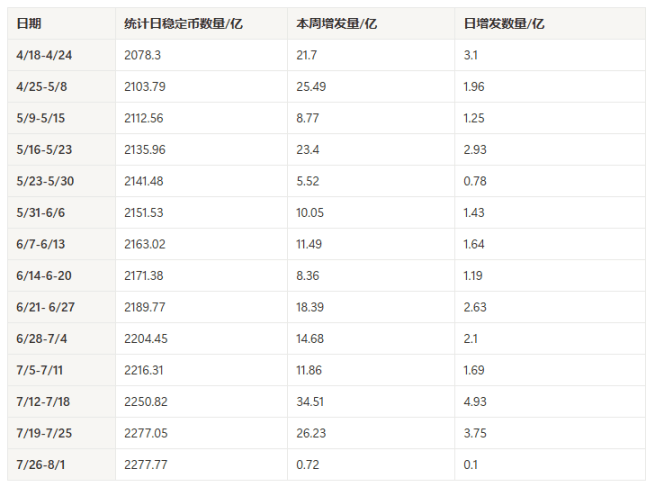
Historically, the issuance of stablecoins is an important leading indicator of market rises (for example, during the week of July 12-18, there was a single week issuance of $3.451 billion, followed by BTC rising from $110,000 to $120,000). The 'zero growth' state this week reflects investors' caution at the current level — neither daring to chase highs nor willing to blindly catch bottoms in declines.
Going forward, it is crucial to focus on whether the issuance of stablecoins can return to over $500 million weekly, which is the primary signal for market sentiment warming.
2.2 ETF: After a 'halving' in inflows, it remains at a low level, and institutional attitudes become cautious.
This week, Bitcoin ETF saw a net inflow of $299.9 million, remaining roughly stable compared to last week ($300.82 million) but a significant drop from earlier in July (net inflows of $2.296 billion from July 5-11 and $3.052 billion from July 12-18). Notably, on Friday (August 1), the ETF experienced a single-day net outflow for the first time in nearly three weeks, coinciding with the accelerated drop in BTC prices, creating a 'negative feedback' effect.
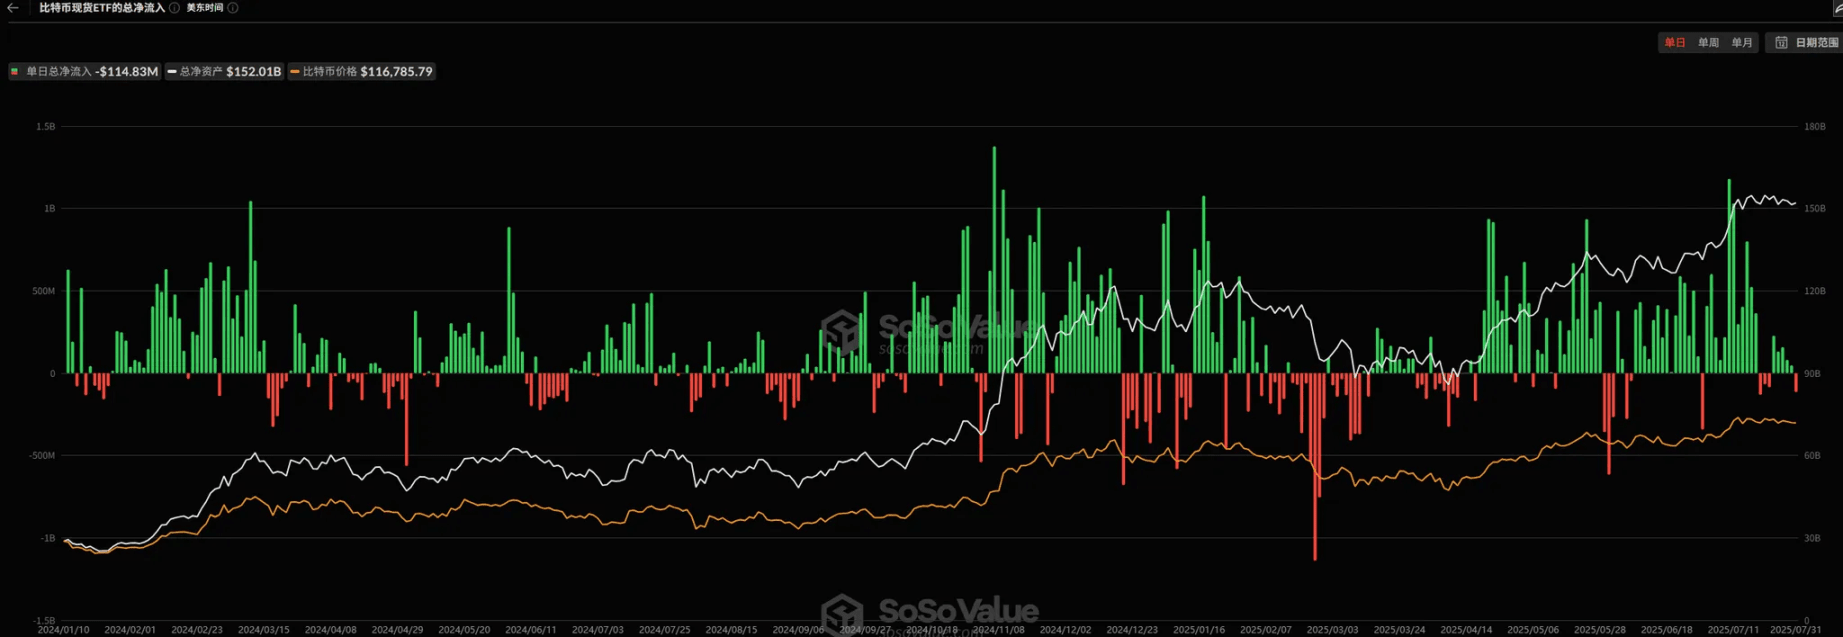
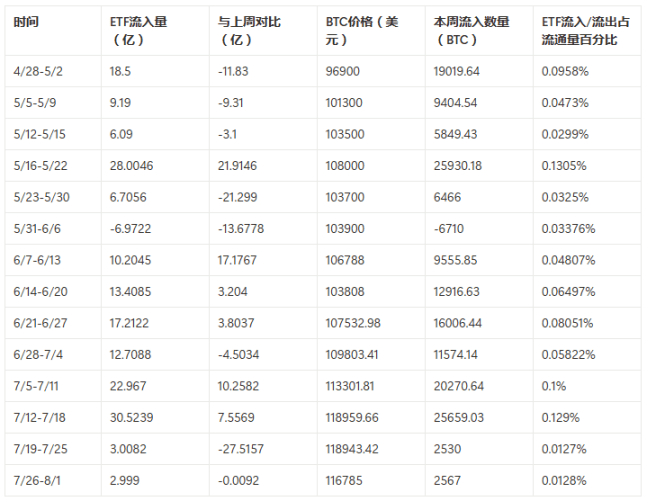
The 'withdrawal' of institutional capital is not coincidental: on the one hand, valuations above $120,000 led some institutions to choose to take profits; on the other hand, the tightening macro rate environment (the Fed's hawkish stance) raised the opportunity cost of holding crypto assets, leading to a decrease in institutional allocation willingness.
Historically, if ETF weekly inflows remain below $500 million, it often corresponds to a period of BTC fluctuations or corrections. We need to wait for inflows to return to the $1 billion level to confirm the return of institutional capital.
2.3 Holder structure: The contradiction between long holds and short trades intensifies, with short-term support nearing its limit.
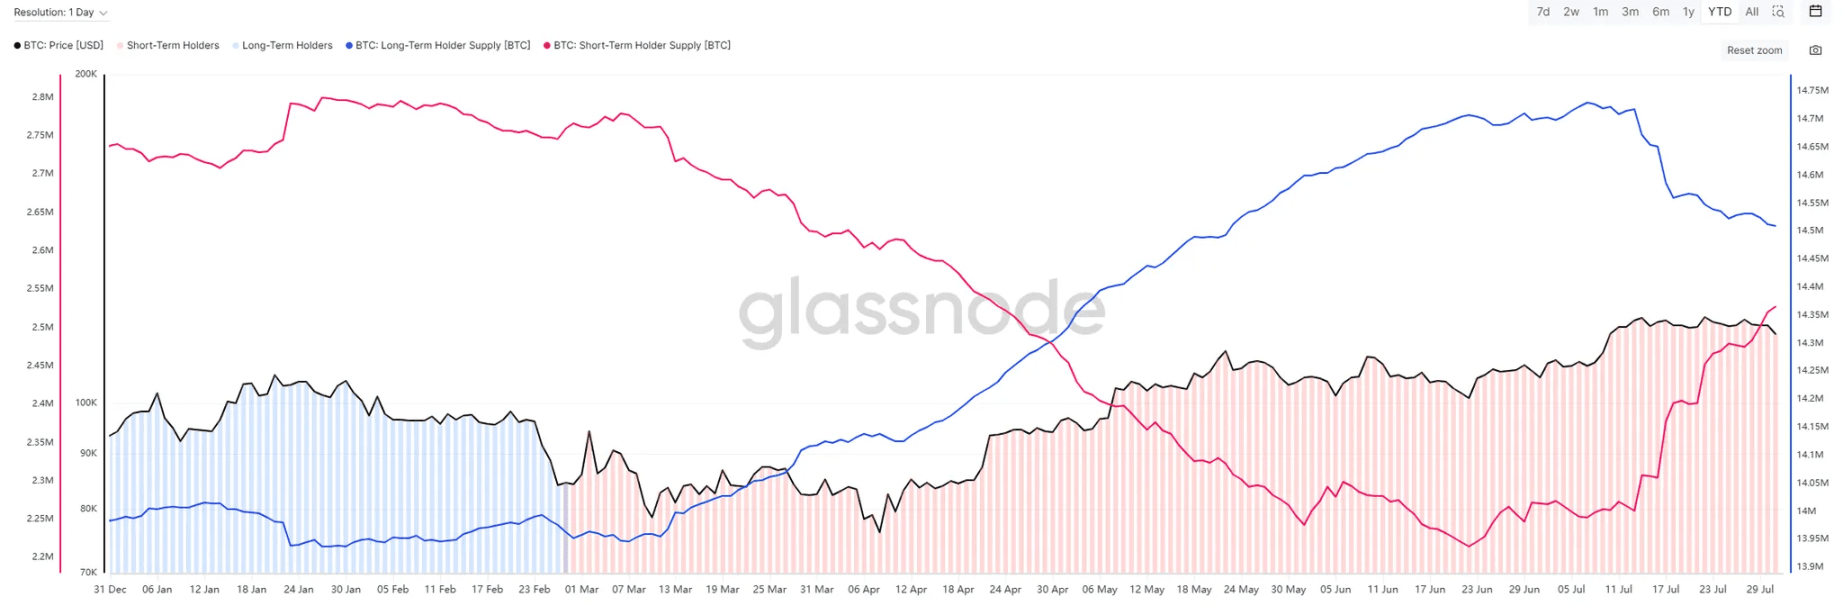
On-chain data shows that this week, the holdings of long-term Bitcoin holders (holding for over 1 year) continued to decline, while the holdings of short-term holders (holding for less than 3 months) accelerated their rise, forming a 'long throw, short catch' pattern.
Behind this phenomenon: Long-term holders are realizing profits in the $115,000 to $120,000 range (some chips cost less than $70,000, providing ample profit space), while short-term holders are attempting to 'catch the bottom' to gain rebound profits.
The risk point is: The accelerated decline on Friday may indicate that the purchasing power of short-term holders is nearing its limit — when short-term capital cannot support long-term selling pressure, the market is prone to a 'long kill long' situation, which is also a risk that needs to be vigilant in the future.
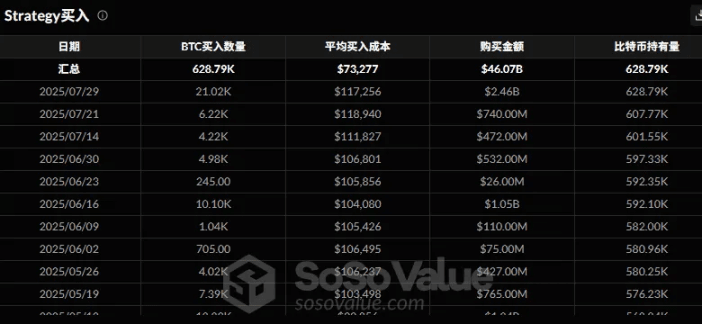
Moreover, this week, MicroStrategy bought 21,020 BTC at an average cost of 117,256 on July 29, marking the largest purchase in nearly four months; the previous large-scale purchase was on March 31 when Bitcoin was around $87,000, purchasing 22,050 BTC. Currently, MicroStrategy's average holding cost for BTC is $73,277, with a total holding of 628,790 BTC, making MicroStrategy's purchases an important component of Bitcoin's capital inflow.
III. Altcoin market: 'Following the decline, not the rise' becomes the norm, and the entire market enters 'defensive mode'.
Compared to BTC's fluctuations, this week altcoins (except $BTC , $ETH ) performed more weakly, with 'following the decline, not the rise' becoming a common phenomenon, reflecting a significant contraction in market risk appetite.
3.1 Market capitalization and activity: Dual shrinkage, with capital concentrated on core assets.
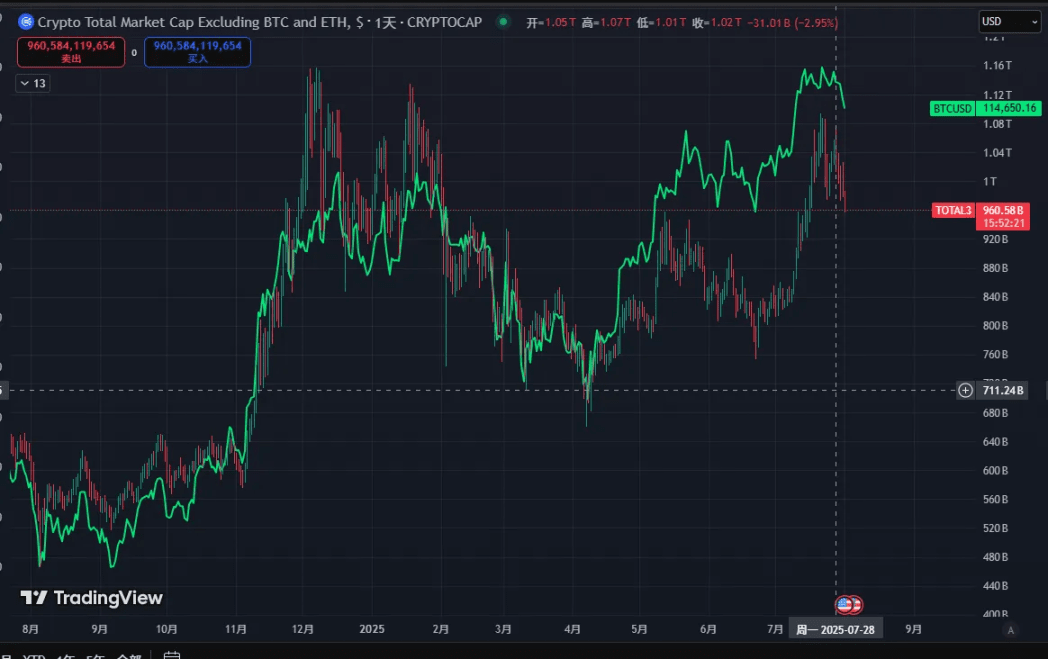
The total market value of altcoins (TOTAL2) fell by 6.4% this week to $96.4 billion, while BTC's market share rose from 61% last week to 62%, indicating that funds are shifting from small and mid-cap coins to BTC.
On-chain activity has simultaneously cooled: total TVL (total value locked) decreased by 16.2% to $136.1 billion, DEX trading volume decreased by 17.3%, with public chains like SOL and BSC seeing TVL declines exceeding 10%, reflecting a sharp drop in user participation and trading enthusiasm. This week, the ETH staking platform like Lido has released significantly more than the staking amount; the impact on price needs further observation. We will continue to pay attention to the changes in TVL of important protocols like Lido and will update in a timely manner.
3.2 Sector differentiation: Only a few cryptocurrencies are moving, while most are in 'silence'.
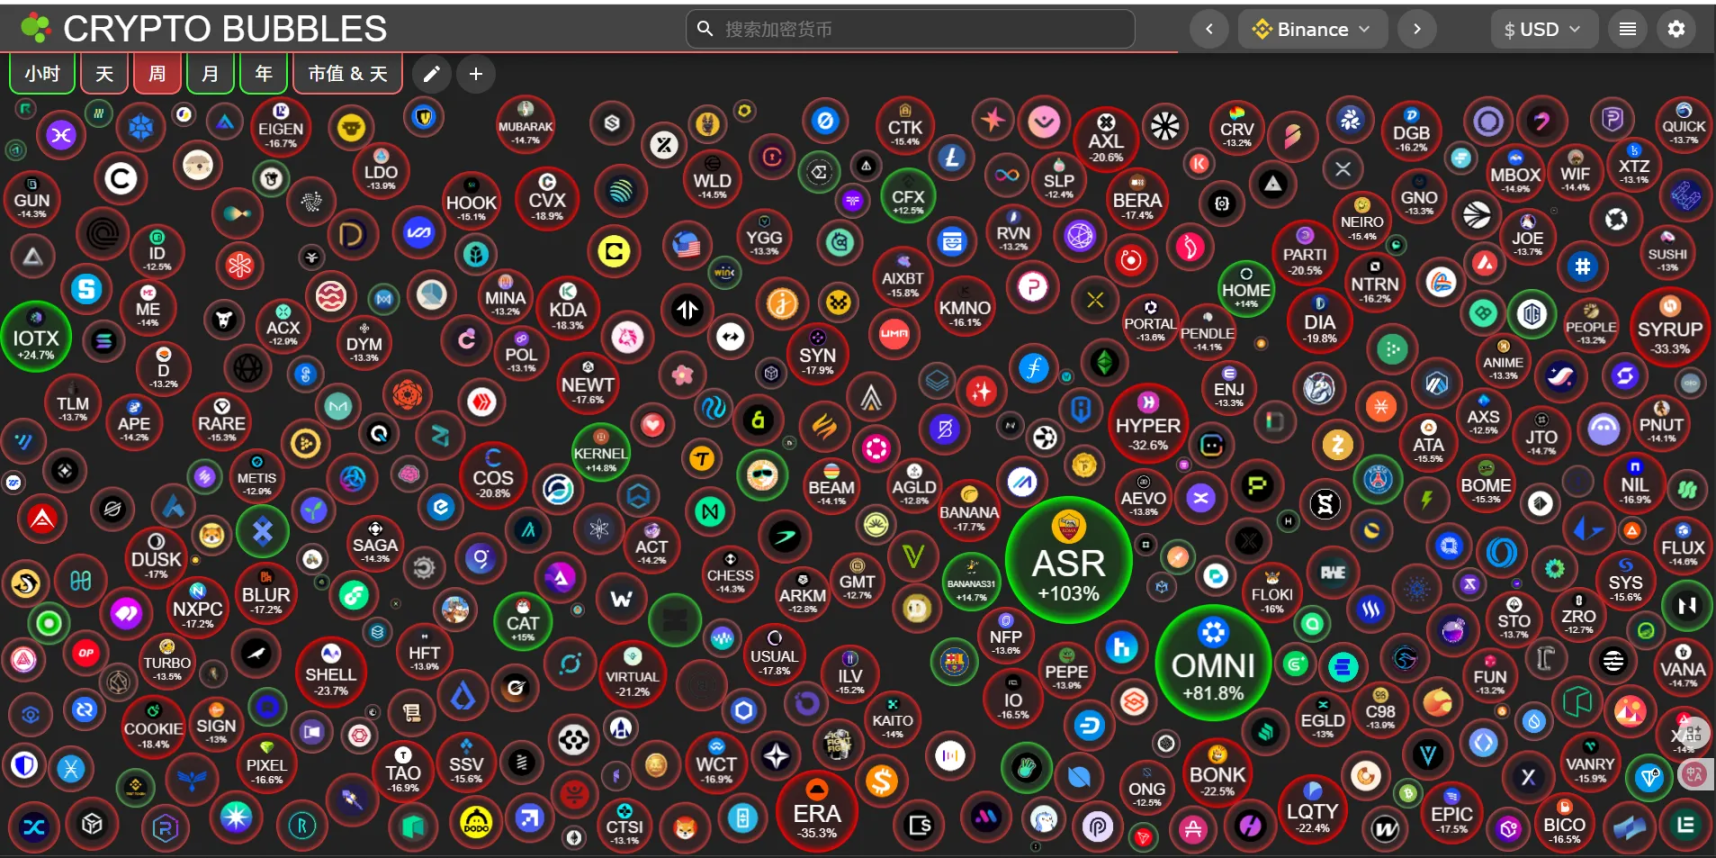
This week, only a few altcoins performed actively due to news stimuli:
Omni rose over 50% in a single day after being listed on the South Korean exchange Upbit;
IOTX rose 20% in the short term due to news of 'launching an ETF'.
Small-cap cryptocurrencies (like ASR, M, SPK) and previous 'meme coins' have shown volatility during the day, but lack sustainability, being more a result of short-term speculative trading.
Meanwhile, mainstream altcoin sectors (like DeFi, NFT, AI) generally fell, with the meme coin sector declining over 8%, becoming a hard-hit area, reflecting that speculative funds are withdrawing from high-risk areas.
3.3 Sentiment indicators: Prosperity value has dropped below the 'ascending line', entering the 'wait and see zone'.
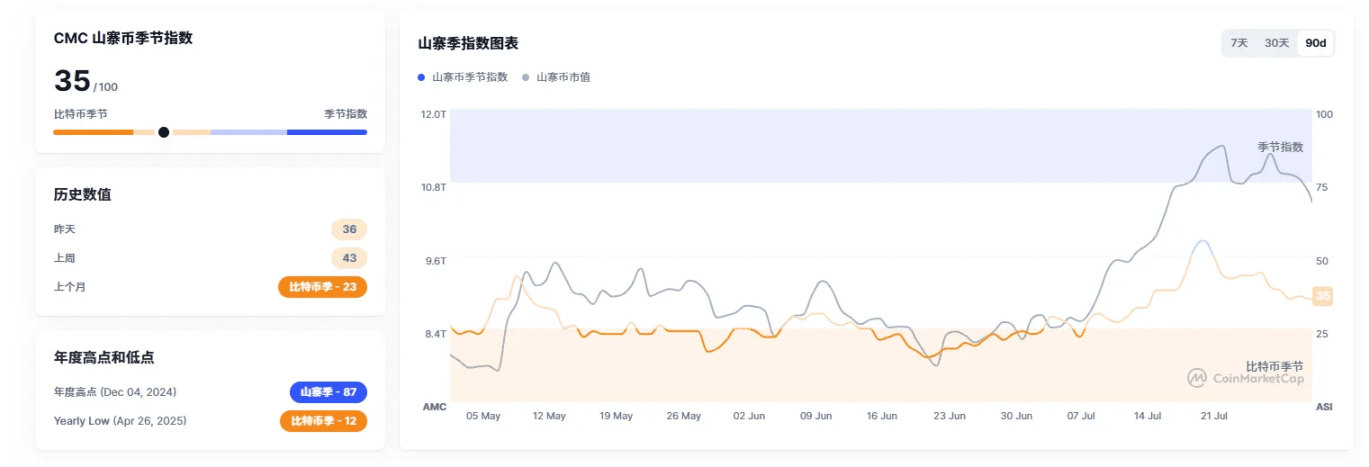
The altcoin index fell from 42 last week to 35, remaining in a downward channel for five consecutive days, indicating a continued loss of confidence in small-cap coins.
The on-chain prosperity value fell to 50 points this week (just below the 'ascending line' of 60 points); among the sub-indicators, DEX protocol revenue, active user numbers, and trading volume all saw significant declines, indicating that the 'profit-making effect' of altcoins has disappeared.
For investors, the best strategy in the current altcoin market is 'reduce positions and observe': on the one hand, avoid catching the bottom in a weak market (which could lead to getting cut), on the other hand, wait for two signals — BTC to stabilize after hitting the bottom, and the altcoin index no longer hitting new lows (indicating a rebound in relative strength).
3.4 Secondary market analysis
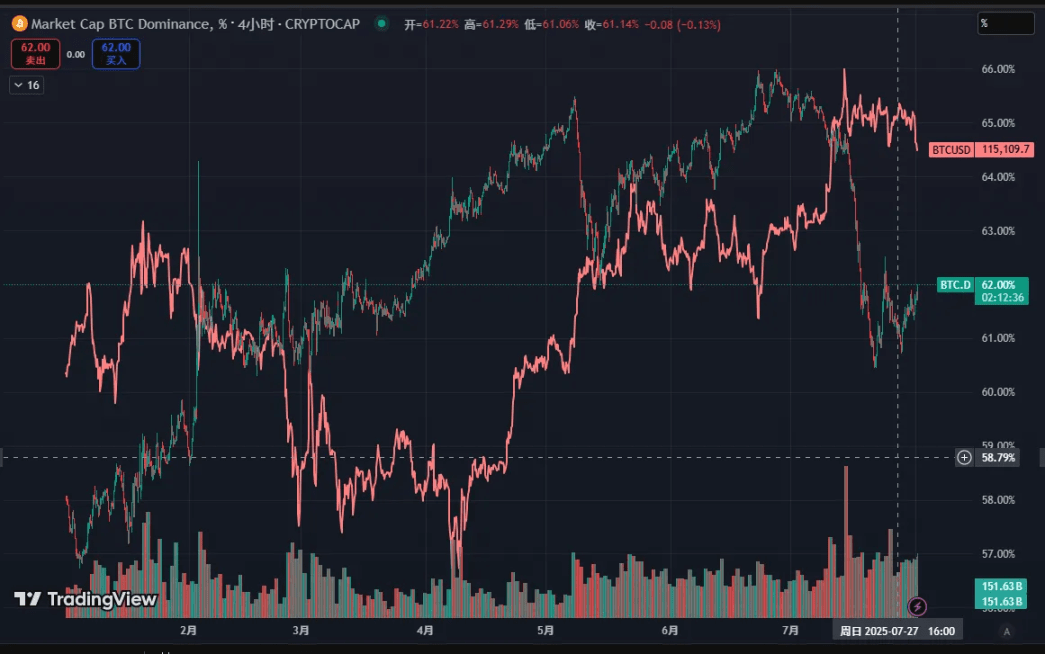
Altcoin strength and weakness analysis
BTC's market share is 62%. After a week of fluctuations, the market has not effectively broken through the previous high, leading to a further rise in the market, while altcoin sentiment gradually cools and BTC's market share begins to rise.
SOL/BTC and ETH/BTC exchange rates were still in a range-bound fluctuation at the beginning of the week, with ETH remaining relatively strong while SOL weakened, leading to a noticeable drop in the sector. On Thursday, as BTC fell, the overall market further weakened along with ETH.
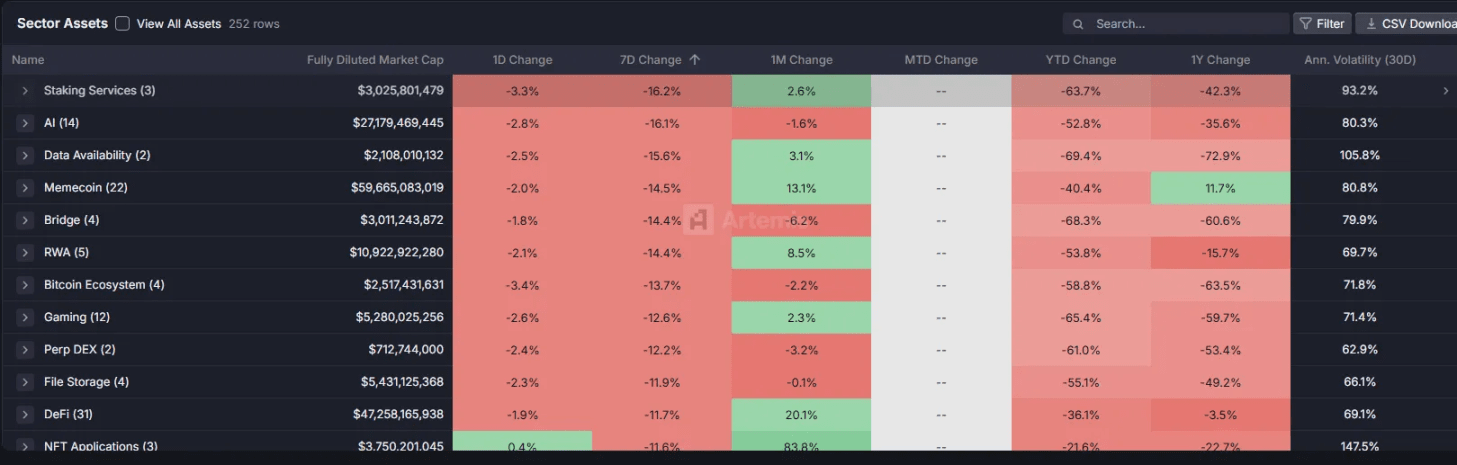
Regarding market flow
In terms of inflows and outflows among sectors, all sectors fell this week, with meme and AI sectors leading the decline, reflecting poor overall market sentiment.
On the institutional side, this week BTC ETF inflows were $169 million, slightly up from last week, but the volume is small. ETH ETF inflows were $306 million, significantly down from last week. Currently, ETH's market sentiment has decreased, and sustainability remains to be observed.
3.5 On-chain data analysis
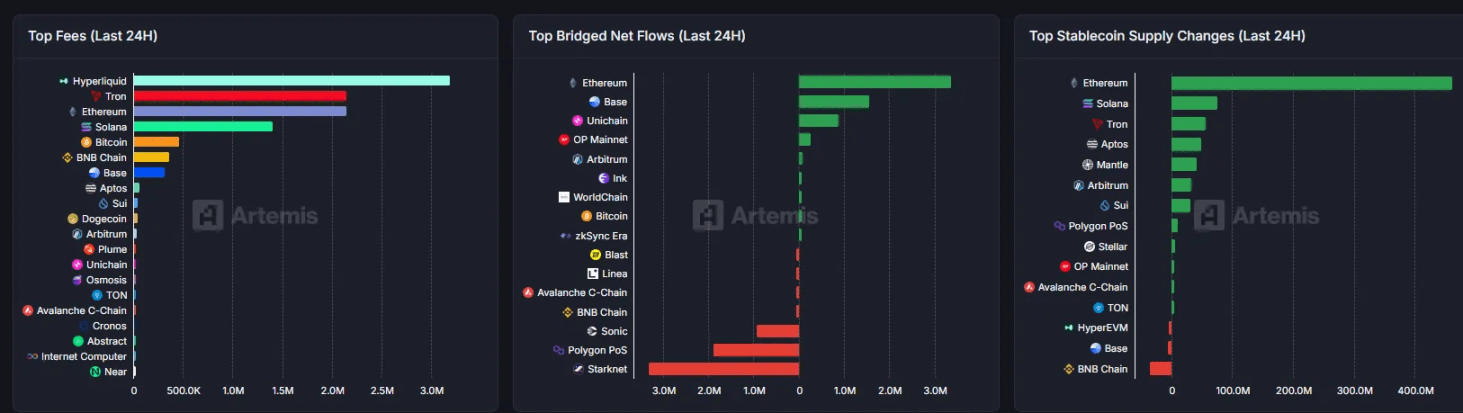
On-chain asset flow and stablecoin supply indicate that ETH has the highest net inflow, while STARKET has the highest net outflow, with the trend remaining unchanged.
On-chain user activity and speculative sentiment this week showed good activity among ETH, BSC, and BAS users. In comparison, the trend remains ETH > BSC > BASE > SOL.
Regarding speculative sentiment, DEX's protocol revenue, active users, and trading volume have all significantly declined, leading to a noticeable overall data recession, which remains cautious for the future market.
IV. Market outlook: Key levels and stabilization signals.
4.1 Technical aspect: Two major support levels and one 'gap'.
Short-term support: Near $110,000 (the lowest point this week, also the dense trading zone from late June to early July);
Strong support: $93,000 - $106,000 range (URPD data shows that over 2 million BTC chips have accumulated in this range, which is the 'cost zone' for medium to long-term capital);
Risk point: There is a URPD gap at $112,000 (i.e., chips are scarce at this price level; if it drops below $110,000, it may quickly rebound to $106,000).
4.2 Funding aspect: Three major stabilization signals.
Weekly stablecoin issuance returned to over $500 million;
Bitcoin ETF weekly inflows exceeded $1 billion;
Long-term holders' positions have stopped declining (indicating alleviated selling pressure).
4.3 Operational suggestions
Short term (1-2 weeks): Control positions below 30%, avoid blindly catching falling knives, wait for clear bottoming K-lines (such as increased volume bullish lines, or consecutive two days not hitting new lows);
Medium to long-term (1-3 months): If BTC forms a double bottom in the $93,000 - $106,000 range and the funding situation warms up, quality targets (like ETH, leading public chain tokens, and DeFi projects with strong performance certainty) can be gradually laid out;
Altcoins: Wait for BTC to stabilize, prioritizing coins with 'declines smaller than the market + sector logic not broken' (such as Layer 2, modular public chains, etc., in fields with actual progress).
The market adjustment this week is both a 'digestion' of the previous rise and the result of macroeconomic and funding factors. For investors, there is no need to panic too much (the long-term logic of core assets remains unchanged), but patience is required — in the crypto market, 'waiting for the right opportunity' is often more important than 'frequent operations'. We will continue to track funding indicators and technical patterns, updating strategies in a timely manner. (There are risks in the crypto space; the above analysis is based on market data and performance and does not constitute any investment advice.)
Data update note: The above report data is edited and organized by WolfDAO; if you have any questions, please contact us for updates.
Written by: WolfDAO (X: @10xWolfDAO)
