Binance Square
Four_iv
3.9k Posts

Four_iv

Square Verified
we are advertising and media industry that do promote cryptos and do provide marketing services Check us out on Twitter @X_Four_iv we do present daily new 💎
Level 1 Creator

Level 1 Creator
ETH Holder
ETH Holder
Frequent Trader
5 Years
34 Following
27.5K+ Followers
54.5K+ Liked
1 Badges
Posts
PINNED
·
--
BABY is down 92% from its April 2025 all-time high of $0.166 — but up over 70% from its March 2026 low. The technical picture All-time low: $0.0107 (March 2026) — this is the level that matters most Current range has seen sharp reflexive rallies on exchange-listing catalysts A sustained close back below the ATL would undermine the “bottoming” thesis entirely Invalidation is clear lose the March low with volume, and the recovery narrative breaks. Hold it, and the setup for continuation stays intact. Are exchange-listing pumps a sign of returning demand, or just short-term liquidity events that fade without follow-through? @babylonlabs_io #baby $BABY
BABY is down 92% from its April 2025 all-time high of $0.166 — but up over 70% from its March 2026 low.

The technical picture

All-time low: $0.0107 (March 2026) — this is the level that matters most

Current range has seen sharp reflexive rallies on exchange-listing catalysts

A sustained close back below the ATL would undermine the “bottoming” thesis entirely

Invalidation is clear

lose the March low with volume, and the recovery narrative breaks. Hold it, and the setup for continuation stays intact.

Are exchange-listing pumps a sign of returning demand, or just short-term liquidity events that fade without follow-through?

@BabylonLabs_io #baby $BABY
BITCOIN VOLUME: THE MARKET IS WAITING, NOT PANICKING Bitcoin’s recent price action looks weak on the surface. But the volume data tells a different story. Over the past 24 hours: • BTC futures volume dropped 59% • BTC spot volume dropped 61% • Price is only down around 0.07% This is a key distinction. When Bitcoin falls aggressively, we want to see heavy volume confirming sellers are in control. Right now, we are seeing the opposite. Price is moving lower, but participation is declining. That suggests the market is not experiencing a wave of forced selling. Instead, traders appear to be waiting for a catalyst before committing fresh capital. Looking at the volume history, the biggest spikes have come around major moves, while the current period has been much quieter. This tells us Bitcoin is currently in a consolidation phase rather than a clear breakdown. Our view: We think the lack of selling volume is actually constructive. A healthy market often needs periods where weaker hands leave and leverage resets before the next move begins. The key level we are watching is whether Bitcoin can reclaim stronger momentum with volume returning. A breakout without volume would likely be another short-term move. A breakout backed by increasing spot volume would be a much stronger signal that real demand has returned. For now, we remain patient. Bitcoin is not showing signs of panic selling. It is showing a market waiting for conviction.
BITCOIN VOLUME: THE MARKET IS WAITING, NOT PANICKING

Bitcoin’s recent price action looks weak on the surface.

But the volume data tells a different story.

Over the past 24 hours:

• BTC futures volume dropped 59%
• BTC spot volume dropped 61%
• Price is only down around 0.07%

This is a key distinction.

When Bitcoin falls aggressively, we want to see heavy volume confirming sellers are in control.

Right now, we are seeing the opposite.

Price is moving lower, but participation is declining.

That suggests the market is not experiencing a wave of forced selling.

Instead, traders appear to be waiting for a catalyst before committing fresh capital.

Looking at the volume history, the biggest spikes have come around major moves, while the current period has been much quieter.

This tells us Bitcoin is currently in a consolidation phase rather than a clear breakdown.

Our view:

We think the lack of selling volume is actually constructive.

A healthy market often needs periods where weaker hands leave and leverage resets before the next move begins.

The key level we are watching is whether Bitcoin can reclaim stronger momentum with volume returning.

A breakout without volume would likely be another short-term move.

A breakout backed by increasing spot volume would be a much stronger signal that real demand has returned.

For now, we remain patient.

Bitcoin is not showing signs of panic selling.

It is showing a market waiting for conviction.
Bitcoin Open Interest Update The latest Bitcoin open interest data gives us an important look into how leverage is positioned after the recent consolidation around the $64,000 area Current market positioning Total Bitcoin Open Interest $47.67B Open Interest BTC 745.09K BTC 24H Change: -0.61% Our interpretation: Over last 24 hours, BTC has remained range-bound, but open interest has fallen This tells us traders are reducing exposure instead of chasing move with excessive leverage This is generally a healthier market structure During strong trending moves, open interest often expands as traders pile into positions. However, when price consolidates and OI slowly declines, it usually means the market is flushing excess leverage and creating a cleaner foundation for the next move. Looking deeper into the exchanges: CME continues to lead with: 106.05K BTC in open interest +$1.49% over 24H This is important because CME represents more institutional positioning compared to retail-heavy exchanges The overall picture suggests that speculative leverage is being reduced while institutional positioning remains relatively stable Our view: This is exactly type of behaviour we want to see after Bitcoin failed to immediately break through the $65,700 resistance zone. Instead of seeing leverage continue to build and create a fragile market, we are seeing positions being cleaned out Combined with our previous updates Funding rates remain controlled Liquidation heatmaps show liquidity stacked around $65K-$66K above price ETF flows show institutional demand remains present Stablecoin liquidity remains elevated BTC.D remains strong The market is currently in a reset phase Right now, the market is doing the opposite Leverage is cooling The key levels remain: Resistance $65,700 reclaim $67,200 breakout level Support $64,000 key pivot $63,000 short-term support If $BTC can reclaim resistance while open interest begins expanding again, that would provide a much stronger signal that fresh capital is entering rather than simply leveraged speculation
Bitcoin Open Interest Update

The latest Bitcoin open interest data gives us an important look into how leverage is positioned after the recent consolidation around the $64,000 area

Current market positioning

Total Bitcoin Open Interest
$47.67B

Open Interest BTC
745.09K BTC

24H Change:
-0.61%

Our interpretation:

Over last 24 hours, BTC has remained range-bound, but open interest has fallen
This tells us traders are reducing exposure instead of chasing move with excessive leverage

This is generally a healthier market structure

During strong trending moves, open interest often expands as traders pile into positions. However, when price consolidates and OI slowly declines, it usually means the market is flushing excess leverage and creating a cleaner foundation for the next move.

Looking deeper into the exchanges:

CME continues to lead with:

106.05K BTC in open interest
+$1.49% over 24H

This is important because CME represents more institutional positioning compared to retail-heavy exchanges

The overall picture suggests that speculative leverage is being reduced while institutional positioning remains relatively stable

Our view:

This is exactly type of behaviour we want to see after Bitcoin failed to immediately break through the $65,700 resistance zone.

Instead of seeing leverage continue to build and create a fragile market, we are seeing positions being cleaned out

Combined with our previous updates

Funding rates remain controlled

Liquidation heatmaps show liquidity stacked around $65K-$66K above price

ETF flows show institutional demand remains present

Stablecoin liquidity remains elevated

BTC.D remains strong

The market is currently in a reset phase

Right now, the market is doing the opposite

Leverage is cooling

The key levels remain:

Resistance

$65,700 reclaim
$67,200 breakout level

Support

$64,000 key pivot
$63,000 short-term support

If $BTC can reclaim resistance while open interest begins expanding again, that would provide a much stronger signal that fresh capital is entering rather than simply leveraged speculation
Bitcoin Liquidation Heatmap Update Bitcoin continues to trade inside a tight range, but the liquidation heatmap shows where next major volatility event could come from Looking across12-hour, 48-hour and 1-week timeframes, the biggest concentration of liquidity remains stacked above price The main area of interest sits around: $65,000 - $66,000 This is where a large amount of short-side liquidity has accumulated. If Bitcoin can reclaim this region with momentum, we believe the market could see a short squeeze develop as leveraged positions are forced to close On the downside, liquidity is sitting around: $62,500 - $63,000 This area has acted as a short-term liquidity pocket and aligns closely with the key $64,000 pivot we highlighted in our previous technical update Our view: The current setup suggests Bitcoin is still in a compression phase Price has been unable to break higher, but we are also not seeing the type of aggressive liquidation cascade that would suggest a deeper market breakdown The important thing to understand with liquidation heatmaps is that liquidity often acts as a magnet Bitcoin does not necessarily move because liquidity exists, but large liquidity zones often become targets when volatility returns Right now, market appears positioned for a move towards liquidity above. However, confirmation is key. A clean reclaim of $65,700 would strengthen bullish case & open path towards larger resistance zone around $67,200 Failure to hold the $63,000-$64,000 area would shift attention back towards lower support levels Combining this with our previous updates: - Open interest has cooled rather than aggressively expanding - Funding rates remain controlled - ETF flows are showing institutional demand remains present - BTC dominance remains elevated Our current interpretation is that Bitcoin is building energy rather than breaking down The next major move is likely to come from a liquidity sweep The key question is whether BTC clears short liquidity above $65K, or whether leverage gets flushed lower first before next attempt higher
Bitcoin Liquidation Heatmap Update

Bitcoin continues to trade inside a tight range, but the liquidation heatmap shows where next major volatility event could come from

Looking across12-hour, 48-hour and 1-week timeframes, the biggest concentration of liquidity remains stacked above price

The main area of interest sits around:

$65,000 - $66,000

This is where a large amount of short-side liquidity has accumulated. If Bitcoin can reclaim this region with momentum, we believe the market could see a short squeeze develop as leveraged positions are forced to close

On the downside, liquidity is sitting around:

$62,500 - $63,000

This area has acted as a short-term liquidity pocket and aligns closely with the key $64,000 pivot we highlighted in our previous technical update

Our view:

The current setup suggests Bitcoin is still in a compression phase

Price has been unable to break higher, but we are also not seeing the type of aggressive liquidation cascade that would suggest a deeper market breakdown

The important thing to understand with liquidation heatmaps is that liquidity often acts as a magnet

Bitcoin does not necessarily move because liquidity exists, but large liquidity zones often become targets when volatility returns

Right now, market appears positioned for a move towards liquidity above.

However, confirmation is key.

A clean reclaim of $65,700 would strengthen bullish case & open path towards larger resistance zone around $67,200

Failure to hold the $63,000-$64,000 area would shift attention back towards lower support levels

Combining this with our previous updates:

- Open interest has cooled rather than aggressively expanding

- Funding rates remain controlled

- ETF flows are showing institutional demand remains present

- BTC dominance remains elevated

Our current interpretation is that Bitcoin is building energy rather than breaking down

The next major move is likely to come from a liquidity sweep

The key question is whether BTC clears short liquidity above $65K, or whether leverage gets flushed lower first before next attempt higher
BITCOIN 4H TECHNICAL UPDATE #bitcoin is currently trading inside a tight consolidation range, with the 4-hour Bollinger Bands showing volatility compressing after the recent rejection from the $67,200 resistance area. This type of structure usually does not last forever. The market is building pressure, and the next expansion move will likely determine Bitcoin’s short-term direction. From our perspective, the key levels remain: $63,000-$64,000 →immediate support zone $65,700 → first major reclaim level $67,200 → key resistance and breakout area The important observation is that Bitcoin has continued to defend the lower part of this range despite repeated attempts from sellers to push price lower. That tells us demand is still present, but buyers have not yet gained enough momentum to break higher. Our view: As long as Bitcoin remains above the $63,000 pivot, we believe the structure remains constructive and a move back towards $65,700-$67,200 is the most likely scenario. However, a clean loss of $63,000 would weaken the setup and open the door towards the lower support areas. Right now, Bitcoin is in a waiting phase. The next move out of this range is likely where the market reveals its true direction. We will be keeping a very close eye on this and updating you throughout the day.
BITCOIN 4H TECHNICAL UPDATE

#bitcoin is currently trading inside a tight consolidation range, with the 4-hour Bollinger Bands showing volatility compressing after the recent rejection from the $67,200 resistance area.

This type of structure usually does not last forever.

The market is building pressure, and the next expansion move will likely determine Bitcoin’s short-term direction.

From our perspective, the key levels remain:

$63,000-$64,000 →immediate support zone

$65,700 → first major reclaim level

$67,200 → key resistance and breakout area

The important observation is that Bitcoin has continued to defend the lower part of this range despite repeated attempts from sellers to push price lower.

That tells us demand is still present, but buyers have not yet gained enough momentum to break higher.

Our view:

As long as Bitcoin remains above the $63,000 pivot, we believe the structure remains constructive and a move back towards $65,700-$67,200 is the most likely scenario.

However, a clean loss of $63,000 would weaken the setup and open the door towards the lower support areas.

Right now, Bitcoin is in a waiting phase.

The next move out of this range is likely where the market reveals its true direction.

We will be keeping a very close eye on this and updating you throughout the day.
Bitcoin 4H Market Update Bitcoin is still trading inside the same range, but we think the market is becoming much more interesting than most people realise. Price has now defended the $64,000 pivot multiple times over the past week. Every dip into this area continues to attract buyers, even with negative ETF flows and weaker global equity markets. Here's what we're watching: • $64,000 remains the key pivot. As long as price holds above it, the current structure remains constructive. • $65,700 is still the first major resistance. Bulls need a clean break above this level before momentum can build. • A confirmed move through $65,700 opens the path towards the major resistance at $67,200. • If $64,000 fails, we'd expect price to rotate into the $61,000 region, with the major higher-timeframe demand zone still sitting between $59,000-$59,500. Our view: We don't think this looks like a market that's ready to break down. If sellers were truly in control, we'd expect $64,000 to have already failed after the amount of negative headlines we've seen over the past week. Instead, Bitcoin continues absorbing selling pressure and holding its structure. To us, that suggests this is still a consolidation phase rather than the start of a larger downtrend. The longer Bitcoin can defend $64,000 while resistance is repeatedly tested, the more pressure builds for a breakout higher. For now, nothing has changed. $64,000 remains the level we're watching most closely. Above it, we continue favouring patience over panic. A reclaim of $65,700 would be the first signal that the next leg higher may be starting. #bitcoin
Bitcoin 4H Market Update

Bitcoin is still trading inside the same range, but we think the market is becoming much more interesting than most people realise.

Price has now defended the $64,000 pivot multiple times over the past week. Every dip into this area continues to attract buyers, even with negative ETF flows and weaker global equity markets.

Here's what we're watching:

• $64,000 remains the key pivot. As long as price holds above it, the current structure remains constructive.

• $65,700 is still the first major resistance. Bulls need a clean break above this level before momentum can build.

• A confirmed move through $65,700 opens the path towards the major resistance at $67,200.

• If $64,000 fails, we'd expect price to rotate into the $61,000 region, with the major higher-timeframe demand zone still sitting between $59,000-$59,500.

Our view:

We don't think this looks like a market that's ready to break down.

If sellers were truly in control, we'd expect $64,000 to have already failed after the amount of negative headlines we've seen over the past week.

Instead, Bitcoin continues absorbing selling pressure and holding its structure.

To us, that suggests this is still a consolidation phase rather than the start of a larger downtrend.

The longer Bitcoin can defend $64,000 while resistance is repeatedly tested, the more pressure builds for a breakout higher.

For now, nothing has changed.

$64,000 remains the level we're watching most closely. Above it, we continue favouring patience over panic. A reclaim of $65,700 would be the first signal that the next leg higher may be starting.

#bitcoin
Article
Bitcoin Long-Term Holder SupplyBitcoin Long-Term Holder Supply Update The biggest takeaway from this data is not simply that long-term holders are holding. The important signal is what their supply behaviour tells us about market cycles, available liquidity, and where Bitcoin is positioned in the bigger picture. Over the last several years, long-term holder supply has continued to trend higher despite multiple periods of extreme volatility. This shows that a growing percentage of Bitcoin’s supply is moving into stronger hands and becoming less available for short-term speculation. Why does this matter? Bitcoin price is heavily influenced by available supply. When more BTC moves into long-term storage, the amount of liquid supply sitting on exchanges and available to sell decreases. This creates a tighter market structure where even moderate demand can have a larger impact on price. The key thing we are watching is the relationship between long-term holder supply and price. Historically, major Bitcoin tops have occurred when long-term holders begin distributing large amounts of supply back into the market. That distribution increases available supply and often signals that experienced holders are taking profit. Right now, we are not seeing the same level of aggressive supply release that has historically appeared around cycle peaks. Instead, the market is showing a different dynamic: • Long-term supply remains elevated. • Available Bitcoin supply remains constrained. • Institutional demand through ETFs continues to change the supply landscape. • The market is absorbing volatility without a major wave of long-term holder selling. Our view: This data suggests Bitcoin’s current structure is not showing the same characteristics of a traditional cycle top. The market appears to be transitioning from a retail-driven cycle into a more institutional market where supply dynamics matter more than ever. The next important signal to monitor is whether long-term holders begin reducing their supply while price accelerates higher. If that happens, it could indicate increased profit-taking. If supply continues to remain locked while demand increases, the supply squeeze narrative becomes stronger. For now, this remains one of the more constructive on-chain signals we are tracking. Bitcoin’s price tells us where the market is today. Long-term holder supply tells us what experienced investors are doing underneath the surface.

Bitcoin Long-Term Holder Supply

Bitcoin Long-Term Holder Supply Update
The biggest takeaway from this data is not simply that long-term holders are holding.
The important signal is what their supply behaviour tells us about market cycles, available liquidity, and where Bitcoin is positioned in the bigger picture.
Over the last several years, long-term holder supply has continued to trend higher despite multiple periods of extreme volatility.
This shows that a growing percentage of Bitcoin’s supply is moving into stronger hands and becoming less available for short-term speculation.
Why does this matter?
Bitcoin price is heavily influenced by available supply.
When more BTC moves into long-term storage, the amount of liquid supply sitting on exchanges and available to sell decreases.
This creates a tighter market structure where even moderate demand can have a larger impact on price.
The key thing we are watching is the relationship between long-term holder supply and price.
Historically, major Bitcoin tops have occurred when long-term holders begin distributing large amounts of supply back into the market.
That distribution increases available supply and often signals that experienced holders are taking profit.
Right now, we are not seeing the same level of aggressive supply release that has historically appeared around cycle peaks.
Instead, the market is showing a different dynamic:
• Long-term supply remains elevated.
• Available Bitcoin supply remains constrained.
• Institutional demand through ETFs continues to change the supply landscape.
• The market is absorbing volatility without a major wave of long-term holder selling.
Our view:
This data suggests Bitcoin’s current structure is not showing the same characteristics of a traditional cycle top.
The market appears to be transitioning from a retail-driven cycle into a more institutional market where supply dynamics matter more than ever.
The next important signal to monitor is whether long-term holders begin reducing their supply while price accelerates higher.
If that happens, it could indicate increased profit-taking.
If supply continues to remain locked while demand increases, the supply squeeze narrative becomes stronger.
For now, this remains one of the more constructive on-chain signals we are tracking.
Bitcoin’s price tells us where the market is today.
Long-term holder supply tells us what experienced investors are doing underneath the surface.
Article
BITCOIN DOMINANCEBITCOIN DOMINANCE UPDATE Bitcoin dominance is approaching a key decision point. BTC.D is currently trading around 59.2% after recovering from the sharp June sell-off that pushed dominance towards the 58% region. The key question: Is Bitcoin preparing for another move higher, or are we beginning to see capital rotate into altcoins? Current Market Structure Bitcoin dominance has managed to reclaim the 59% level and is now consolidating around this area. This level has become an important pivot: - Holding above 59% keeps Bitcoin dominance structure positive - Losing this level would suggest capital is beginning to flow into higher-risk assets The Bigger Picture: Over the past few months, BTC dominance made a strong move from around 58.5% to above 61% before experiencing a sharp rejection. The important takeaway is that despite the pullback, BTC.D has maintained its broader structure. The current range: Resistance: 60% - 61% Support:58% - 58.5% A breakout from this range will likely provide the next major signal for market rotation. What This Means For Crypto Rising Bitcoin dominance typically means capital is favouring Bitcoin over the wider market. This can happen when: - Investors prefer the liquidity and stability of BTC - The market is waiting for confirmation before moving further down the risk curve - Bitcoin leads before capital rotates into altcoins later At the moment, the market still appears Bitcoin-led. What We Are Watching Next: Bullish BTC Dominance Scenario: A clean move above 60% would suggest: - Bitcoin continues attracting the majority of crypto liquidity - Altcoins may continue underperforming in the short term - The market remains in a BTC accumulation/leadership phase Altcoin Rotation Scenario: A breakdown below 58.5% - 59% would be the first sign that capital is starting to move into altcoins. This would create a more favourable environment for: - Ethereum - Large-cap altcoins - Higher-beta crypto assets OUR VIEW Bitcoin dominance is currently showing that the market is still prioritising Bitcoin. We are not seeing confirmation of a broad altcoin rotation yet. The next major signal comes from whether BTC.D can reclaim the 60% area or loses the 59% support zone. Bitcoin dominance usually moves first. The rest of the market follows.

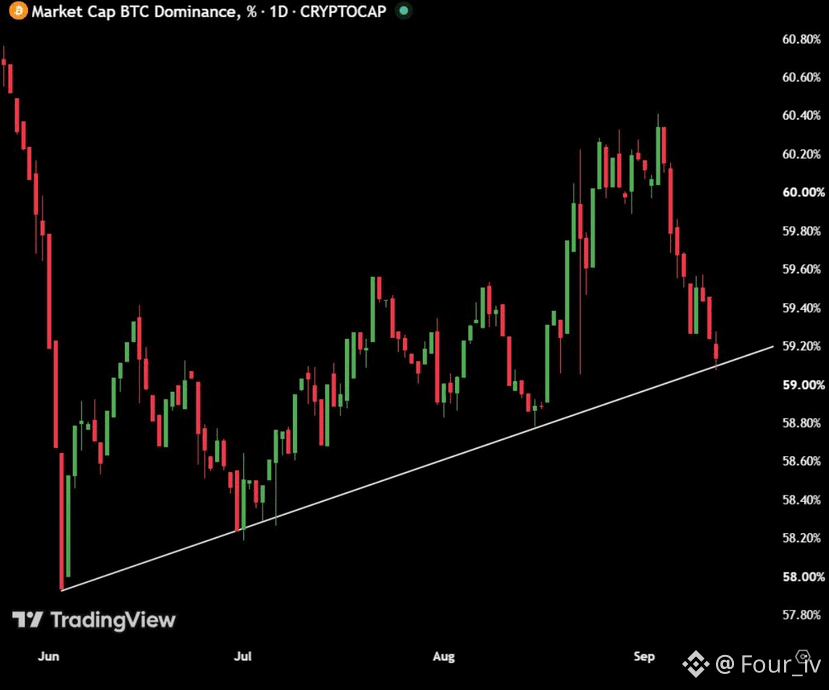
BITCOIN DOMINANCE

BITCOIN DOMINANCE UPDATE
Bitcoin dominance is approaching a key decision point.
BTC.D is currently trading around 59.2% after recovering from the sharp June sell-off that pushed dominance towards the 58% region.
The key question:
Is Bitcoin preparing for another move higher, or are we beginning to see capital rotate into altcoins?
Current Market Structure
Bitcoin dominance has managed to reclaim the 59% level and is now consolidating around this area.
This level has become an important pivot:
- Holding above 59% keeps Bitcoin dominance structure positive
- Losing this level would suggest capital is beginning to flow into higher-risk assets
The Bigger Picture:
Over the past few months, BTC dominance made a strong move from around 58.5% to above 61% before experiencing a sharp rejection.
The important takeaway is that despite the pullback, BTC.D has maintained its broader structure.
The current range:
Resistance: 60% - 61%
Support:58% - 58.5%
A breakout from this range will likely provide the next major signal for market rotation.
What This Means For Crypto
Rising Bitcoin dominance typically means capital is favouring Bitcoin over the wider market.
This can happen when:
- Investors prefer the liquidity and stability of BTC
- The market is waiting for confirmation before moving further down the risk curve
- Bitcoin leads before capital rotates into altcoins later
At the moment, the market still appears Bitcoin-led.
What We Are Watching Next:
Bullish BTC Dominance Scenario:
A clean move above 60% would suggest:
- Bitcoin continues attracting the majority of crypto liquidity
- Altcoins may continue underperforming in the short term
- The market remains in a BTC accumulation/leadership phase
Altcoin Rotation Scenario:
A breakdown below 58.5% - 59% would be the first sign that capital is starting to move into altcoins.
This would create a more favourable environment for:
- Ethereum
- Large-cap altcoins
- Higher-beta crypto assets
OUR VIEW
Bitcoin dominance is currently showing that the market is still prioritising Bitcoin.
We are not seeing confirmation of a broad altcoin rotation yet.
The next major signal comes from whether BTC.D can reclaim the 60% area or loses the 59% support zone.
Bitcoin dominance usually moves first.
The rest of the market follows.
While BABY’s price has been range bound and showing consistency there, @babylonlabs_io product surface has been expanding fast immensly and gainning attention Recent integrations most holders haven’t noticed but impact massively Aegis partnership, helped babylon grow patnership and gain audience booster Aave V4 proposal, native BTC as collateral without any involvement of third party Ledger integration, hardware wallet integration for Trustless Bitcoin Vaults Multi-staking (Phase 3), same staked BTC secure multiple networks at once, with stacking yield sources None of this is priced into a token still trading near its 4-month low and showing consistency Does expanding real-world assets DeFi utility eventually force a repricing, or does token demand stay decoupled from protocol usage indefinitely? Keep Rising Baby #baby $BABY
While BABY’s price has been range bound and showing consistency there, @BabylonLabs_io product surface has been expanding fast immensly and gainning attention

Recent integrations most holders haven’t noticed but impact massively

Aegis partnership, helped babylon grow patnership and gain audience booster

Aave V4 proposal, native BTC as collateral without any involvement of third party

Ledger integration, hardware wallet integration for Trustless Bitcoin Vaults

Multi-staking (Phase 3), same staked BTC secure multiple networks at once, with stacking yield sources

None of this is priced into a token still trading near its 4-month low and showing consistency

Does expanding real-world assets DeFi utility eventually force a repricing, or does token demand stay decoupled from protocol usage indefinitely?

Keep Rising Baby

#baby $BABY
Article
BITCOIN ETF FLOW UPDATEAfter analysing Bitcoin’s price structure, liquidity, leverage and derivatives positioning, the next piece of the puzzle is: Are institutions still accumulating Bitcoin, or are they stepping back? Spot Bitcoin ETFs give us one of the clearest insights into whether traditional finance is providing real demand behind this market. The latest data shows institutional demand has slowed in the short term. Recent ETF flows: * July 28: -779.96 BTC * July 27: -177.44 BTC * July 24: -3.69K BTC * July 23: -3.41K BTC After a strong period of accumulation, ETF demand has cooled, with BlackRock’s IBIT seeing the largest impact from recent selling pressure. However, the bigger picture remains important. Despite the recent slowdown, US Spot Bitcoin ETFs continue to hold a significant amount of Bitcoin exposure, with cumulative net flows remaining strongly positive since launch. The institutional story has not changed. The pace of buying has simply slowed. What does this mean for Bitcoin? This is where ETF flows connect with the rest of the market structure. Currently: Price: Bitcoin remains focused on holding key technical support levels. Liquidity: There is still liquidity sitting around important levels that could attract volatility. Leverage: Open interest and funding rates suggest traders are not excessively positioned, reducing the risk of a major liquidation event. ETF flows: Institutional demand has weakened, meaning one of Bitcoin’s strongest sources of buying pressure is currently taking a pause. The market is not showing signs of excessive speculation. The question is whether existing demand is strong enough to absorb selling pressure while ETF buyers wait on the sidelines. OUR VIEW: The ETF data tells us that Bitcoin’s next move will likely be driven by institutional participation. If ETF inflows return, it would confirm that larger investors are using current levels as an opportunity to increase exposure. If outflows continue, Bitcoin may need stronger spot demand from other market participants to maintain momentum. Right now, we are watching one key factor: Are institutions buying weakness again? Because if ETF demand returns while leverage remains controlled, that would create a much healthier environment for the next move higher. Key takeaway: The biggest risk for Bitcoin right now is not excessive leverage. It is a lack of institutional demand. ETF flows will be one of the most important indicators to watch over the coming sessions. A return to consistent inflows would strengthen the bullish case. Continued outflows would suggest Bitcoin may need more time to build support before the next major move. Our team will continue monitoring ETF flows, price action, liquidity and broader market positioning as the day develops. We’ll provide further updates if we see a meaningful shift in institutional demand or any changes that could impact Bitcoin’s next move.

BITCOIN ETF FLOW UPDATE

After analysing Bitcoin’s price structure, liquidity, leverage and derivatives positioning, the next piece of the puzzle is:
Are institutions still accumulating Bitcoin, or are they stepping back?
Spot Bitcoin ETFs give us one of the clearest insights into whether traditional finance is providing real demand behind this market.
The latest data shows institutional demand has slowed in the short term.
Recent ETF flows:
* July 28: -779.96 BTC
* July 27: -177.44 BTC
* July 24: -3.69K BTC
* July 23: -3.41K BTC
After a strong period of accumulation, ETF demand has cooled, with BlackRock’s IBIT seeing the largest impact from recent selling pressure.
However, the bigger picture remains important.
Despite the recent slowdown, US Spot Bitcoin ETFs continue to hold a significant amount of Bitcoin exposure, with cumulative net flows remaining strongly positive since launch.
The institutional story has not changed.
The pace of buying has simply slowed.
What does this mean for Bitcoin?
This is where ETF flows connect with the rest of the market structure.
Currently:
Price: Bitcoin remains focused on holding key technical support levels.
Liquidity: There is still liquidity sitting around important levels that could attract volatility.
Leverage: Open interest and funding rates suggest traders are not excessively positioned, reducing the risk of a major liquidation event.
ETF flows: Institutional demand has weakened, meaning one of Bitcoin’s strongest sources of buying pressure is currently taking a pause.
The market is not showing signs of excessive speculation.
The question is whether existing demand is strong enough to absorb selling pressure while ETF buyers wait on the sidelines.
OUR VIEW:
The ETF data tells us that Bitcoin’s next move will likely be driven by institutional participation.
If ETF inflows return, it would confirm that larger investors are using current levels as an opportunity to increase exposure.
If outflows continue, Bitcoin may need stronger spot demand from other market participants to maintain momentum.
Right now, we are watching one key factor:
Are institutions buying weakness again?
Because if ETF demand returns while leverage remains controlled, that would create a much healthier environment for the next move higher.
Key takeaway:
The biggest risk for Bitcoin right now is not excessive leverage. It is a lack of institutional demand.
ETF flows will be one of the most important indicators to watch over the coming sessions.
A return to consistent inflows would strengthen the bullish case.
Continued outflows would suggest Bitcoin may need more time to build support before the next major move.
Our team will continue monitoring ETF flows, price action, liquidity and broader market positioning as the day develops.
We’ll provide further updates if we see a meaningful shift in institutional demand or any changes that could impact Bitcoin’s next move.
BTC+0.92%
IBITETF+1.90%
🎙️ Crypto market行情 discussion; answering questions from newcomers ✅ adhere to community building 🦅 spread the free-thinking concept! maintain ecological balance!
avatar
End
03 h 16 m 26 s
10.9k
29
79
Article
BITCOIN LIQUIDATION HEATMAP UPDATEBitcoin is currently sitting around the $64,000 region, and the liquidation maps are showing a clear battle between liquidity above and below price. We analysed three timeframes: • 24-hour heatmap • 7-day heatmap • 1-month heatmap Here is what the data is telling us. Short-term (24H): Immediate liquidity The 24H heatmap shows Bitcoin currently consolidating around $64,000. The largest nearby liquidity clusters appear: Upside: • $64,500–$65,000 • $65,500–$66,000 Downside: • $63,000–$63,500 • $62,000–$62,500 The short-term picture suggests the market is trapped between two liquidity pools. Bitcoin is currently sitting closer to downside liquidity, meaning a sweep lower into the $63K area remains possible before any larger move. However, if buyers reclaim $65K, the liquidity above becomes the next magnet. Medium-term (7D): The important range The 7-day heatmap gives us a clearer picture. The strongest liquidity concentration is currently sitting above price: • $66,000–$67,000 This is important because liquidity often acts like a magnet. A move back above $65K could quickly open the path towards the $66K–$67K region where significant leverage is positioned. Below price, the main area to watch remains: • $62,500–$63,000 A loss of this region would expose lower liquidity. Higher timeframe (1M): The bigger picture The monthly heatmap shows the largest liquidity zones are still further away. Major upside liquidity: • $70,000–$75,000+ Major downside liquidity: • $50,000–$55,000 This tells us the bigger market is still positioned inside a much wider range. Bitcoin has not yet cleared either major monthly liquidity pocket. The market is currently deciding whether this is accumulation before another move higher, or the start of a deeper correction. OUR CURRENT VIEW: The data suggests Bitcoin is in a liquidity compression zone. The most likely short-term scenarios: Bullish scenario: Bitcoin reclaims $65,000. This would likely trigger momentum towards: $66,000 → $67,200 where a large amount of liquidity is sitting. Bearish scenario: Bitcoin loses $63,000. This opens the possibility of a move towards: $62,000 → potentially lower liquidity zones. The key level remains: $64,000 Bitcoin is currently sitting on a major decision point. Holding this level keeps the market balanced. Losing it increases the probability of a liquidity sweep lower. Reclaiming $65K shifts momentum back towards the upside. Our conclusion Right now, the heat map does not suggest blindly chasing either direction. The market is positioned between two liquidity magnets. Our focus: • Watch $65K for upside confirmation • Watch $63K for downside continuation • Watch open interest and funding alongside these levels to confirm whether moves are genuine or leverage-driven Liquidity will likely decide Bitcoin’s next major move. We will be keeping a close eye and updatimng you accordingly.

BITCOIN LIQUIDATION HEATMAP UPDATE

Bitcoin is currently sitting around the $64,000 region, and the liquidation maps are showing a clear battle between liquidity above and below price.
We analysed three timeframes:
• 24-hour heatmap
• 7-day heatmap
• 1-month heatmap
Here is what the data is telling us.
Short-term (24H): Immediate liquidity
The 24H heatmap shows Bitcoin currently consolidating around $64,000.
The largest nearby liquidity clusters appear:
Upside:
• $64,500–$65,000
• $65,500–$66,000
Downside:
• $63,000–$63,500
• $62,000–$62,500
The short-term picture suggests the market is trapped between two liquidity pools.
Bitcoin is currently sitting closer to downside liquidity, meaning a sweep lower into the $63K area remains possible before any larger move.
However, if buyers reclaim $65K, the liquidity above becomes the next magnet.
Medium-term (7D): The important range
The 7-day heatmap gives us a clearer picture.
The strongest liquidity concentration is currently sitting above price:
• $66,000–$67,000
This is important because liquidity often acts like a magnet.
A move back above $65K could quickly open the path towards the $66K–$67K region where significant leverage is positioned.
Below price, the main area to watch remains:
• $62,500–$63,000
A loss of this region would expose lower liquidity.
Higher timeframe (1M): The bigger picture
The monthly heatmap shows the largest liquidity zones are still further away.
Major upside liquidity:
• $70,000–$75,000+
Major downside liquidity:
• $50,000–$55,000
This tells us the bigger market is still positioned inside a much wider range.
Bitcoin has not yet cleared either major monthly liquidity pocket.
The market is currently deciding whether this is accumulation before another move higher, or the start of a deeper correction.
OUR CURRENT VIEW:
The data suggests Bitcoin is in a liquidity compression zone.
The most likely short-term scenarios:
Bullish scenario:
Bitcoin reclaims $65,000.
This would likely trigger momentum towards:
$66,000 → $67,200
where a large amount of liquidity is sitting.
Bearish scenario:
Bitcoin loses $63,000.
This opens the possibility of a move towards:
$62,000 → potentially lower liquidity zones.
The key level remains: $64,000
Bitcoin is currently sitting on a major decision point.
Holding this level keeps the market balanced.
Losing it increases the probability of a liquidity sweep lower.
Reclaiming $65K shifts momentum back towards the upside.
Our conclusion
Right now, the heat map does not suggest blindly chasing either direction.
The market is positioned between two liquidity magnets.
Our focus:
• Watch $65K for upside confirmation
• Watch $63K for downside continuation
• Watch open interest and funding alongside these levels to confirm whether moves are genuine or leverage-driven
Liquidity will likely decide Bitcoin’s next major move.
We will be keeping a close eye and updatimng you accordingly.
BITCOIN FUNDING RATES UPDATE Bitcoin funding rates remain calm across major exchanges. Looking across Top exchanges and others: • BTC funding remains slightly positive • No extreme long leverage has built up • No aggressive short positioning is visible This tells us one important thing: The market is not currently overcrowded. When funding becomes heavily positive, it usually means traders are paying a premium to stay long, increasing the risk of a leverage flush. When funding turns heavily negative, it often shows traders are positioned for downside. Right now, we are seeing neither. Our view: Bitcoin is currently being driven more by spot demand, liquidity and macro conditions rather than excessive derivatives positioning. This is a healthier market structure. If BTC pushes higher from here, a neutral funding environment would suggest the move is happening without traders aggressively chasing leverage. The key levels remain: • $64,000 support/pivot • $65,700 resistance • Break above resistance with funding remaining controlled would be a strong confirmation For now, derivatives are not showing overheating. The market is waiting for a catalyst. We are watching this closely. 👀
BITCOIN FUNDING RATES UPDATE

Bitcoin funding rates remain calm across major exchanges.

Looking across Top exchanges and others:

• BTC funding remains slightly positive
• No extreme long leverage has built up
• No aggressive short positioning is visible

This tells us one important thing:

The market is not currently overcrowded.

When funding becomes heavily positive, it usually means traders are paying a premium to stay long, increasing the risk of a leverage flush.

When funding turns heavily negative, it often shows traders are positioned for downside.

Right now, we are seeing neither.

Our view:

Bitcoin is currently being driven more by spot demand, liquidity and macro conditions rather than excessive derivatives positioning.

This is a healthier market structure.

If BTC pushes higher from here, a neutral funding environment would suggest the move is happening without traders aggressively chasing leverage.

The key levels remain:

• $64,000 support/pivot
• $65,700 resistance
• Break above resistance with funding remaining controlled would be a strong confirmation

For now, derivatives are not showing overheating.

The market is waiting for a catalyst.

We are watching this closely. 👀
BITCOIN 4H UPDATE Bitcoin is currently sitting at a critical decision point. Price has returned to the $64,000 key pivot after rejecting from the $65,700 resistance zone, and this level is now deciding the next short-term move. Here is what we are watching: $64,000 is the battleground Bitcoin has repeatedly reacted around this area over the past few weeks. Holding above $64,000 keeps the current range structure intact and gives bulls a chance to push back towards: • $65,700 resistance • $67,200 major resistance A clean reclaim of $65,700 would be the first sign that buyers are regaining control. However, losing $64,000 would weaken the structure and open the door towards: • $63,000 support • $61,000 low-range support • $59,000–$59,500 major support OUR VIEW: Right now, Bitcoin is in a neutral-to-cautious zone. The market has not broken down, but buyers have also failed to reclaim higher levels. The recent rejection from $65,700 shows there is still significant selling pressure above the market, while the reaction around $64,000 shows buyers are still defending this area. The key question is whether Bitcoin can build a higher low here. If $BTC holds $64,000 and reclaims $65,700, momentum can quickly shift back towards the upside. If $64,000 fails, we believe the market is likely to search for lower liquidity before finding stronger demand. For now, we are treating $64,000 as the line that determines whether Bitcoin continues consolidating or starts another move lower. The next few 4H candles will be important. OUR FOCUS If $64,000 holds a potential move back towards $65,700 is on the cards. If $64,000 breaks keep a close eye on $63,000 and below. Bitcoin is currently not showing a confirmed breakdown, but it is also not showing a confirmed recovery. The reaction at this level will likely define the next move. #bitcoin
BITCOIN 4H UPDATE

Bitcoin is currently sitting at a critical decision point.

Price has returned to the $64,000 key pivot after rejecting from the $65,700 resistance zone, and this level is now deciding the next short-term move.

Here is what we are watching:

$64,000 is the battleground

Bitcoin has repeatedly reacted around this area over the past few weeks.

Holding above $64,000 keeps the current range structure intact and gives bulls a chance to push back towards:

• $65,700 resistance
• $67,200 major resistance

A clean reclaim of $65,700 would be the first sign that buyers are regaining control.

However, losing $64,000 would weaken the structure and open the door towards:

• $63,000 support
• $61,000 low-range support
• $59,000–$59,500 major support

OUR VIEW:

Right now, Bitcoin is in a neutral-to-cautious zone.

The market has not broken down, but buyers have also failed to reclaim higher levels.

The recent rejection from $65,700 shows there is still significant selling pressure above the market, while the reaction around $64,000 shows buyers are still defending this area.

The key question is whether Bitcoin can build a higher low here.

If $BTC holds $64,000 and reclaims $65,700, momentum can quickly shift back towards the upside.

If $64,000 fails, we believe the market is likely to search for lower liquidity before finding stronger demand.

For now, we are treating $64,000 as the line that determines whether Bitcoin continues consolidating or starts another move lower.

The next few 4H candles will be important.

OUR FOCUS

If $64,000 holds a potential move back towards $65,700 is on the cards.

If $64,000 breaks keep a close eye on $63,000 and below.

Bitcoin is currently not showing a confirmed breakdown, but it is also not showing a confirmed recovery.

The reaction at this level will likely define the next move.

#bitcoin
🎙️ LEARNING and EARNING TOGETEHER
cover
End
03 h 44 m 58 s
2.8k
6
2
What is Inflation (CPI)? Inflation measures how much the prices of everyday goods and services increase over time. Imagine your favorite burger costs $5 today. Next year, it costs $6. That's inflation. The Consumer Price Index (CPI) helps measure inflation and is one of the most important reports watched by traders. High inflation can affect Gold, the US Dollar, stocks, and many other markets. #cpi #Inflation
What is Inflation (CPI)?

Inflation measures how much the prices of everyday goods and services increase over time.

Imagine your favorite burger costs $5 today.

Next year, it costs $6.

That's inflation.

The Consumer Price Index (CPI) helps measure inflation and is one of the most important reports watched by traders.

High inflation can affect Gold, the US Dollar, stocks, and many other markets.

#cpi #Inflation
🎙️ Building Plaza, Holding BNB🎉🎉🚀🚀
avatar
End
04 h 12 m 05 s
4k
12
16
🎙️ Maintain Ecological Balance and Build the Binance Plaza
avatar
End
04 h 54 m 23 s
10.5k
26
85
🎙️ Build a BNB position in batches
avatar
End
02 h 18 m 04 s
13.3k
22
22
Article
BITCOIN EXCHANGE NETFLOW UPDATEBitcoin Supply Is Not Showing Signs Of Panic Selling After analysing Bitcoin’s price structure, liquidation heatmaps, open interest, funding rates, and ETF flows, the next important question is: Are holders preparing to sell, or is Bitcoin supply being removed from the market? Exchange netflows help answer that. The latest data shows something important: Bitcoin is not experiencing a significant wave of coins moving onto exchanges. Why Exchange Flows Matter Exchanges are where Bitcoin can quickly become available for trading. When more BTC moves onto exchanges: • More supply becomes available • Potential selling pressure increases • Market participants may be preparing to reduce exposure When BTC leaves exchanges: • Available liquid supply decreases • Holders are often moving coins into long-term storage • Selling pressure can reduce The key observation right now: Despite Bitcoin’s recent weakness, we are not seeing a major increase in exchange inflows. What The Data Is Telling Us Looking back historically, major market sell-offs are often accompanied by a noticeable increase in BTC being deposited onto exchanges. That usually signals investors are preparing to sell. However, the current structure looks different. Bitcoin has experienced: • A price pullback • A reduction in leverage • Lower speculative positioning • Controlled funding rates • No major spike in exchange inflows This suggests the recent move lower has been more about positioning being reset rather than investors aggressively exiting. Our Interpretation The most important takeaway: Bitcoin is falling, but holders are not rushing to put coins back onto exchanges. That is a meaningful difference. A weaker market structure would look like: Price falling while exchange inflows accelerate. That would suggest investors are using exchanges to sell into weakness. Instead, we are seeing a market that appears to be digesting the recent move. Combining This With Our Previous Updates When we combine the data: Liquidation Heatmaps • Downside liquidity around the recent lows has already been targeted. Open Interest • Leverage has been reduced during the decline. Funding Rates • Traders are not heavily positioned in one direction. ETF Flows • Institutional demand has slowed, but we have not seen a complete breakdown. Exchange Netflows • Supply is not aggressively returning to exchanges. The Bigger Picture The market is cooling down, not showing signs of a full distribution event. What We Are Watching Next For Bitcoin to confirm a stronger recovery, we want to see: • Price reclaim key resistance levels • Open interest increase alongside price • Exchange reserves continue declining • ETF demand return That would indicate real demand is coming back into the market. The warning sign would be: • Bitcoin losing support • Exchange inflows increasing • Sellers becoming more aggressive Our Current View: Exchange data is currently not showing a major warning signal. The market appears to be going through a reset phase after excessive leverage built up. The next important question is: Are buyers going to step in now that weaker positions have been removed? That will determine Bitcoin’s next major move. Key Levels Resistance: • $64,000 • $65,700 Support: • $63,000 • $61,000 For now, the data suggests Bitcoin is stabilising rather than entering a supply-driven sell-off.

BITCOIN EXCHANGE NETFLOW UPDATE

Bitcoin Supply Is Not Showing Signs Of Panic Selling
After analysing Bitcoin’s price structure, liquidation heatmaps, open interest, funding rates, and ETF flows, the next important question is:
Are holders preparing to sell, or is Bitcoin supply being removed from the market?
Exchange netflows help answer that.
The latest data shows something important:
Bitcoin is not experiencing a significant wave of coins moving onto exchanges.
Why Exchange Flows Matter
Exchanges are where Bitcoin can quickly become available for trading.
When more BTC moves onto exchanges:
• More supply becomes available
• Potential selling pressure increases
• Market participants may be preparing to reduce exposure
When BTC leaves exchanges:
• Available liquid supply decreases
• Holders are often moving coins into long-term storage
• Selling pressure can reduce
The key observation right now:
Despite Bitcoin’s recent weakness, we are not seeing a major increase in exchange inflows.
What The Data Is Telling Us
Looking back historically, major market sell-offs are often accompanied by a noticeable increase in BTC being deposited onto exchanges.
That usually signals investors are preparing to sell.
However, the current structure looks different.
Bitcoin has experienced:
• A price pullback
• A reduction in leverage
• Lower speculative positioning
• Controlled funding rates
• No major spike in exchange inflows
This suggests the recent move lower has been more about positioning being reset rather than investors aggressively exiting.
Our Interpretation
The most important takeaway:
Bitcoin is falling, but holders are not rushing to put coins back onto exchanges.
That is a meaningful difference.
A weaker market structure would look like:
Price falling while exchange inflows accelerate.
That would suggest investors are using exchanges to sell into weakness.
Instead, we are seeing a market that appears to be digesting the recent move.
Combining This With Our Previous Updates
When we combine the data:
Liquidation Heatmaps
• Downside liquidity around the recent lows has already been targeted.
Open Interest
• Leverage has been reduced during the decline.
Funding Rates
• Traders are not heavily positioned in one direction.
ETF Flows
• Institutional demand has slowed, but we have not seen a complete breakdown.
Exchange Netflows
• Supply is not aggressively returning to exchanges.
The Bigger Picture
The market is cooling down, not showing signs of a full distribution event.
What We Are Watching Next
For Bitcoin to confirm a stronger recovery, we want to see:
• Price reclaim key resistance levels
• Open interest increase alongside price
• Exchange reserves continue declining
• ETF demand return
That would indicate real demand is coming back into the market.
The warning sign would be:
• Bitcoin losing support
• Exchange inflows increasing
• Sellers becoming more aggressive
Our Current View:
Exchange data is currently not showing a major warning signal.
The market appears to be going through a reset phase after excessive leverage built up.
The next important question is:
Are buyers going to step in now that weaker positions have been removed?
That will determine Bitcoin’s next major move.
Key Levels
Resistance:
• $64,000
• $65,700
Support:
• $63,000
• $61,000
For now, the data suggests Bitcoin is stabilising rather than entering a supply-driven sell-off.
Log in to explore more content
Join global crypto users on Binance Square
⚡️ Get latest and useful information about crypto.
💬 Trusted by the world’s largest crypto exchange.
👍 Discover real insights from verified creators.
Email / Phone number
Sitemap
Cookie Preferences
Platform T&Cs