Bitcoin is attempting a counter‑trend breakout from the intraday descending channels, but higher‑timeframe trend is still down; confirmation requires RSI range‑shift above 50–60 and a clean break‑and‑retest over the upper channel and EMA band on 1h/4h.
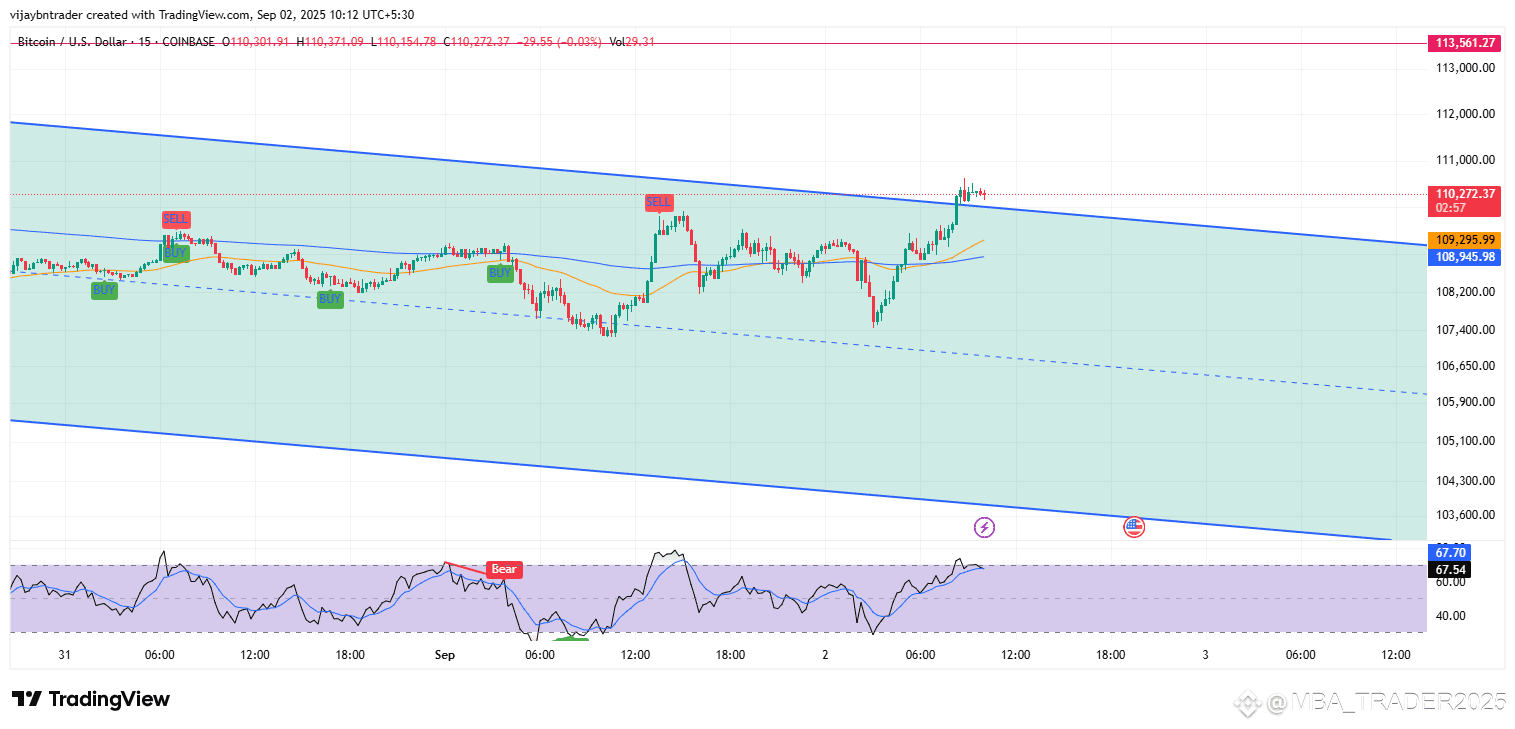
15‑minute
Price has pushed through the upper boundary of the short‑term descending channel, a spot that often triggers a breakout attempt; these moves commonly retest the broken trendline before continuation.
RSI is above 60–70, which signals strong short‑term momentum and a possible range‑shift versus the prior bearish regime that capped around 50–60.
Intraday plan: Favor continuation only if a retest of the breached channel top holds and RSI sustains above the midline; failure back under the trendline with RSI losing 50 increases the odds of a bull‑trap.
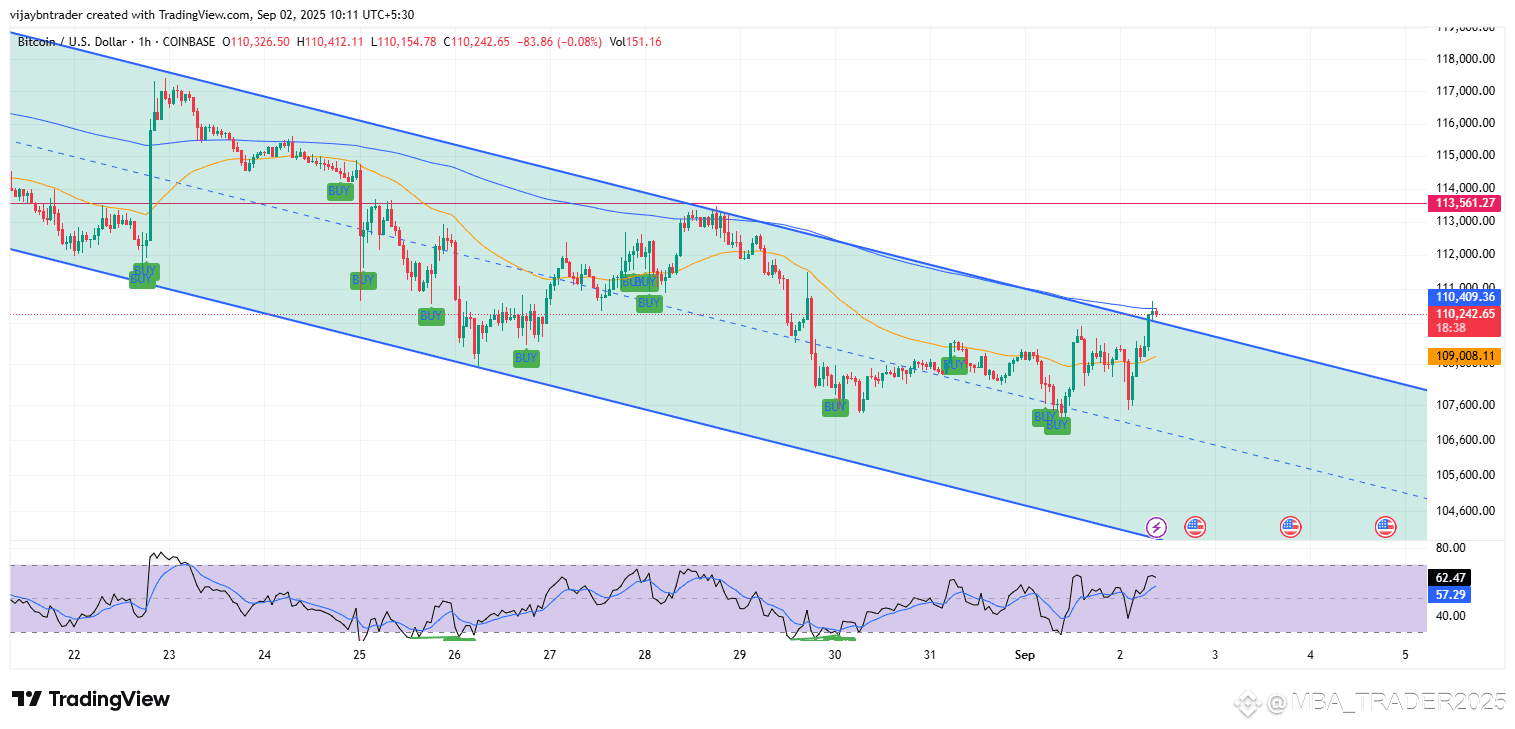
1‑hour
Price is tagging the upper rail of the larger 1h descending channel after a sharp rally; channels often reject initial tests unless the break is confirmed by closes above and a successful retest.
RSI has moved into the high‑50s/60s, indicating improving momentum and the first sign of a potential range‑shift from bearish (10–60) toward neutral‑bullish (>50).
What confirms: A 1h close and retest above the channel plus holding above the 50‑EMA would bolster a push toward the 200‑EMA; rejection at the rail while RSI rolls back under 50 argues for another swing to the channel midline/lows.
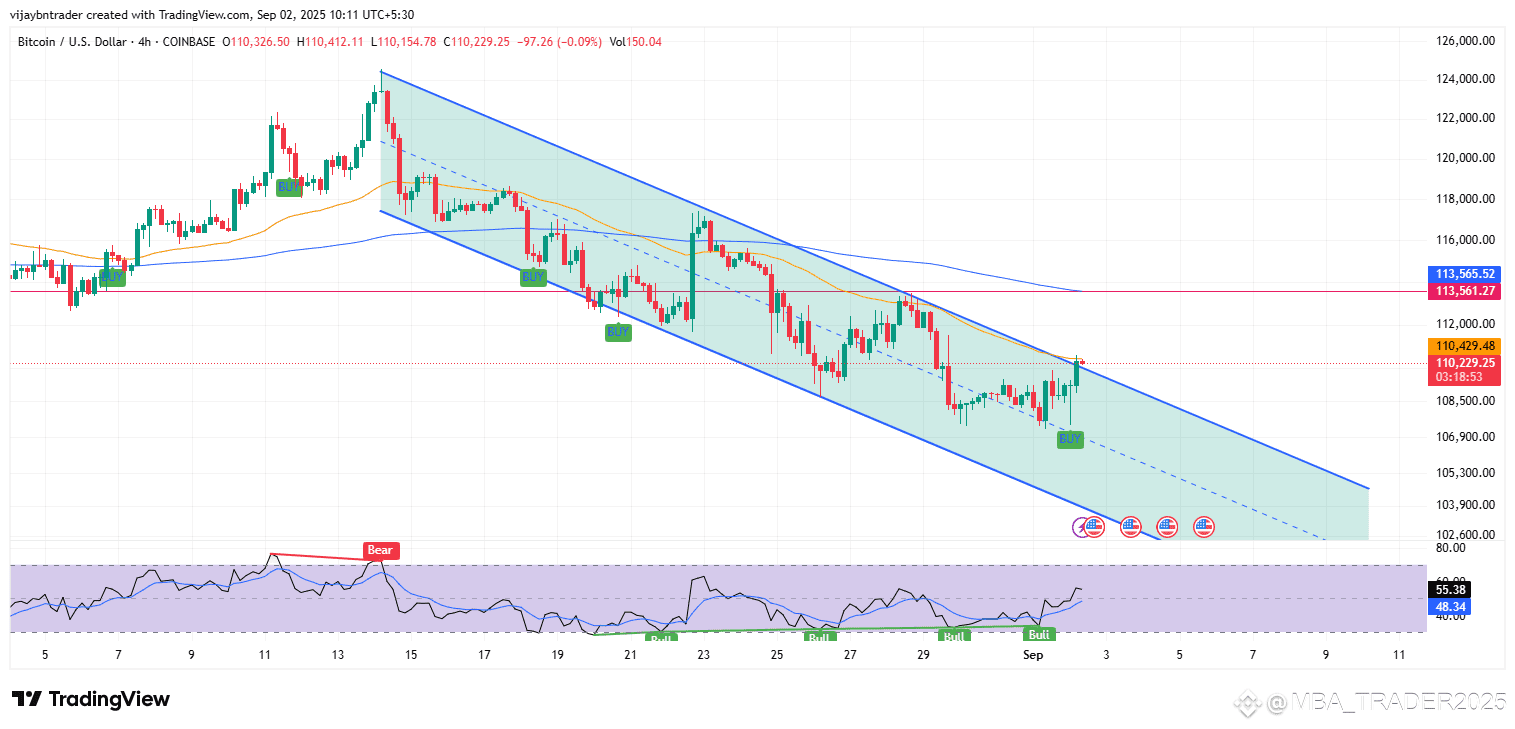
4‑hour
Trend remains within a well‑defined descending channel under a falling EMA cluster, so the higher‑timeframe bias is still bearish until the upper rail and 50‑EMA are reclaimed on closing basis.
RSI has lifted toward 50–55, which is the decision zone; in downtrends, 50–60 often acts as resistance unless a sustained range‑shift occurs.
Confirmation to flip swing bias: Break and retest above the 4h channel top and 50‑EMA with RSI holding above 50–60; without this, treat the current bounce as a rally within a downtrend.
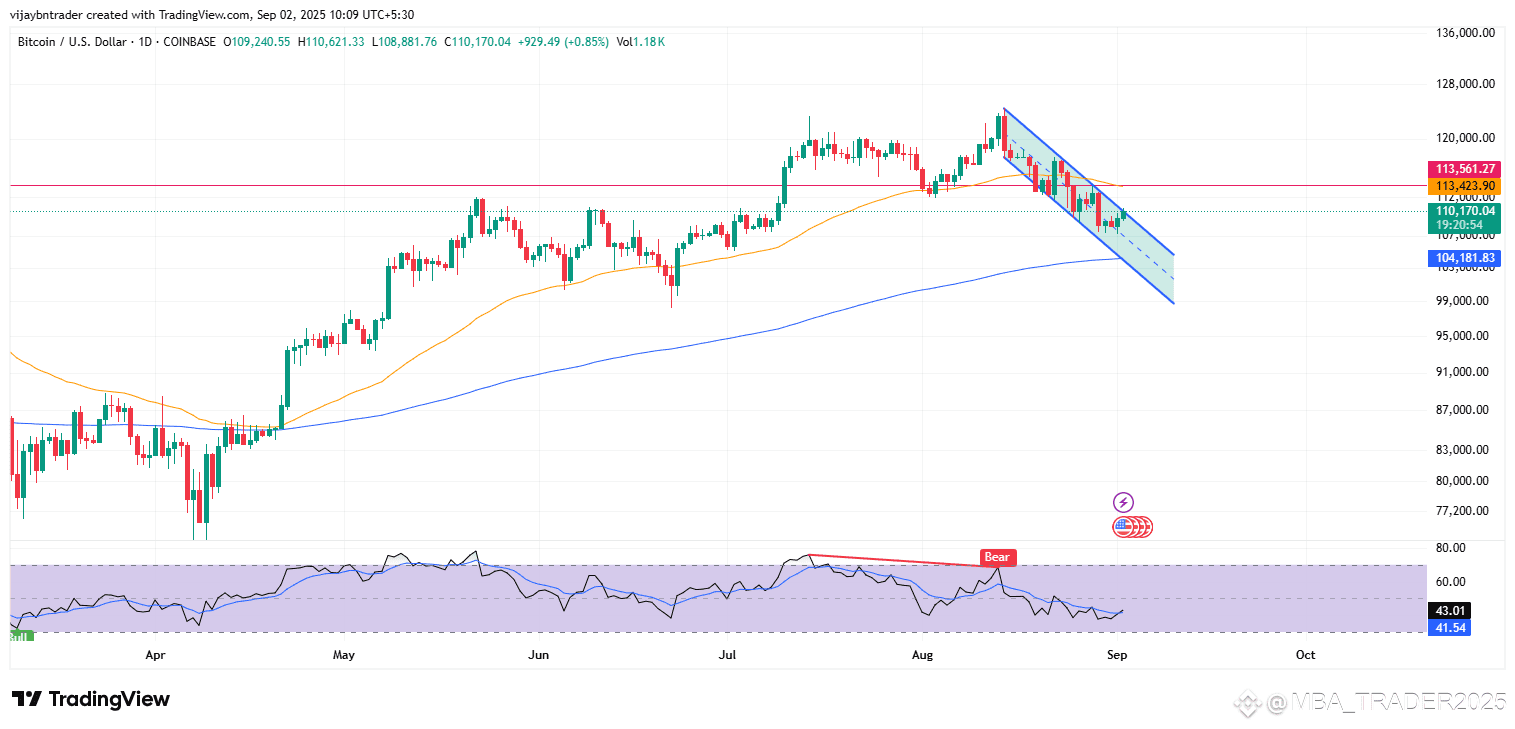
Daily context
The daily chart still shows a recent slide with RSI in the low‑40s; by textbook behavior, daily RSI must reclaim the 50 centerline to indicate a momentum shift back toward bullish conditions.
Price is below the 50‑day EMA, so rallies can meet dynamic resistance until that average is retaken; only sustained closes back above the 50‑EMA would argue for a more durable recovery.
Trade implications
Bullish path: Wait for break‑and‑retest above the 1h/4h channel tops and 50‑EMA with RSI holding >50–60, then target the 200‑EMA or prior swing supply; this follows standard breakout validation.
Bearish path: If price fails at the channel rail and RSI slips back under 50, fade into the EMA/rail rejection and target the channel midline/lower‑bound while trend remains intact.
#MarketPullback #BTCPrediction