BTC is range‑bound intraday and still capped by a broader descending channel on 1h/4h; momentum is neutralizing after a bounce, so a sustained move likely hinges on RSI holding above the 50 midline and a clean break‑and‑retest over the channel top and EMA band.
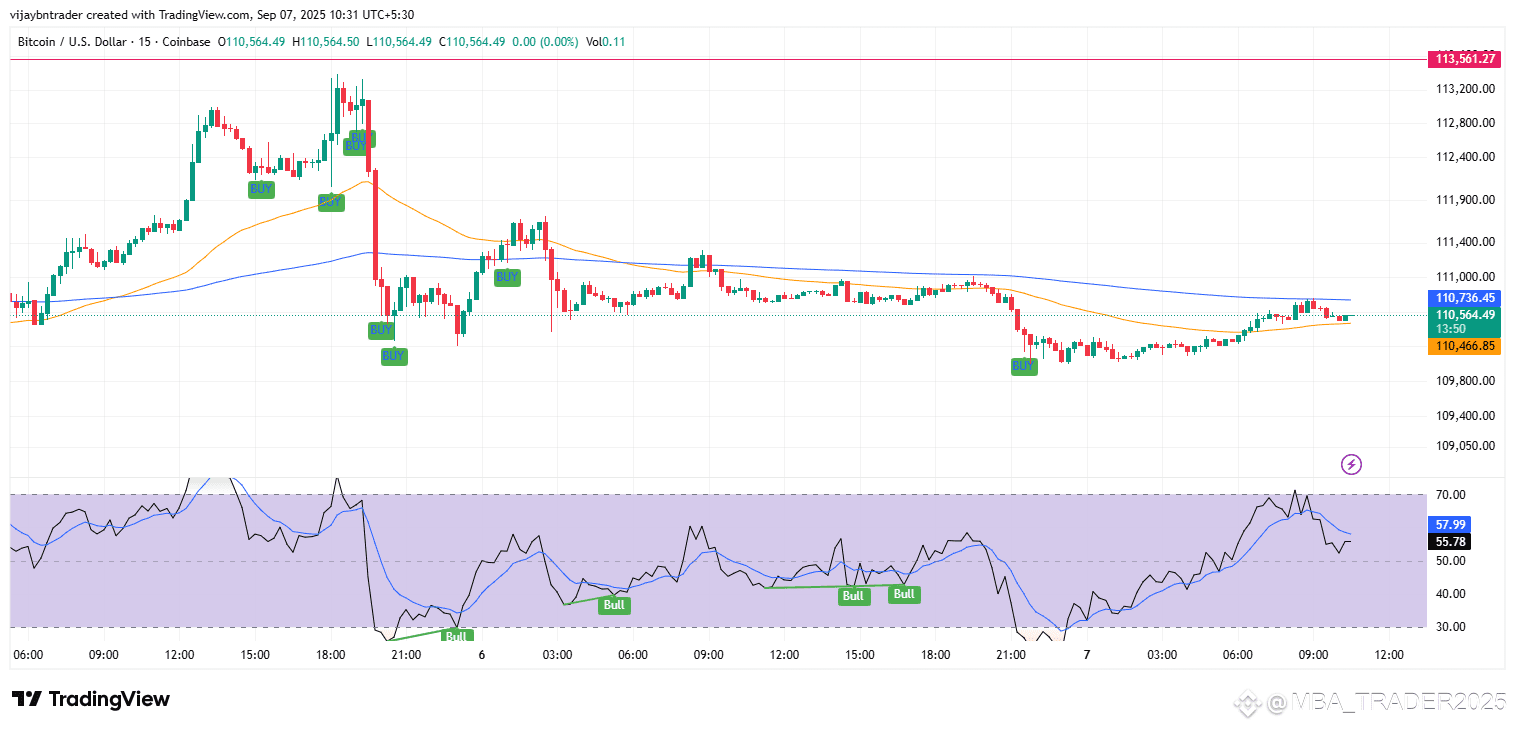
15‑minute
Momentum: RSI cooled from the 60s and is hovering near the 50 line; the midline is a practical momentum divider where holds above 50 support continuation, while slips below 50 often precede pullbacks.
Structure: Price is riding around the 20/50‑EMA cluster; EMAs frequently act as dynamic support/resistance, so losing this cluster would weaken the short‑term up‑impulse.
Tactic: For continuation, look for a minor pullback that holds EMAs and see RSI re‑establish >50–60; otherwise, expect mean reversion back toward intraday supports.
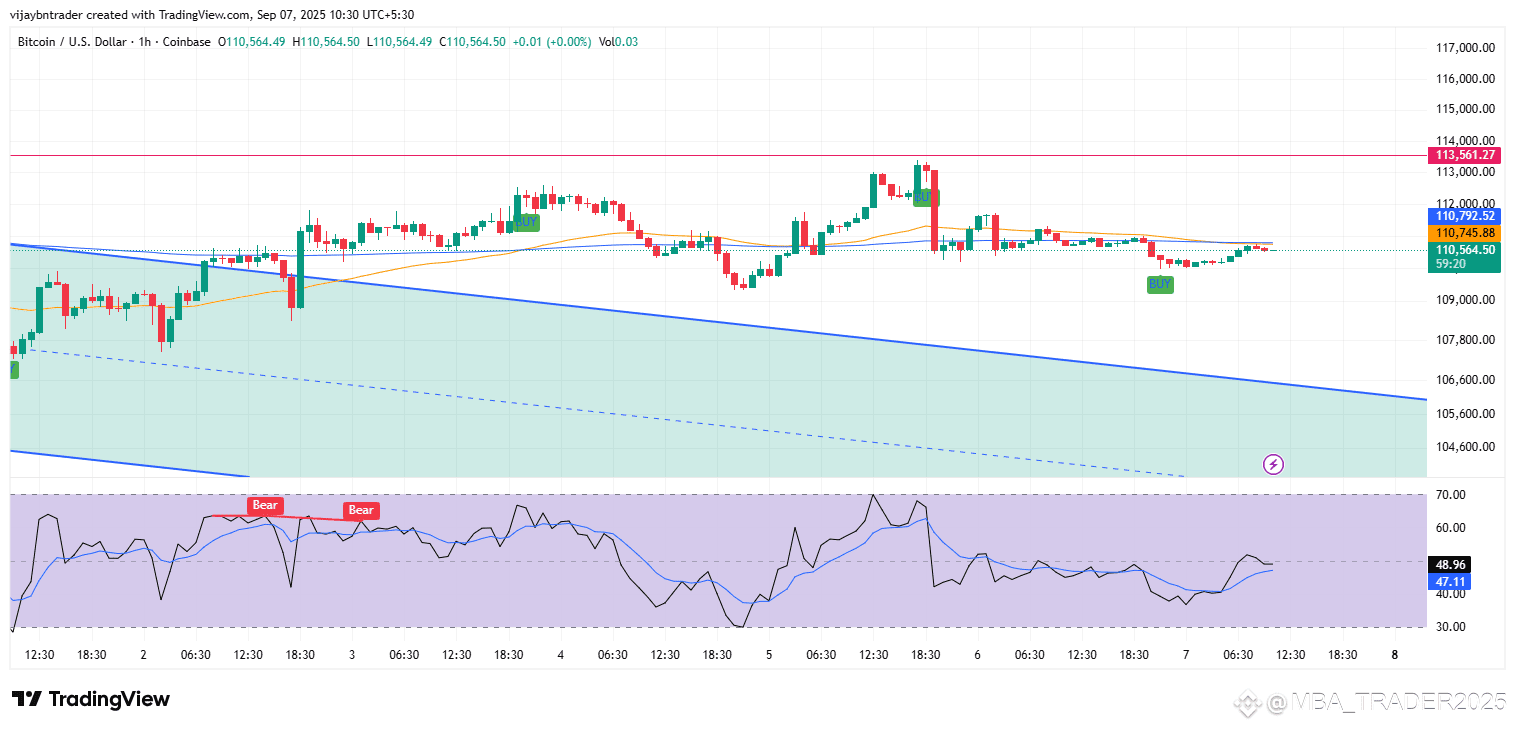
1‑hour
Context: Price is consolidating inside the upper half of a larger descending channel; channel regimes typically flip only after a close above the upper rail followed by a successful retest.
RSI: Printing around 47–50 after failing near 60, indicating no confirmed range‑shift yet; midline cross/hold is often used to validate direction.
Trigger: Confirmation is a break‑and‑retest above the channel top while holding above the 50‑EMA; failure there argues for rotation back to the channel median.
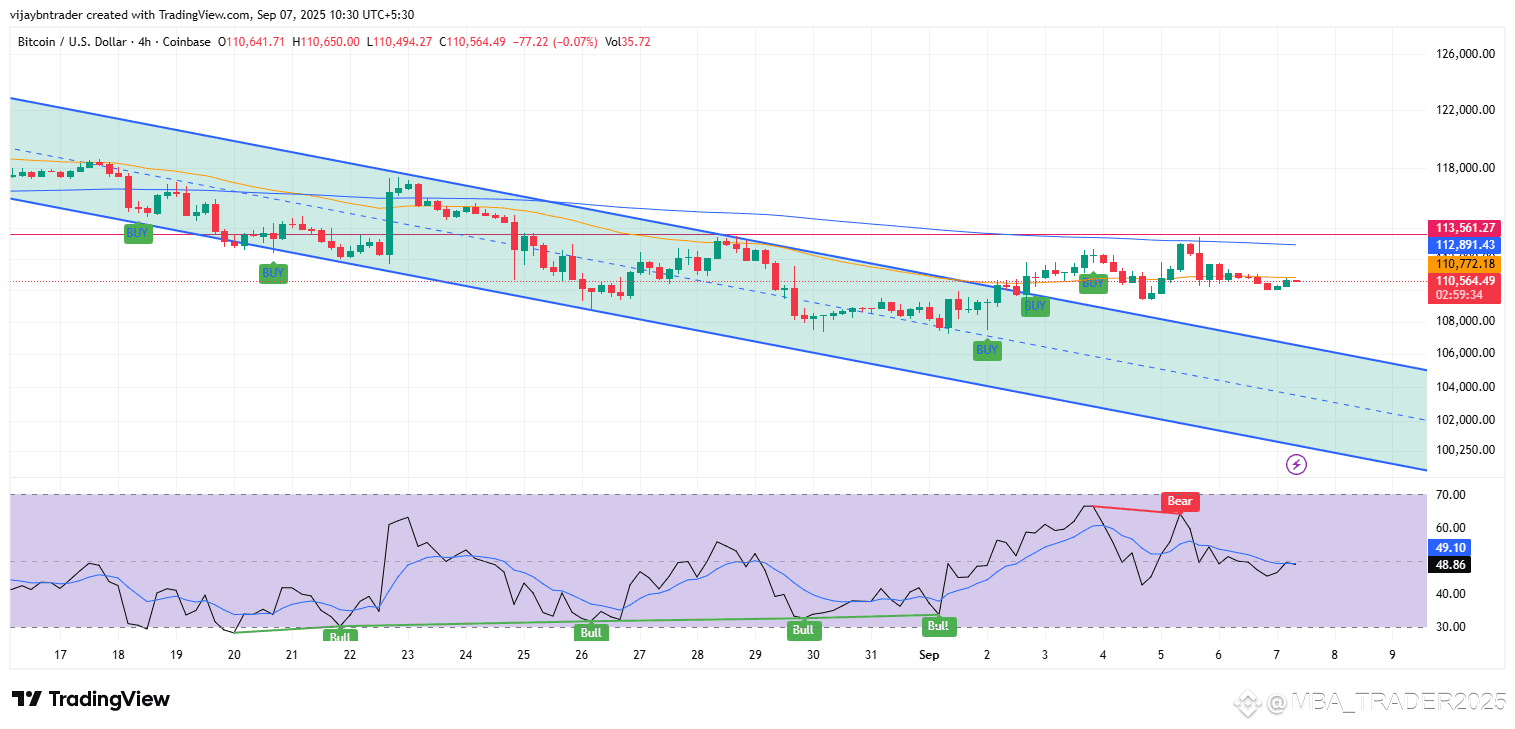
4‑hour
Trend: The 4h down‑channel remains intact and price is capped near the upper rail with the EMA band overhead, a common rejection zone unless decisively reclaimed.
RSI: Rolling near low‑50s after a prior bearish divergence, signaling momentum is fragile; sustained closes with RSI >50–60 would indicate a healthier shift.
Plan: Seek a clear breakout and retest above the channel plus 50‑EMA to open room toward the 200‑EMA; absent that, base‑case is chop to the channel midline.
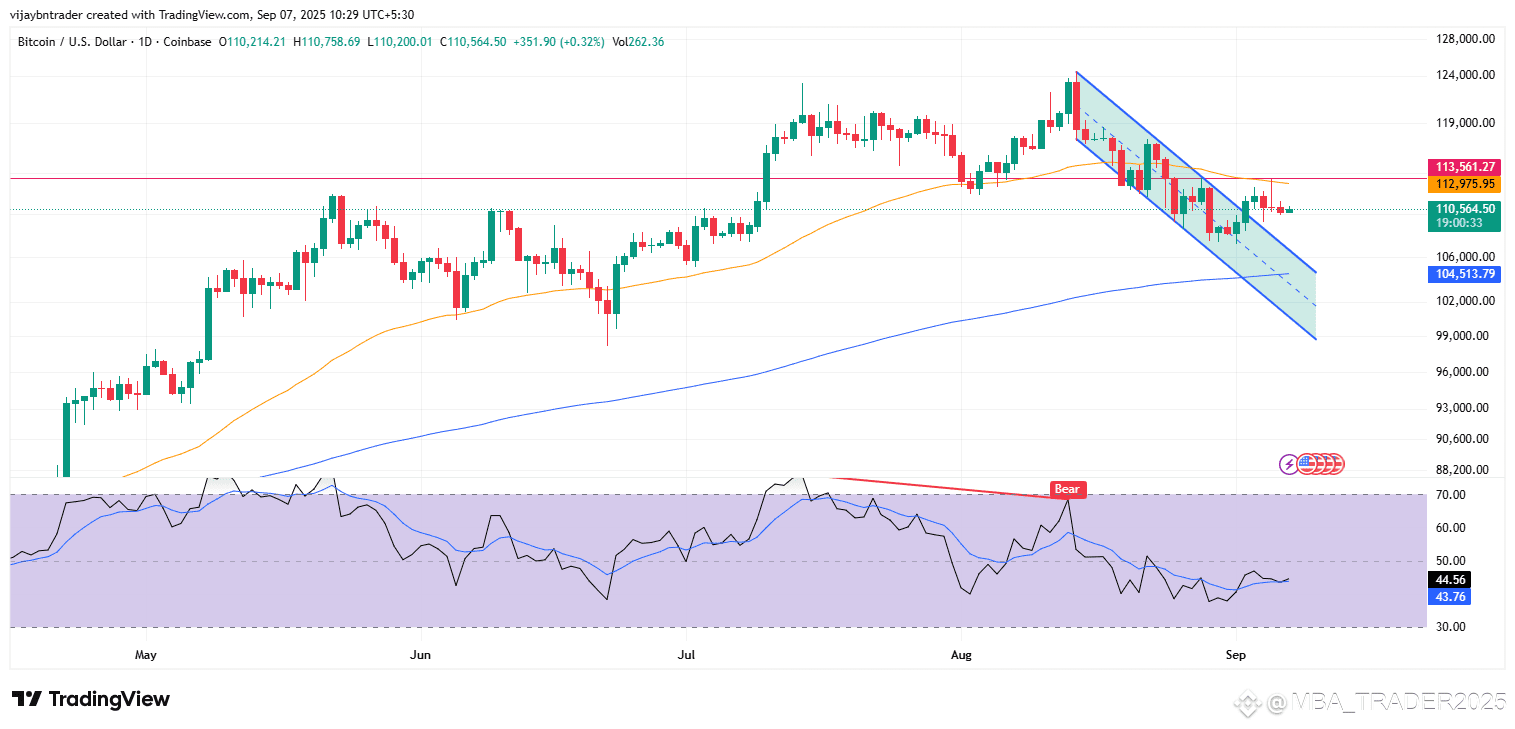
Daily
Momentum: Daily RSI remains sub‑50 in the mid‑40s, keeping higher‑timeframe momentum neutral‑to‑bearish; reclaiming the 50 centerline is a common criterion for trend improvement.
EMAs: Price is battling the 50‑day EMA; the 50/200 EMA pair often defines medium/long‑term bias and act as dynamic S/R, so a sustained hold back above the 50‑day would upgrade the outlook.
Actionable cues
Bullish path: Wait for 1h/4h break‑and‑retest over the channel top with RSI holding >50–60 across timeframes, then target the 200‑EMA and prior supply; use the retest low for risk.
Bearish path: If the upper rail/EMA band rejects and RSI stays below 50 on 15m/1h, fade rallies into that confluence and aim for the channel median/lower bound with stops above the failed breakout.
Key tell: A true RSI range‑shift—persistent holds above the 50 midline—usually marks momentum turning in bulls’ favor; without it, treat bounces as rallies within a downtrend.
