Headline view: BTC is neutral-to-cautious; price sits inside a 1h/4h descending channel and beneath key EMAs, while RSI hovers near the 50 midline across timeframes—a confirmed bullish shift requires RSI holding >50–60 and a clean break‑and‑retest above the channel top and 50‑EMA.
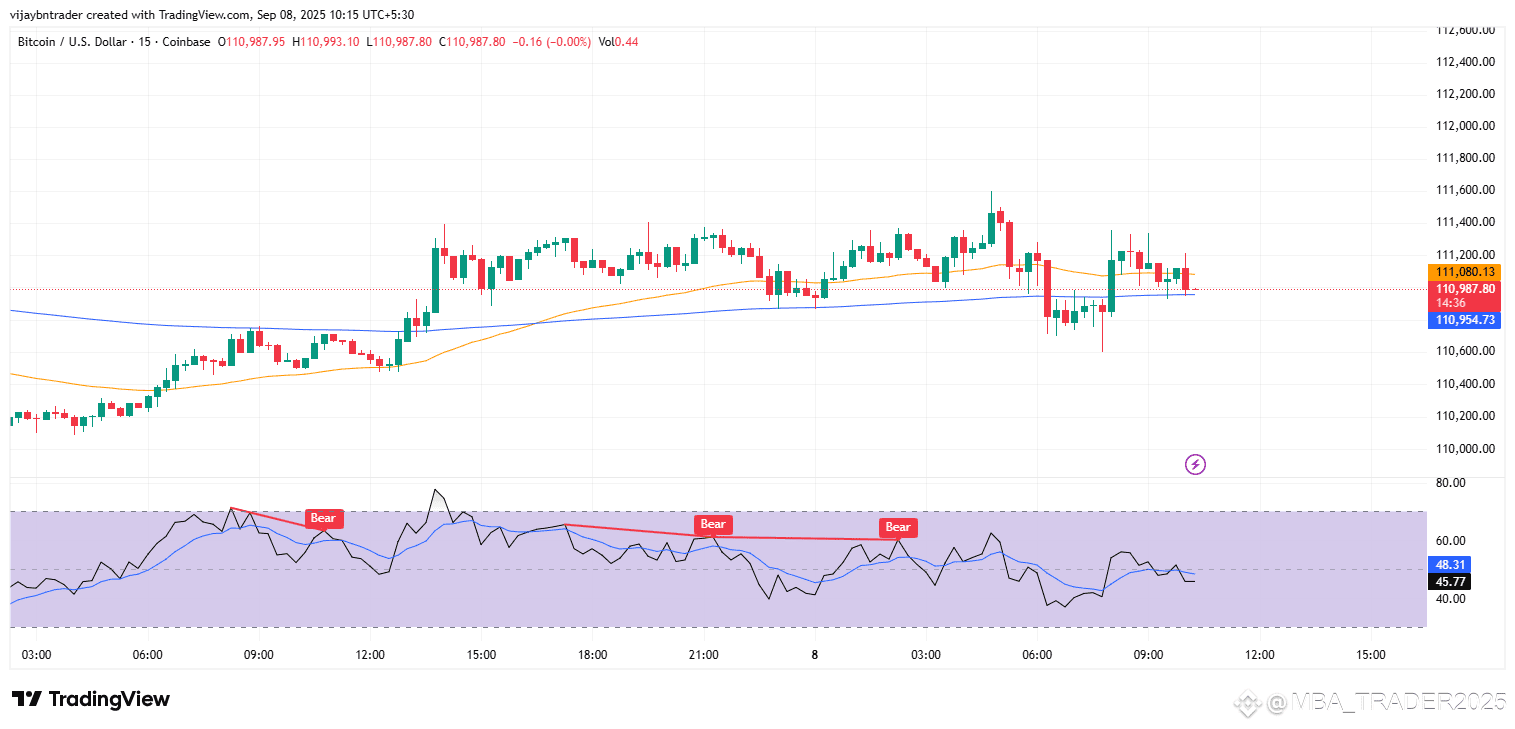
15‑minute (execution)
Structure: Price is oscillating around the 20/50‑EMA cluster, which commonly acts as dynamic support/resistance guiding short‑term swings.
Momentum: RSI has slipped toward the 50 midline after prior peaks; the 50 line is a practical trend divider—holds above favor continuation, sustained drops below favor fades.
Trade triggers:
a) Long only if pullbacks hold the EMA cluster and RSI re‑establishes >50–60; target intraday highs, risk below the EMA confluence.
b) Short on a clean close below the EMA cluster with RSI <50; target the most recent intraday support, invalidate on a close back above the EMAs.
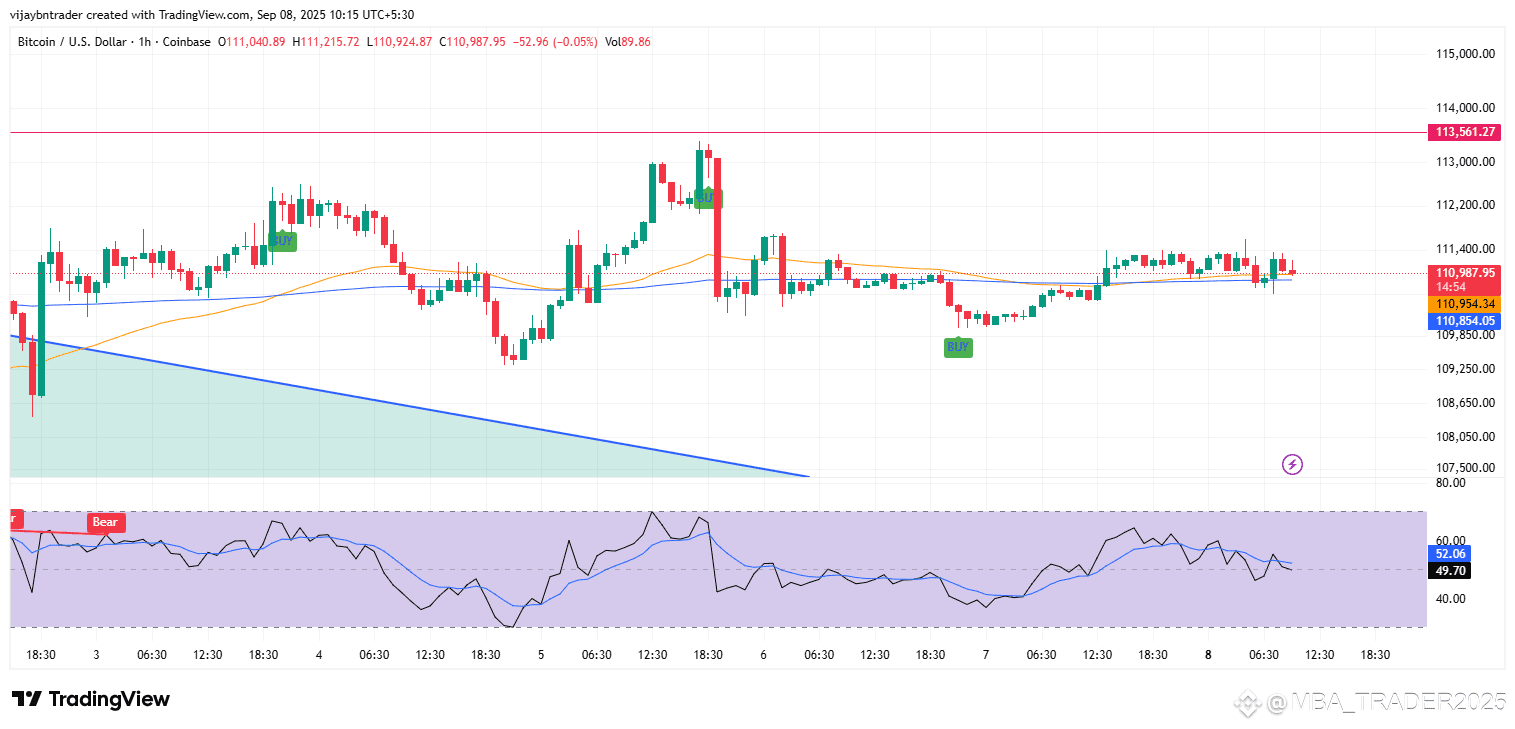
1‑hour (tactical bias)
Structure: Price continues within the upper half of a broader descending channel; regime changes typically need a close above the upper rail plus a successful retest to avoid bull‑traps.
Momentum: RSI ~50 after repeated failures near 60—no confirmed range‑shift yet; many frameworks use 50 as the trend filter.
Trade triggers:
a) Bullish: Break and retest above the channel top while holding above the 50‑EMA; then target the 200‑EMA overhead.
b) Bearish: Rejection at the channel rail/50‑EMA with RSI back below 50; aim for the channel median, invalidate on a close above the rail.
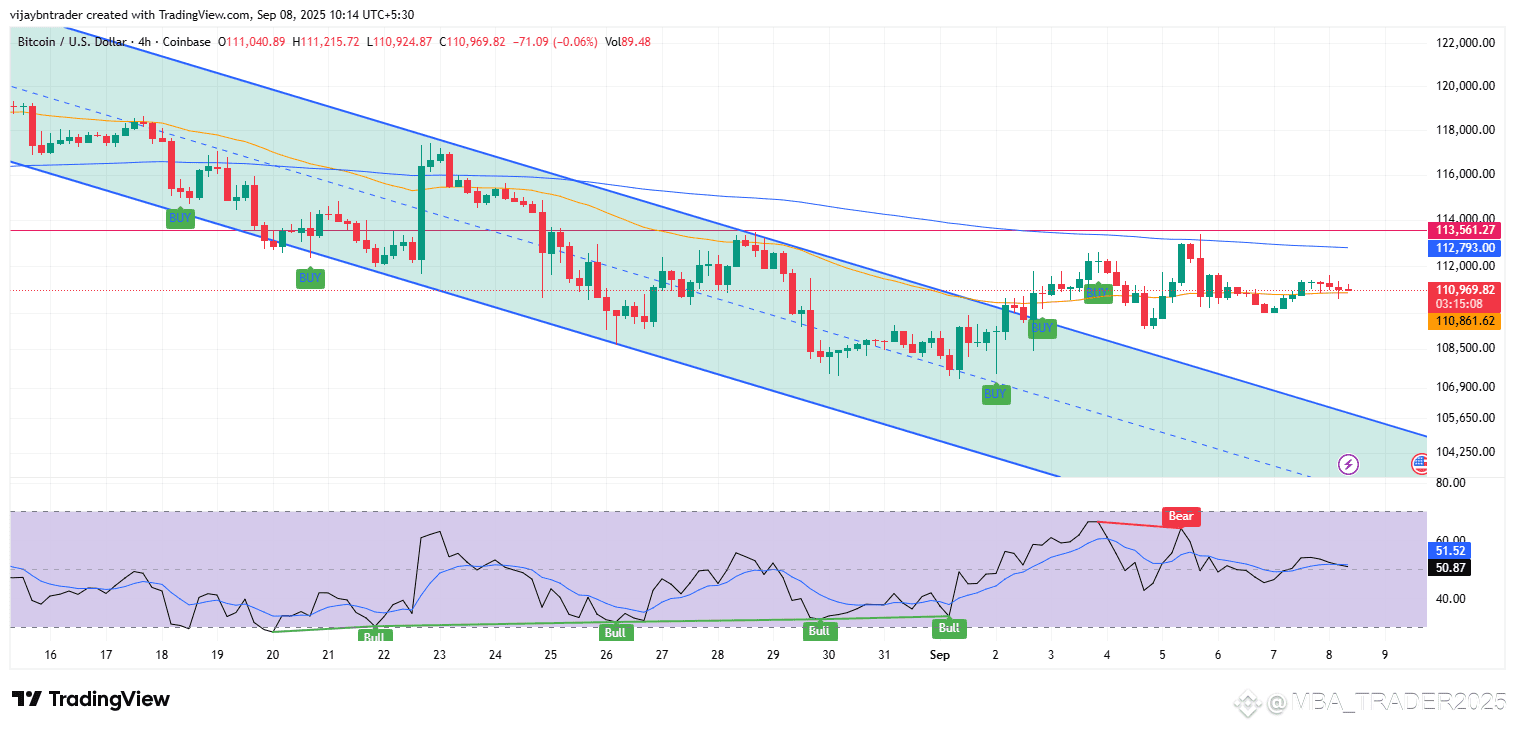
4‑hour (swing map)
Structure: Down‑channel remains intact; price is capped near the upper rail with the EMA band overhead—common rejection zone unless reclaimed.
Momentum: RSI has reverted toward the 50 line after a brief pop; durable trend improvement typically needs sustained closes with RSI >50–60.
Swing triggers:
a) Bullish: Decisive breakout and retest above the channel plus 50‑EMA; path then opens toward the 200‑EMA and prior supply.
b) Bearish: Failure at rail/EMA band with RSI ≤50; target the channel midline/lower bound, invalidate on a confirmed breakout.
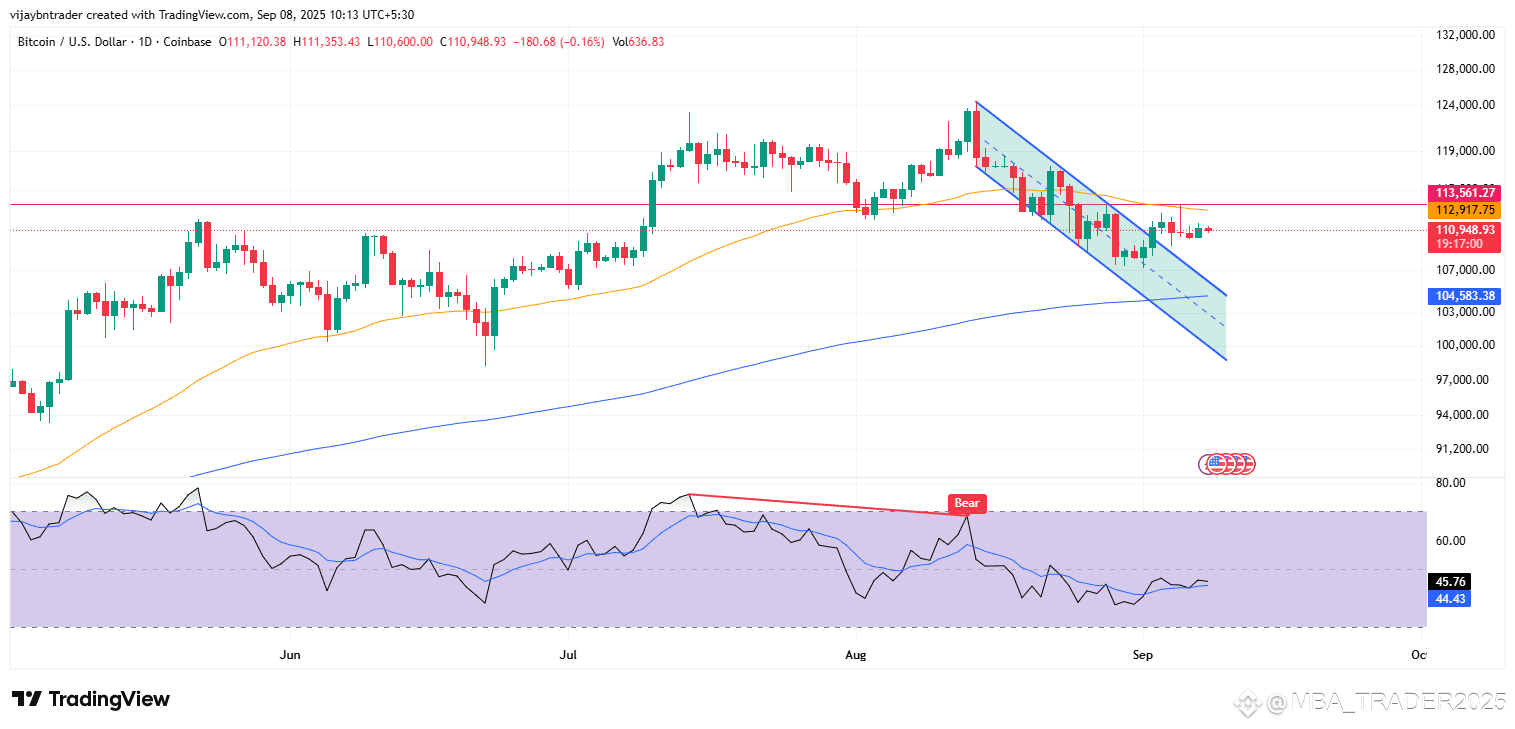
Daily (context)
Momentum: Daily RSI remains mid‑40s, below the 50 centerline; this keeps higher‑timeframe momentum neutral‑to‑bearish until a midline reclaim.
Trend filter: Price is battling the 50‑day EMA; the 50/200 pair acts as dynamic S/R and bias filter, requiring a sustained hold above the 50‑day to upgrade outlook.
Clear levels and checklist
Confirmation for upside:
15m/1h RSI holds >50–60,
1h break‑and‑retest above channel top,
4h close above 50‑EMA; then target 4h 200‑EMA and daily 50‑EMA/supply.
Invalidations for upside:
15m close below EMA cluster with RSI <50,
1h rejection at channel rail/50‑EMA,
4h RSI failing back under 50; expect rotation to channel median.
Positioning guidance
For momentum longs: Wait for 1h break‑and‑retest and RSI >50; scale in only while price rides above 50‑EMA, trail below retest low.
For tactical shorts: Sell rallies into the 1h/4h rail + 50‑EMA confluence when RSI ≤50; cover at channel median or prior swing supports.
Core takeaway: Respect the channel until proven otherwise—RSI midline holds and break‑and‑retest above the rail/50‑EMA are the necessary signals to shift from range‑trading to trend‑following on the long side; without them, treat bounces as rallies within a broader down‑channel.
#MarketPullback #BTC☀
