BTC is pausing beneath resistance after a multi‑day bounce; intraday momentum is fading while higher‑timeframe confirmation is still pending, so the next move hinges on whether RSI holds above its midline and price can stay above broken channel tops and EMAs.
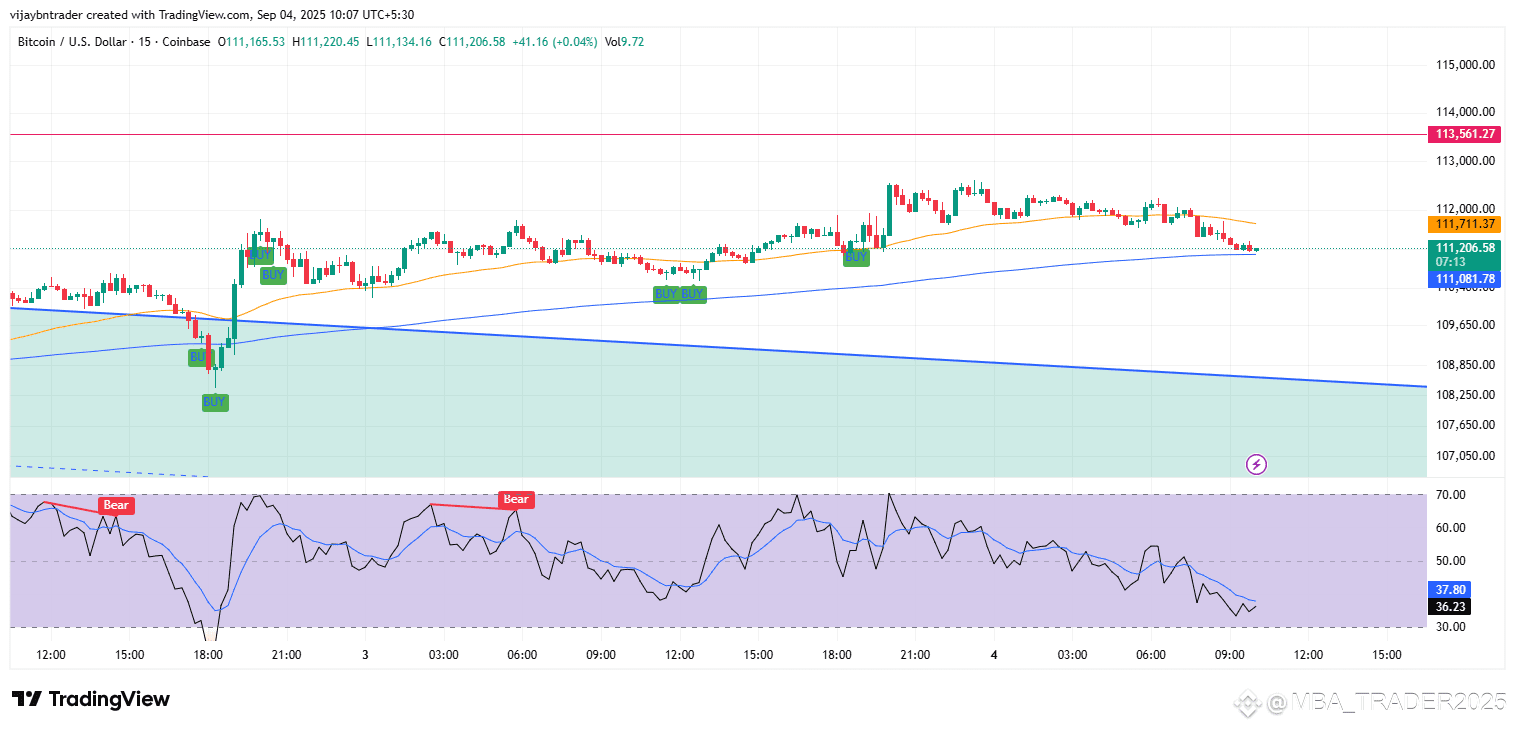
15‑minute
Price is pulling back toward intraday EMAs after failing to extend, and RSI has slipped into the mid‑30s/40s; losing the RSI midline typically signals bearish momentum returning on this timeframe.
If buyers defend the EMA/previous trendline area and RSI reclaims and sustains above 50, the short‑term up‑impulse can resume; otherwise, expect a drift toward the channel midline from the prior pattern.
Working rule: Treat the 20/50‑EMA area as dynamic support/resistance for entries and risk, as EMAs often guide pullbacks and rejections on fast charts.
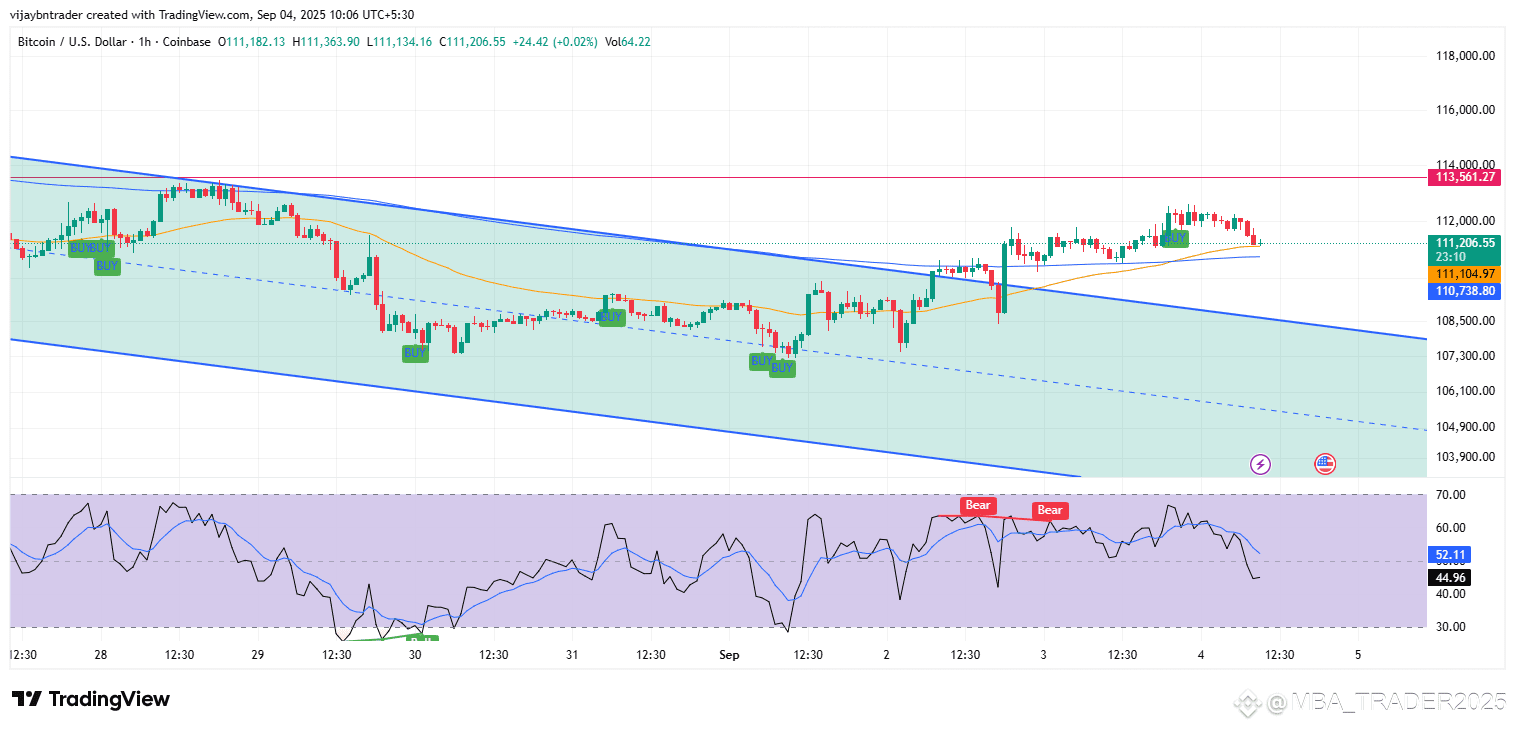
1‑hour
Price sits near the upper half of a broader descending channel and is testing the 20/50‑EMA band from above; channels often require a clean break‑and‑retest to transition from sell‑rallies to buy‑dips.
RSI rolled down from the high‑50s toward 45–50, which is the pivot zone; in downtrends, RSI 50–60 tends to cap rallies unless a range‑shift occurs.
Confirmation cues: Hold above the 50‑EMA with RSI back above 50–60 to target the channel top/200‑EMA; failure below the EMAs with RSI <50 opens room to the channel median/lower rail.
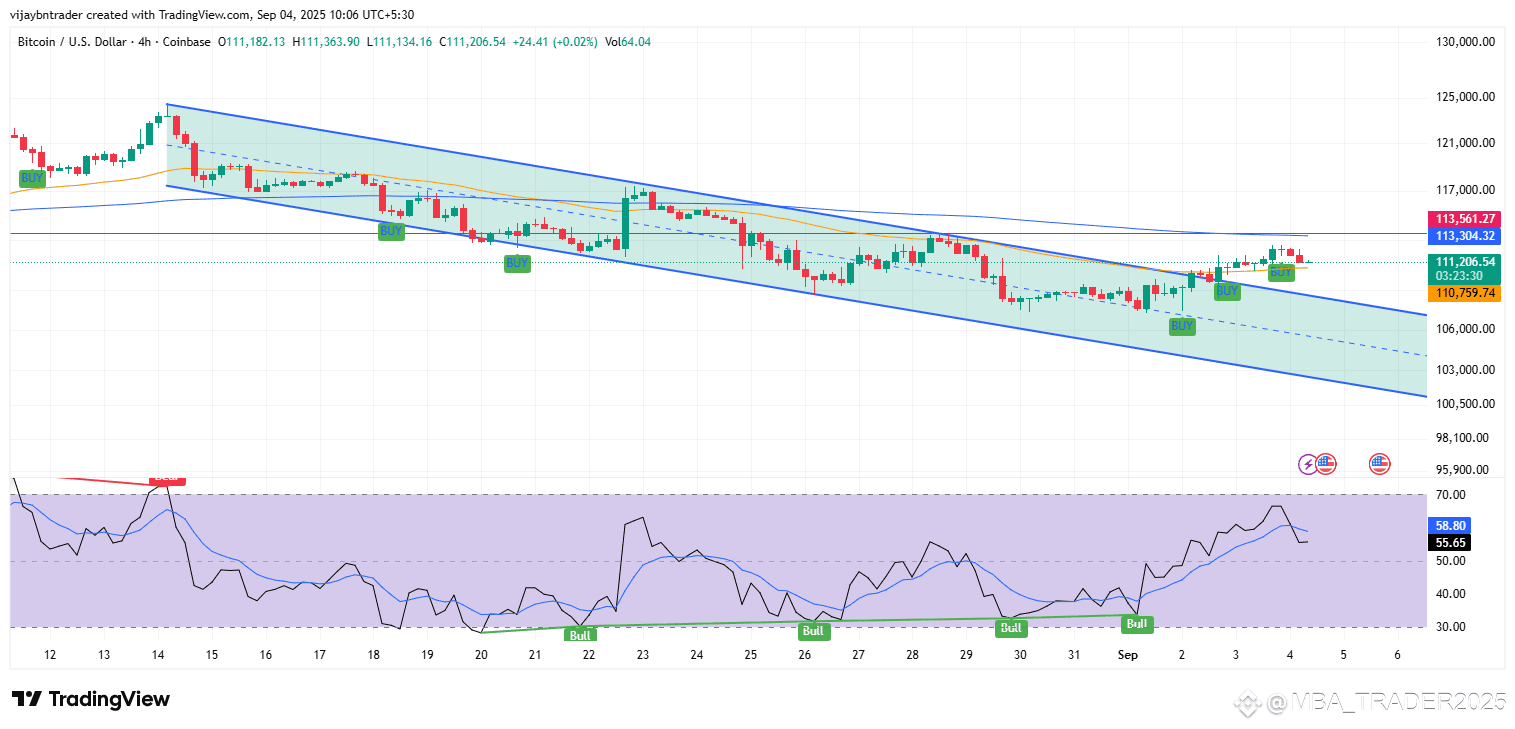
4‑hour
The rebound has reached the upper region of the 4h descending channel with EMAs still sloping down; this keeps the swing bias cautious until the channel top and 50‑EMA are reclaimed on closing basis.
RSI improved toward the high‑50s but remains below a decisive range‑shift; per RSI regime logic, sustainable upside typically requires persistent closes above the 50 midline and pushes through 60.
Swing plan: Break‑and‑retest above the channel plus 50‑EMA with RSI >50–60 validates continuation toward the 200‑EMA; rejection here argues for another leg to the channel midline.
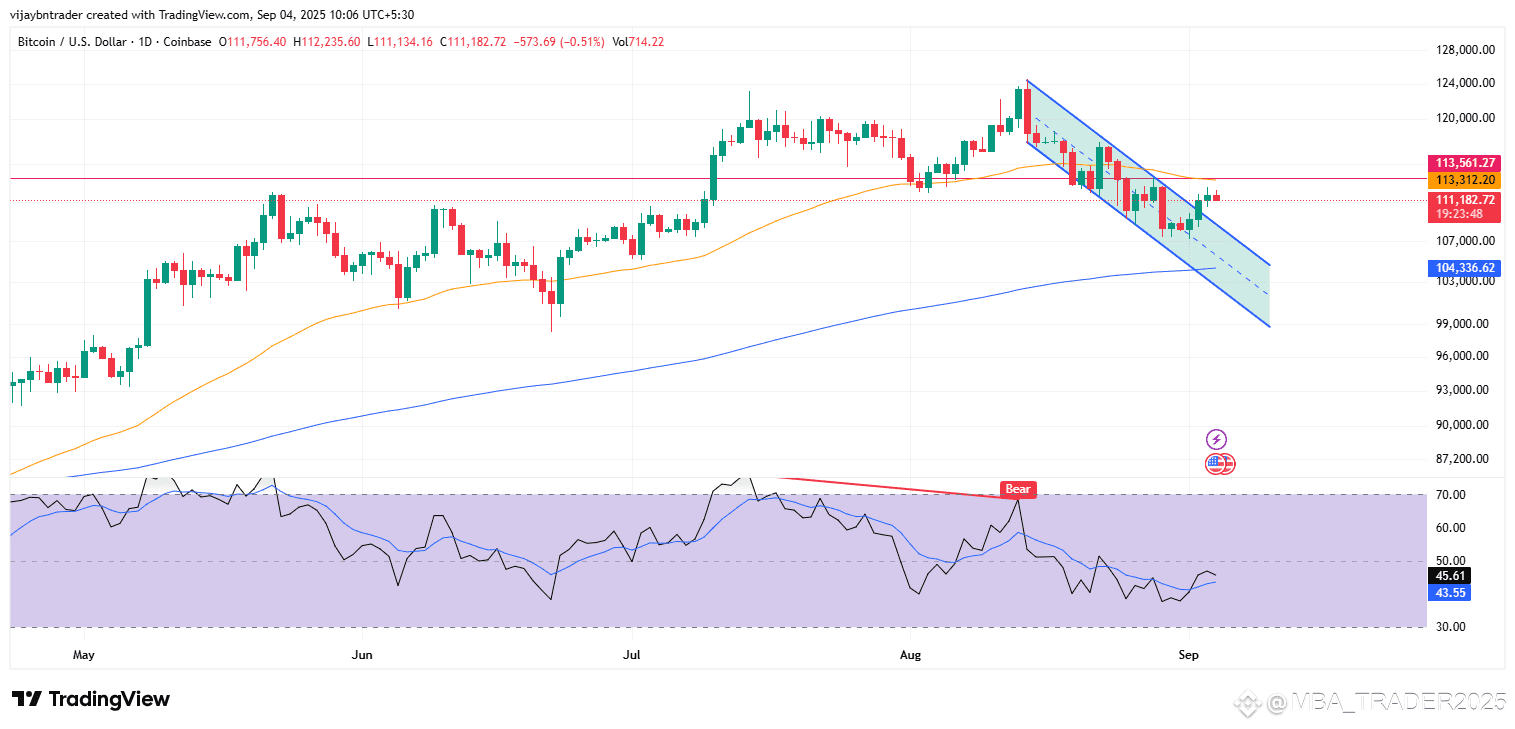
Daily context
Daily RSI has bounced into the mid‑40s but is still below the 50 centerline, indicating momentum has not flipped bullish yet; the 50 line is a widely used divider between bearish and bullish phases.
Price remains below the 50‑day EMA, which often acts as dynamic resistance in downtrends; a durable shift generally needs a reclaim and hold above that average.
Trade implications
Bullish continuation setup: Wait for 1h/4h closes and a retest holding above the channel tops and 50‑EMA with RSI sustaining >50–60, then target the 200‑EMA and prior supply zones.
Bearish fade setup: If the retest fails and RSI stays below 50 on 15m/1h, fade rallies into the EMA band/upper rail and aim for the channel midline/lower boundary with stops above the last lower high.
Risk management: RSI signals are most reliable when aligned with trend and structure; avoid acting on isolated overbought/oversold prints without EMA/channel confirmation.