BTC is attempting a constructive turn on intraday charts while still sitting below higher‑timeframe resistance; confirmation hinges on RSI holding a bullish range above the 50 midline and price reclaiming/holding above the channel tops and EMA bands on 1h/4h.
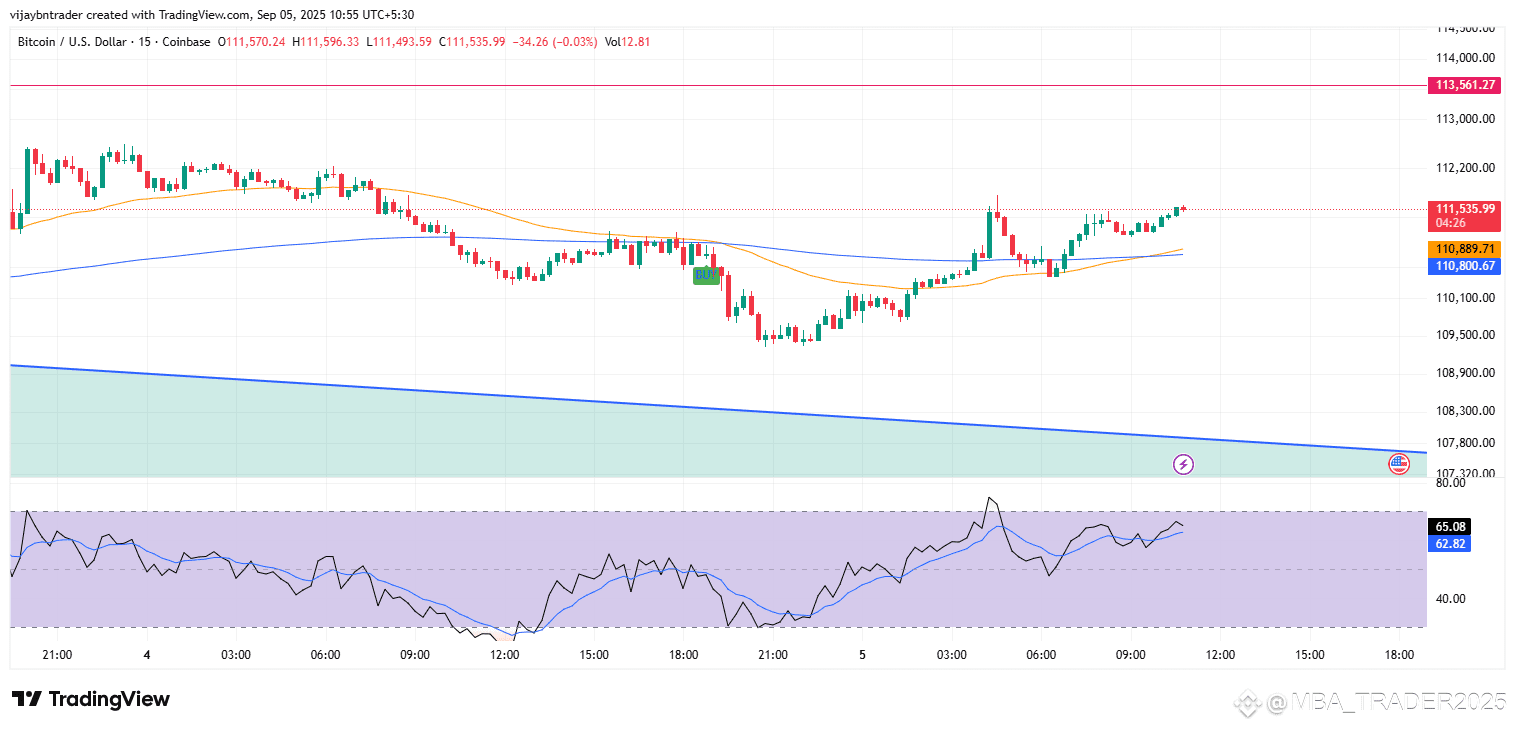
15‑minute
Momentum: RSI has shifted into the 60–65 area after a strong rebound, indicating a short‑term range‑shift toward bullish momentum as long as pullbacks hold above the 50 centerline.
Structure: Price reclaimed the 20/50‑EMA and is trending above them; these EMAs act as dynamic support during intraday upswings, so a hold above this zone keeps the path higher on this timeframe.
What to watch: If price pulls back, look for a break‑and‑retest behavior at prior channel resistance/EMA support; sustained RSI >50 on the retest favors continuation, while a loss of 50 warns of a failed breakout.
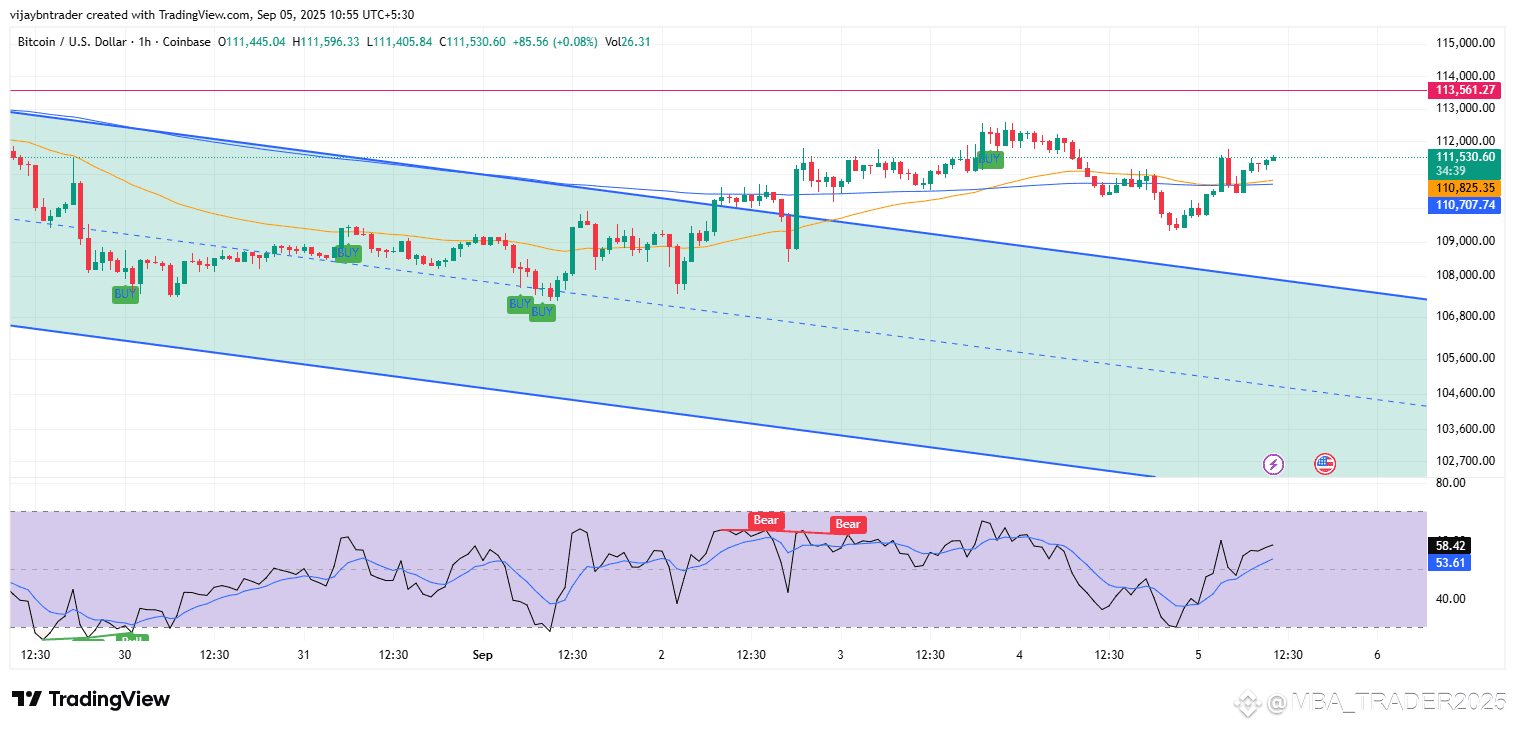
1‑hour
Channel test: Price is working higher inside a broader descending channel and pressing the upper half; a trend transition typically needs a candle close above the channel top and a successful retest.
RSI: Prints in the mid‑50s and rising, an early sign of a bullish range‑shift from the bearish 10–60 regime; maintaining closes above 50–60 increases odds of targeting the 200‑EMA overhead.
Triggers: Confirmation arrives on a break‑and‑retest above the channel plus holding above the 50‑EMA; otherwise expect chop and potential fade back to the channel median.
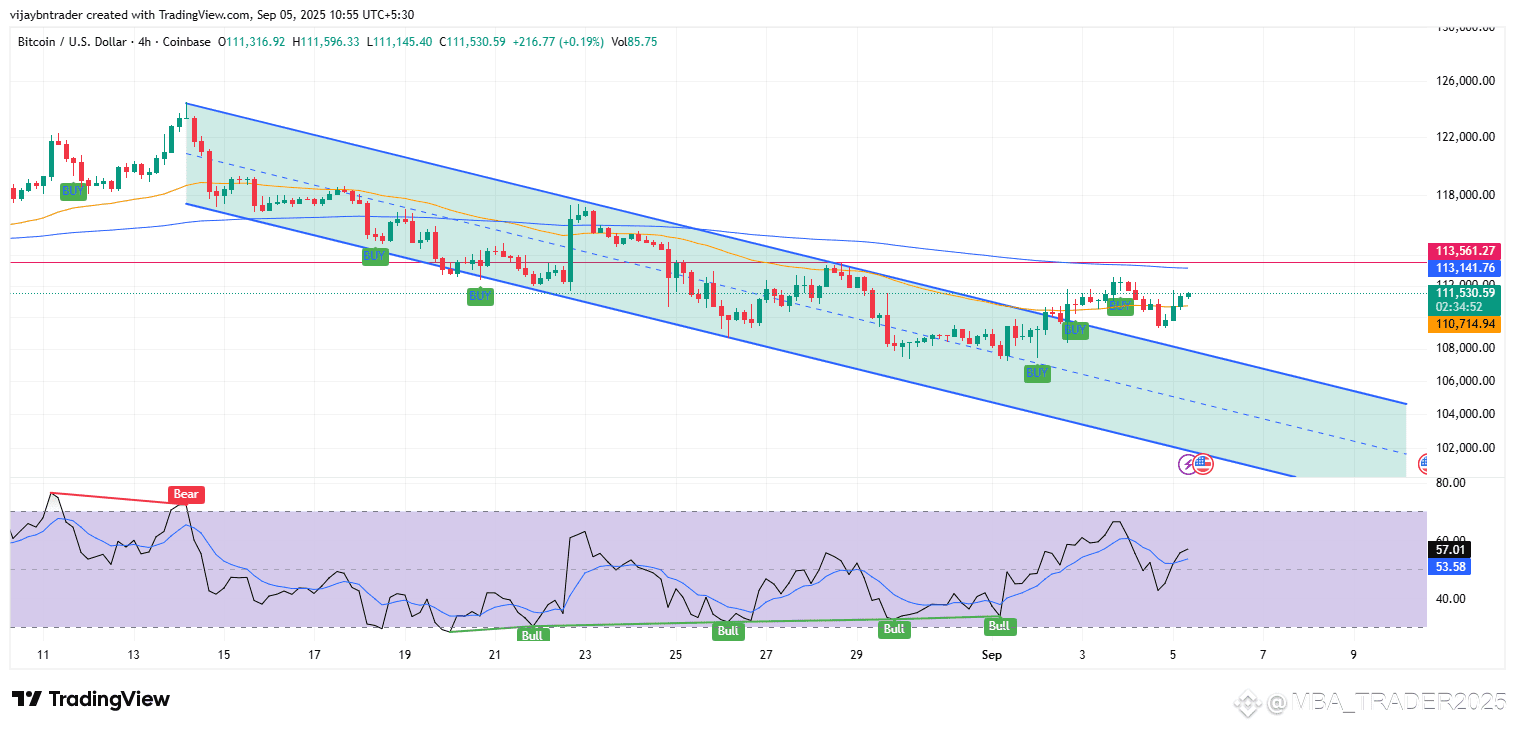
4‑hour
Trend: The 4h down‑channel still governs, and price is approaching the channel top and the 50‑EMA/200‑EMA band, a typical decision area where rallies often pause or reverse unless a clean breakout occurs.
RSI: Improving toward 55–57, which is the decision zone; a durable upswing usually needs RSI to sustain above the 50 midline and push through 60, signaling a range‑shift.
Validation: Seek a clear candle close above the upper rail followed by a retest that holds to confirm a structural break; stops are commonly placed just below the retest low to avoid false breaks.
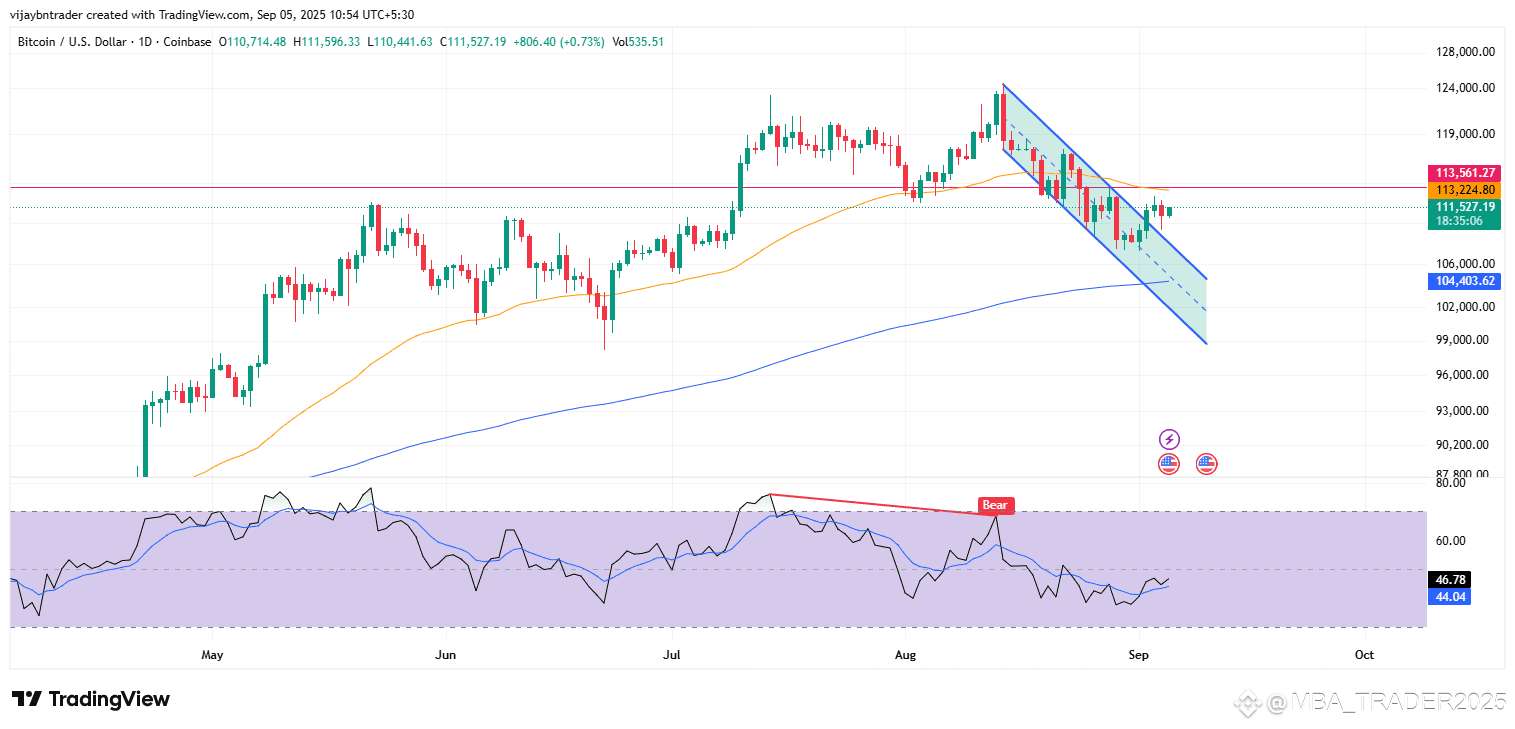
Daily context
Momentum: Daily RSI has recovered toward the mid‑40s but remains below the 50 centerline, so higher‑timeframe momentum is not convincingly bullish yet. A push and hold above 50 would mark a more meaningful shift.
EMAs: Price is battling the 50‑day EMA area; this average often acts as dynamic resistance in pullbacks, and a reclaim/hold is typically required to transition from sell‑rallies to buy‑dips.
Playbook
Bullish continuation: Add on a 1h/4h break‑and‑retest above the channel top with RSI sustaining >50–60, targeting the 200‑EMA and prior supply levels; use the retest low as risk reference.
Bearish fade: If price rejects at the 1h/4h upper rail or 50‑EMA and RSI slips back below 50, fade into the rejection and aim for the channel midline/lower bound with stops above the failed breakout.
Key tell: Watch for an RSI range‑shift across timeframes—holding above 50 is a practical confirmation that average gains exceed losses and that trend may be turning.