1. Core conclusion
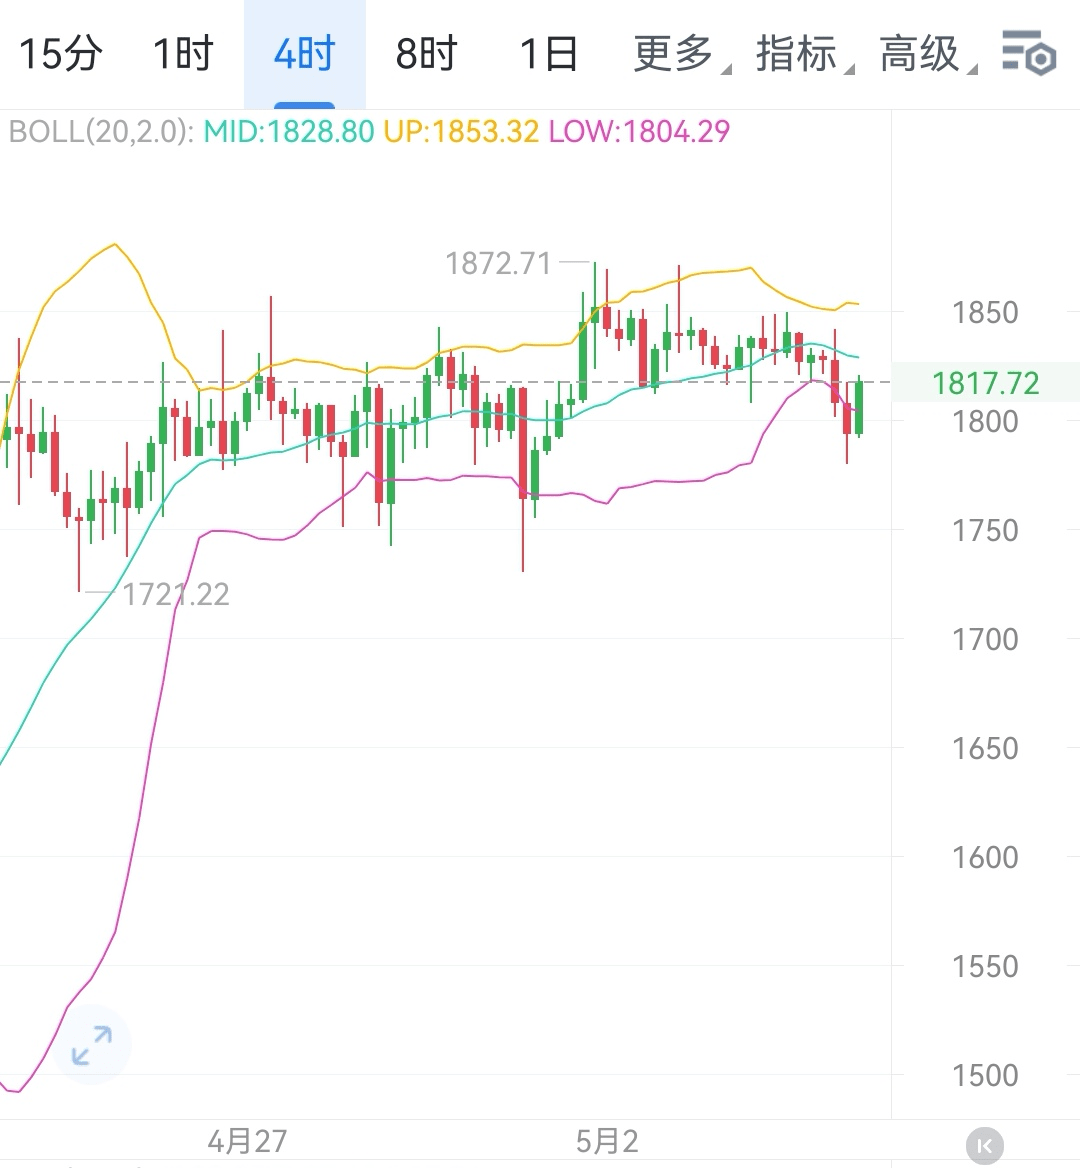
1813 is the ‘dividing line’ for bulls and bears at the hourly level:
- If it doesn't stabilize, it is weak: weak rebound, with support levels below 1780→1762→1730 (may test downward step by step).
- If it stabilizes, it is strong: confirming the rebound, with resistance levels above 1832→1845→1872 (may break step by step).
2. Detailed analysis
1. Bearish trend (losing 1813)
- Signal: Price continues to be suppressed below 1813, rebound volume is insufficient, showing a 'lower high' pattern.
- Support level function:
- 1780: The first support for short-term decline. If broken, the market may accelerate downward to 1762.
- 1762: Mid-term strong and weak dividing line. If lost, it may trigger selling pressure and further test 1730.
- 1730: Strong support area. A break may open space below 1700, requiring caution for deep corrections.
2. Bullish trend (stabilizing at 1813)
- Signal: Price breaks above 1813 with strong volume, short-term moving averages form a golden cross, with volume expanding.
- Pressure level function:
- 1832: The first resistance for rebound. After breaking, the market turns optimistic, targeting 1845.
- 1845: Mid-term key resistance. If broken, it may attract additional funds and confirm the bullish trend.
- 1872: Strong resistance area. If stabilized, it is expected to challenge the 1900 level, opening up upward space.
3. Operation strategy and risk warning
1. Strategy suggestion
- Conservative investors: Wait for clear direction (break above 1813 USD or break below 1780) before entering, to avoid volatility risks.
- Aggressive investors:
- Downward to around 1780, lightly long with a target of 1813 USD, stop loss set below 1760.
- After rebounding to around 1832, lightly short with a target of 1813, stop loss set above 1845.
2. Risk warning
- Linked to Bitcoin: Ethereum has a high correlation with Bitcoin, requiring simultaneous attention to Bitcoin's performance at the critical level of 94730.
- Position control: Single trade position should not exceed 5%, stop-loss ratio set at 2%-3%, to avoid extreme market liquidation.
- Fundamental factors: Pay attention to the progress of Ethereum's Cancun upgrade, changes in ETH staking volume, and the sentiment in the US stock market.
4. Summary
Today, Ethereum's market revolves around 1813, with a tug-of-war between bulls and bears. The short-term trend depends on the breakout situation at this level:
- Downward: Support levels are layered for defense, requiring caution for risks of a downward break;
- Upward: Resistance levels gradually rise, or a wave rebound market may begin.
In terms of operation, it is recommended to focus on key points for risk control, using the 'breakout confirmation + phased entry' strategy to avoid premature market predictions.$ETH #ETH走势分析