One, Core Key Points: 593.5 determines short-term bullish and bearish direction
- Bull-bear watershed: 593.5 (1-2 hour level closing price)
- Standing firm bullish: K-line entity breaks through 593.5 with increased volume, confirming the start of a small-level rebound, target pressure levels 600→605.5→610.
- Bearish under pressure: Continuous suppression below 593.5 or breaking the previous low of 587 could trigger a second retest, probing support levels 581.5→576.3→572.
Two, Analysis of Upper Pressure Levels
1. 600: Psychological integer barrier + dense trading area within the day, primary resistance for short-term rebound, breaking opens upward space.
2. 605.5: 4-hour level 5-day moving average resistance, breaking may extend the market to daily level repair.
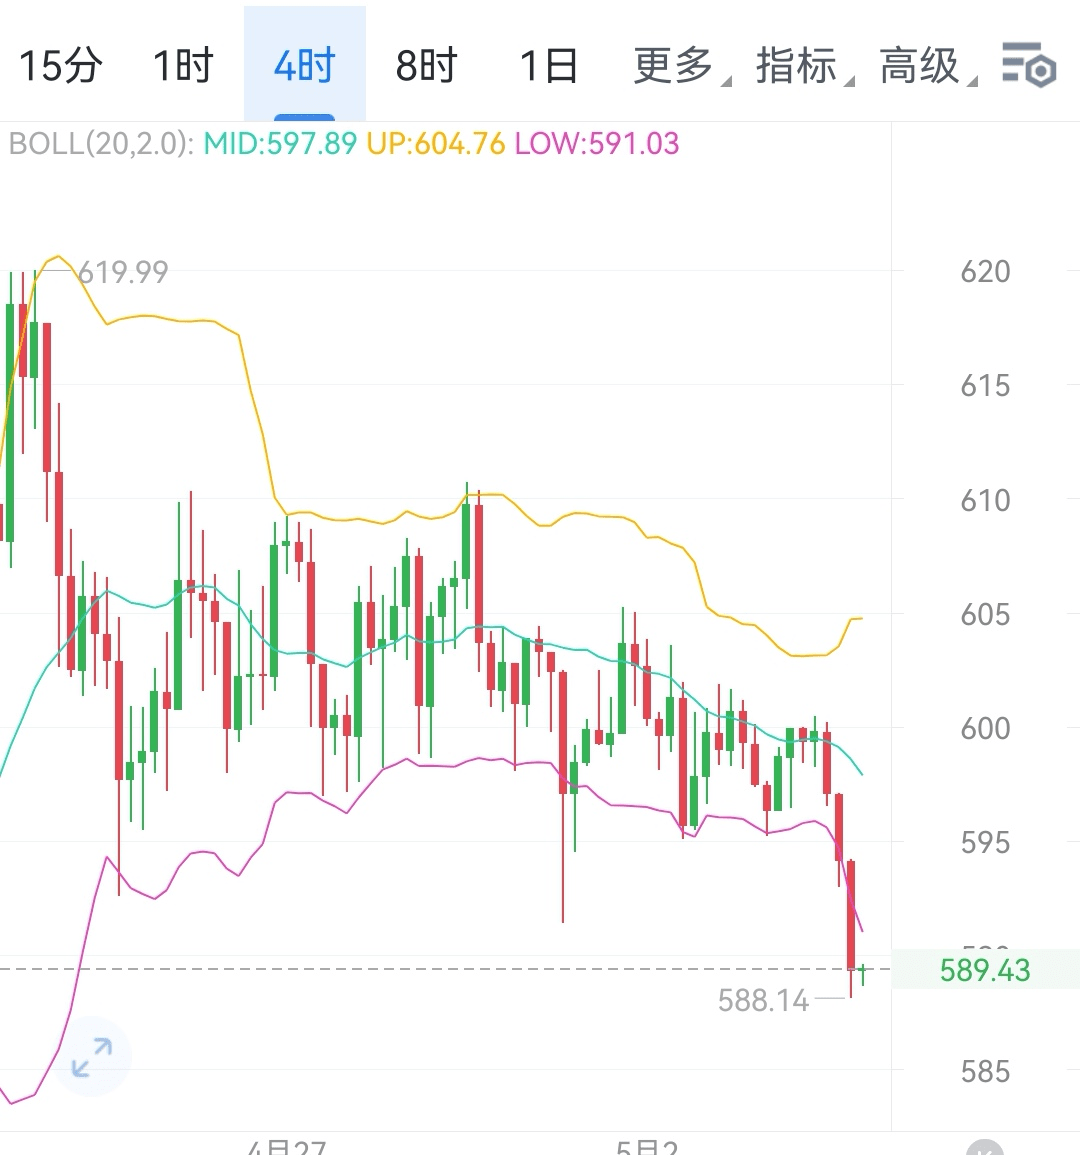
3. 610: Daily Bollinger Band middle track, key point for trend reversal, stabilizing can confirm a shift from correction to oscillation upward.
Three, Analysis of Lower Support Levels
1. 587: Daily low point (previous low), initial support, breaking opens downward space.
2. 581.5: 4-hour Bollinger Band lower boundary, technical support in the oversold zone, suitable for aggressive long position testing.
3. 576.3: Fibonacci 38.2% retracement level, medium-term support, stabilizing may allow for a daily level rebound.
4. 572: Support line connecting late March low points, breaking may probe down to 565, need to be cautious of trend risks.
Four, Operational Strategy and Risk Control
- Long position opportunities:
- Conditions: 1-2 hour closing price stabilizes above 593.5, lightly entering positions, target 600-605.5, stop loss at 590 (below the watershed).
- Short position opportunities:
- Conditions: Rebound resisted at 593.5 or breaking below 587, lightly entering positions, target 581.5-572, stop loss at 596 (long position stop loss) or 585 (short position stop loss).
- Sideways strategy: Buy high and sell low within the 587-593.5 range, quick in and out, stop loss 3-5 points.
Five, Summary
- Direction determination: Using 593.5 as the core, confirming trends with 1-2 hour level closing, volume-price coordination is key.
- Core Logic:
- Breakthrough 593.5→ ladder upward pressure level, pay attention to 610 trend validation;
- Breaking below 587→ probing support levels, 572 is the defensive bottom line for both bulls and bears.
- Risk control points:
- Stop loss must be included, single risk ≤ 2% of position;
- Focus on the active trading periods at night, avoid chasing highs and selling lows!$BNB #BNB走势