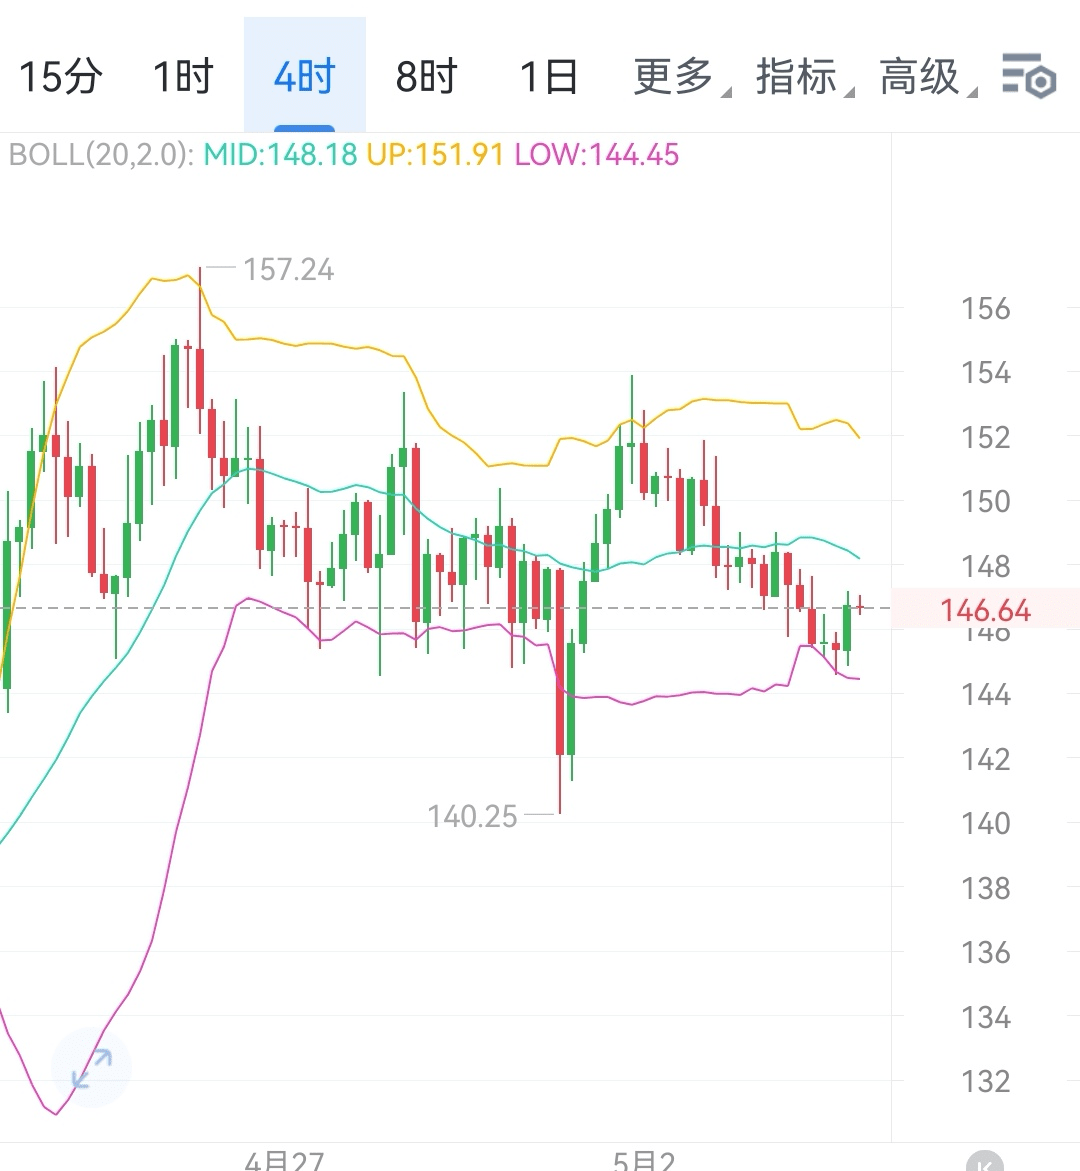
Bull-bear dividing line: 147 (4-hour level)
- Bullish if stabilized: If the 4-hour closing price breaks above 147 with increased volume, confirm the initiation of a small rebound, target resistance levels 149 → 151.3 → 154.
- Bearish under pressure: If unable to stabilize above 147 or dropping below 145, the market continues to weaken, with support levels at 144.6 → 143 → 140.2.
Analysis of upper resistance levels
1. 149: Intraday trading dense area + 5-day moving average resistance, the first resistance point for short-term rebound.
2. 151.3: Key level of daily trendline; breaking through opens up repair space at the daily level.
3. 154: Weekly Fibonacci retracement level, stabilizing can confirm mid-term rebound trend.
Analysis of support levels below
1. 144.6: Intraday low point + Bollinger Bands lower track, aggressive long entry point (stop-loss at 144).
2. 143: Mid-term rising trendline support, stabilization can bet on a daily rebound (needs to combine stop-loss signals).
3. 140.2: Fibonacci 50% retracement level; if broken, risk expands to 135-138.
Summary
- Core direction: Confirm the effectiveness of the 147 breakthrough with the 4-hour closing price; the coordination of volume and price is key.
- Operating strategy:
- Long position: Follow up after stabilizing above 147, target 149-151.3, stop-loss at 146.
- Short position: Enter after being blocked at 147 or dropping below 144.6, target 143-140.2, stop-loss at 148 (long)/143 (short).
- Support betting: 143, 140.2 can combine with candlestick signals to lay out long positions, beware of breakout risks.
- Risk control focus: Set stop-loss properly, pay attention to the peak volatility period at night, avoid chasing highs and panic selling.$SOL #SOL走势