 One, Key support and resistance levels
1. Support level:
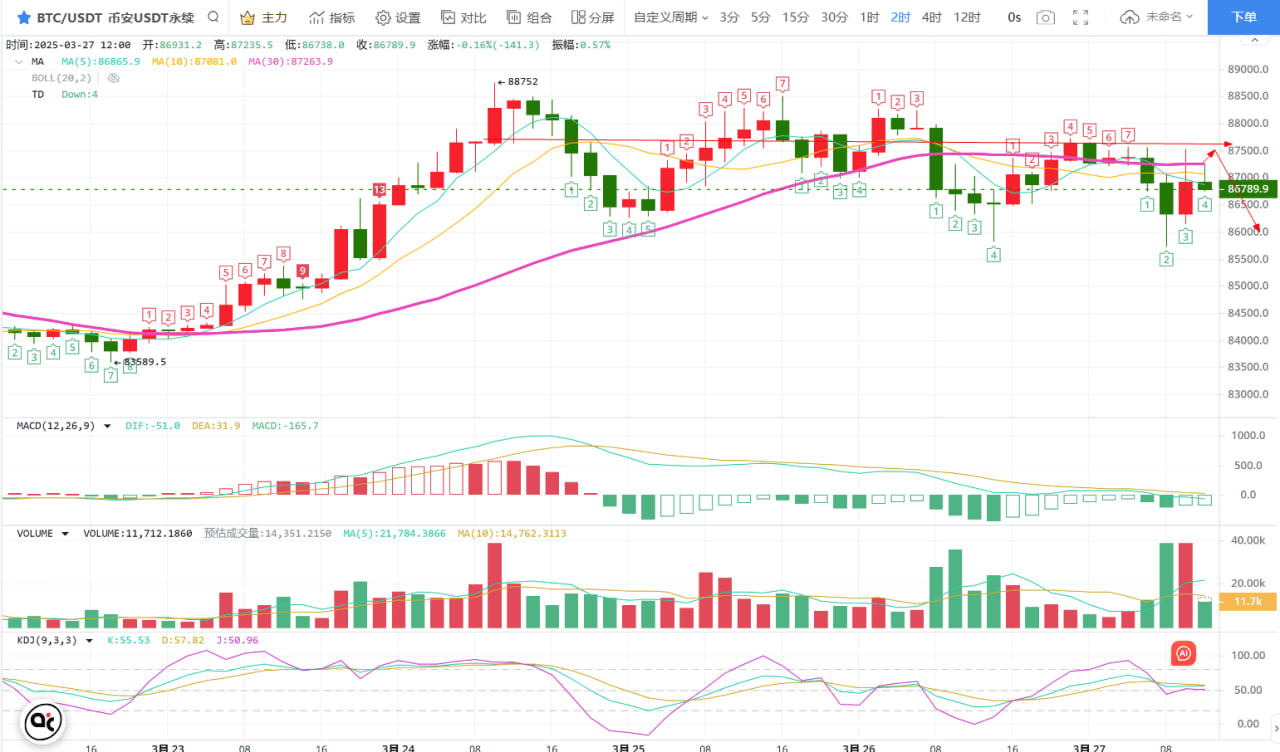
• 86,000-86,500 USD: Short-term psychological barrier and support from the middle Bollinger band, which has been tested multiple times recently without breaking; if it breaks, it may trigger technical selling pressure.
• 85,500-85,750 USD: Recent pullback low, resonating with CME futures prices, is a key defensive area for medium- to long-term bulls.
2. Resistance level:
• 88,000-88,500 USD: Current upper boundary of the oscillation range, technical resistance band formed by the upper Bollinger band and historical high point; a breakout requires volume support.
• 89,000-90,000 USD: Psychological barrier and historical peak area; breaking through will open up larger upside potential.
Two, Technical indicator signals and bullish-bearish momentum
1. Daily level:
• MACD divergence: Price reaches new highs but the momentum bars do not synchronize in amplification, indicating that upward momentum is weakening.
• Decreasing trading volume: Recent rebounds show a 37% decrease in trading volume compared to the March peak, indicating strong market wait-and-see sentiment.
• Moving average system: EMA7 and EMA30 form a bullish arrangement, but the EMA120 long-term moving average is significantly suppressive, and caution is needed against correction risks.
2. 4-hour level:
• Bollinger band convergence: Decreasing volatility, with prices oscillating between 86,000-88,000 USD.
• MACD bearish volume increase: DIF and DEA are stuck together below the zero axis, with short-term bearish momentum increasing.
• KDJ downward divergence: Three lines stick together and extend downward, indicating that weakness may continue in the short term.
Three, Short-term market projection
1. Weakening oscillation logic:
Current price is constrained by the 88,000 USD resistance, and the daily RSI (76) and CCI (163) indicate overbought risk. If it fails to break out with volume, it may retest the support area of 86,000-86,500 USD, or even dip down to 85,500 USD.
2. Potential rebound conditions:
If the price stabilizes above 86,500 USD and the MACD forms a golden cross, it may test the 88,000 USD resistance again; after breaking through, pay attention to the pressure zone of 89,000-90,000 USD.
Four, Operational strategies and risk control suggestions
1. Bearish opportunity (main strategy):
• Entry timing: Lightly short on the rebound to the 87,500-88,000 USD area, with a stop loss set above 88,500 USD.
• Target price: First target 86,500 USD, second target 85,500 USD.
2. Bullish defense (secondary strategy):
• Entry timing: After stabilizing on the retest of the 86,000-86,500 USD support area, lightly long, with a stop loss set below 85,500 USD.
• Target price: Look towards 89,000-90,000 USD after breaking 88,000 USD.
3. Risk control points:
• Position management: Single position not exceeding 5%, stop loss range controlled at 1%-2%.
• Beware of false breakouts: If the price briefly pierces support/resistance and then quickly reverses, it is necessary to exit in a timely manner.
Five, Market risks and catalytic events
1. Short-term risk events:
• Policy disturbance: Details of the Trump administration's tariff policy are about to be announced; if tightened beyond expectations, it may trigger a correction.
• Leverage liquidation pressure: The total contract open interest remains high; breaking below 85,500 USD may trigger liquidation of 24,000 BTC.
2. Long-term support logic:
• Halving effect: Supply tightens after the halving in 2024, with institutional accumulation (such as MicroStrategy holding over 500,000 BTC) supporting a long-term bullish trend.
• ETF capital inflow: The US Bitcoin spot ETF ended five weeks of net outflow, with an inflow of 744 million USD in one week, reflecting a rebound in institutional confidence.
Summary: Bitcoin is currently in the oscillation range of 86,000-88,500 USD, with a technical bias towards correction. The strategy focuses on short positions primarily and long positions secondarily. Key attention should be paid to tonight's US PPI data and Trump’s policy trends. If it breaks below the 85,500 USD support, it may dip to the 82,000-83,000 USD area; if it breaks above 88,500 USD, it is likely to restart the upward cycle. Medium- to long-term investors can gradually position based on the 85,000-86,000 USD support, taking advantage of the long-term benefits of supply-demand imbalance after the halving.


