One, market structure and technical signals.
1. Short-term price pattern verification of weak patterns.
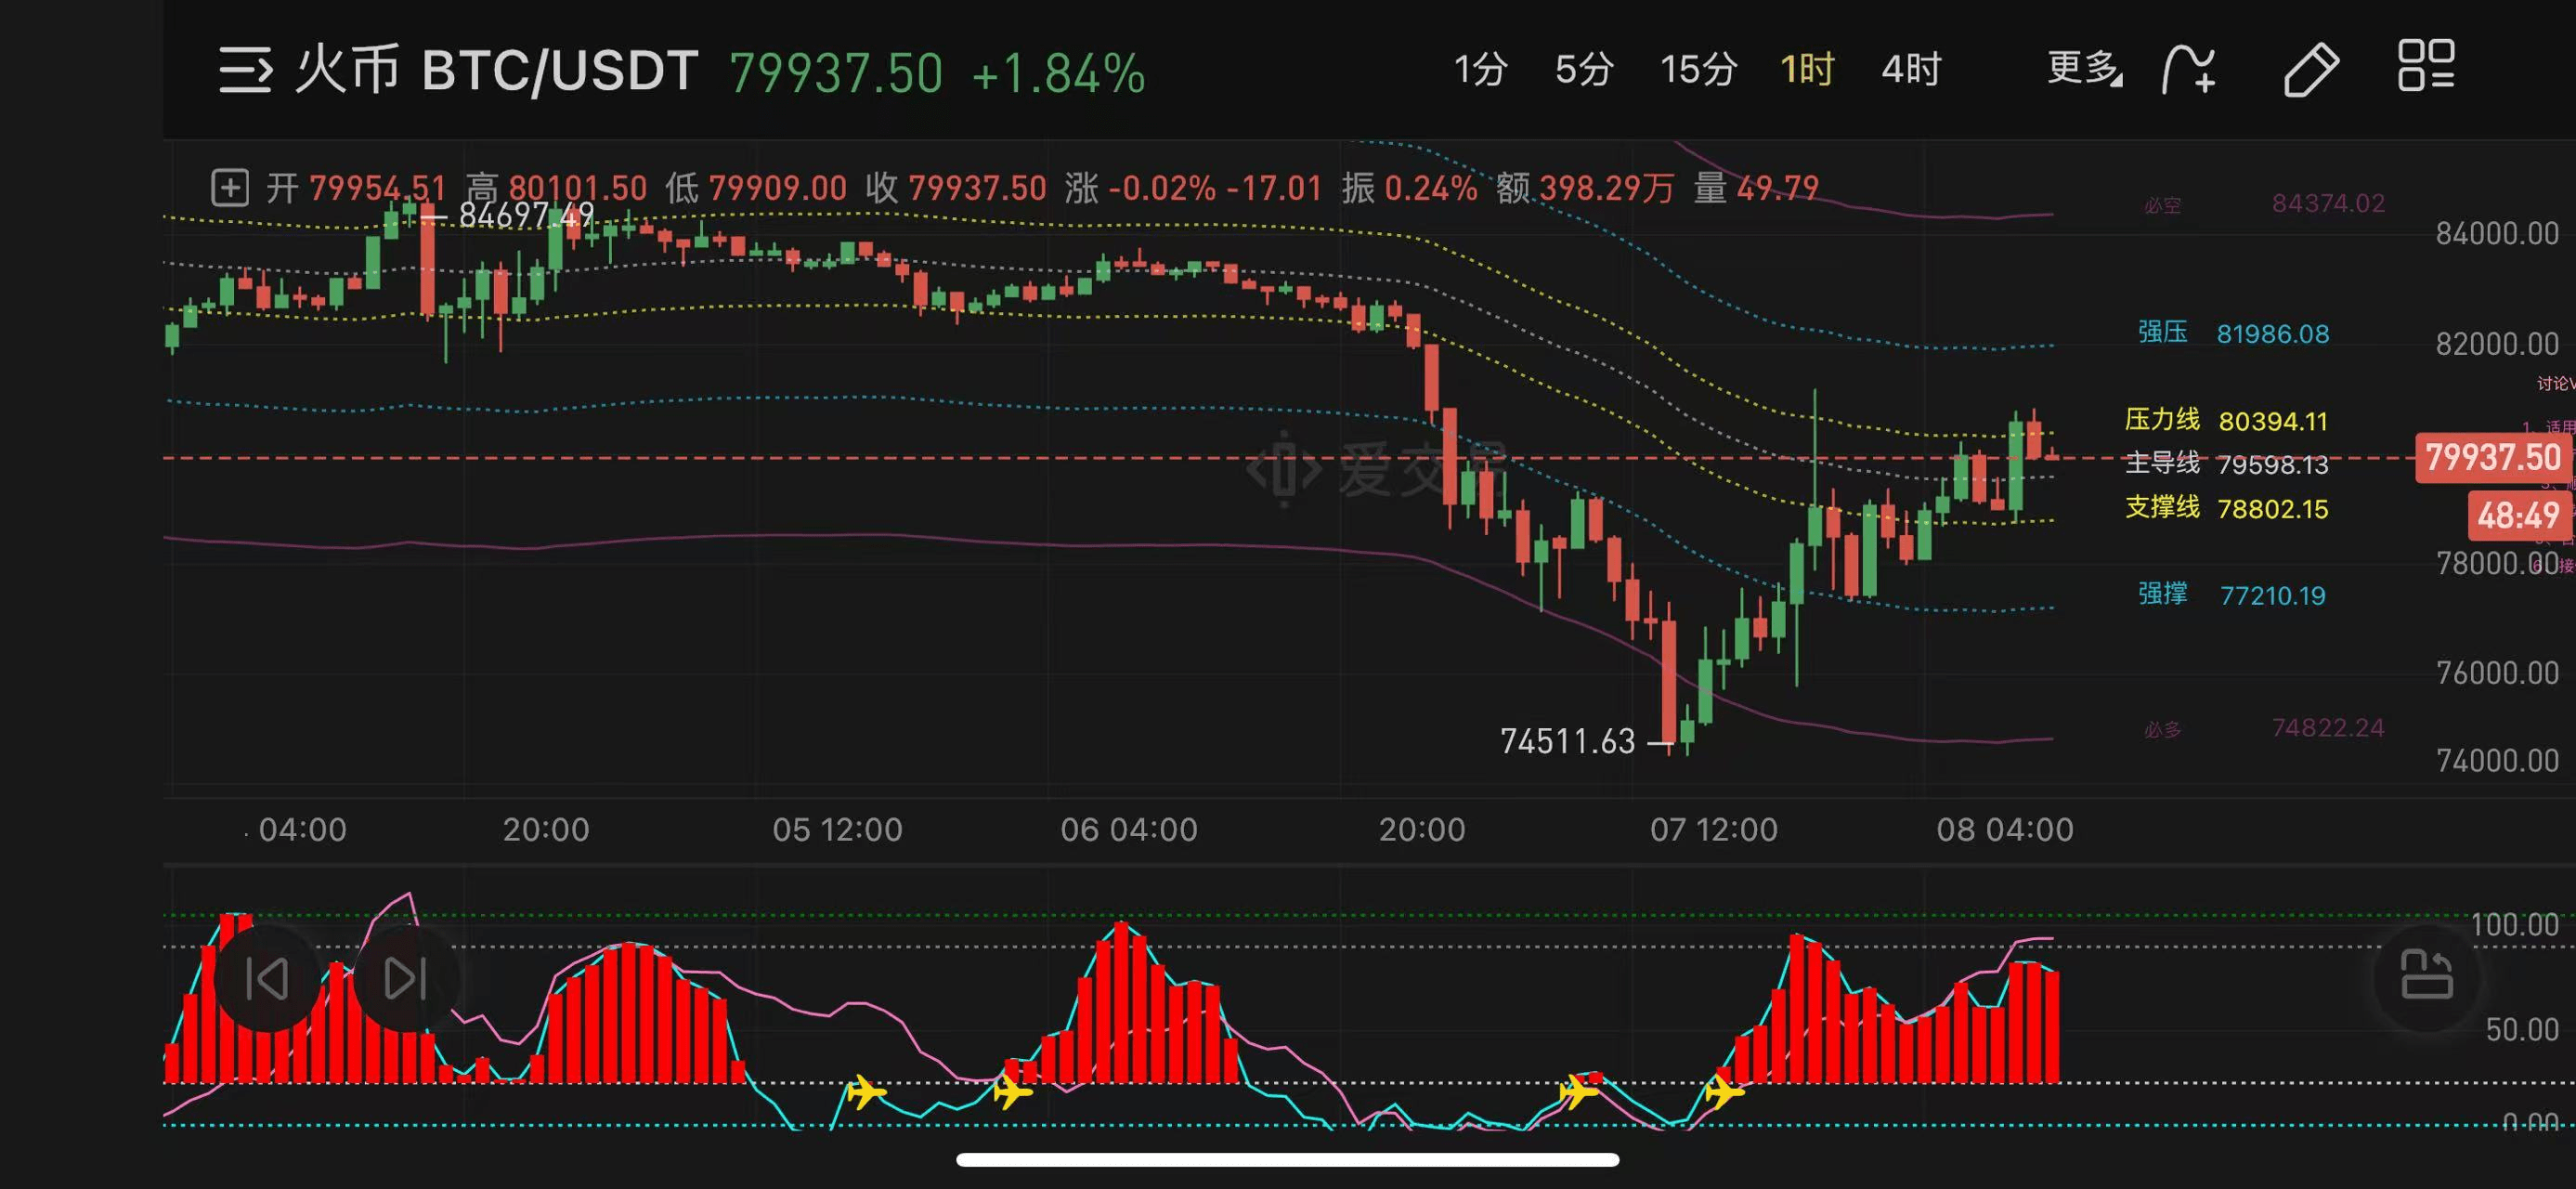
Bitcoin briefly surged to $81,172 on the evening of April 7 before quickly falling back, dropping to a low of $77,300 in the early morning, and then rebounding to around $81,200, but failing to effectively break through resistance, forming a 'false breakout' trap. Although there was a three-consecutive-hour candle rebound, the rebound range was only $3,000-4,000, and the trading volume did not significantly increase, indicating that bullish momentum remains weak.
• Key indicator verification: The 4-hour MACD fast and slow lines continue to be below the zero axis, with a shrinking rebound in the histogram, and the RSI briefly rebounding to 50 before turning down again, all indicating that the rebound is merely a technical correction and the trend has not reversed.
2. Resistance and support game logic.
• Upper pressure: $81,200-$81,500 (previous high conversion point + 4-hour EMA30 moving average) constitutes a strong short-term resistance. If it cannot break through, it confirms bearish dominance.
• Support below: $77,500 (previous low + psychological level) is the first line of defense. If broken, it may dip to $75,000-$73,800 (Fibonacci 61.8% retracement + institutional cost area).
Two, driving logic and market sentiment.
1. Macroeconomic bearish pressure suppresses rebound space.
The tariff policy imposed by the Trump administration on April 2 continues to ferment, and the global risk asset sell-off has not ceased, with Bitcoin as a highly volatile asset being the first to suffer. The expectation of interest rate cuts by the Federal Reserve is cooling (with only 120 basis points expected to be cut within the year), further weakening market risk appetite, leading funds to flow into safe-haven assets such as gold and U.S. Treasuries.
2. On-chain data warns of downside risks.
• Mining pressure: Bitcoin miners transferred out 24,000 BTC (about $1.85 billion) in a single day, reaching a new high since March 2020, leading to a surge in short-term supply pressure.
• Leverage liquidation threshold: If the price falls below $77,000, it may trigger the liquidation of 24,000 BTC longs, forming a vicious cycle of 'drop - liquidation - accelerated drop'.
Three, operational strategies and risk control recommendations.
1. Bearish dominant strategy.
• Shorting on rebound: If the price rebounds to the $81,200-$81,500 range, gradually set up short positions, with a stop loss above $82,500, targeting $77,500-$75,000.
• Conditions for shorting: If it directly breaks below $77,300, shorting near $78,000 is recommended, with a target of $73,800 (CME futures gap).
2. Bullish defense opportunities.
• Conditions for trying long: If the price stabilizes near $77,500 and the hourly RSI divergence is confirmed, a small position can be taken to try long, with a stop loss at $75,000 and a target of $79,500-$80,000.
3. Extreme market conditions contingency plan.
• Falling below $75,000: May trigger miner selling and institutional stop-loss, looking down to $70,000-$68,000 (2024 chip concentration area + Fibonacci 78.6% retracement).
• Breaking above $82,500: Needs to stabilize with volume and be accompanied by on-chain whale accumulation signals. A small position may be taken to try long, targeting $84,000-$85,000.
Four, key risk reminders.
1. Policy black swan: The U.S. CPI data will be released on April 10 (expected year-on-year increase of 3.1%), and if it exceeds expectations, it could trigger a volatility spike of over 150%.
2. Technical failure: (Beijing time 22:00 - next day 08:00) It is easy to see spike fluctuations, and one must beware of false breakouts.
3. Deteriorating sentiment: The Bitcoin Fear and Greed Index has dropped to 25 (extreme fear), approaching the low point of October 2024, increasing the risk of panic selling.
Summary: Currently, Bitcoin is in a weak oscillation phase dominated by bears, with a recommendation to mainly short on rebounds while cautiously participating in oversold rebounds. Focus on the effectiveness of resistance at $81,200 and support at $77,500, strictly control positions, and avoid volatility risks during macro data windows. Long-term investors may consider layout opportunities in the institutional cost area below $70,000 (e.g., MicroStrategy's average holding price of $77,400).