One, Current Market Structure and Key Levels
1. Price Dynamics and Technical Patterns
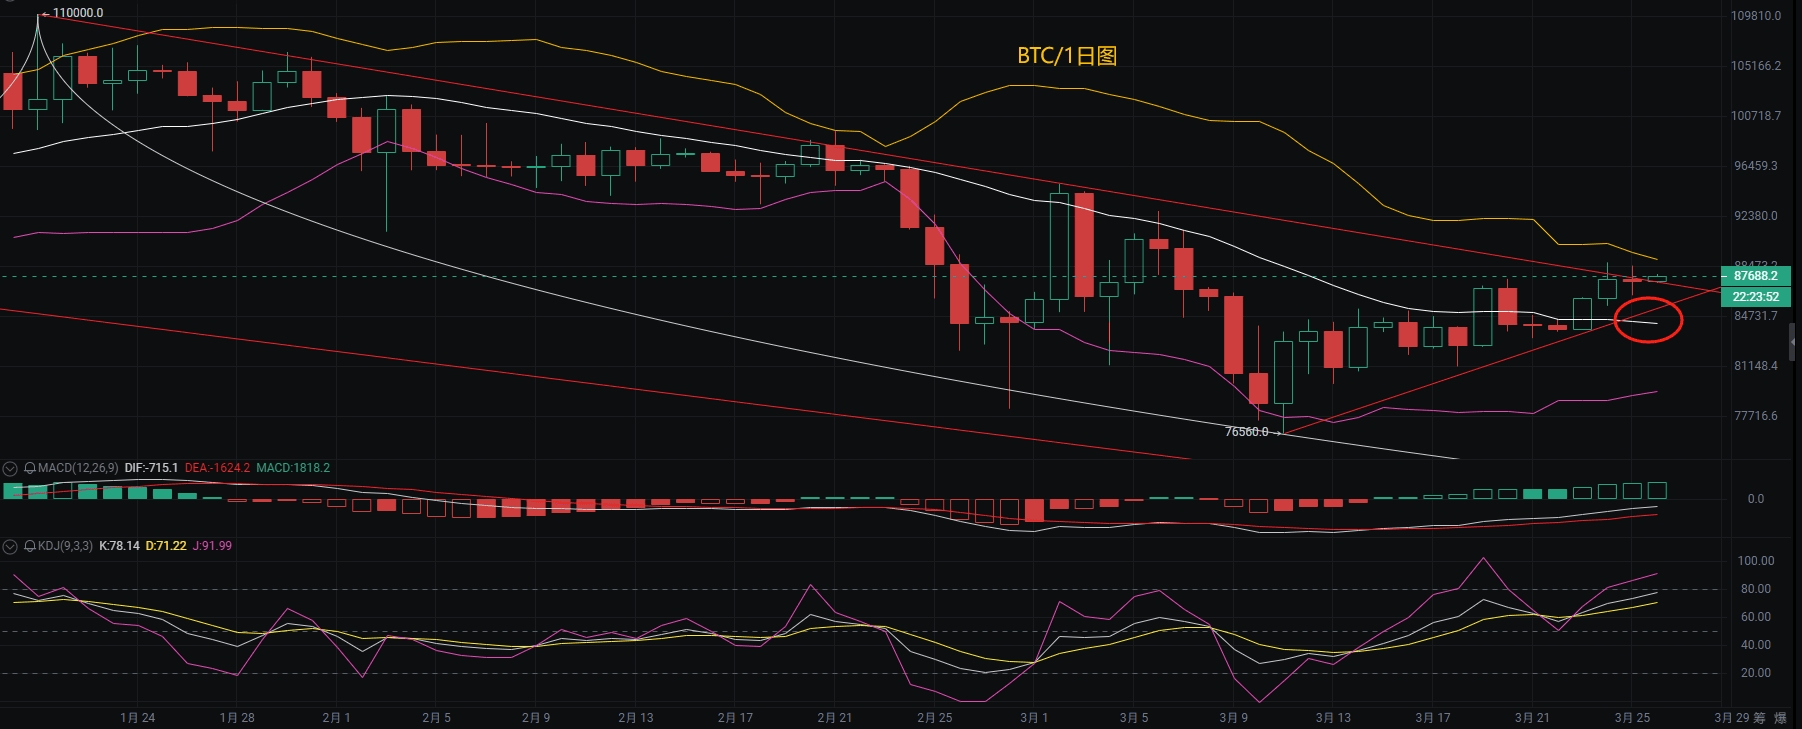
Bitcoin rebounded to $88,500 after testing the support at $86,200 yesterday, then fell back. The current price is fluctuating around $87,000. The daily level shows that the price failed to effectively break the previous high, indicating insufficient bullish momentum, and short-term may continue to consolidate at high levels.
· Support Level: $86,000-$86,500 (Bollinger band midline on the hourly chart, short-term strength and weakness boundary)
· Resistance Level: $88,500-$89,000 (previous high pressure area, upper Bollinger band on the daily chart)
2. Technical Indicator Signals
· Daily level: MACD bullish momentum bar is contracting, RSI (56) is in the neutral zone, indicating a lack of clear direction in the market.
· Hourly level: Bollinger bands are narrowing, prices are fluctuating around the midline, KDJ three lines are merging, indicating potential continuation of fluctuations in the short term.
· Pattern Characteristics: The 4-hour level forms a $88,500-$86,000 fluctuation box. If it breaks out, it may trigger a one-sided market.
Two, Focus of Long and Short Game and Market Catalysts
1. Short-term Driving Factors
· Policy Expectations: The Trump administration plans to announce details of tariff adjustments on April 2, and the market is highly observant. If the policy aligns with expectations, it may boost risk assets.
· Whale Movements: Mt. Gox exchange has recently transferred over $1 billion worth of Bitcoin, raising market concerns about potential selling pressure, but on-chain data shows that institutions (like MicroStrategy) are still increasing their holdings.
2. Capital and Sentiment Indicators
· ETF Capital Flow: Bitcoin spot ETF ended five consecutive weeks of net outflow, with a net inflow of $744 million in a single week, indicating a recovery in institutional confidence.
· Leverage Risk: The total contract positions across the network remain high, with short positions exceeding 60%. If the price falls below $86,000, it may trigger large-scale liquidations.
Three, Operational Strategies and Risk Control Suggestions
1. Range Fluctuation Strategy
· Bullish Opportunities:
· Buy lightly on the dip to the $86,000-$86,500 support area, targeting $87,500-$88,500, with a stop loss at $84,500.
· If it breaks out with volume above $88,500, buy on the dip to $87,000, targeting $89,000-$90,000.
· Bearish Defense:
· Position short in the $88,500-$89,000 resistance area, targeting $86,500-$86,000, with a stop loss at $90,000.
· If it breaks below $86,000, short with a target of $84,500-$83,500 (CME gap filling area).
2. Key Points for Risk Control
· Position Management: Single position not exceeding 5% of total capital, stop loss range controlled at 1%-2%.
· Beware of False Breakouts: If the price briefly breaks through support/resistance and then quickly reverses, it's necessary to exit and observe.
Four, Key Events and Long-term Trends
1. Policy Implementation Window
After the announcement of the tariff policy on April 2, market uncertainty will gradually diminish. If the policy is relaxed, Bitcoin may initiate a new round of increases; if it tightens beyond expectations, we need to guard against the risk of a pullback to $83,500 or even $73,000.
2. Expectations for Technical Upgrades
The Ethereum Prague upgrade testnet deployment is complete. If progress is smooth, it may drive ETH to break through the $2,100 resistance, indirectly enhancing Bitcoin market sentiment.
Summary: Bitcoin is currently in the $86,000-$88,500 fluctuation range. The strategy should focus on shorting high and longing low, and follow the trend after a breakout. It is essential to pay attention to policy implementation, whale selling pressure, and ETF capital flow, and strictly set stop losses to guard against black swan events. In the medium to long term, it is still supported by the halving cycle, institutional buying, and macro liquidity. A pullback below $83,500 can be seen as an opportunity for long-term positioning.

