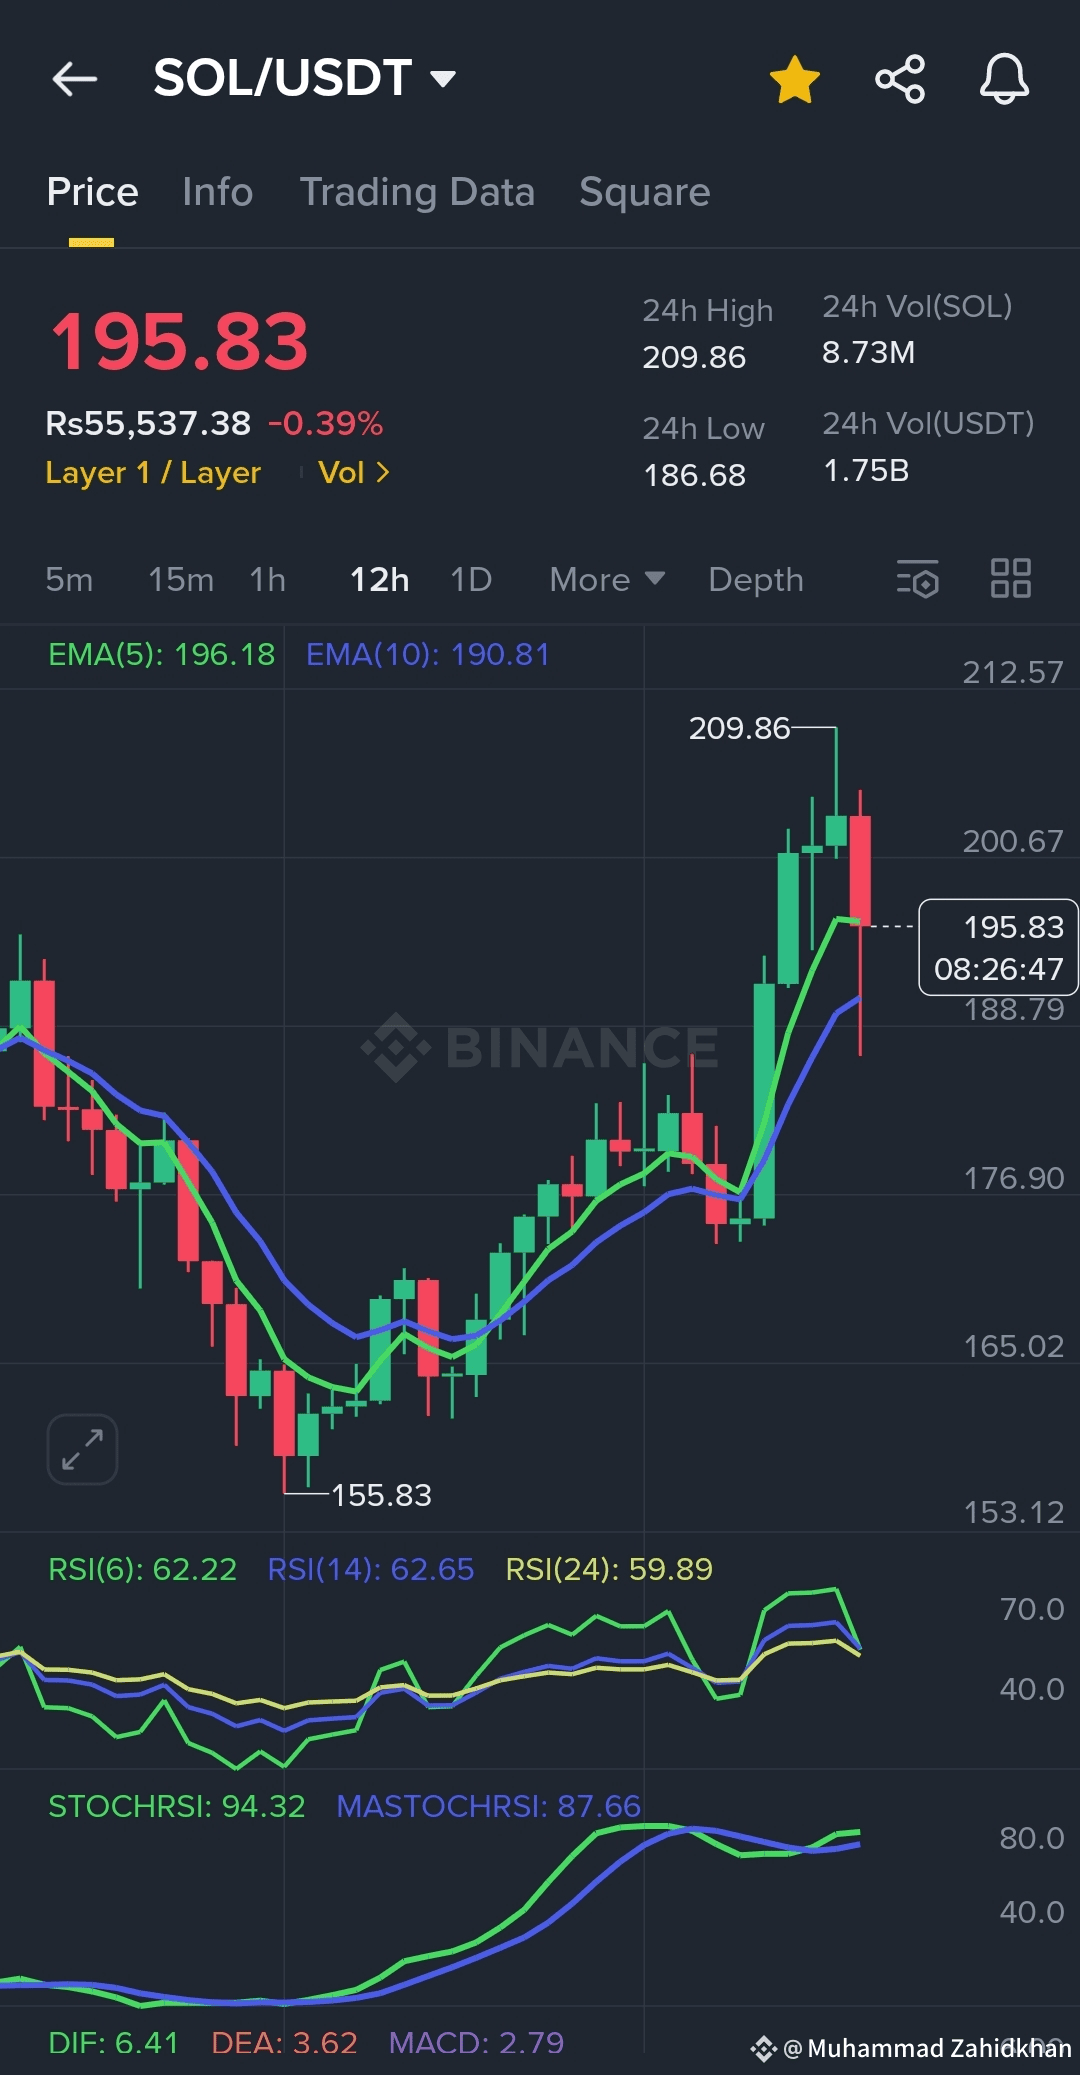
By deeply analyzing SOL/USDT on the 12-hour chart:
- Price dropped from a high of 209.86 to 195.83, showing a sharp pullback.
- EMA(5) at 196.18 is just above EMA(10) at 190.81, indicating short-term bullish bias still intact despite the correction.
- RSI(14) around 62.65 shows moderate strength, not oversold or overbought—room to move both ways.
- StochRSI very high at 94.32 suggests SOL is temporarily overbought, so a further short-term dip or consolidation is likely.
- MACD positive (DIF 6.41 > DEA 3.62) with rising momentum but may slow down due to RSI/StochRSI.
Outlook: SOL will likely consolidate or dip a bit before attempting to retest the $210 resistance.
- Support to watch near $190–$192 (EMA10 zone).
- Resistance near $210–$212.
Trade plan:
- Entry: Wait for price to stabilize near $190–$192 with bullish reversal signs.
- Take Profit (TP): $210–$212 on next rebound.
- Stop Loss (SL): Below $188 to limit downside risk.