

#foryoupage
foryoupage
1.4M views
2,419 Discussing
Hot
Latest

·
--
#flo📅 DAY 15/30 — PRECISION OVER EMOTION 🎯$BTC
Smart traders don’t chase entries.
They wait for the market to prove the setup.
Before every trade:
• Structure → Clear
• Liquidity → Confirmed
• Level → Respected
• Confirmation → Valid
• Risk → Controlled
No clear confirmation?
No trade.
Because in trading,
discipline creates consistency — not excitement.
🧠 Think less.
🎯 Wait more.
📊 Execute with precision.
Trade the setup. Never the emotion #BTC #Ethereum #foryoupage
1
115

·
--
Bullish
This long trade setup for $SOL /USDT features a defined entry range and a clear risk-to-reward layout. Here is the breakdown of the setup:
Trade Parameters
* Pair: $SOL /USDT
* Direction: Long
* Entry Zone: $95.00 – $96.90
* Stop Loss (SL): $94.50
* Take Profit Targets (TP): $98.10 – $99.00
Risk & Reward Breakdown
* Risk per SOL: $0.50 to $2.40 (depending on whether your entry fills near $95.00 or $96.90).
* Target Reward per SOL: $1.20 to $4.00 (from entry to TP2).
* Risk-to-Reward Ratio: Strongest if filled near the lower end around $95.00 (~1:8 down to TP2), but narrows to around 1:0.5 if filled at $96.90 targeting TP1 ($98.10).
With the stop loss set at $94.50, an entry near $95.00 leaves only $0.50 of breathing room, meaning minor market noise could trigger the stop prematurely.
To help evaluate this trade further:
* What timeframe (e.g., 5-min, 15-min) are you using to confirm support in the $95.00–$96.90 zone?
* What percentage of your total trading capital are you allocating to risk on this position?
{spot}(SOLUSDT)
#SOL #Binance #foryoupage
This long trade setup for $SOL /USDT features a defined entry range and a clear risk-to-reward layout. Here is the breakdown of the setup:
Trade Parameters
* Pair: $SOL /USDT
* Direction: Long
* Entry Zone: $95.00 – $96.90
* Stop Loss (SL): $94.50
* Take Profit Targets (TP): $98.10 – $99.00
Risk & Reward Breakdown
* Risk per SOL: $0.50 to $2.40 (depending on whether your entry fills near $95.00 or $96.90).
* Target Reward per SOL: $1.20 to $4.00 (from entry to TP2).
* Risk-to-Reward Ratio: Strongest if filled near the lower end around $95.00 (~1:8 down to TP2), but narrows to around 1:0.5 if filled at $96.90 targeting TP1 ($98.10).
With the stop loss set at $94.50, an entry near $95.00 leaves only $0.50 of breathing room, meaning minor market noise could trigger the stop prematurely.
To help evaluate this trade further:
* What timeframe (e.g., 5-min, 15-min) are you using to confirm support in the $95.00–$96.90 zone?
* What percentage of your total trading capital are you allocating to risk on this position?
#SOL #Binance #foryoupage
1
59
·
--
please koi guide kare ke ye Jo 98% usdt hai ye mujhe mile gay be ya margin Kisi ne wapis le lene hai#foryoupage #USDT
please koi guide kare ke ye Jo 98% usdt hai ye mujhe mile gay be ya margin Kisi ne wapis le lene hai#foryoupage #USDT
92

·
--
$SOL : +0.5% Solana saw modest gains, with proposals to increase block compute limits and introduce resource inclusion fees moving forward.#GoldRisesForThirdDay #solana #foryoupage #GoldRisesForThirdDay
$SOL : +0.5% Solana saw modest gains, with proposals to increase block compute limits and introduce resource inclusion fees moving forward.#GoldRisesForThirdDay #solana #foryoupage #GoldRisesForThirdDay
1
84

·
--
Bullish
$SYN is leading today’s gainers with +67% in 24H. Chasing pumps is risky. Waiting for a healthy pullback and confirmation is the professional approach.
📍Entry: $0.255-$0.260
🎯 TP1: $0.280 | TP2: $0.300
🛑 SL: $0.245
Trade probabilities, not emotions. #SYN #BinanceSquare #foryoupage
{future}(SYNUSDT)
$SYN is leading today’s gainers with +67% in 24H. Chasing pumps is risky. Waiting for a healthy pullback and confirmation is the professional approach.
📍Entry: $0.255-$0.260
🎯 TP1: $0.280 | TP2: $0.300
🛑 SL: $0.245
Trade probabilities, not emotions. #SYN #BinanceSquare #foryoupage
📍Entry: $0.255-$0.260
🎯 TP1: $0.280 | TP2: $0.300
🛑 SL: $0.245
Trade probabilities, not emotions. #SYN #BinanceSquare #foryoupage
1
126

·
--
Bearish
$VELVET
{future}(VELVETUSDT)
Best Target Achieved My Entry Point 1.7
Last Target 0.5 📊 That's Perfect Entry and Holding
#FYp #foryoupage #Whalescrypto #Velvet
$VELVET
Best Target Achieved My Entry Point 1.7
Last Target 0.5 📊 That's Perfect Entry and Holding
#FYp #foryoupage #Whalescrypto #Velvet
Best Target Achieved My Entry Point 1.7
Last Target 0.5 📊 That's Perfect Entry and Holding
#FYp #foryoupage #Whalescrypto #Velvet
2
1
3
1.4k
·
--
Bearish
$DEXE UNBELIEVABLE 🐐
{future}(DEXEUSDT)
Best Target Achieved My Entry Point 28.0
Last Target 4$ 📊 That's Perfect Entry and Holding
#FYp #foryoupage #Whalescrypto #DEXE/USDT
$DEXE UNBELIEVABLE 🐐
Best Target Achieved My Entry Point 28.0
Last Target 4$ 📊 That's Perfect Entry and Holding
#FYp #foryoupage #Whalescrypto #DEXE/USDT
Best Target Achieved My Entry Point 28.0
Last Target 4$ 📊 That's Perfect Entry and Holding
#FYp #foryoupage #Whalescrypto #DEXE/USDT
211

·
--
Bearish
$TIA
Celestia ($TIA ): Up 59% in Four Weeks, Can It Hold Its 2026 High?
Celestia (TIA) is a modular blockchain network that gets relatively little mainstream attention. After months of drifting in a range, it has just broken to its highest price of 2026.
The Sudden Surge
On October 19, TIA jumped 16% to about $0.68, a 2026 high, extending its four-week gain to roughly 59%. It was part of a wider altcoin move. Four in five members of the CoinDesk 100 moved higher, and the Altcoin Season Index rose from 50 to 60 in a single session.
The Technical Breakout
For months TIA was stuck below one ceiling. An earlier analysis described a multi-quarter range between roughly $0.28 and $0.65. The move to about $0.68 puts the price above the top of that range for the first time this year. (pumpparade)
The Earlier Slump
The rally started from a weak base. On June 23, TIA traded at $0.3819 and sat below its 20, 50, 100 and 200-day averages, with an RSI of 27.77 that signaled oversold conditions. From there to $0.68 is a gain of roughly 78%. The all-time high is $20.91, set on February 10, 2024, so the price is still about 97% below its peak. (coindcx) (thenewscrypto)
Today's Situation (Latest Data, October 19)
$TIA was near $0.68, while the rest of the market was not moving together. Starknet fell 9.6% and Stacks fell 4.2% on the same day. (que)
Support: The $0.65 range top, which analysts say TIA needs to reclaim and hold. (pumpparade)
Resistance: $0.85, the next level to break on rising volume. (pumpparade)
Caution: The move came in a single large daily candle. A fast rise like this often gets retested before it continues.
Final Word
The key question is whether TIA can hold above $0.65 and push toward $0.85, or whether the move fades back into the old range. One analysis in March noted that Celestia was handling nearly 40% of rollup data in the modular space despite a market cap of about $400 million. Strong usage does not guarantee a strong price, though.
{future}(TIAUSDT)
#TIA🔥🔥🔥 #foryoupage #Crypto_Jobs🎯
$TIA
Celestia ($TIA ): Up 59% in Four Weeks, Can It Hold Its 2026 High?
Celestia (TIA) is a modular blockchain network that gets relatively little mainstream attention. After months of drifting in a range, it has just broken to its highest price of 2026.
The Sudden Surge
On October 19, TIA jumped 16% to about $0.68, a 2026 high, extending its four-week gain to roughly 59%. It was part of a wider altcoin move. Four in five members of the CoinDesk 100 moved higher, and the Altcoin Season Index rose from 50 to 60 in a single session.
The Technical Breakout
For months TIA was stuck below one ceiling. An earlier analysis described a multi-quarter range between roughly $0.28 and $0.65. The move to about $0.68 puts the price above the top of that range for the first time this year. (pumpparade)
The Earlier Slump
The rally started from a weak base. On June 23, TIA traded at $0.3819 and sat below its 20, 50, 100 and 200-day averages, with an RSI of 27.77 that signaled oversold conditions. From there to $0.68 is a gain of roughly 78%. The all-time high is $20.91, set on February 10, 2024, so the price is still about 97% below its peak. (coindcx) (thenewscrypto)
Today's Situation (Latest Data, October 19)
$TIA was near $0.68, while the rest of the market was not moving together. Starknet fell 9.6% and Stacks fell 4.2% on the same day. (que)
Support: The $0.65 range top, which analysts say TIA needs to reclaim and hold. (pumpparade)
Resistance: $0.85, the next level to break on rising volume. (pumpparade)
Caution: The move came in a single large daily candle. A fast rise like this often gets retested before it continues.
Final Word
The key question is whether TIA can hold above $0.65 and push toward $0.85, or whether the move fades back into the old range. One analysis in March noted that Celestia was handling nearly 40% of rollup data in the modular space despite a market cap of about $400 million. Strong usage does not guarantee a strong price, though.
#TIA🔥🔥🔥 #foryoupage #Crypto_Jobs🎯
607

Partly True
$QNT
Quant ($QNT ): Nearly 4x in One Month, Where Does It Stand Now?
Quant (QNT) is a relatively under-discussed coin. It ranks 40th by market cap, but its price has recently moved in an unusual way.
The Sudden Surge
In under 30 days, QNT rose from about $64 to about $357. On September 25, the price jumped about 40% in a day after The Clearing House chose Quant for its On-Chain Money Initiative. The late-September high was $373.66. (Latest Quant (QNT) Price Analysis +2)
The Technical Breakout
On the weekly chart, QNT broke above three lower highs, at $101.87, $131.58 and $160.70. This was the most important technical event of the rally. (cryptorank)
The Pullback
After the rally, profit-taking pushed the price down. On October 12, QNT fell about 6% in a day to $228. On October 19 the price was about $189.57, with a 24-hour low of $182.10 and a high of $199.48. That is about 49% below the peak. (coinmarketcap) (bybit)
Today's Situation (October 20)
$QNT has bounced from $182 and is back near $200. The picture is still mixed: (bravenewcoin)
Support: The $170–$200 zone. A drop below $170 would point to about $140 next. (tokenpost)
Resistance: $208 to $224. (bravenewcoin)
Caution: One analyst says the structure is still bearish because the price is below key EMAs. (bravenewcoin)
Final Word
QNT has a market cap of about $2.76 billion, and its circulating supply is about 14.56 million. The low supply means the price can move fast. The key question now is whether QNT can hold the $170–$200 support and win back $250.
{spot}(QNTUSDT)
#QNT/USDT #cryptouniverseofficial #foryoupage
$QNT
Quant ($QNT ): Nearly 4x in One Month, Where Does It Stand Now?
Quant (QNT) is a relatively under-discussed coin. It ranks 40th by market cap, but its price has recently moved in an unusual way.
The Sudden Surge
In under 30 days, QNT rose from about $64 to about $357. On September 25, the price jumped about 40% in a day after The Clearing House chose Quant for its On-Chain Money Initiative. The late-September high was $373.66. (Latest Quant (QNT) Price Analysis +2)
The Technical Breakout
On the weekly chart, QNT broke above three lower highs, at $101.87, $131.58 and $160.70. This was the most important technical event of the rally. (cryptorank)
The Pullback
After the rally, profit-taking pushed the price down. On October 12, QNT fell about 6% in a day to $228. On October 19 the price was about $189.57, with a 24-hour low of $182.10 and a high of $199.48. That is about 49% below the peak. (coinmarketcap) (bybit)
Today's Situation (October 20)
$QNT has bounced from $182 and is back near $200. The picture is still mixed: (bravenewcoin)
Support: The $170–$200 zone. A drop below $170 would point to about $140 next. (tokenpost)
Resistance: $208 to $224. (bravenewcoin)
Caution: One analyst says the structure is still bearish because the price is below key EMAs. (bravenewcoin)
Final Word
QNT has a market cap of about $2.76 billion, and its circulating supply is about 14.56 million. The low supply means the price can move fast. The key question now is whether QNT can hold the $170–$200 support and win back $250.
#QNT/USDT #cryptouniverseofficial #foryoupage
930

$BTC Bitcoin Market Analysis
Bitcoin continues to exhibit high volatility, trading within a closely watched consolidation range as market participants weigh macroeconomic signals and institutional liquidity trends.
Key Resistance: Breaking and sustaining above immediate overhead resistance remains crucial for confirming a stronger bullish continuation.
Support Levels: Strong buyer interest continues to defend lower support zones, cushioning against sharp pullbacks.
Outlook: Short-term momentum suggests sideways-to-cautiously-optimistic movement as traders look for clearer volume breakouts and macroeconomic direction.
{spot}(BTCUSDT)
#EarningsSeason
#foryoupage #FIT21
$BTC Bitcoin Market Analysis
Bitcoin continues to exhibit high volatility, trading within a closely watched consolidation range as market participants weigh macroeconomic signals and institutional liquidity trends.
Key Resistance: Breaking and sustaining above immediate overhead resistance remains crucial for confirming a stronger bullish continuation.
Support Levels: Strong buyer interest continues to defend lower support zones, cushioning against sharp pullbacks.
Outlook: Short-term momentum suggests sideways-to-cautiously-optimistic movement as traders look for clearer volume breakouts and macroeconomic direction.
#EarningsSeason
#foryoupage #FIT21
73


·
--
🚀 Read, Learn & Earn on Binance Square!
Are you looking for ways to expand your crypto knowledge while earning rewards? 💡 Look no further!
On Binance Square, you can stay up-to-date with the latest crypto trends and insights, and get rewarded for your learning.
Start reading, increasing your crypto know-how, and earning rewards today! ✨
#BinanceSquare #ReadToEarn #CryptoEducation #BNB #WOTD #Follow_Like_Comment #foryou #foryoupage #BTC☀️
Vintage Leo:
Learn & Earn
2
2


·
--
📈 Bullish Outlook: If buying momentum strengthens and ZEC breaks through resistance, another recovery could develop.
#ZECUSDT #foryoupage #bitcoin
📈 Bullish Outlook: If buying momentum strengthens and ZEC breaks through resistance, another recovery could develop.
#ZECUSDT #foryoupage #bitcoin
#ZECUSDT #foryoupage #bitcoin
128
·
--
Bearish
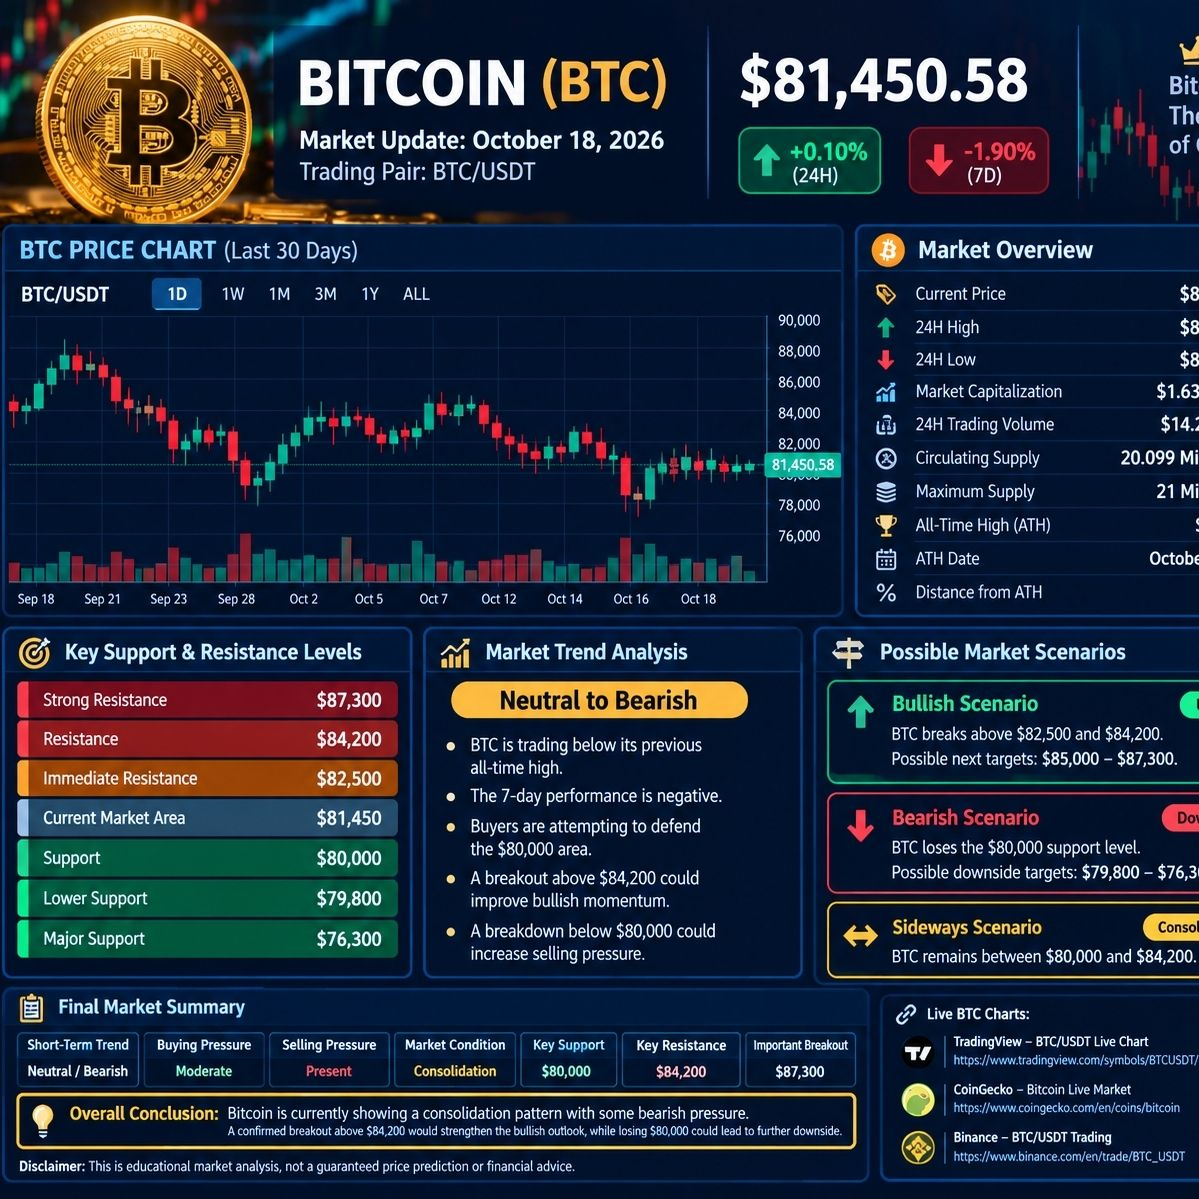
ATM COIN – CURRENT MARKET ANALYSIS
Market Update: October 18, 2026 | Coin: Atletico Madrid Fan Token (ATM) | Pair: ATM/USDT
ATM Market Overview
Market Indicator Current Data
Current Price $0.9849
24H High $1.09
24H Low $0.9781
Market Capitalization $8.93 Million
24H Trading Volume $4.55 Million
Circulating Supply 9.07 Million ATM
Maximum Supply 10 Million ATM
24H Change -1.04%
7D Change -5.30%
30D Change -8.56%
@Ethereum_official @Square-Creator-a6b19761fc5e5 @Square-Creator-1ad6e6b2ddcd @FINANCIEREDUNOGENTAISAVIS @wgocrypto @Square-Creator-283899cdaf8d @bityup @Square-Creator-bc2271489e34 @Irin111 @everyone #foryou #foryoupage #StrategySharesFall9%OnFriday #ElSalvadorBitcoinHoldingsSurpass7800BTC #USPPIRises6.3%YearOverYear @liquiditygoblin
{spot}(ATMUSDT)
ATM COIN – CURRENT MARKET ANALYSIS
Market Update: October 18, 2026 | Coin: Atletico Madrid Fan Token (ATM) | Pair: ATM/USDT
ATM Market Overview
Market Indicator Current Data
Current Price $0.9849
24H High $1.09
24H Low $0.9781
Market Capitalization $8.93 Million
24H Trading Volume $4.55 Million
Circulating Supply 9.07 Million ATM
Maximum Supply 10 Million ATM
24H Change -1.04%
7D Change -5.30%
30D Change -8.56%
@Ethereum @BTC @老狗现货合约社区 @Professeur ALPHA @Trend Coin @Crypto- Master1 @Bityup @Jemiaktar111 @Crypto Mamma @everyone #foryou #foryoupage #StrategySharesFall9%OnFriday #ElSalvadorBitcoinHoldingsSurpass7800BTC #USPPIRises6.3%YearOverYear @Liquidity Goblin
294
Bullish📈
48%
Bearish📉
46%
sidewise ---
6%
35 votes • Voting closed
276

·
--
Hey everyone! 👋😂
I have $120 and I’m thinking about investing in Binance Futures. I’m here to ask the community for some advice. What should I learn before starting, and what strategies would you recommend for a beginner?
Like everyone else, I’m trying to make some money and improve my life. 😂💰
Any tips, advice, or lessons from your own experience would be greatly appreciated. Let’s help each other grow! 🚀❤️
Thank you, Binance community! 🙏#Binance #FutureTarding #foryoupage #RichardTeng #helpmeplease
46

🚨 DID YOU KNOW? Bitcoin has a hard supply limit!
₿ Bitcoin's protocol sets its maximum supply at 21 million BTC.
Unlike currencies that can be issued by central banks, Bitcoin follows rules built into its protocol.
But remember: limited supply does NOT guarantee a rising price. Demand, market sentiment, and many other factors matter.
💬 What interests you more about Bitcoin: its technology or its limited supply?
#Bitcoin #BİNANCESQUARE #foryoupage
78
Log in to explore more content
Join global crypto users on Binance Square
⚡️ Get latest and useful information about crypto.
💬 Trusted by the world’s largest crypto exchange.
👍 Discover real insights from verified creators.
Email / Phone number
Trending Topics
1
#EarningsSeason
2.2M views
10,715 Discussing
2
#BitcoinDropsBelow$84K
15 views
20 Discussing
3
#FirstUNIBlockTradeViaRegulatedTradFiChannelCompleted
165 views
12 Discussing
4
#ZcashDevelopersConfirmNovemberDateForNU7Upgrade
58,381 views
1,001 Discussing
5
#OCCIssuesFirstFinalRuleUnderGENIUSAct
48,743 views
830 Discussing
6
#TrumpExpectedToOutlineCrackdownOnOverseasCryptoScams
11,476 views
97 Discussing
7
#KoreanRetailLost6.3TrillionWonOnLeveragedETPs
56,184 views
695 Discussing
8
#GENIUSActExpectedToTakeEffectJan18,2027
0 views
0 Discussing
9
#SolanaSetToActivateAlpenglowToday
34,198 views
439 Discussing
10
#PolkadotFoundationWarnsFearlessWalletExtensionLeakedPrivateKeys
1,240 views
35 Discussing