
#usaugustppiyoyrisesto5
usaugustppiyoyrisesto5
446 views
35 Discussing
Hot
Latest

·
--
Why is nobody talking about what a 5% PPI actually signals for risk assets right now?
Traders keep loading $DOT and $STX on every bounce, then sit through the drawdown when inflation data reminds the Fed it still has work to do. The real issue is getting stuck in positions with no clear exit because the tape looks greedy.
This August print is a useful case study. The year-over-year number hitting 5% is elevated no matter how you spin the monthly miss. Historically that kind of producer inflation has kept policy tighter and pushed flows into $USDT as people reduced risk. Alts feel it quicker. With greed sitting at 68, the market is set up to overreact once the less-than-expected headlines fade.
I think the consensus that this is already priced in is too convenient. Macro data like this still moves the needle, especially when positioning is this one-sided.
Where do you think this goes from here?
#USAugustPPIYoYRisesTo5 #USAugustPPIRisesLessThanExpected #USContinuingJoblessClaims1
Why is nobody talking about what a 5% PPI actually signals for risk assets right now?
Traders keep loading $DOT and $STX on every bounce, then sit through the drawdown when inflation data reminds the Fed it still has work to do. The real issue is getting stuck in positions with no clear exit because the tape looks greedy.
This August print is a useful case study. The year-over-year number hitting 5% is elevated no matter how you spin the monthly miss. Historically that kind of producer inflation has kept policy tighter and pushed flows into $USDT as people reduced risk. Alts feel it quicker. With greed sitting at 68, the market is set up to overreact once the less-than-expected headlines fade.
I think the consensus that this is already priced in is too convenient. Macro data like this still moves the needle, especially when positioning is this one-sided.
Where do you think this goes from here?
#USAugustPPIYoYRisesTo5 #USAugustPPIRisesLessThanExpected #USContinuingJoblessClaims1
Traders keep loading $DOT and $STX on every bounce, then sit through the drawdown when inflation data reminds the Fed it still has work to do. The real issue is getting stuck in positions with no clear exit because the tape looks greedy.
This August print is a useful case study. The year-over-year number hitting 5% is elevated no matter how you spin the monthly miss. Historically that kind of producer inflation has kept policy tighter and pushed flows into $USDT as people reduced risk. Alts feel it quicker. With greed sitting at 68, the market is set up to overreact once the less-than-expected headlines fade.
I think the consensus that this is already priced in is too convenient. Macro data like this still moves the needle, especially when positioning is this one-sided.
Where do you think this goes from here?
#USAugustPPIYoYRisesTo5 #USAugustPPIRisesLessThanExpected #USContinuingJoblessClaims1
57

Picture this: macro headlines flash red with hot inflation numbers, and within minutes, leveraged long positions get wiped out across the board.
Most traders panic sell their spot bags or rush to hedge with $USDT right at the local bottom, only to watch prices rebound a day later. It is a painful cycle of getting chopped up simply because you reacted to the headline instead of understanding the underlying mechanics.
When August PPI year-over-year came in hotter at 5%, the immediate knee-jerk reaction mirrored what we saw during the aggressive rate hike cycles back in 2022. Back then, every percentage point jump in producer prices sent institutional capital fleeing into cash, draining liquidity from risk assets and ecosystem tokens like $DOT. Everyone assumed history would repeat itself with another brutal cascade down.
Yet looking closer at the details, wholesale cost pressures are behaving quite differently this time around. While headline numbers surged, the underlying momentum showed signs of cooling, meaning the broader macroeconomic trajectory is far less severe than the initial shock suggested. Patient capital used the brief dip to quietly accumulate infrastructure plays like $STX rather than fleeing the room.
Are you repositioning your portfolio for prolonged inflation, or do you view these macro dips as prime accumulation zones?
#USAugustPPIYoYRisesTo5 #USAugustPPIRisesLessThanExpected #ECBRaisesRatesSecondTimeTo2
Picture this: macro headlines flash red with hot inflation numbers, and within minutes, leveraged long positions get wiped out across the board.
Most traders panic sell their spot bags or rush to hedge with $USDT right at the local bottom, only to watch prices rebound a day later. It is a painful cycle of getting chopped up simply because you reacted to the headline instead of understanding the underlying mechanics.
When August PPI year-over-year came in hotter at 5%, the immediate knee-jerk reaction mirrored what we saw during the aggressive rate hike cycles back in 2022. Back then, every percentage point jump in producer prices sent institutional capital fleeing into cash, draining liquidity from risk assets and ecosystem tokens like $DOT . Everyone assumed history would repeat itself with another brutal cascade down.
Yet looking closer at the details, wholesale cost pressures are behaving quite differently this time around. While headline numbers surged, the underlying momentum showed signs of cooling, meaning the broader macroeconomic trajectory is far less severe than the initial shock suggested. Patient capital used the brief dip to quietly accumulate infrastructure plays like $STX rather than fleeing the room.
Are you repositioning your portfolio for prolonged inflation, or do you view these macro dips as prime accumulation zones?
#USAugustPPIYoYRisesTo5 #USAugustPPIRisesLessThanExpected #ECBRaisesRatesSecondTimeTo2
Most traders panic sell their spot bags or rush to hedge with $USDT right at the local bottom, only to watch prices rebound a day later. It is a painful cycle of getting chopped up simply because you reacted to the headline instead of understanding the underlying mechanics.
When August PPI year-over-year came in hotter at 5%, the immediate knee-jerk reaction mirrored what we saw during the aggressive rate hike cycles back in 2022. Back then, every percentage point jump in producer prices sent institutional capital fleeing into cash, draining liquidity from risk assets and ecosystem tokens like $DOT . Everyone assumed history would repeat itself with another brutal cascade down.
Yet looking closer at the details, wholesale cost pressures are behaving quite differently this time around. While headline numbers surged, the underlying momentum showed signs of cooling, meaning the broader macroeconomic trajectory is far less severe than the initial shock suggested. Patient capital used the brief dip to quietly accumulate infrastructure plays like $STX rather than fleeing the room.
Are you repositioning your portfolio for prolonged inflation, or do you view these macro dips as prime accumulation zones?
#USAugustPPIYoYRisesTo5 #USAugustPPIRisesLessThanExpected #ECBRaisesRatesSecondTimeTo2

64

·
--
If you are still front-running rate cut headlines by longing every single macro data release, stop now.
Rushing into high-leverage positions before the market digests the full picture is the easiest way to get liquidated on fakeout wicks. Missing a cleaner entry hurts, but watching your margin vanish in minutes is far worse.
The latest PPI print coming in cooler than forecast has traders divided. The hyper-bulls are celebrating, convinced that lower wholesale costs guarantee aggressive easing and an immediate capital rotation out of idle $USDT. On the other side, skeptics argue that underlying service inflation is still sticky enough to keep central banks cautious, meaning the initial spike could easily turn into a liquidity trap.
Looking at the broader structure, I side with the bulls on this one. Wholesale price relief is the clearest leading indicator that consumer price pressures are fading, which creates the macro breathing room needed for capital to flow into layer-1 ecosystems like $DOT and infrastructure plays like $STX. The volatility might shake out weak hands first, but the monetary trajectory is clearly shifting toward expansion.
Where do you think smart money rotates next after this data settles?
#USAugustPPIRisesLessThanExpected #USAugustPPIYoYRisesTo5 #USContinuingJoblessClaims1
If you are still front-running rate cut headlines by longing every single macro data release, stop now.
Rushing into high-leverage positions before the market digests the full picture is the easiest way to get liquidated on fakeout wicks. Missing a cleaner entry hurts, but watching your margin vanish in minutes is far worse.
The latest PPI print coming in cooler than forecast has traders divided. The hyper-bulls are celebrating, convinced that lower wholesale costs guarantee aggressive easing and an immediate capital rotation out of idle $USDT. On the other side, skeptics argue that underlying service inflation is still sticky enough to keep central banks cautious, meaning the initial spike could easily turn into a liquidity trap.
Looking at the broader structure, I side with the bulls on this one. Wholesale price relief is the clearest leading indicator that consumer price pressures are fading, which creates the macro breathing room needed for capital to flow into layer-1 ecosystems like $DOT and infrastructure plays like $STX . The volatility might shake out weak hands first, but the monetary trajectory is clearly shifting toward expansion.
Where do you think smart money rotates next after this data settles?
#USAugustPPIRisesLessThanExpected #USAugustPPIYoYRisesTo5 #USContinuingJoblessClaims1
Rushing into high-leverage positions before the market digests the full picture is the easiest way to get liquidated on fakeout wicks. Missing a cleaner entry hurts, but watching your margin vanish in minutes is far worse.
The latest PPI print coming in cooler than forecast has traders divided. The hyper-bulls are celebrating, convinced that lower wholesale costs guarantee aggressive easing and an immediate capital rotation out of idle $USDT. On the other side, skeptics argue that underlying service inflation is still sticky enough to keep central banks cautious, meaning the initial spike could easily turn into a liquidity trap.
Looking at the broader structure, I side with the bulls on this one. Wholesale price relief is the clearest leading indicator that consumer price pressures are fading, which creates the macro breathing room needed for capital to flow into layer-1 ecosystems like $DOT and infrastructure plays like $STX . The volatility might shake out weak hands first, but the monetary trajectory is clearly shifting toward expansion.
Where do you think smart money rotates next after this data settles?
#USAugustPPIRisesLessThanExpected #USAugustPPIYoYRisesTo5 #USContinuingJoblessClaims1

27
Cooler-than-expected PPI prints have a nasty habit of becoming the moment everyone gets long right before the fade.
You see the number, dump $USDT for $DOT and $STX thinking the Fed just handed you a gift, then watch the next data point or a random Fed speaker wipe the gains. Happens more often than people admit.
PPI is the producer-side inflation gauge. When it undershoots like the August print, the market instantly prices easier policy. That's why we get the knee-jerk bid.
The catch is the good news is already in the price by the time most people act. Last comparable setup we got a sharp pump followed by a grind lower once continuing claims and other prints didn't play along. Greed sitting at 68 just makes the crowding worse.
One hotter print next month or any geopolitical noise and those crowded longs get hunted. The headline doesn't kill inflation. It just sets up the next liquidity grab.
Anyone else seeing this as a trap rather than a green light?
#USAugustPPIRisesLessThanExpected #USAugustPPIYoYRisesTo5 #USContinuingJoblessClaims1
Cooler-than-expected PPI prints have a nasty habit of becoming the moment everyone gets long right before the fade.
You see the number, dump $USDT for $DOT and $STX thinking the Fed just handed you a gift, then watch the next data point or a random Fed speaker wipe the gains. Happens more often than people admit.
PPI is the producer-side inflation gauge. When it undershoots like the August print, the market instantly prices easier policy. That's why we get the knee-jerk bid.
The catch is the good news is already in the price by the time most people act. Last comparable setup we got a sharp pump followed by a grind lower once continuing claims and other prints didn't play along. Greed sitting at 68 just makes the crowding worse.
One hotter print next month or any geopolitical noise and those crowded longs get hunted. The headline doesn't kill inflation. It just sets up the next liquidity grab.
Anyone else seeing this as a trap rather than a green light?
#USAugustPPIRisesLessThanExpected #USAugustPPIYoYRisesTo5 #USContinuingJoblessClaims1
You see the number, dump $USDT for $DOT and $STX thinking the Fed just handed you a gift, then watch the next data point or a random Fed speaker wipe the gains. Happens more often than people admit.
PPI is the producer-side inflation gauge. When it undershoots like the August print, the market instantly prices easier policy. That's why we get the knee-jerk bid.
The catch is the good news is already in the price by the time most people act. Last comparable setup we got a sharp pump followed by a grind lower once continuing claims and other prints didn't play along. Greed sitting at 68 just makes the crowding worse.
One hotter print next month or any geopolitical noise and those crowded longs get hunted. The headline doesn't kill inflation. It just sets up the next liquidity grab.
Anyone else seeing this as a trap rather than a green light?
#USAugustPPIRisesLessThanExpected #USAugustPPIYoYRisesTo5 #USContinuingJoblessClaims1

28

·
--
Have you noticed how every cooler-than-expected inflation print still leaves most traders underwater by the close?
Crypto investors keep buying the PPI headline and selling the follow-through, watching their entries get faded within hours while they sit on positions they never should have taken.
The cooler August PPI is being treated as automatic confirmation the Fed can ease and risk assets will run. I think that read is lazy. Sentiment is already sitting in greed territory, which means this kind of data often becomes the excuse for a sell-the-news move rather than a genuine breakout. Watch how $USDT quietly pulls in flows while everyone else is celebrating $DOT and $STX.
Don't chase the first green candle. Let the session actually close and see if those names hold their levels. If they don't, rotate back into stables and wait for a cleaner setup instead of becoming exit liquidity.
Where do you think this goes from here if the bounce doesn't stick?
#USAugustPPIRisesLessThanExpected #USAugustPPIYoYRisesTo5 #USContinuingJoblessClaims1
Have you noticed how every cooler-than-expected inflation print still leaves most traders underwater by the close?
Crypto investors keep buying the PPI headline and selling the follow-through, watching their entries get faded within hours while they sit on positions they never should have taken.
The cooler August PPI is being treated as automatic confirmation the Fed can ease and risk assets will run. I think that read is lazy. Sentiment is already sitting in greed territory, which means this kind of data often becomes the excuse for a sell-the-news move rather than a genuine breakout. Watch how $USDT quietly pulls in flows while everyone else is celebrating $DOT and $STX .
Don't chase the first green candle. Let the session actually close and see if those names hold their levels. If they don't, rotate back into stables and wait for a cleaner setup instead of becoming exit liquidity.
Where do you think this goes from here if the bounce doesn't stick?
#USAugustPPIRisesLessThanExpected #USAugustPPIYoYRisesTo5 #USContinuingJoblessClaims1
Crypto investors keep buying the PPI headline and selling the follow-through, watching their entries get faded within hours while they sit on positions they never should have taken.
The cooler August PPI is being treated as automatic confirmation the Fed can ease and risk assets will run. I think that read is lazy. Sentiment is already sitting in greed territory, which means this kind of data often becomes the excuse for a sell-the-news move rather than a genuine breakout. Watch how $USDT quietly pulls in flows while everyone else is celebrating $DOT and $STX .
Don't chase the first green candle. Let the session actually close and see if those names hold their levels. If they don't, rotate back into stables and wait for a cleaner setup instead of becoming exit liquidity.
Where do you think this goes from here if the bounce doesn't stick?
#USAugustPPIRisesLessThanExpected #USAugustPPIYoYRisesTo5 #USContinuingJoblessClaims1
45
·
--
Everyone thinks a softer inflation print means an immediate green light to go all-in on risk assets, but actually, that is where most retail portfolios get trapped.
When the market sees macro numbers come in cooler than forecast, the sudden rush of FOMO often tricks traders into chasing overextended breakouts right before liquidity dries up. It feels like sprinting onto a departing train, only to realize you paid top dollar for a seat right into a local resistance wall.
First, understanding producer prices is like checking the ingredient costs of a restaurant before they print the final menu. When wholesale inflation slows down, profit margins stabilize, which eases pressure on interest rates over time. But markets rarely move in straight lines just because a single metric looks favorable.
Second, smart capital uses these sudden bursts of optimism to distribute rather than accumulate. While high-beta assets and tokens like $STX or $DOT might see instant volatility spikes, rushing in with leverage during the initial reaction usually leads to getting wicked out by chop. Liquidity providers love parking capital in $USDT during these euphoria pops to buy actual structural dips later.
Third, patient positioning always beats emotional execution. Instead of treating every macro release as an emergency buy signal, map out your invalidation levels and wait for the dust to settle.
Are you playing the immediate breakout on this data, or waiting for a confirmed retest?
#USAugustPPIRisesLessThanExpected #USAugustPPIYoYRisesTo5
Everyone thinks a softer inflation print means an immediate green light to go all-in on risk assets, but actually, that is where most retail portfolios get trapped.
When the market sees macro numbers come in cooler than forecast, the sudden rush of FOMO often tricks traders into chasing overextended breakouts right before liquidity dries up. It feels like sprinting onto a departing train, only to realize you paid top dollar for a seat right into a local resistance wall.
First, understanding producer prices is like checking the ingredient costs of a restaurant before they print the final menu. When wholesale inflation slows down, profit margins stabilize, which eases pressure on interest rates over time. But markets rarely move in straight lines just because a single metric looks favorable.
Second, smart capital uses these sudden bursts of optimism to distribute rather than accumulate. While high-beta assets and tokens like $STX or $DOT might see instant volatility spikes, rushing in with leverage during the initial reaction usually leads to getting wicked out by chop. Liquidity providers love parking capital in $USDT during these euphoria pops to buy actual structural dips later.
Third, patient positioning always beats emotional execution. Instead of treating every macro release as an emergency buy signal, map out your invalidation levels and wait for the dust to settle.
Are you playing the immediate breakout on this data, or waiting for a confirmed retest?
#USAugustPPIRisesLessThanExpected #USAugustPPIYoYRisesTo5
When the market sees macro numbers come in cooler than forecast, the sudden rush of FOMO often tricks traders into chasing overextended breakouts right before liquidity dries up. It feels like sprinting onto a departing train, only to realize you paid top dollar for a seat right into a local resistance wall.
First, understanding producer prices is like checking the ingredient costs of a restaurant before they print the final menu. When wholesale inflation slows down, profit margins stabilize, which eases pressure on interest rates over time. But markets rarely move in straight lines just because a single metric looks favorable.
Second, smart capital uses these sudden bursts of optimism to distribute rather than accumulate. While high-beta assets and tokens like $STX or $DOT might see instant volatility spikes, rushing in with leverage during the initial reaction usually leads to getting wicked out by chop. Liquidity providers love parking capital in $USDT during these euphoria pops to buy actual structural dips later.
Third, patient positioning always beats emotional execution. Instead of treating every macro release as an emergency buy signal, map out your invalidation levels and wait for the dust to settle.
Are you playing the immediate breakout on this data, or waiting for a confirmed retest?
#USAugustPPIRisesLessThanExpected #USAugustPPIYoYRisesTo5

16

Here's what happened when the August PPI print came in softer than expected.
Traders piled in chasing the bounce, only to watch entries get underwater as the reaction faded. That post-news FOMO without an exit plan is how a lot of capital gets lost in this market.
The number showed producer prices rising less than forecasts, which initially looked supportive for crypto. Names like $DOT and $STX saw inflows while Fear and Greed sat at 68. The bid was real but short-lived.
What most people missed was the year-over-year figure still climbing and the fact that one cooler print does not change the broader inflation picture. Some smart money rotated toward $USDT instead of adding risk. These data dumps often produce a headline pump that gets sold once the details sink in.
The warning here is treating a single release as a regime shift. In greed conditions the bigger risk is getting caught overextended when the next number, like jobs claims, fails to confirm.
Where do you think this goes from here?
#USAugustPPIRisesLessThanExpected #USAugustPPIYoYRisesTo5 #USContinuingJoblessClaims1
Here's what happened when the August PPI print came in softer than expected.
Traders piled in chasing the bounce, only to watch entries get underwater as the reaction faded. That post-news FOMO without an exit plan is how a lot of capital gets lost in this market.
The number showed producer prices rising less than forecasts, which initially looked supportive for crypto. Names like $DOT and $STX saw inflows while Fear and Greed sat at 68. The bid was real but short-lived.
What most people missed was the year-over-year figure still climbing and the fact that one cooler print does not change the broader inflation picture. Some smart money rotated toward $USDT instead of adding risk. These data dumps often produce a headline pump that gets sold once the details sink in.
The warning here is treating a single release as a regime shift. In greed conditions the bigger risk is getting caught overextended when the next number, like jobs claims, fails to confirm.
Where do you think this goes from here?
#USAugustPPIRisesLessThanExpected #USAugustPPIYoYRisesTo5 #USContinuingJoblessClaims1
Traders piled in chasing the bounce, only to watch entries get underwater as the reaction faded. That post-news FOMO without an exit plan is how a lot of capital gets lost in this market.
The number showed producer prices rising less than forecasts, which initially looked supportive for crypto. Names like $DOT and $STX saw inflows while Fear and Greed sat at 68. The bid was real but short-lived.
What most people missed was the year-over-year figure still climbing and the fact that one cooler print does not change the broader inflation picture. Some smart money rotated toward $USDT instead of adding risk. These data dumps often produce a headline pump that gets sold once the details sink in.
The warning here is treating a single release as a regime shift. In greed conditions the bigger risk is getting caught overextended when the next number, like jobs claims, fails to confirm.
Where do you think this goes from here?
#USAugustPPIRisesLessThanExpected #USAugustPPIYoYRisesTo5 #USContinuingJoblessClaims1

43
·
--
Rising continuing jobless claims used to be a reason to get defensive, yet the same print is now treated as a buy signal for the next leg up.
That flip in narrative is how a lot of traders get caught. Greed sits at 68, so people leave $USDT, chase $DOT and $STX, then sit through weeks of bleed waiting for a pivot that does not arrive on the schedule they imagined.
Continuing claims measure how many people are still on unemployment after the initial filing. They tell you whether the labor market is absorbing workers or leaving them stuck. New claims grab headlines. Continuing claims tell you about duration, and duration is what eventually hits spending and risk appetite. I saw this sequence play out from late 2021 into 2022. Early prints were dismissed. Later ones were not.
The hope for cuts is understandable, especially with softer PPI in the same window. I just no longer confuse a lagging labor signal with an immediate green light. The lag has cost more than the headline ever paid.
Where do you think this data takes risk from here?
#USContinuingJoblessClaims1 #USAugustPPIRisesLessThanExpected #USAugustPPIYoYRisesTo5
Rising continuing jobless claims used to be a reason to get defensive, yet the same print is now treated as a buy signal for the next leg up.
That flip in narrative is how a lot of traders get caught. Greed sits at 68, so people leave $USDT, chase $DOT and $STX , then sit through weeks of bleed waiting for a pivot that does not arrive on the schedule they imagined.
Continuing claims measure how many people are still on unemployment after the initial filing. They tell you whether the labor market is absorbing workers or leaving them stuck. New claims grab headlines. Continuing claims tell you about duration, and duration is what eventually hits spending and risk appetite. I saw this sequence play out from late 2021 into 2022. Early prints were dismissed. Later ones were not.
The hope for cuts is understandable, especially with softer PPI in the same window. I just no longer confuse a lagging labor signal with an immediate green light. The lag has cost more than the headline ever paid.
Where do you think this data takes risk from here?
#USContinuingJoblessClaims1 #USAugustPPIRisesLessThanExpected #USAugustPPIYoYRisesTo5
That flip in narrative is how a lot of traders get caught. Greed sits at 68, so people leave $USDT, chase $DOT and $STX , then sit through weeks of bleed waiting for a pivot that does not arrive on the schedule they imagined.
Continuing claims measure how many people are still on unemployment after the initial filing. They tell you whether the labor market is absorbing workers or leaving them stuck. New claims grab headlines. Continuing claims tell you about duration, and duration is what eventually hits spending and risk appetite. I saw this sequence play out from late 2021 into 2022. Early prints were dismissed. Later ones were not.
The hope for cuts is understandable, especially with softer PPI in the same window. I just no longer confuse a lagging labor signal with an immediate green light. The lag has cost more than the headline ever paid.
Where do you think this data takes risk from here?
#USContinuingJoblessClaims1 #USAugustPPIRisesLessThanExpected #USAugustPPIYoYRisesTo5

25


·
--
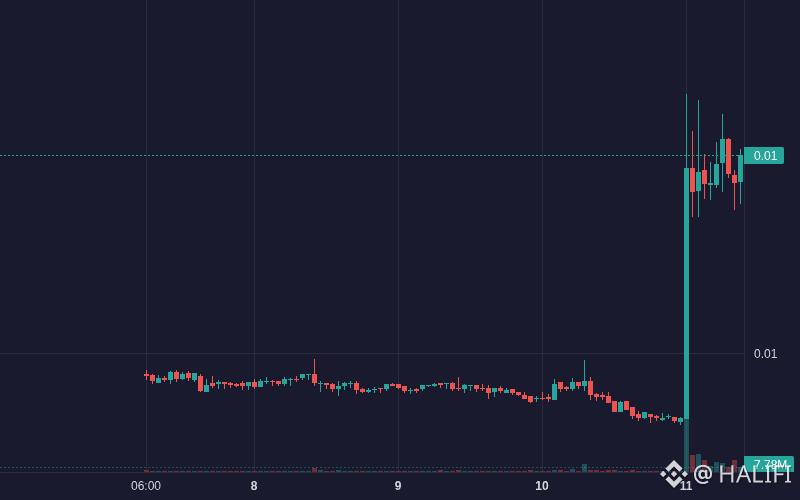
$TFUEL TFUEL is showing bullish movement: 38.18% (Crypto).
Volume: 3.76M | Last: $0.012920
Key signals: strong momentum, high volatility.
Bias Daily: BULLISH 🟢 | Weekly: BULLISH 🟢
TFUEL surged 45% over 24 hours driven by explosive technical volume expansion and concentrated large-wallet inflows.
**Capital inflows (High)**: A sudden surge of +$262K in net inflows, driven heavily by large-wallet accumulation (+$125K), directly triggered a massive 45% price breakout.
- **Technical momentum (High)**: Trading volume exploded from 16K to over 3.2M USDT in a single window → pushing MACD into a strong bullish crossover.
- **Macro tailwinds (Low)**: Anticipation of the SEC's blockchain ledger proposal may be indirectly boosting operational utility tokens.
#TFUEL #ECBRaisesRatesSecondTimeTo2.5% #USAugustPPIYoYRisesTo5.4% #zec #Crypto
$TFUEL TFUEL is showing bullish movement: 38.18% (Crypto).
Volume: 3.76M | Last: $0.012920
Key signals: strong momentum, high volatility.
Bias Daily: BULLISH 🟢 | Weekly: BULLISH 🟢
TFUEL surged 45% over 24 hours driven by explosive technical volume expansion and concentrated large-wallet inflows.
**Capital inflows (High)**: A sudden surge of +$262K in net inflows, driven heavily by large-wallet accumulation (+$125K), directly triggered a massive 45% price breakout.
- **Technical momentum (High)**: Trading volume exploded from 16K to over 3.2M USDT in a single window → pushing MACD into a strong bullish crossover.
- **Macro tailwinds (Low)**: Anticipation of the SEC's blockchain ledger proposal may be indirectly boosting operational utility tokens.
#TFUEL #ECBRaisesRatesSecondTimeTo2.5% #USAugustPPIYoYRisesTo5.4% #zec #Crypto
Volume: 3.76M | Last: $0.012920
Key signals: strong momentum, high volatility.
Bias Daily: BULLISH 🟢 | Weekly: BULLISH 🟢
TFUEL surged 45% over 24 hours driven by explosive technical volume expansion and concentrated large-wallet inflows.
**Capital inflows (High)**: A sudden surge of +$262K in net inflows, driven heavily by large-wallet accumulation (+$125K), directly triggered a massive 45% price breakout.
- **Technical momentum (High)**: Trading volume exploded from 16K to over 3.2M USDT in a single window → pushing MACD into a strong bullish crossover.
- **Macro tailwinds (Low)**: Anticipation of the SEC's blockchain ledger proposal may be indirectly boosting operational utility tokens.
#TFUEL #ECBRaisesRatesSecondTimeTo2.5% #USAugustPPIYoYRisesTo5.4% #zec #Crypto
8
·
--
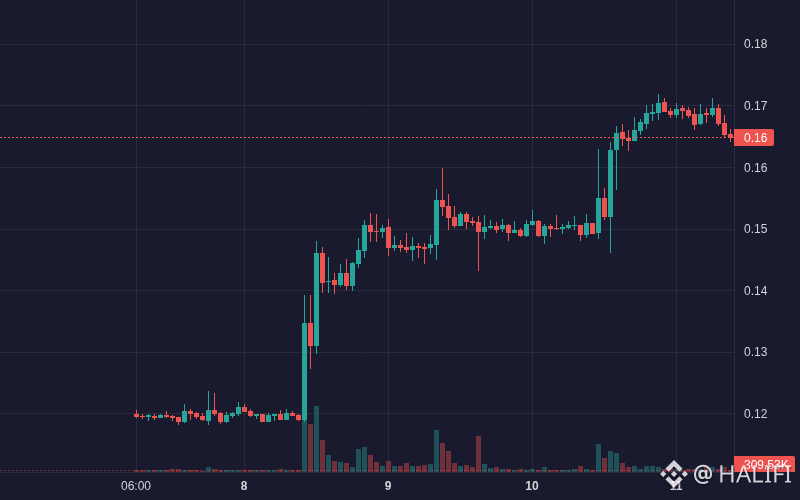
$FF FF is showing bullish movement: 8.19% (Crypto).
Volume: 6.75M | Last: $0.164730
Key signals: strong momentum, high volatility, high trader activity.
Bias Daily: BULLISH 🟢 | Weekly: BULLISH 🟢
FF gained 13% in 24h driven by strong yield engine fundamentals, though hotter-than-expected US PPI raises volatility risks.
**Yield engine demand (High)**: Strong fundamentals from the 8-12% APY market-neutral yield engine and USDf stablecoin minting → drove a 176% broader structural upside
- **Volume-backed breakout (Medium)**: Price surged from $0.149 to $0.169 (+13%) in 24h, supported by an intraday volume spike of 3.79M USDT
- **Sustained momentum (Medium)**: Moving averages reflect a strong uptrend with price consistently holding above the EMA-7 and EMA-25
#FF #ECBRaisesRatesSecondTimeTo2.5% #USAugustPPIYoYRisesTo5.4% #zec #Crypto
$FF FF is showing bullish movement: 8.19% (Crypto).
Volume: 6.75M | Last: $0.164730
Key signals: strong momentum, high volatility, high trader activity.
Bias Daily: BULLISH 🟢 | Weekly: BULLISH 🟢
FF gained 13% in 24h driven by strong yield engine fundamentals, though hotter-than-expected US PPI raises volatility risks.
**Yield engine demand (High)**: Strong fundamentals from the 8-12% APY market-neutral yield engine and USDf stablecoin minting → drove a 176% broader structural upside
- **Volume-backed breakout (Medium)**: Price surged from $0.149 to $0.169 (+13%) in 24h, supported by an intraday volume spike of 3.79M USDT
- **Sustained momentum (Medium)**: Moving averages reflect a strong uptrend with price consistently holding above the EMA-7 and EMA-25
#FF #ECBRaisesRatesSecondTimeTo2.5% #USAugustPPIYoYRisesTo5.4% #zec #Crypto
Volume: 6.75M | Last: $0.164730
Key signals: strong momentum, high volatility, high trader activity.
Bias Daily: BULLISH 🟢 | Weekly: BULLISH 🟢
FF gained 13% in 24h driven by strong yield engine fundamentals, though hotter-than-expected US PPI raises volatility risks.
**Yield engine demand (High)**: Strong fundamentals from the 8-12% APY market-neutral yield engine and USDf stablecoin minting → drove a 176% broader structural upside
- **Volume-backed breakout (Medium)**: Price surged from $0.149 to $0.169 (+13%) in 24h, supported by an intraday volume spike of 3.79M USDT
- **Sustained momentum (Medium)**: Moving averages reflect a strong uptrend with price consistently holding above the EMA-7 and EMA-25
#FF #ECBRaisesRatesSecondTimeTo2.5% #USAugustPPIYoYRisesTo5.4% #zec #Crypto
11
·
--
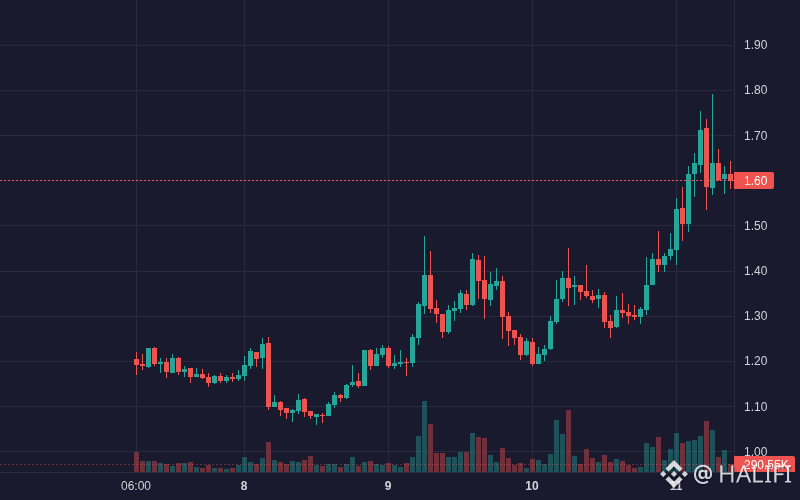
$RAY RAY is showing bullish movement: 15.81% (Crypto).
Volume: 31.22M | Last: $1.58
Key signals: strong momentum, high volatility, high trader activity.
Bias Daily: BULLISH 🟢 | Weekly: BULLISH 🟢
RAY rallied over 18% to $1.60 in 24 hours, driven by StonkFun integration revenues and record token buybacks.
**Protocol Revenue Surge (High)**: StonkFun routing new launches through Raydium LaunchLab has significantly increased trading activity and fees, funding a record $640k token buyback on September 9.
- **Capital Inflows (High)**: Large wallet participation spiked, with the large order inflow ratio reaching 37% as price rallied from $1.35 to $1.71.
- **Ecosystem Security (Low)**: OpenCover's expansion of on-chain insurance to Solana enhances Raydium's resilience, attracting risk-averse capital.
#RAY #ECBRaisesRatesSecondTimeTo2.5% #USAugustPPIYoYRisesTo5.4% #zec #Crypto
$RAY RAY is showing bullish movement: 15.81% (Crypto).
Volume: 31.22M | Last: $1.58
Key signals: strong momentum, high volatility, high trader activity.
Bias Daily: BULLISH 🟢 | Weekly: BULLISH 🟢
RAY rallied over 18% to $1.60 in 24 hours, driven by StonkFun integration revenues and record token buybacks.
**Protocol Revenue Surge (High)**: StonkFun routing new launches through Raydium LaunchLab has significantly increased trading activity and fees, funding a record $640k token buyback on September 9.
- **Capital Inflows (High)**: Large wallet participation spiked, with the large order inflow ratio reaching 37% as price rallied from $1.35 to $1.71.
- **Ecosystem Security (Low)**: OpenCover's expansion of on-chain insurance to Solana enhances Raydium's resilience, attracting risk-averse capital.
#RAY #ECBRaisesRatesSecondTimeTo2.5% #USAugustPPIYoYRisesTo5.4% #zec #Crypto
Volume: 31.22M | Last: $1.58
Key signals: strong momentum, high volatility, high trader activity.
Bias Daily: BULLISH 🟢 | Weekly: BULLISH 🟢
RAY rallied over 18% to $1.60 in 24 hours, driven by StonkFun integration revenues and record token buybacks.
**Protocol Revenue Surge (High)**: StonkFun routing new launches through Raydium LaunchLab has significantly increased trading activity and fees, funding a record $640k token buyback on September 9.
- **Capital Inflows (High)**: Large wallet participation spiked, with the large order inflow ratio reaching 37% as price rallied from $1.35 to $1.71.
- **Ecosystem Security (Low)**: OpenCover's expansion of on-chain insurance to Solana enhances Raydium's resilience, attracting risk-averse capital.
#RAY #ECBRaisesRatesSecondTimeTo2.5% #USAugustPPIYoYRisesTo5.4% #zec #Crypto
10
·
--
$LSK LSK is showing bullish movement: 17.45% (Crypto).
Volume: 2.16M | Last: $0.137300
Key signals: strong momentum, high volatility.
Bias Daily: BULLISH 🟢 | Weekly: BULLISH 🟢
LSK surged 19% to $0.137 over 24h, driven by strong technical momentum and large capital inflows.
**Technical Breakout (High)**: Price rallied +19% to $0.1377, supported by massive volume spikes exceeding 800K USDT in a single interval → strong bullish momentum
- **Capital Accumulation (Medium)**: Significant net inflows of +$127K, driven by large transaction blocks, signal concentrated buying activity
- **Ecosystem Clarity (Low)**: Confirmation that no token swap is required for Ethereum holders removed friction → stabilized investor confidence
#LSK #ECBRaisesRatesSecondTimeTo2.5% #USAugustPPIYoYRisesTo5.4% #zec #Crypto
$LSK LSK is showing bullish movement: 17.45% (Crypto).
Volume: 2.16M | Last: $0.137300
Key signals: strong momentum, high volatility.
Bias Daily: BULLISH 🟢 | Weekly: BULLISH 🟢
LSK surged 19% to $0.137 over 24h, driven by strong technical momentum and large capital inflows.
**Technical Breakout (High)**: Price rallied +19% to $0.1377, supported by massive volume spikes exceeding 800K USDT in a single interval → strong bullish momentum
- **Capital Accumulation (Medium)**: Significant net inflows of +$127K, driven by large transaction blocks, signal concentrated buying activity
- **Ecosystem Clarity (Low)**: Confirmation that no token swap is required for Ethereum holders removed friction → stabilized investor confidence
#LSK #ECBRaisesRatesSecondTimeTo2.5% #USAugustPPIYoYRisesTo5.4% #zec #Crypto
Volume: 2.16M | Last: $0.137300
Key signals: strong momentum, high volatility.
Bias Daily: BULLISH 🟢 | Weekly: BULLISH 🟢
LSK surged 19% to $0.137 over 24h, driven by strong technical momentum and large capital inflows.
**Technical Breakout (High)**: Price rallied +19% to $0.1377, supported by massive volume spikes exceeding 800K USDT in a single interval → strong bullish momentum
- **Capital Accumulation (Medium)**: Significant net inflows of +$127K, driven by large transaction blocks, signal concentrated buying activity
- **Ecosystem Clarity (Low)**: Confirmation that no token swap is required for Ethereum holders removed friction → stabilized investor confidence
#LSK #ECBRaisesRatesSecondTimeTo2.5% #USAugustPPIYoYRisesTo5.4% #zec #Crypto

24
·
--
$SAGA SAGA is showing bullish movement: 13.34% (Crypto).
Volume: 14.18M | Last: $0.016480
Key signals: strong momentum, high volatility, high trader activity.
Bias Daily: BULLISH 🟢 | Weekly: BULLISH 🟢
SAGA rallied 14% over 24 hours driven by sudden volume spikes, but faces severe macro and liquidity risks.
**Capital inflows & volume surge (High)**: Trading volume spiked to 9.2M USDT alongside +$422K in net inflows, driving a rapid +22% price expansion to $0.0177 before cooling.
- **Fundamental positioning (Medium)**: SAGA's core architecture as a Layer 1 for customizable, highly interoperable Chainlets maintains baseline interest for gaming and entertainment sectors.
#SAGA #ECBRaisesRatesSecondTimeTo2.5% #USAugustPPIYoYRisesTo5.4% #zec #Crypto
$SAGA SAGA is showing bullish movement: 13.34% (Crypto).
Volume: 14.18M | Last: $0.016480
Key signals: strong momentum, high volatility, high trader activity.
Bias Daily: BULLISH 🟢 | Weekly: BULLISH 🟢
SAGA rallied 14% over 24 hours driven by sudden volume spikes, but faces severe macro and liquidity risks.
**Capital inflows & volume surge (High)**: Trading volume spiked to 9.2M USDT alongside +$422K in net inflows, driving a rapid +22% price expansion to $0.0177 before cooling.
- **Fundamental positioning (Medium)**: SAGA's core architecture as a Layer 1 for customizable, highly interoperable Chainlets maintains baseline interest for gaming and entertainment sectors.
#SAGA #ECBRaisesRatesSecondTimeTo2.5% #USAugustPPIYoYRisesTo5.4% #zec #Crypto
Volume: 14.18M | Last: $0.016480
Key signals: strong momentum, high volatility, high trader activity.
Bias Daily: BULLISH 🟢 | Weekly: BULLISH 🟢
SAGA rallied 14% over 24 hours driven by sudden volume spikes, but faces severe macro and liquidity risks.
**Capital inflows & volume surge (High)**: Trading volume spiked to 9.2M USDT alongside +$422K in net inflows, driving a rapid +22% price expansion to $0.0177 before cooling.
- **Fundamental positioning (Medium)**: SAGA's core architecture as a Layer 1 for customizable, highly interoperable Chainlets maintains baseline interest for gaming and entertainment sectors.
#SAGA #ECBRaisesRatesSecondTimeTo2.5% #USAugustPPIYoYRisesTo5.4% #zec #Crypto

فاطمة سامي:
ممكن الهدف جزاك الله خيرا SAGA
1
1
19
·
--
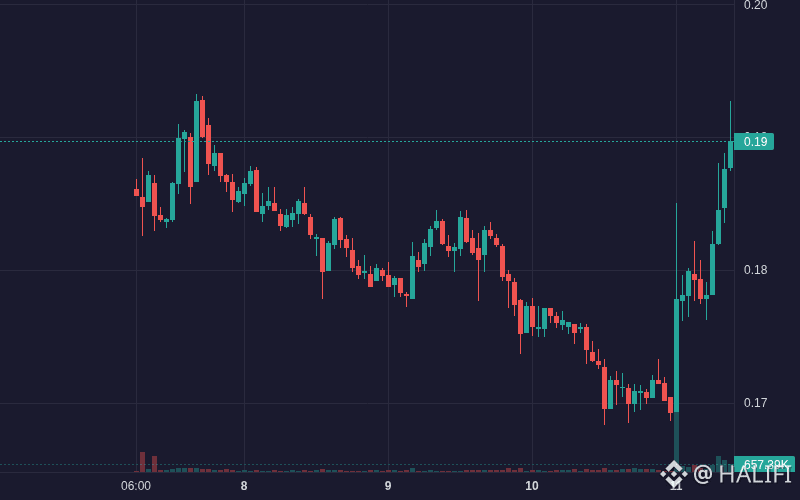
$THETA THETA is showing bullish movement: 7.85% (Crypto).
Volume: 2.72M | Last: $0.189500
Key signals: strong momentum, high volatility, high trader activity.
Bias Daily: BULLISH 🟢 | Weekly: BULLISH 🟢
THETA rallied 5% in 24h driven by a massive volume spike, but overbought technicals signal impending correction risks.
**Trading volume surge (High)**: Hourly trading volume spiked massively to 2.87M USDT → driving a sudden 5% price breakout.
- **Positive community sentiment (Medium)**: Retail confidence remains strong as users anticipate upward momentum and note stability relative to TFUEL.
- **Capital inflows (Medium)**: Net inflows flipped heavily positive during the breakout → fueling the upward price action.
#THETA #ECBRaisesRatesSecondTimeTo2.5% #USAugustPPIYoYRisesTo5.4% #zec #Crypto
$THETA THETA is showing bullish movement: 7.85% (Crypto).
Volume: 2.72M | Last: $0.189500
Key signals: strong momentum, high volatility, high trader activity.
Bias Daily: BULLISH 🟢 | Weekly: BULLISH 🟢
THETA rallied 5% in 24h driven by a massive volume spike, but overbought technicals signal impending correction risks.
**Trading volume surge (High)**: Hourly trading volume spiked massively to 2.87M USDT → driving a sudden 5% price breakout.
- **Positive community sentiment (Medium)**: Retail confidence remains strong as users anticipate upward momentum and note stability relative to TFUEL.
- **Capital inflows (Medium)**: Net inflows flipped heavily positive during the breakout → fueling the upward price action.
#THETA #ECBRaisesRatesSecondTimeTo2.5% #USAugustPPIYoYRisesTo5.4% #zec #Crypto
Volume: 2.72M | Last: $0.189500
Key signals: strong momentum, high volatility, high trader activity.
Bias Daily: BULLISH 🟢 | Weekly: BULLISH 🟢
THETA rallied 5% in 24h driven by a massive volume spike, but overbought technicals signal impending correction risks.
**Trading volume surge (High)**: Hourly trading volume spiked massively to 2.87M USDT → driving a sudden 5% price breakout.
- **Positive community sentiment (Medium)**: Retail confidence remains strong as users anticipate upward momentum and note stability relative to TFUEL.
- **Capital inflows (Medium)**: Net inflows flipped heavily positive during the breakout → fueling the upward price action.
#THETA #ECBRaisesRatesSecondTimeTo2.5% #USAugustPPIYoYRisesTo5.4% #zec #Crypto
38
·
--
$COTI COTI is showing bearish movement: -0.54% (Crypto).
Volume: 4.30M | Last: $0.018450
Key signals: high trader activity.
Bias Daily: BULLISH 🟢 | Weekly: BULLISH 🟢
COTI retreated to $0.0182 after facing resistance, driven by large-wallet profit-taking and fading technical momentum.
**Capital Outflows (High)**: Net outflows of $274K, including a $128K exit from large wallets, drove the recent price correction.
- **Technical Rejection (Medium)**: Price faced strong resistance at $0.01937 → RSI cooled from 67.9 to 46.7 as buying pressure faded.
- **Retail Sentiment (Low)**: Community speculation of a volume-driven pump fueled initial interest, but failed to sustain upward momentum against selling pressure.
#COTI #ECBRaisesRatesSecondTimeTo2.5% #USAugustPPIYoYRisesTo5.4% #zec #Crypto
$COTI COTI is showing bearish movement: -0.54% (Crypto).
Volume: 4.30M | Last: $0.018450
Key signals: high trader activity.
Bias Daily: BULLISH 🟢 | Weekly: BULLISH 🟢
COTI retreated to $0.0182 after facing resistance, driven by large-wallet profit-taking and fading technical momentum.
**Capital Outflows (High)**: Net outflows of $274K, including a $128K exit from large wallets, drove the recent price correction.
- **Technical Rejection (Medium)**: Price faced strong resistance at $0.01937 → RSI cooled from 67.9 to 46.7 as buying pressure faded.
- **Retail Sentiment (Low)**: Community speculation of a volume-driven pump fueled initial interest, but failed to sustain upward momentum against selling pressure.
#COTI #ECBRaisesRatesSecondTimeTo2.5% #USAugustPPIYoYRisesTo5.4% #zec #Crypto
Volume: 4.30M | Last: $0.018450
Key signals: high trader activity.
Bias Daily: BULLISH 🟢 | Weekly: BULLISH 🟢
COTI retreated to $0.0182 after facing resistance, driven by large-wallet profit-taking and fading technical momentum.
**Capital Outflows (High)**: Net outflows of $274K, including a $128K exit from large wallets, drove the recent price correction.
- **Technical Rejection (Medium)**: Price faced strong resistance at $0.01937 → RSI cooled from 67.9 to 46.7 as buying pressure faded.
- **Retail Sentiment (Low)**: Community speculation of a volume-driven pump fueled initial interest, but failed to sustain upward momentum against selling pressure.
#COTI #ECBRaisesRatesSecondTimeTo2.5% #USAugustPPIYoYRisesTo5.4% #zec #Crypto

20
·
--
$ETHFI ETHFI is showing bullish movement: 7.40% (Crypto).
Volume: 22.58M | Last: $0.675000
Key signals: strong momentum, high volatility, high trader activity.
Bias Daily: BULLISH 🟢 | Weekly: BULLISH 🟢
ETHFI rallied 8.7% in 24 hours driven by strong protocol revenue, utility expansion, and significant capital inflows.
**Fundamental growth (High)**: Protocol TVL surpassed $9B with a programmatic buyback mechanism allocating $16M annually → creates persistent organic buying pressure
- **Capital inflows (High)**: Net inflows spiked to $1.96M alongside a volume surge to 13.3M USDT → drove price from $0.62 to $0.68
- **Utility expansion (Medium)**: New cashback and savings integrations → enhances real-world application and token retention
#ETHFI #ECBRaisesRatesSecondTimeTo2.5% #USAugustPPIYoYRisesTo5.4% #zec #Crypto
$ETHFI ETHFI is showing bullish movement: 7.40% (Crypto).
Volume: 22.58M | Last: $0.675000
Key signals: strong momentum, high volatility, high trader activity.
Bias Daily: BULLISH 🟢 | Weekly: BULLISH 🟢
ETHFI rallied 8.7% in 24 hours driven by strong protocol revenue, utility expansion, and significant capital inflows.
**Fundamental growth (High)**: Protocol TVL surpassed $9B with a programmatic buyback mechanism allocating $16M annually → creates persistent organic buying pressure
- **Capital inflows (High)**: Net inflows spiked to $1.96M alongside a volume surge to 13.3M USDT → drove price from $0.62 to $0.68
- **Utility expansion (Medium)**: New cashback and savings integrations → enhances real-world application and token retention
#ETHFI #ECBRaisesRatesSecondTimeTo2.5% #USAugustPPIYoYRisesTo5.4% #zec #Crypto
Volume: 22.58M | Last: $0.675000
Key signals: strong momentum, high volatility, high trader activity.
Bias Daily: BULLISH 🟢 | Weekly: BULLISH 🟢
ETHFI rallied 8.7% in 24 hours driven by strong protocol revenue, utility expansion, and significant capital inflows.
**Fundamental growth (High)**: Protocol TVL surpassed $9B with a programmatic buyback mechanism allocating $16M annually → creates persistent organic buying pressure
- **Capital inflows (High)**: Net inflows spiked to $1.96M alongside a volume surge to 13.3M USDT → drove price from $0.62 to $0.68
- **Utility expansion (Medium)**: New cashback and savings integrations → enhances real-world application and token retention
#ETHFI #ECBRaisesRatesSecondTimeTo2.5% #USAugustPPIYoYRisesTo5.4% #zec #Crypto

12
·
--
$ICP ICP is showing bearish movement: -0.18% (Crypto).
Volume: 5.92M | Last: $2.77
Key signals: high trader activity.
Bias Daily: BULLISH 🟢 | Weekly: BULLISH 🟢
ICP rebounded 3.5% from local lows to $2.81, driven by AI narratives and bullish MACD momentum.
**AI & Privacy Narratives (High)**: Resurgence in AI smart contract utility and the mainnet integration of vetKeys for on-chain privacy are driving fundamental interest.
- **Technical Rebound (Medium)**: Price recovered from a local low of $2.71 to $2.81 as the MACD histogram flipped positive, indicating a bullish momentum shift.
- **Cost Efficiency (Medium)**: The reverse-gas model and ultra-low storage costs ($0.46/GB) continue to support long-term developer adoption.
#ICP #ECBRaisesRatesSecondTimeTo2.5% #Laptop #USAugustPPIYoYRisesTo5.4% #Crypto
$ICP ICP is showing bearish movement: -0.18% (Crypto).
Volume: 5.92M | Last: $2.77
Key signals: high trader activity.
Bias Daily: BULLISH 🟢 | Weekly: BULLISH 🟢
ICP rebounded 3.5% from local lows to $2.81, driven by AI narratives and bullish MACD momentum.
**AI & Privacy Narratives (High)**: Resurgence in AI smart contract utility and the mainnet integration of vetKeys for on-chain privacy are driving fundamental interest.
- **Technical Rebound (Medium)**: Price recovered from a local low of $2.71 to $2.81 as the MACD histogram flipped positive, indicating a bullish momentum shift.
- **Cost Efficiency (Medium)**: The reverse-gas model and ultra-low storage costs ($0.46/GB) continue to support long-term developer adoption.
#ICP #ECBRaisesRatesSecondTimeTo2.5% #Laptop #USAugustPPIYoYRisesTo5.4% #Crypto
Volume: 5.92M | Last: $2.77
Key signals: high trader activity.
Bias Daily: BULLISH 🟢 | Weekly: BULLISH 🟢
ICP rebounded 3.5% from local lows to $2.81, driven by AI narratives and bullish MACD momentum.
**AI & Privacy Narratives (High)**: Resurgence in AI smart contract utility and the mainnet integration of vetKeys for on-chain privacy are driving fundamental interest.
- **Technical Rebound (Medium)**: Price recovered from a local low of $2.71 to $2.81 as the MACD histogram flipped positive, indicating a bullish momentum shift.
- **Cost Efficiency (Medium)**: The reverse-gas model and ultra-low storage costs ($0.46/GB) continue to support long-term developer adoption.
#ICP #ECBRaisesRatesSecondTimeTo2.5% #Laptop #USAugustPPIYoYRisesTo5.4% #Crypto

126
·
--
$COTI COTI is showing bullish movement: 2.72% (Crypto).
Volume: 5.40M | Last: $0.018480
Key signals: high trader activity.
Bias Daily: BULLISH 🟢 | Weekly: BULLISH 🟢
COTI faces mixed momentum as strong privacy sector tailwinds battle declining volume and key technical resistance near $0.019.
**Privacy sector tailwinds (High)**: Benefiting from broader privacy sector momentum, which has surged 90% over the past 30 days
- **Technical consolidation (Medium)**: Price is consolidating within a descending broadening wedge pattern, attracting breakout traders
- **Speculative positioning (Medium)**: Market participants are setting up long positions, anticipating further upside if key resistance levels are breached
#COTI #ECBRaisesRatesSecondTimeTo2.5% #Laptop #USAugustPPIYoYRisesTo5.4% #Crypto
$COTI COTI is showing bullish movement: 2.72% (Crypto).
Volume: 5.40M | Last: $0.018480
Key signals: high trader activity.
Bias Daily: BULLISH 🟢 | Weekly: BULLISH 🟢
COTI faces mixed momentum as strong privacy sector tailwinds battle declining volume and key technical resistance near $0.019.
**Privacy sector tailwinds (High)**: Benefiting from broader privacy sector momentum, which has surged 90% over the past 30 days
- **Technical consolidation (Medium)**: Price is consolidating within a descending broadening wedge pattern, attracting breakout traders
- **Speculative positioning (Medium)**: Market participants are setting up long positions, anticipating further upside if key resistance levels are breached
#COTI #ECBRaisesRatesSecondTimeTo2.5% #Laptop #USAugustPPIYoYRisesTo5.4% #Crypto
Volume: 5.40M | Last: $0.018480
Key signals: high trader activity.
Bias Daily: BULLISH 🟢 | Weekly: BULLISH 🟢
COTI faces mixed momentum as strong privacy sector tailwinds battle declining volume and key technical resistance near $0.019.
**Privacy sector tailwinds (High)**: Benefiting from broader privacy sector momentum, which has surged 90% over the past 30 days
- **Technical consolidation (Medium)**: Price is consolidating within a descending broadening wedge pattern, attracting breakout traders
- **Speculative positioning (Medium)**: Market participants are setting up long positions, anticipating further upside if key resistance levels are breached
#COTI #ECBRaisesRatesSecondTimeTo2.5% #Laptop #USAugustPPIYoYRisesTo5.4% #Crypto

36
·
--
$INIT INIT is showing bullish movement: 5.48% (Crypto).
Volume: 866.62K | Last: $0.068160
Key signals: strong momentum, high volatility.
Bias Daily: BULLISH 🟢 | Weekly: BULLISH 🟢
INIT rallied ~5.4% over 24h on strong technical momentum and volume spikes, though overbought signals suggest correction risks.
**Technicals & Momentum (High)**: Price surged from ~$0.064 to ~$0.071, driven by strong buying momentum as RSI peaked at 89 (highly overbought) and MACD crossed into bullish territory with expanding histograms.
- **Volume Surge (Medium)**: Trading volume spiked significantly during the rally, reaching over 480k USDT in a single hour, suggesting strong participation in the upward move.
- **Inflow Dynamics (Medium)**: Net inflows turned positive during the rally, with large inflows accounting for up to 32% of total volume, indicating potential accumulation by larger participants.
#INIT #ECBRaisesRatesSecondTimeTo2.5% #Laptop #USAugustPPIYoYRisesTo5.4% #Crypto
$INIT INIT is showing bullish movement: 5.48% (Crypto).
Volume: 866.62K | Last: $0.068160
Key signals: strong momentum, high volatility.
Bias Daily: BULLISH 🟢 | Weekly: BULLISH 🟢
INIT rallied ~5.4% over 24h on strong technical momentum and volume spikes, though overbought signals suggest correction risks.
**Technicals & Momentum (High)**: Price surged from ~$0.064 to ~$0.071, driven by strong buying momentum as RSI peaked at 89 (highly overbought) and MACD crossed into bullish territory with expanding histograms.
- **Volume Surge (Medium)**: Trading volume spiked significantly during the rally, reaching over 480k USDT in a single hour, suggesting strong participation in the upward move.
- **Inflow Dynamics (Medium)**: Net inflows turned positive during the rally, with large inflows accounting for up to 32% of total volume, indicating potential accumulation by larger participants.
#INIT #ECBRaisesRatesSecondTimeTo2.5% #Laptop #USAugustPPIYoYRisesTo5.4% #Crypto
Volume: 866.62K | Last: $0.068160
Key signals: strong momentum, high volatility.
Bias Daily: BULLISH 🟢 | Weekly: BULLISH 🟢
INIT rallied ~5.4% over 24h on strong technical momentum and volume spikes, though overbought signals suggest correction risks.
**Technicals & Momentum (High)**: Price surged from ~$0.064 to ~$0.071, driven by strong buying momentum as RSI peaked at 89 (highly overbought) and MACD crossed into bullish territory with expanding histograms.
- **Volume Surge (Medium)**: Trading volume spiked significantly during the rally, reaching over 480k USDT in a single hour, suggesting strong participation in the upward move.
- **Inflow Dynamics (Medium)**: Net inflows turned positive during the rally, with large inflows accounting for up to 32% of total volume, indicating potential accumulation by larger participants.
#INIT #ECBRaisesRatesSecondTimeTo2.5% #Laptop #USAugustPPIYoYRisesTo5.4% #Crypto

18
Log in to explore more content
Join global crypto users on Binance Square
⚡️ Get latest and useful information about crypto.
💬 Trusted by the world’s largest crypto exchange.
👍 Discover real insights from verified creators.
Email / Phone number
Trending Topics
1
#CPIWatch
86.3M views
500,134 Discussing
2
#BitcoinFallsTo$77KAfterGoldenCross
0 views
2 Discussing
3
#CLARITYActRevisionToRuleNonDeFiControllers
3,743 views
119 Discussing
4
#TencentBackedEnflameToStartTradingAfter$911MIPO
828 views
14 Discussing
5
#BlockstreamRefusesToPayRansomToLiquidAttacker
3,232 views
104 Discussing
6
#LiquidNetworkResumesBlocksAfter$320MExploit
1,161 views
50 Discussing
7
#USToSanctionBigBankMonday
9,767 views
268 Discussing
8
#TrumpDeclinesSaudiRequestToStrikeHouthis
16,305 views
362 Discussing
9
#CryptoSectorsFallSecondDay
23,943 views
612 Discussing
10
#BitcoinGoldenCrossConfirms
20,626 views
585 Discussing