
#oiltops
oiltops
3,466 views
58 Discussing
Hot
Latest

Why is nobody talking about oil topping as a crypto trade signal instead of just a macro headline?
Most traders only react after $BTC and $ETH move, then wonder why their entries feel late. When oil spikes, inflation fear comes back, rate-cut confidence gets shaky, and risk assets usually stop behaving “randomly.”
My take: if oil is topping, the crowd is probably reading it backwards. A cooling oil market can remove pressure from inflation expectations, which gives crypto room to breathe. But if traders blindly buy every dip because “lower oil is bullish,” they’ll still get chopped, especially with Fear & Greed sitting in fear territory around 37.
Here’s the practical play: watch whether oil weakness lines up with stable yields and stronger spot demand. If $ETH holds key support while $USDT flows rotate back into majors, that is more useful than chasing whatever is trending for five minutes. If oil drops but yields rise, be careful. That’s not relief, that’s stress.
The mainstream narrative says oil is separate from crypto. I disagree. Oil affects inflation, inflation affects rates, rates affect liquidity, and liquidity is the fuel crypto actually trades on. The edge is not predicting oil perfectly. It’s knowing when macro pressure is fading before everyone starts screaming bullish again.
Are traders underpricing the oil signal here, or is this just another fake relief setup? #OilTops #ECBHoldsRatesAt2 #USJoblessClaimsFallTo187KLowestSince1969
Most traders only react after $BTC and $ETH move, then wonder why their entries feel late. When oil spikes, inflation fear comes back, rate-cut confidence gets shaky, and risk assets usually stop behaving “randomly.”
My take: if oil is topping, the crowd is probably reading it backwards. A cooling oil market can remove pressure from inflation expectations, which gives crypto room to breathe. But if traders blindly buy every dip because “lower oil is bullish,” they’ll still get chopped, especially with Fear & Greed sitting in fear territory around 37.
Here’s the practical play: watch whether oil weakness lines up with stable yields and stronger spot demand. If $ETH holds key support while $USDT flows rotate back into majors, that is more useful than chasing whatever is trending for five minutes. If oil drops but yields rise, be careful. That’s not relief, that’s stress.
The mainstream narrative says oil is separate from crypto. I disagree. Oil affects inflation, inflation affects rates, rates affect liquidity, and liquidity is the fuel crypto actually trades on. The edge is not predicting oil perfectly. It’s knowing when macro pressure is fading before everyone starts screaming bullish again.
Are traders underpricing the oil signal here, or is this just another fake relief setup? #OilTops #ECBHoldsRatesAt2 #USJoblessClaimsFallTo187KLowestSince1969


Last week, a trader I know rotated into risk right as oil started topping, thinking cheaper energy would instantly mean easier markets.
That’s the trap. In crypto, macro signals rarely move in a straight line, and FOMO entries on $BTC or $ETH can get punished before the “obvious” narrative plays out.
Here’s what most people missed with #OilTops: falling oil can look bullish because it may cool inflation pressure, but it can also signal weaker demand. If the market reads it as growth slowing instead of inflation easing, risk assets don’t automatically catch a bid.
That matters when the Fear & Greed Index is sitting in Fear. Traders are already defensive, and many are parked in $USDT waiting for confirmation. In that environment, a macro headline can trigger a fast squeeze, then fade just as quickly when liquidity thins out.
The lesson is simple: oil topping is not a standalone buy signal. Watch yields, dollar strength, and whether majors hold key levels after the first reaction. The real risk is buying the headline instead of the follow-through.
Are you treating lower oil as bullish for crypto, or as a warning sign for weaker growth? #OilTops #ECBHoldsRatesAt2 #USJoblessClaimsFallTo187KLowestSince1969
That’s the trap. In crypto, macro signals rarely move in a straight line, and FOMO entries on $BTC or $ETH can get punished before the “obvious” narrative plays out.
Here’s what most people missed with #OilTops: falling oil can look bullish because it may cool inflation pressure, but it can also signal weaker demand. If the market reads it as growth slowing instead of inflation easing, risk assets don’t automatically catch a bid.
That matters when the Fear & Greed Index is sitting in Fear. Traders are already defensive, and many are parked in $USDT waiting for confirmation. In that environment, a macro headline can trigger a fast squeeze, then fade just as quickly when liquidity thins out.
The lesson is simple: oil topping is not a standalone buy signal. Watch yields, dollar strength, and whether majors hold key levels after the first reaction. The real risk is buying the headline instead of the follow-through.
Are you treating lower oil as bullish for crypto, or as a warning sign for weaker growth? #OilTops #ECBHoldsRatesAt2 #USJoblessClaimsFallTo187KLowestSince1969

A clean breakout in oil can be bad news for crypto, because higher energy prices often mean tighter liquidity before they mean “risk-on.”
The trap is simple: traders see $BTC or $ETH bouncing, chase the candle, then a macro headline pushes oil higher and suddenly rate-cut hopes get repriced. That’s how a decent entry turns into a stop-loss speedrun.
When oil tops or spikes, markets usually read it through inflation. More expensive energy can lift transport, production, and consumer costs, which makes central banks less eager to loosen policy. For crypto, that matters because liquidity is the real fuel. If money gets more expensive, high-beta assets feel it first.
But the other side is tricky too. If oil dumps hard, it isn’t always bullish. Sometimes it signals weaker demand, recession fear, or stress in global growth. In that setup, people often hide in $USDT instead of rotating into alts, which fits the current “Fear” mood pretty well.
So the lesson: don’t trade oil headlines like they’re isolated news. Watch the dollar, yields, $BTC dominance, and whether $ETH is confirming risk appetite or just lagging. Oil can be the spark, but liquidity decides whether the move survives.
If #OilTops keeps trending while #ECBHoldsRatesAt2 and #USJoblessClaimsFallTo187KLowestSince1969 are on the macro board, are you reducing risk or buying the fear?
The trap is simple: traders see $BTC or $ETH bouncing, chase the candle, then a macro headline pushes oil higher and suddenly rate-cut hopes get repriced. That’s how a decent entry turns into a stop-loss speedrun.
When oil tops or spikes, markets usually read it through inflation. More expensive energy can lift transport, production, and consumer costs, which makes central banks less eager to loosen policy. For crypto, that matters because liquidity is the real fuel. If money gets more expensive, high-beta assets feel it first.
But the other side is tricky too. If oil dumps hard, it isn’t always bullish. Sometimes it signals weaker demand, recession fear, or stress in global growth. In that setup, people often hide in $USDT instead of rotating into alts, which fits the current “Fear” mood pretty well.
So the lesson: don’t trade oil headlines like they’re isolated news. Watch the dollar, yields, $BTC dominance, and whether $ETH is confirming risk appetite or just lagging. Oil can be the spark, but liquidity decides whether the move survives.
If #OilTops keeps trending while #ECBHoldsRatesAt2 and #USJoblessClaimsFallTo187KLowestSince1969 are on the macro board, are you reducing risk or buying the fear?
Last week, the market got a reminder that crypto doesn’t trade in a vacuum when oil ripped higher and risk assets suddenly looked less comfortable.
The painful part is familiar: traders see $BTC or $ETH holding a level, ignore the macro headline, then wonder why the move fades. In a Fear market, even good setups can get shaky when inflation fears come back into the room.
Here’s the case study: WTI jumping around 6% is not just an energy story. Higher oil can feed inflation expectations, which can keep central banks cautious for longer. That usually pressures liquidity-sensitive assets, and crypto is still one of the first places traders de-risk when the macro mood turns.
We’ve seen this movie before. In 2022, oil shocks and rate fears hit tech and crypto together. In 2023, when energy cooled and liquidity expectations improved, $BTC found room to breathe again. The difference now is that the market is more mature, with spot flows, stronger stablecoin rails like $USDT, and a much sharper eye on macro triggers.
So the lesson isn’t “oil up means crypto down.” It’s that big oil moves change the conversation around inflation, rates, and risk appetite. If traders are only watching candles and not the macro backdrop, they’re playing half the game.
Are you treating this oil spike as noise, or as a real warning signal for crypto risk? #WTIUp6 #OilTops #DowJonesFallsOver500Points
The painful part is familiar: traders see $BTC or $ETH holding a level, ignore the macro headline, then wonder why the move fades. In a Fear market, even good setups can get shaky when inflation fears come back into the room.
Here’s the case study: WTI jumping around 6% is not just an energy story. Higher oil can feed inflation expectations, which can keep central banks cautious for longer. That usually pressures liquidity-sensitive assets, and crypto is still one of the first places traders de-risk when the macro mood turns.
We’ve seen this movie before. In 2022, oil shocks and rate fears hit tech and crypto together. In 2023, when energy cooled and liquidity expectations improved, $BTC found room to breathe again. The difference now is that the market is more mature, with spot flows, stronger stablecoin rails like $USDT, and a much sharper eye on macro triggers.
So the lesson isn’t “oil up means crypto down.” It’s that big oil moves change the conversation around inflation, rates, and risk appetite. If traders are only watching candles and not the macro backdrop, they’re playing half the game.
Are you treating this oil spike as noise, or as a real warning signal for crypto risk? #WTIUp6 #OilTops #DowJonesFallsOver500Points
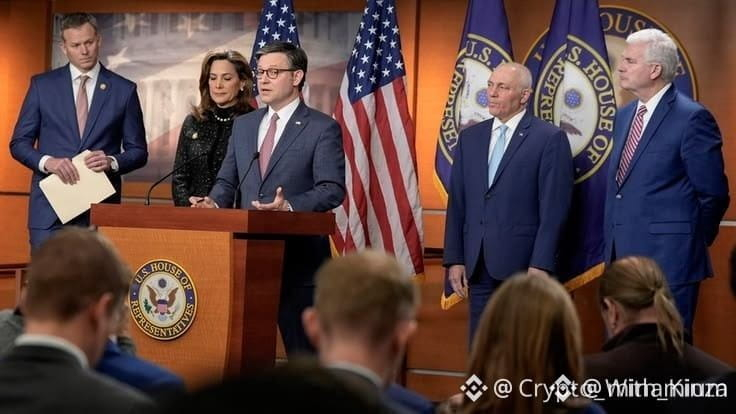
Here’s what happened when the Senate rejected the Iran war powers resolution: the headline looked political, but the market read it as risk.
That’s where traders get caught. They see $ETH holding a level or $BTC bouncing, then ignore the macro trigger that can suddenly push capital into $USDT and away from risk assets.
The case study is simple: when geopolitical escalation stays on the table, markets don’t always crash immediately. Sometimes they reprice quietly first. Oil firms up, equities wobble, and crypto liquidity gets thinner before the big move becomes obvious.
With Fear & Greed sitting in fear territory, this matters. A headline like this can turn a “clean breakout” into a bull trap if leverage is crowded and traders assume crypto is trading in isolation.
The lesson most people miss: watch reactions, not opinions. If oil keeps pushing, the dollar bid strengthens, and $USDT dominance rises, crypto rallies may need more confirmation before they’re trusted.
What are you watching first here: oil, stablecoin flows, or $ETH market structure? #SenateRejectsIranWarPowersResolution #WTIUp6 #OilTops
That’s where traders get caught. They see $ETH holding a level or $BTC bouncing, then ignore the macro trigger that can suddenly push capital into $USDT and away from risk assets.
The case study is simple: when geopolitical escalation stays on the table, markets don’t always crash immediately. Sometimes they reprice quietly first. Oil firms up, equities wobble, and crypto liquidity gets thinner before the big move becomes obvious.
With Fear & Greed sitting in fear territory, this matters. A headline like this can turn a “clean breakout” into a bull trap if leverage is crowded and traders assume crypto is trading in isolation.
The lesson most people miss: watch reactions, not opinions. If oil keeps pushing, the dollar bid strengthens, and $USDT dominance rises, crypto rallies may need more confirmation before they’re trusted.
What are you watching first here: oil, stablecoin flows, or $ETH market structure? #SenateRejectsIranWarPowersResolution #WTIUp6 #OilTops
Oil ripping 6% can move your crypto bags more than a random whale candle, even if you never trade a barrel in your life.
The painful part is most traders only notice oil after $BTC or $ETH has already reacted. They chase the candle, panic into $USDT, then wonder why the market “suddenly” changed mood.
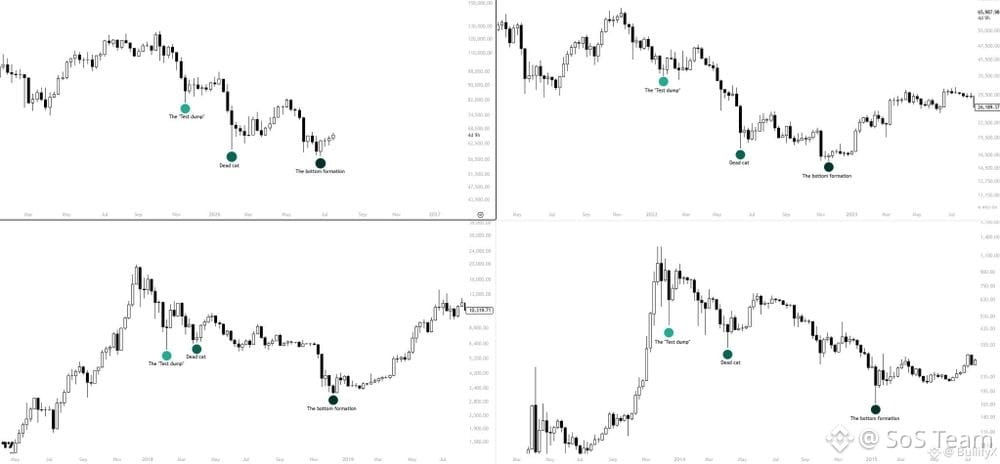
Here’s the lesson from old cycles: oil is not just an energy chart, it’s an inflation signal. When WTI jumps hard, markets start pricing higher fuel costs, stickier CPI, and potentially tighter central bank policy. That can pressure risk assets because liquidity expectations matter as much as narratives.
In fear markets, like the current Fear & Greed reading around 37, this effect gets amplified. Traders are already nervous, so a macro shock can make support levels thinner and rallies easier to fade. I’ve seen this before: in uncertain cycles, the best entries often come after the first emotional reaction, not during it.
Watch how $ETH behaves against $BTC , how stablecoin demand in $USDT changes, and whether oil strength is a one-day spike or part of a bigger trend. If oil keeps climbing while equities weaken, crypto may stay defensive longer than the hopeful crowd expects.
Are you treating the WTI move as noise, or as an early macro warning for crypto? #WTIUp6 #OilTops #ECBHoldsRatesAt2
The painful part is most traders only notice oil after $BTC or $ETH has already reacted. They chase the candle, panic into $USDT, then wonder why the market “suddenly” changed mood.
Here’s the lesson from old cycles: oil is not just an energy chart, it’s an inflation signal. When WTI jumps hard, markets start pricing higher fuel costs, stickier CPI, and potentially tighter central bank policy. That can pressure risk assets because liquidity expectations matter as much as narratives.
In fear markets, like the current Fear & Greed reading around 37, this effect gets amplified. Traders are already nervous, so a macro shock can make support levels thinner and rallies easier to fade. I’ve seen this before: in uncertain cycles, the best entries often come after the first emotional reaction, not during it.
Watch how $ETH behaves against $BTC , how stablecoin demand in $USDT changes, and whether oil strength is a one-day spike or part of a bigger trend. If oil keeps climbing while equities weaken, crypto may stay defensive longer than the hopeful crowd expects.
Are you treating the WTI move as noise, or as an early macro warning for crypto? #WTIUp6 #OilTops #ECBHoldsRatesAt2

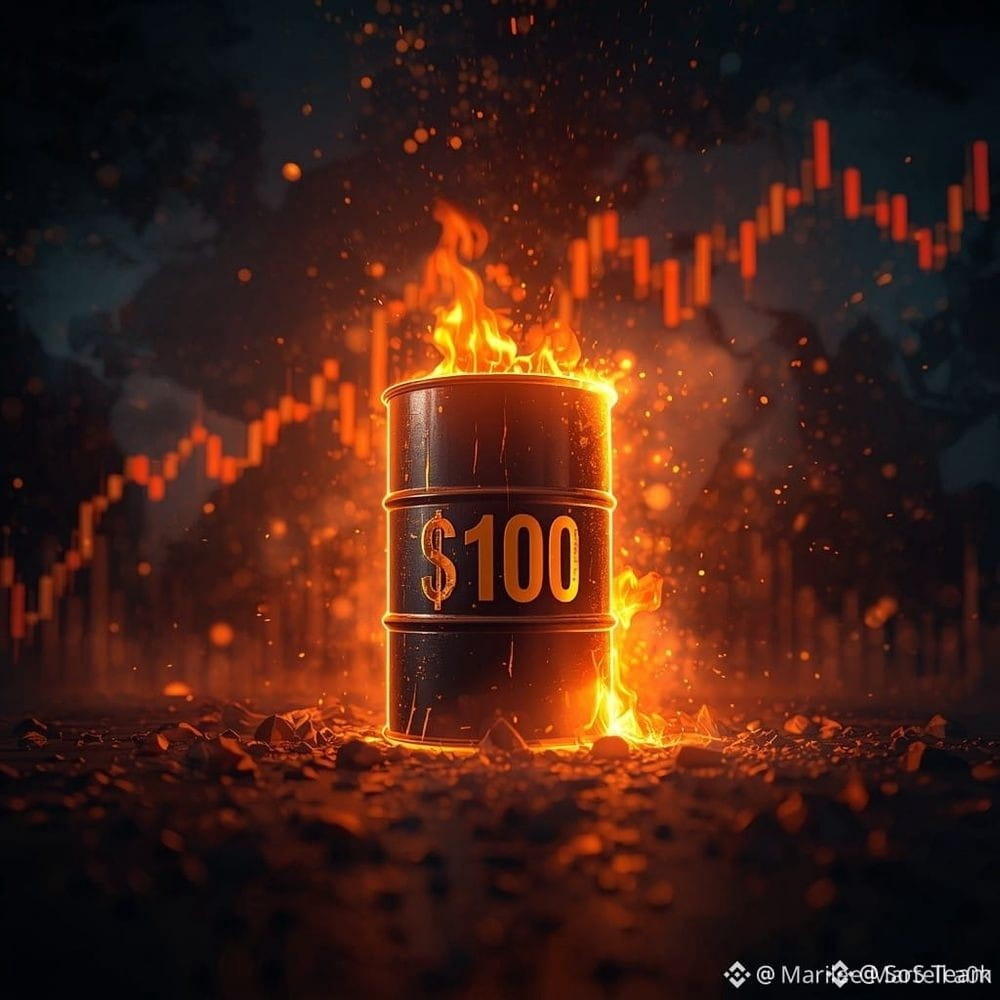
Oil has just broken **$100 per barrel** for the first time since October 2022, and that has direct implications for crypto. Why? Because three-digit oil prices spark global inflation, and inflation forces central banks to keep rates high—or raise them again. High rates = expensive liquidity = less capital flowing into risk assets like Bitcoin and altcoins.
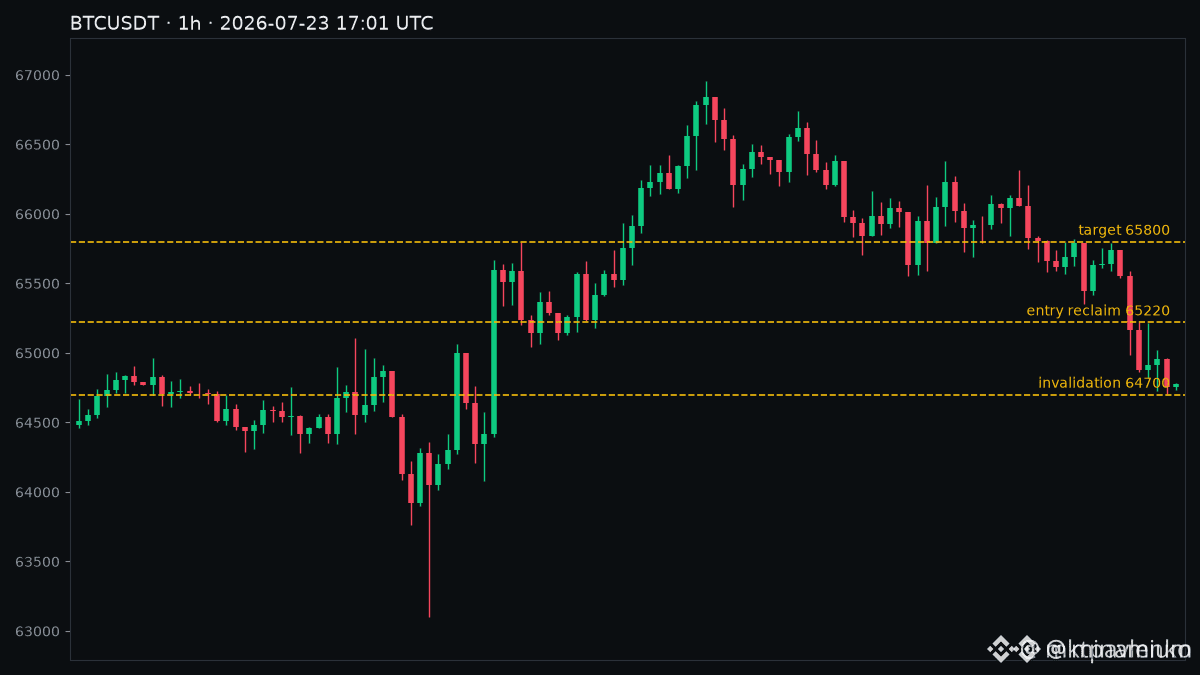
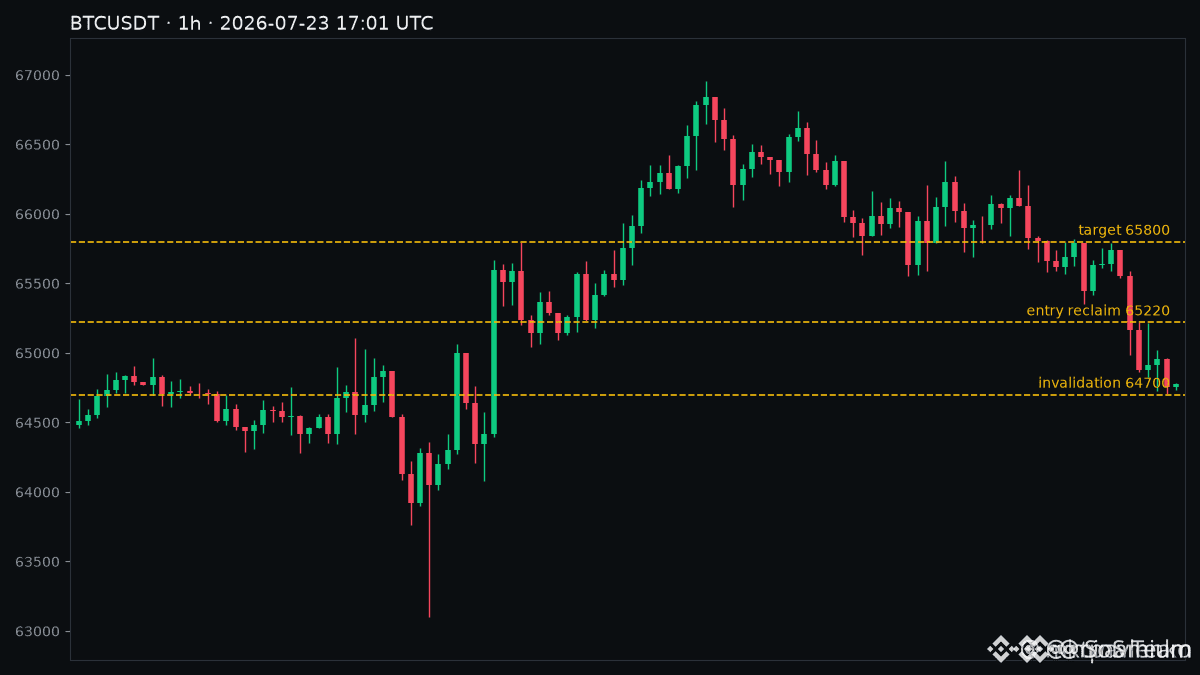
The ECB has just kept rates at **2.25%**, and the US unemployment data fell to **187K (lowest since 1969)**, reinforcing the narrative of a strong economy = the Fed has no rush to cut rates. Meanwhile, Bitcoin is trading at **64700**, with a monthly and annual bearish bias, and the Fear index is at **31 (Fear)**.
The historical correlation between oil > $90 and risk assets is clear: when energy rises, appetite for volatility drops. Fund managers are more bullish on **gold** than at any time since March 2023, showing where capital is moving in a backdrop of macro uncertainty.
Oil above $100 isn’t just a headline; it’s a macro catalyst that could extend the bearish pressure on crypto if inflation reaccelerates. Are you seeing this intersection between energy and liquidity, or are you staying focused only on the BTC chart?
#OilTops$100
The ECB has just kept rates at **2.25%**, and the US unemployment data fell to **187K (lowest since 1969)**, reinforcing the narrative of a strong economy = the Fed has no rush to cut rates. Meanwhile, Bitcoin is trading at **64700**, with a monthly and annual bearish bias, and the Fear index is at **31 (Fear)**.
The historical correlation between oil > $90 and risk assets is clear: when energy rises, appetite for volatility drops. Fund managers are more bullish on **gold** than at any time since March 2023, showing where capital is moving in a backdrop of macro uncertainty.
Oil above $100 isn’t just a headline; it’s a macro catalyst that could extend the bearish pressure on crypto if inflation reaccelerates. Are you seeing this intersection between energy and liquidity, or are you staying focused only on the BTC chart?
#OilTops$100
If you're still trading geopolitics like a one-candle event, stop now.
The costly mistake here is assuming the Senate rejecting the Iran War Powers Resolution is either “bullish risk-on” or “instant war panic.” Traders get chopped up when they FOMO into $ETH or hide in $USDT too late, only to watch oil headlines reverse the whole move.
One side says this rejection removes a constraint and keeps geopolitical risk elevated, especially with oil already sensitive. Higher energy prices can feed inflation fears, pressure equities, and make crypto liquidity thinner. In a Fear market, that matters more than people want to admit.
The other side says markets may have already priced in a lot of the headline risk, and crypto can rebound fast if no escalation follows. I get that argument, but I’m leaning defensive until price confirms strength. If $BTC and $ETH can’t hold key levels while oil keeps pushing, this is not the place to pretend volatility is gone.
Are you treating this as a short-term headline dip, or the start of a bigger macro risk reset? #SenateRejectsIranWarPowersResolution #WTIUp6 #OilTops
The costly mistake here is assuming the Senate rejecting the Iran War Powers Resolution is either “bullish risk-on” or “instant war panic.” Traders get chopped up when they FOMO into $ETH or hide in $USDT too late, only to watch oil headlines reverse the whole move.
One side says this rejection removes a constraint and keeps geopolitical risk elevated, especially with oil already sensitive. Higher energy prices can feed inflation fears, pressure equities, and make crypto liquidity thinner. In a Fear market, that matters more than people want to admit.
The other side says markets may have already priced in a lot of the headline risk, and crypto can rebound fast if no escalation follows. I get that argument, but I’m leaning defensive until price confirms strength. If $BTC and $ETH can’t hold key levels while oil keeps pushing, this is not the place to pretend volatility is gone.
Are you treating this as a short-term headline dip, or the start of a bigger macro risk reset? #SenateRejectsIranWarPowersResolution #WTIUp6 #OilTops


Fed rate-hike odds jumped from 12% to 40% in one week. Bitcoin barely flinched.
That's either the most complacent market I've seen in years, or someone knows something we don't.
Here's what I see:
Oil hit $100 today — first time since June. Iran escalation is real. Brent crude doesn't lie. When oil rips like this, the Fed doesn't cut. They tighten harder.
And the jobs data just confirmed it: US Jobless Claims fell to 187K, lowest since 1969. The economy is running hot. The Fed has zero reason to pivot.
So why is BTC holding $64.8K?
My read:
• ETF inflows: ~$1B over 7 straight sessions. Smart money isn't selling — they're accumulating.
• OI dropped to 743K BTC from 760K. Longs unwinding, NOT fresh shorts piling in. Weak hands out, bears not in control.
• BVIV rising 5 days straight. Post-ETF this has been a caution signal. One thing that makes me pause.
The setup:
• Entry zone: $64,000–$64,800 (21-week SMA sits at $64,073)
• Stop loss: $63,500
• Target 1: $66,800 (range top, failed twice this week)
• Target 2: $68,000 (the breakout level)
I'm in at 25% of my usual size. Iran + $100 oil is the kind of thing that gaps through stops. I'd rather miss the move than get stopped on a headline.
What would change my mind: a clean close below $63,500 on the 4H. That tells me the 21-week SMA failed and the July rally is done.
Buying the fear, or waiting for $60K? Drop your take below 👇
$BTC #OilTops$100 #BitMEXToCloseExchangeSep23 #BitcoinTrading #FedRateDecision
That's either the most complacent market I've seen in years, or someone knows something we don't.
Here's what I see:
Oil hit $100 today — first time since June. Iran escalation is real. Brent crude doesn't lie. When oil rips like this, the Fed doesn't cut. They tighten harder.
And the jobs data just confirmed it: US Jobless Claims fell to 187K, lowest since 1969. The economy is running hot. The Fed has zero reason to pivot.
So why is BTC holding $64.8K?
My read:
• ETF inflows: ~$1B over 7 straight sessions. Smart money isn't selling — they're accumulating.
• OI dropped to 743K BTC from 760K. Longs unwinding, NOT fresh shorts piling in. Weak hands out, bears not in control.
• BVIV rising 5 days straight. Post-ETF this has been a caution signal. One thing that makes me pause.
The setup:
• Entry zone: $64,000–$64,800 (21-week SMA sits at $64,073)
• Stop loss: $63,500
• Target 1: $66,800 (range top, failed twice this week)
• Target 2: $68,000 (the breakout level)
I'm in at 25% of my usual size. Iran + $100 oil is the kind of thing that gaps through stops. I'd rather miss the move than get stopped on a headline.
What would change my mind: a clean close below $63,500 on the 4H. That tells me the 21-week SMA failed and the July rally is done.
Buying the fear, or waiting for $60K? Drop your take below 👇
$BTC #OilTops$100 #BitMEXToCloseExchangeSep23 #BitcoinTrading #FedRateDecision

Energy Shock & Markets: Crude Oil Tops $1000SATS ! 🛢️📈
Crude oil prices have officially surged past a major psychological milestone, hitting $100 a barrel amid escalating geopolitical tensions and supply route concerns in the Strait of Hormuz.
The Catalyst: Recent regional disruptions and supply constraints have tightened energy shipping corridors, driving intense volatility across global commodities and financial markets.
Macro Impact: Higher energy costs are quickly bleeding into inflation fears, forcing both traditional and crypto traders to re-evaluate risk management, liquidity, and short-term market directions.
How will this energy spike impact crypto liquidity and broader market sentiment? Drop your thoughts below! 👇
#OilTops $100 #cryptotrading #Macroeconomics #BinanceSquare #MarketTrends OilTops$100
Crude oil prices have officially surged past a major psychological milestone, hitting $100 a barrel amid escalating geopolitical tensions and supply route concerns in the Strait of Hormuz.
The Catalyst: Recent regional disruptions and supply constraints have tightened energy shipping corridors, driving intense volatility across global commodities and financial markets.
Macro Impact: Higher energy costs are quickly bleeding into inflation fears, forcing both traditional and crypto traders to re-evaluate risk management, liquidity, and short-term market directions.
How will this energy spike impact crypto liquidity and broader market sentiment? Drop your thoughts below! 👇
#OilTops $100 #cryptotrading #Macroeconomics #BinanceSquare #MarketTrends OilTops$100
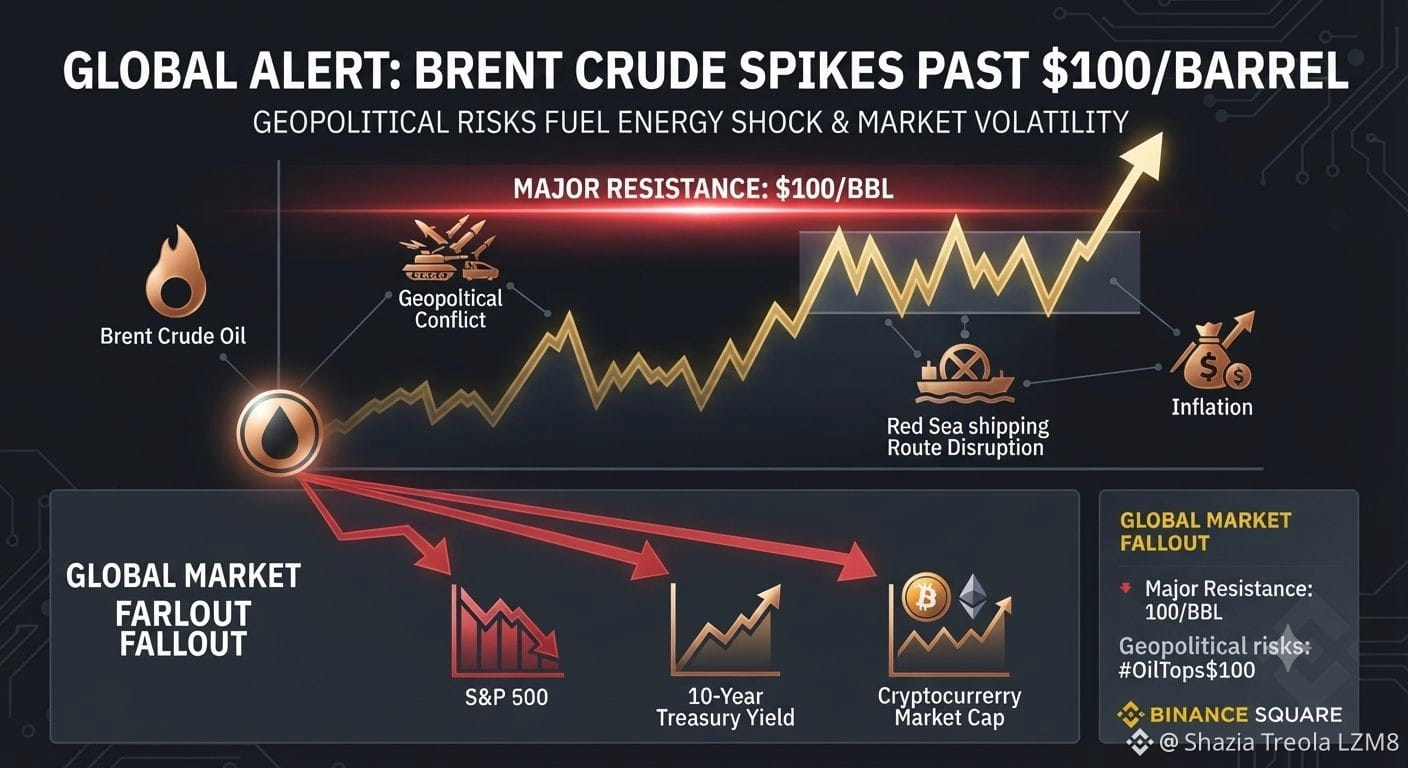

OilTops$1000SATS
Macro and crypto are more correlated than ever. A $100 oil environment means volatility is guaranteed across all sectors. This is the time to stick to your trading plan, avoid over-leveraging on impulse, and watch how institutional money rotates over the coming weeks.
Trade smart, manage your risk, and stay SAFU! 🛡️
#OilTops #macroeconomy $ #bitcoin oin #CryptoPatience Pro trading #BinanceSquare
Macro and crypto are more correlated than ever. A $100 oil environment means volatility is guaranteed across all sectors. This is the time to stick to your trading plan, avoid over-leveraging on impulse, and watch how institutional money rotates over the coming weeks.
Trade smart, manage your risk, and stay SAFU! 🛡️
#OilTops #macroeconomy $ #bitcoin oin #CryptoPatience Pro trading #BinanceSquare
Why is nobody talking about Kazakhstan’s mining program as an energy policy signal, not just another “good news for $BTC ” headline?
Most traders will chase the mining narrative after the candles move, then wonder why they bought the top. The real edge is understanding what this changes before the market turns it into a lazy hype cycle.
Here’s my take: state-backed mining is not bullish because “more miners = number go up.” It matters because governments are starting to treat Bitcoin infrastructure like strategic energy infrastructure. Kazakhstan approving a digital mining program suggests the serious players are thinking about power grids, regulation, tax revenue, and long-term hash rate positioning.
Actionable view: don’t blindly buy every mining-related move. Watch $BTC hash rate trends, energy-policy headlines, and whether miners start expanding in jurisdictions with clearer rules. If fear is still sitting around the market and everyone is hiding in $USDT, that’s exactly when structural narratives deserve attention.
For $ETH traders, this also matters indirectly. Capital rotates where policy clarity improves. If mining becomes more institutional, Bitcoin may keep attracting the “hard asset” bid while high-beta alts need stronger reasons to outperform.
Is Kazakhstan quietly showing the blueprint for the next phase of state-level crypto infrastructure? #KazakhstanApprovesStrategicDigitalMiningProgram #OilTops #USJoblessClaimsFallTo187KLowestSince1969
Most traders will chase the mining narrative after the candles move, then wonder why they bought the top. The real edge is understanding what this changes before the market turns it into a lazy hype cycle.
Here’s my take: state-backed mining is not bullish because “more miners = number go up.” It matters because governments are starting to treat Bitcoin infrastructure like strategic energy infrastructure. Kazakhstan approving a digital mining program suggests the serious players are thinking about power grids, regulation, tax revenue, and long-term hash rate positioning.
Actionable view: don’t blindly buy every mining-related move. Watch $BTC hash rate trends, energy-policy headlines, and whether miners start expanding in jurisdictions with clearer rules. If fear is still sitting around the market and everyone is hiding in $USDT, that’s exactly when structural narratives deserve attention.
For $ETH traders, this also matters indirectly. Capital rotates where policy clarity improves. If mining becomes more institutional, Bitcoin may keep attracting the “hard asset” bid while high-beta alts need stronger reasons to outperform.
Is Kazakhstan quietly showing the blueprint for the next phase of state-level crypto infrastructure? #KazakhstanApprovesStrategicDigitalMiningProgram #OilTops #USJoblessClaimsFallTo187KLowestSince1969


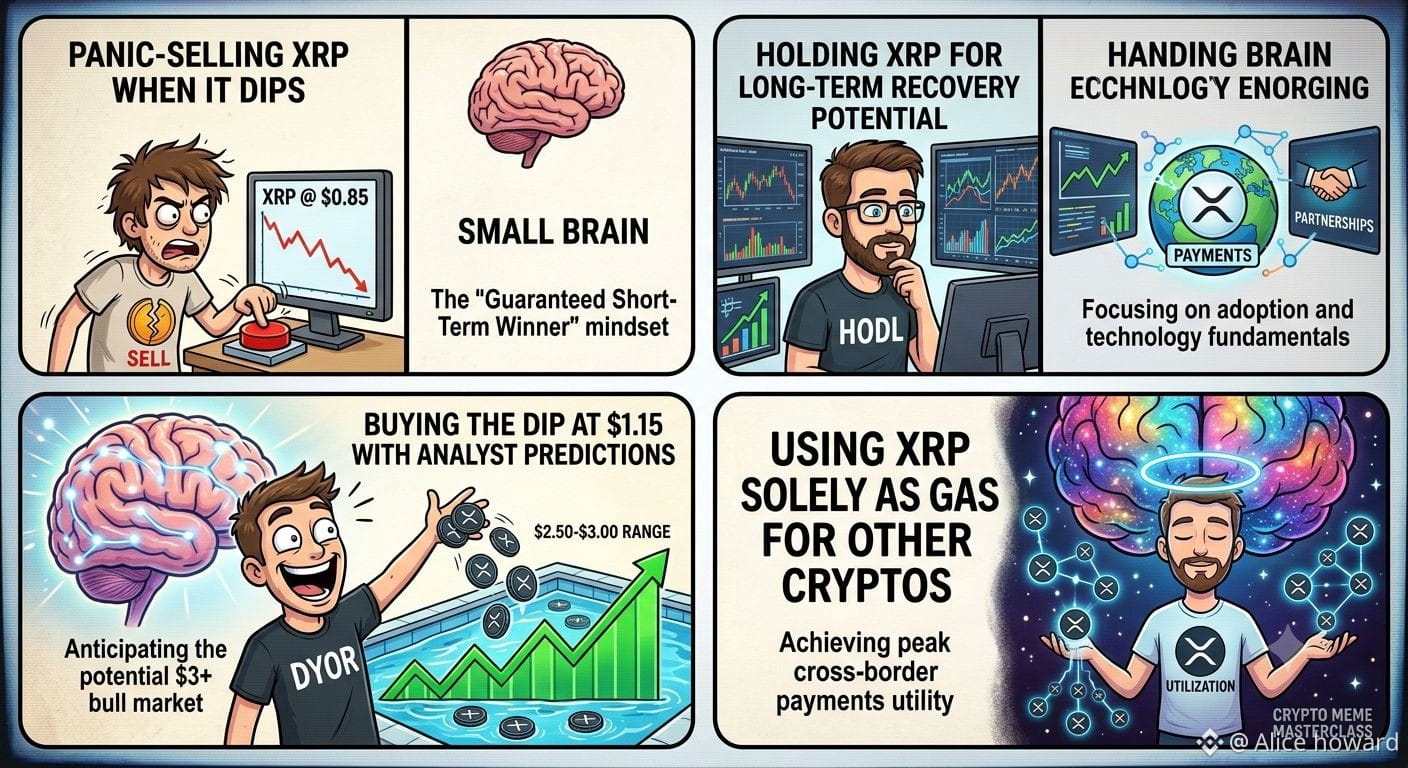
XRP, the native cryptocurrency of the XRP Ledger, remains one of the most recognized digital assets in the crypto market. Despite years of regulatory uncertainty and broader market corrections, it continues to attract attention from both retail and institutional investors. At the time of writing, XRP is trading around $1.10–$1.15, significantly below its all-time high of nearly $3.84. �
coindesk.com +1
The recent decline in XRP's price has been influenced by overall crypto market weakness, reduced speculative activity, and cautious investor sentiment rather than a collapse in Ripple's technology. Meanwhile, Ripple continues expanding partnerships focused on cross-border payments, and XRP-related investment products have continued to see institutional interest. Spot XRP ETFs have also attracted inflows, although price performance has remained subdued. �
The Crypto Times +1
Many analysts believe XRP's long-term outlook depends on several key factors: continued adoption of Ripple's payment technology, favorable regulatory developments, stronger institutional demand, and a broader cryptocurrency bull market. If these conditions improve, XRP could potentially revisit the $2.50–$3.00 range over time. More optimistic scenarios discussed by some analysts extend beyond $3, but these depend on major market catalysts and should not be viewed as expected outcomes. �
The Crypto Times +1
However, investors should also understand the risks. XRP remains highly sensitive to Bitcoin's price movements, macroeconomic conditions, regulatory decisions, and overall market sentiment. If the broader crypto market weakens further, XRP could remain under pressure before any sustained recovery begins. �
AMBCrypto +1
Overall, XRP remains one of the most established cryptocurrencies in the market. While its current price is well below previous highs, many investors continue watching it as a potential long-term recovery candidate rather than a guaranteed short-term winner. As with any cryptocurrency investment, thorough research
#OilTops #BTC
coindesk.com +1
The recent decline in XRP's price has been influenced by overall crypto market weakness, reduced speculative activity, and cautious investor sentiment rather than a collapse in Ripple's technology. Meanwhile, Ripple continues expanding partnerships focused on cross-border payments, and XRP-related investment products have continued to see institutional interest. Spot XRP ETFs have also attracted inflows, although price performance has remained subdued. �
The Crypto Times +1
Many analysts believe XRP's long-term outlook depends on several key factors: continued adoption of Ripple's payment technology, favorable regulatory developments, stronger institutional demand, and a broader cryptocurrency bull market. If these conditions improve, XRP could potentially revisit the $2.50–$3.00 range over time. More optimistic scenarios discussed by some analysts extend beyond $3, but these depend on major market catalysts and should not be viewed as expected outcomes. �
The Crypto Times +1
However, investors should also understand the risks. XRP remains highly sensitive to Bitcoin's price movements, macroeconomic conditions, regulatory decisions, and overall market sentiment. If the broader crypto market weakens further, XRP could remain under pressure before any sustained recovery begins. �
AMBCrypto +1
Overall, XRP remains one of the most established cryptocurrencies in the market. While its current price is well below previous highs, many investors continue watching it as a potential long-term recovery candidate rather than a guaranteed short-term winner. As with any cryptocurrency investment, thorough research
#OilTops #BTC

🔥 A negative Coinbase Premium Index doesn't mean Bitcoin is crashing — it means institutional investors are waiting for a better entry point.
This week's #Bitcoin dip to $65,144 and #OilTops$100 discussions are dominating the headlines.
In every bull cycle, these shakeouts happen 3-5 times before the real price discovery phase, with BTC's Open Interest currently at $6.81B and funding rate at +0.0079% #BTC.
The practical move: with the RSI at 46.4 and MACD showing a bearish crossover, zoom out to the weekly chart and ask yourself if the thesis has changed.
What's your strategy when the market goes red — will you follow smart money buying signals like those seen in Solana, or wait for confirmation?
This week's #Bitcoin dip to $65,144 and #OilTops$100 discussions are dominating the headlines.
In every bull cycle, these shakeouts happen 3-5 times before the real price discovery phase, with BTC's Open Interest currently at $6.81B and funding rate at +0.0079% #BTC.
The practical move: with the RSI at 46.4 and MACD showing a bearish crossover, zoom out to the weekly chart and ask yourself if the thesis has changed.
What's your strategy when the market goes red — will you follow smart money buying signals like those seen in Solana, or wait for confirmation?
🔥 A 10% dip in Robinhood's shares isn't a crash - it's a symptom of a larger issue: the company's crypto revenue and volume fell nearly 50% in Q1, missing industry expectations.
📊 This week's #Bitcoin dip to $64,850 and #OilTops$100 are reminders that market sentiment is currently at a fear level of 31/100, with BTC's RSI at 42.0, indicating a bearish trend.
💡 The bigger picture is that every bull cycle has its shakeouts, and this one is no exception - with smart money signals showing FOMO from 3 smart wallets on Solana, and a long/short ratio of 1.51 on BTC, indicating a bullish sentiment among top traders.
🤔 What's your strategy when the market goes red - do you hold, buy, or wait for confirmation, considering the current futures market intelligence showing a bearish funding rate for ETH and a neutral one for BTC?
📊 This week's #Bitcoin dip to $64,850 and #OilTops$100 are reminders that market sentiment is currently at a fear level of 31/100, with BTC's RSI at 42.0, indicating a bearish trend.
💡 The bigger picture is that every bull cycle has its shakeouts, and this one is no exception - with smart money signals showing FOMO from 3 smart wallets on Solana, and a long/short ratio of 1.51 on BTC, indicating a bullish sentiment among top traders.
🤔 What's your strategy when the market goes red - do you hold, buy, or wait for confirmation, considering the current futures market intelligence showing a bearish funding rate for ETH and a neutral one for BTC?
Everyone thinks geopolitical headlines are automatic long $BTC fuel, but actually they’re often liquidity traps for late buyers.
the mistake is aping the first candle after a senate headline like #SenateRejectsIranWarPowersResolution without checking what market already priced in. fear & greed sitting at 37 tells you people are jumpy, and jumpy markets love fakeouts.
case study: the senate rejecting the iran war powers resolution sounds risk-on for defense policy hawks, but for crypto it’s not that simple. if oil stays bid and macro desks start watching inflation risk again, $ETH and alts can still get slapped while $USDT demand rises from traders hiding in stables.
ngl, the real alpha is not “war headline = buy” or “war headline = sell.” it’s watching whether spot holds after the first reaction, whether funding gets too aggressive, and whether $BTC can reclaim levels without relying on panic volume. headlines move price, but positioning decides who gets paid.
are you treating this as a dip-buy setup or a stay-liquid moment? #SenateRejectsIranWarPowersResolution #WTIUp6 #OilTops
the mistake is aping the first candle after a senate headline like #SenateRejectsIranWarPowersResolution without checking what market already priced in. fear & greed sitting at 37 tells you people are jumpy, and jumpy markets love fakeouts.
case study: the senate rejecting the iran war powers resolution sounds risk-on for defense policy hawks, but for crypto it’s not that simple. if oil stays bid and macro desks start watching inflation risk again, $ETH and alts can still get slapped while $USDT demand rises from traders hiding in stables.
ngl, the real alpha is not “war headline = buy” or “war headline = sell.” it’s watching whether spot holds after the first reaction, whether funding gets too aggressive, and whether $BTC can reclaim levels without relying on panic volume. headlines move price, but positioning decides who gets paid.
are you treating this as a dip-buy setup or a stay-liquid moment? #SenateRejectsIranWarPowersResolution #WTIUp6 #OilTops
If you're still trading rate decisions like instant green candles, stop now.
The expensive mistake is assuming “no change” means “no risk.” Traders get chopped up because they buy the headline, then realize the market was actually pricing the next 3 months, not the next 3 minutes.
The ECB holding rates at 2% is basically macro’s version of “we’re not mad, just disappointed.” It doesn’t scream liquidity party like 2020, but it also isn’t the brutal 2022 hiking cycle that turned every dip-buy into a character-building exercise.
For crypto, the comparison that matters is how this stacks against past central bank pauses. When the Fed paused, $BTC and $ETH didn’t automatically moon; they waited for the market to believe cuts, liquidity, and risk appetite were actually coming back. With Fear & Greed sitting in fear territory, stablecoin parking in $USDT makes sense, but too much caution can also mean people are under-positioned if macro starts easing.
So here’s the real debate: is the ECB hold a quiet green light for risk assets, or just another “pause before the pain” setup? #ECBHoldsRatesAt2 #USJoblessClaimsFallTo187KLowestSince1969 #OilTops
The expensive mistake is assuming “no change” means “no risk.” Traders get chopped up because they buy the headline, then realize the market was actually pricing the next 3 months, not the next 3 minutes.
The ECB holding rates at 2% is basically macro’s version of “we’re not mad, just disappointed.” It doesn’t scream liquidity party like 2020, but it also isn’t the brutal 2022 hiking cycle that turned every dip-buy into a character-building exercise.
For crypto, the comparison that matters is how this stacks against past central bank pauses. When the Fed paused, $BTC and $ETH didn’t automatically moon; they waited for the market to believe cuts, liquidity, and risk appetite were actually coming back. With Fear & Greed sitting in fear territory, stablecoin parking in $USDT makes sense, but too much caution can also mean people are under-positioned if macro starts easing.
So here’s the real debate: is the ECB hold a quiet green light for risk assets, or just another “pause before the pain” setup? #ECBHoldsRatesAt2 #USJoblessClaimsFallTo187KLowestSince1969 #OilTops


Log in to explore more content