

#galaxy
galaxy
76,704 views
209 Discussing
Hot
Latest

·
--
Galaxy calls this an accumulation zone.
Galaxy Trading says $BTC, trading near $77,000, is firmly in accumulation and sees a path to $80,000 by March 2027 (KuCoin news flash).
Meanwhile Fear & Greed sits around 30-34, derivatives volume is down sharply and whales on Hyperliquid are mostly short. Fear plus thin leverage is an interesting mix.
Do you read this as patient accumulation or a market that just lacks buyers? Curious which side you're on. Not financial advice.
#Bitcoin #Galaxy #FearAndGreed $ETH
Galaxy calls this an accumulation zone.
Galaxy Trading says $BTC , trading near $77,000, is firmly in accumulation and sees a path to $80,000 by March 2027 (KuCoin news flash).
Meanwhile Fear & Greed sits around 30-34, derivatives volume is down sharply and whales on Hyperliquid are mostly short. Fear plus thin leverage is an interesting mix.
Do you read this as patient accumulation or a market that just lacks buyers? Curious which side you're on. Not financial advice.
#Bitcoin #Galaxy #FearAndGreed $ETH
6

·
--
Golden Pig's take: Galaxy wants to open a federally regulated crypto trust bank in New York. That’s more substantial than today’s price swings. Custody compliance is a slow-moving trend, but the direction is clear: more and more big money will flow through regulated custodians.
Novogratz’s Galaxy (U.S. ticker: GLXY) filed an application with the U.S. Office of the Comptroller of the Currency (OCC) on 10/29 to establish Galaxy National Bank, bringing custody, trading, and staking under one federal framework.
Note that this is only an application; it hasn’t been approved yet. Galaxy already holds more than 50 licenses, including New York’s BitLicense.
The Binance hot wallet theft hasn’t been resolved yet. What I’ve been more concerned about these past few days is where the money is held and who’s keeping custody of it.
$BTC is now around 77,500, basically moving sideways. News like this won’t be reflected in the price right away, so I wouldn’t chase it.
After these past few days, how would you allocate your holdings across exchanges, custodians, and self-custody?
#Galaxy #加密银行 #BTC $BTC
Source: Galaxy official press release (PR Newswire, 2026-10-29); Binance spot market data
DYOR; this is not investment advice

BTC+0.81%
GLXYUS-11.69%
1
220

·
--
Came across a post saying Galaxy Digital ($GLXY) has just applied to the U.S. Office of the Comptroller of the Currency (OCC) to establish Galaxy National Bank, a national trust bank headquartered in New York.
If approved, it would bring digital asset custody, trading, staking, and fiduciary investment advisory services under a single federal regulatory framework. Trust banks cannot take deposits or make commercial loans, but they can be regulated directly by the OCC.
The company says it already holds more than 50 licenses across the U.S., Europe, and Asia. New York’s DFS recently approved its BitLicense and money transmitter license. The wave of trust bank applications is heating up—Ripple just received conditional approval, while the Independent Community Bankers of America is suing the OCC.
The institutional licensing arms race continues.
#Galaxy #GLXY #OCC #TrustBank

GLXYUS-11.69%
1
·
--
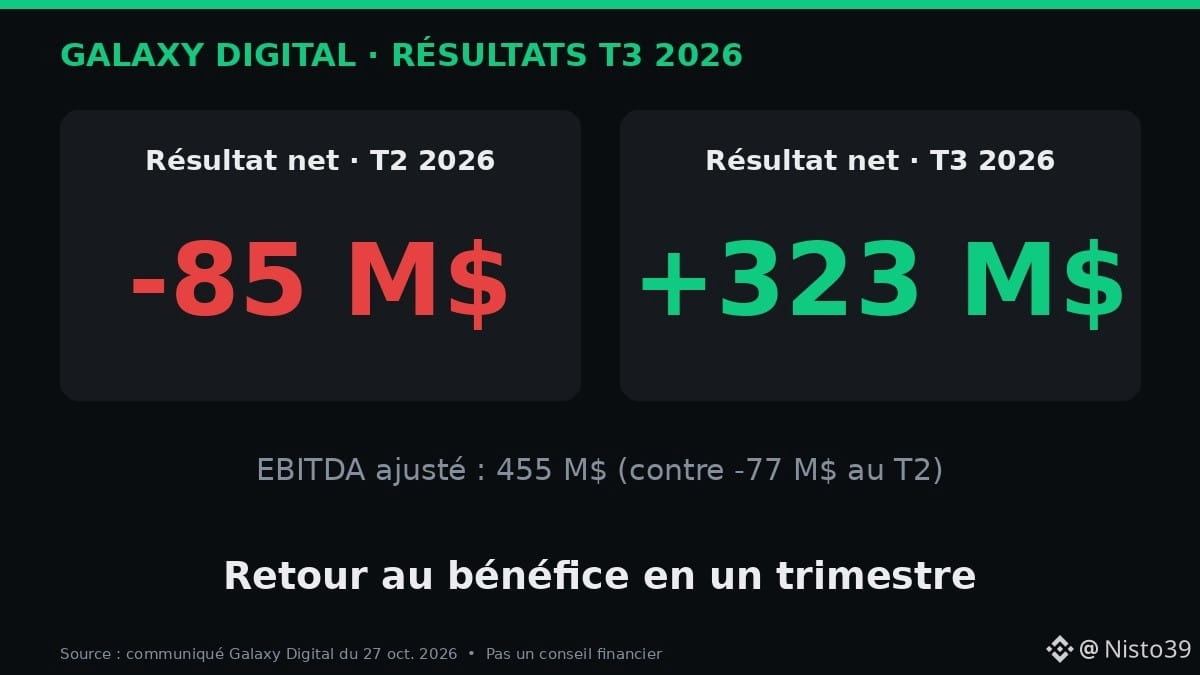
Galaxy Digital is back in the black: $323 million in net income in the third quarter of 2026, compared with a loss of $85 million in the previous quarter.
The figures published on October 27 by Mike Novogratz’s company:
• Net income: $323M
• Adjusted EBITDA: $455 M$ (compared with -$77 M$ in the second quarter)
• Cash, stablecoins and U.S. Treasury bills: $4.9 billion, almost double in 3 months
• Share buyback: an additional $200 M$ authorized
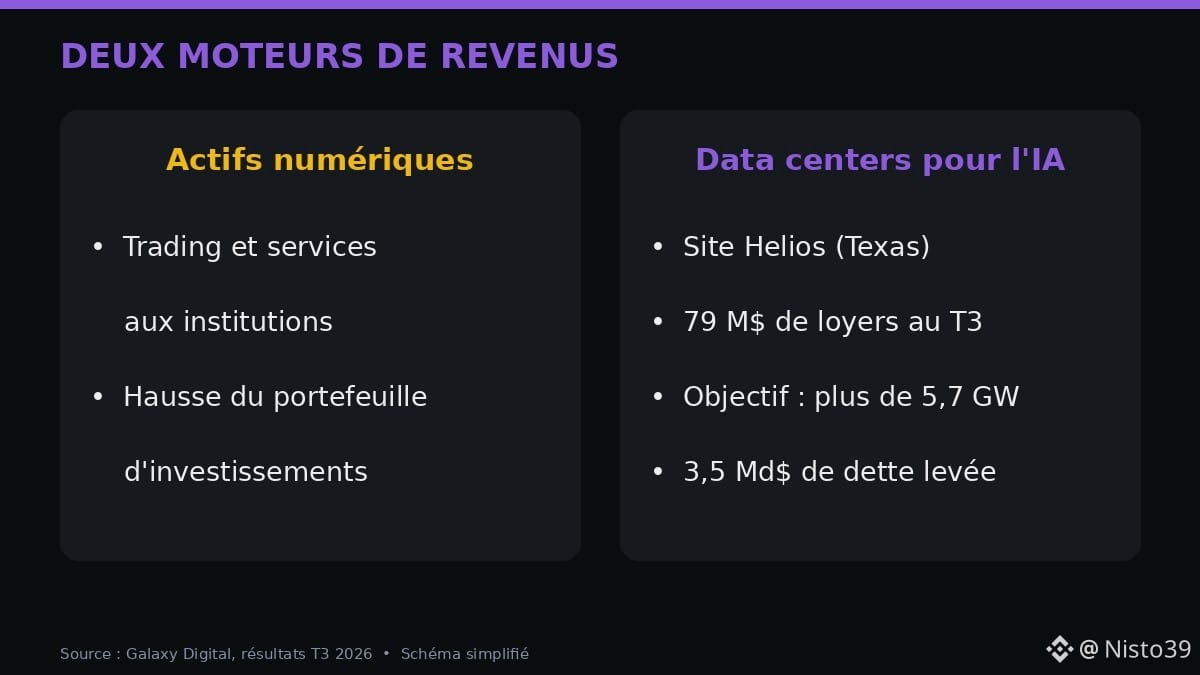
Where did this profit come from? Mainly from two drivers. First, its crypto business (trading, services for institutions) and the sharp increase in the value of its investment portfolio. Then there’s a new driver: data centers. Its Helios site in Texas leases computing power for AI. First full quarter of rental income: $79M. Galaxy is targeting more than 5.7 GW of power capacity and has raised 3.5 billion M$ in debt to build out the next phase.
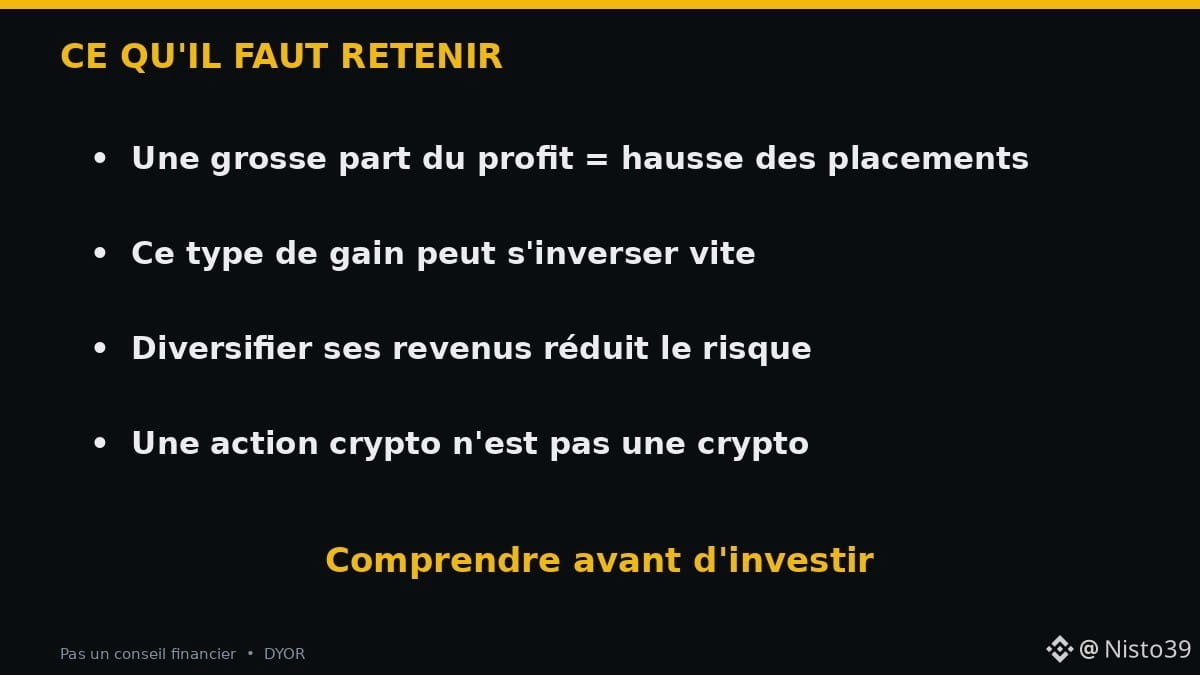
One caveat: a large part of the profit comes from the increased value of its investments. This kind of gain can reverse next quarter if the market falls.
In practical terms: Moussa (a fictional character) repairs phones in Niamey. For him, the lesson is simple: even crypto giants are no longer relying on a single source of revenue. They’re diversifying. On a small scale, the same rule applies: don’t put everything into one asset.
Glossary:
• EBITDA: earnings before interest, taxes, depreciation and amortization, a measure of business profitability.
• Share buyback: when a company buys back its own shares on the stock market.
Not financial advice. A share in a crypto company is not a cryptocurrency.
Do you think the future of crypto companies lies in AI?
#Galaxy #CryptoNews #IA #CryptoAfrique #Bourse
35

·
--
Guys, Galaxy has made its position clear this time: Bitcoin’s bear market will end in June, and we’re in an accumulation phase now. I just don’t get it: if they’re bold enough to say that, why are US buyers still sitting on the sidelines?
Galaxy’s October 26 report is pretty convincing: after bottoming at around $58,500 in late June, Bitcoin closed above its 50-week moving average for five straight weeks; before that, it had spent 44 weeks below it. Monthly outflows of coins held for over five years fell from 67,000 in June 2024 to 34,000 this March—so there’s less selling pressure.
It’s like a market stall near closing time: the vendor says they won’t lower the price, and the shoppers just look but don’t buy.
But the counterevidence is strong, too: CryptoQuant says the Coinbase premium wasn’t positive once in October, and on October 24 it fell to -0.146, its lowest since late June. Spot demand has been negative every day since October 14. Bitcoin is down about 4.2% in October and could be headed for its worst October in six years.
My take is that both things can be true at once: selling pressure running out doesn’t mean buyers are back. Galaxy left itself an escape hatch, too: if the weekly close falls below the 50-week moving average at around $76,540 and doesn’t get back above it within a month, its thesis won’t hold up.
At around $81,000 now, have you ever been in this situation: everyone says the bottom is in, but you’re afraid to make the first move? Did you later get a better price, or miss out?
This is just my personal opinion and isn’t investment advice.
$BTC #比特币 #Galaxy
149

·
--

Article
Bitcoin’s bottom may have passed while everyone was still hesitatingGalaxy recently published a report with a clear conclusion: Bitcoin’s current bear market may have ended in June this year, and it is now in a phase where coins are gradually being accumulated.
Note that this is Galaxy’s assessment, not a market outcome that has been confirmed. The report uses data from October 22: at the time, Bitcoin was around $81,400, 35% below its record high in October last year, but already up 39% from its low at the end of June this year.
In other words, if you’re only focused on “how far it is from breaking even,” it’s easy to overlook one thing: it has already made a significant recovery from its low.
Bitcoin’s bottom may have passed while everyone was still hesitating
Galaxy recently published a report with a clear conclusion: Bitcoin’s current bear market may have ended in June this year, and it is now in a phase where coins are gradually being accumulated.
Note that this is Galaxy’s assessment, not a market outcome that has been confirmed. The report uses data from October 22: at the time, Bitcoin was around $81,400, 35% below its record high in October last year, but already up 39% from its low at the end of June this year.
In other words, if you’re only focused on “how far it is from breaking even,” it’s easy to overlook one thing: it has already made a significant recovery from its low.
2
50

·
--
🏦 Galaxy: “The bear market ended in June — and Bitcoin is in a consolidation phase”
$BTC A new memo from Galaxy to its clients is making waves today: the company’s head of research, Alex Thorn, says the bear market ended in June and that Bitcoin has entered a consolidation phase that preceded every previous rally — in his words.
What does “consolidation” mean in simple terms?
- A phase when the price moves sideways within a range, selling pressure eases, and there hasn’t yet been a sharp rally
- It’s an institutional analysis, not a confirmed fact — and the market has disproved similar calls before
The context supporting the case — and its limitations:
- Bitcoin climbed back above $80,000, and spot Bitcoin funds recorded $110 million in inflows on Monday (SoSoValue), following $774 million in outflows over the two previous sessions
- But October is still down overall, with around $202 million in net outflows from the funds — meaning the institutional picture is still cautious, not fully enthusiastic
Bottom line:
Galaxy’s memo offers a long-term bullish narrative, but the latest figures say the market is uncertain, and tonight’s Fed decision will be the deciding factor.
Do you buy the “consolidation” narrative, or do you think the market is still in a downturn? Comment 🚀 for consolidation and 🐻 for downturn 👇
Source: CoinDesk via a Galaxy memo + SoSoValue
#البيتكوين #Galaxy
43

·
--
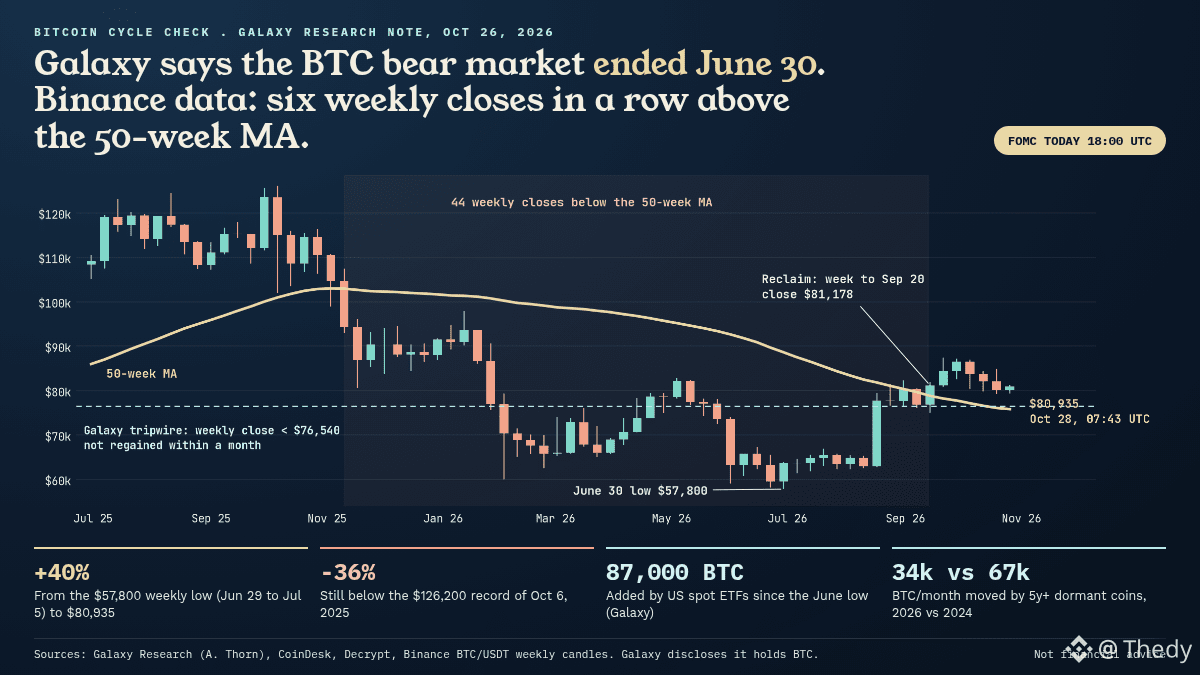
Galaxy Research (in an Alex Thorn note published on 10/26) spells it out: the bear market of $BTC ended with the June 30 low. The chart shows the central argument, using Binance weekly candles.
What the data confirms: BTC closed below its 50-week moving average for 44 consecutive weeks, from mid-November 2025 to mid-September 2026. The recovery began in the week ending 09/20 ($81,178), and there have now been six consecutive weekly closes above it. The cycle low on Binance: $57,800, in the week of 06/29. This morning at 07:43 UTC, BTC is at $80,935, up 40% from that low, but still 36% below the record of $126,200 set on 10/06/2025.
Galaxy’s other arguments: since 2011, there have been four recoveries above this moving average after spending 20 weeks or more below it, and none was followed by a weekly close more than 8.4% below the recovery level within a year. Coins dormant for 5 years or more are moving at a rate of about 34,000 BTC per month in 2026, versus 67,000 in 2024. US spot ETFs have added 87,000 BTC since June, and another $176M on Tuesday 10/27, according to Farside (IBIT $151.5M).
Keep in mind: Galaxy discloses that it holds BTC, and the margin remains thin. The 50-week moving average is around $76,100 according to my Binance calculation ($76,540 at Galaxy), about 6% below the price.
My take: the signal is real, but it hasn’t produced a trend yet; weekly closes have been declining since $86,530 in late September. The Fed decides tonight at 18:00 UTC.
- If BTC closes a day above $82,500 (the threshold cited by CoinDesk), the recovery gains momentum.
- A weekly close below ~$76,500 that isn’t recovered within a month would invalidate the thesis, by Galaxy’s own admission.
Do you use the 50-week moving average as a cycle signal, or is it too slow for decision-making?
#Bitcoin #Galaxy
85

·
--
In plain English: Galaxy has shown its hand—the bear market died in June, and now it’s time to scoop up assets. Don’t dismiss it: this isn’t some random hot take. It’s a report by Alex Thorn, Galaxy’s head of research, and it’s titled “Time to Add.”
Yesterday I said to wait for the Fed’s decision, and today we’re still waiting. $BTC touched $81K and then pulled back—neither proving me wrong nor delivering a breakout. But Galaxy has two solid points: $BTC has closed above its 50-week moving average for five straight weeks after spending 44 weeks below it; and it’s now nearly 40% above its June low of under $58K, while CME net longs have fallen 57%. Thorn drew a line in the sand: if the weekly close falls below $76,540 and price can’t recover within a month, this thesis is invalidated.
U.S. consumer confidence hit 91.7 in October, well above expectations of 81, and rose for the first time in four months. $ZEC jumped 8% today, briefly touching $1,320 and moving back above $1,300. But the whole market is waiting for the Fed’s decision at 2 a.m. tonight. Nine in ten are betting on no change; the real drama is what they say about whether rates will be raised in December.
Until $76,540 breaks, don’t scare yourself. If it does, don’t stubbornly hold on either. Just my personal opinion, not financial advice. After tonight’s announcement, will $BTC reclaim $82,500 first, or retest $76,540 first? Pick a side in the comments!
#FOMCWatch #Bitcoin #Galaxy #CryptoNews

1
264

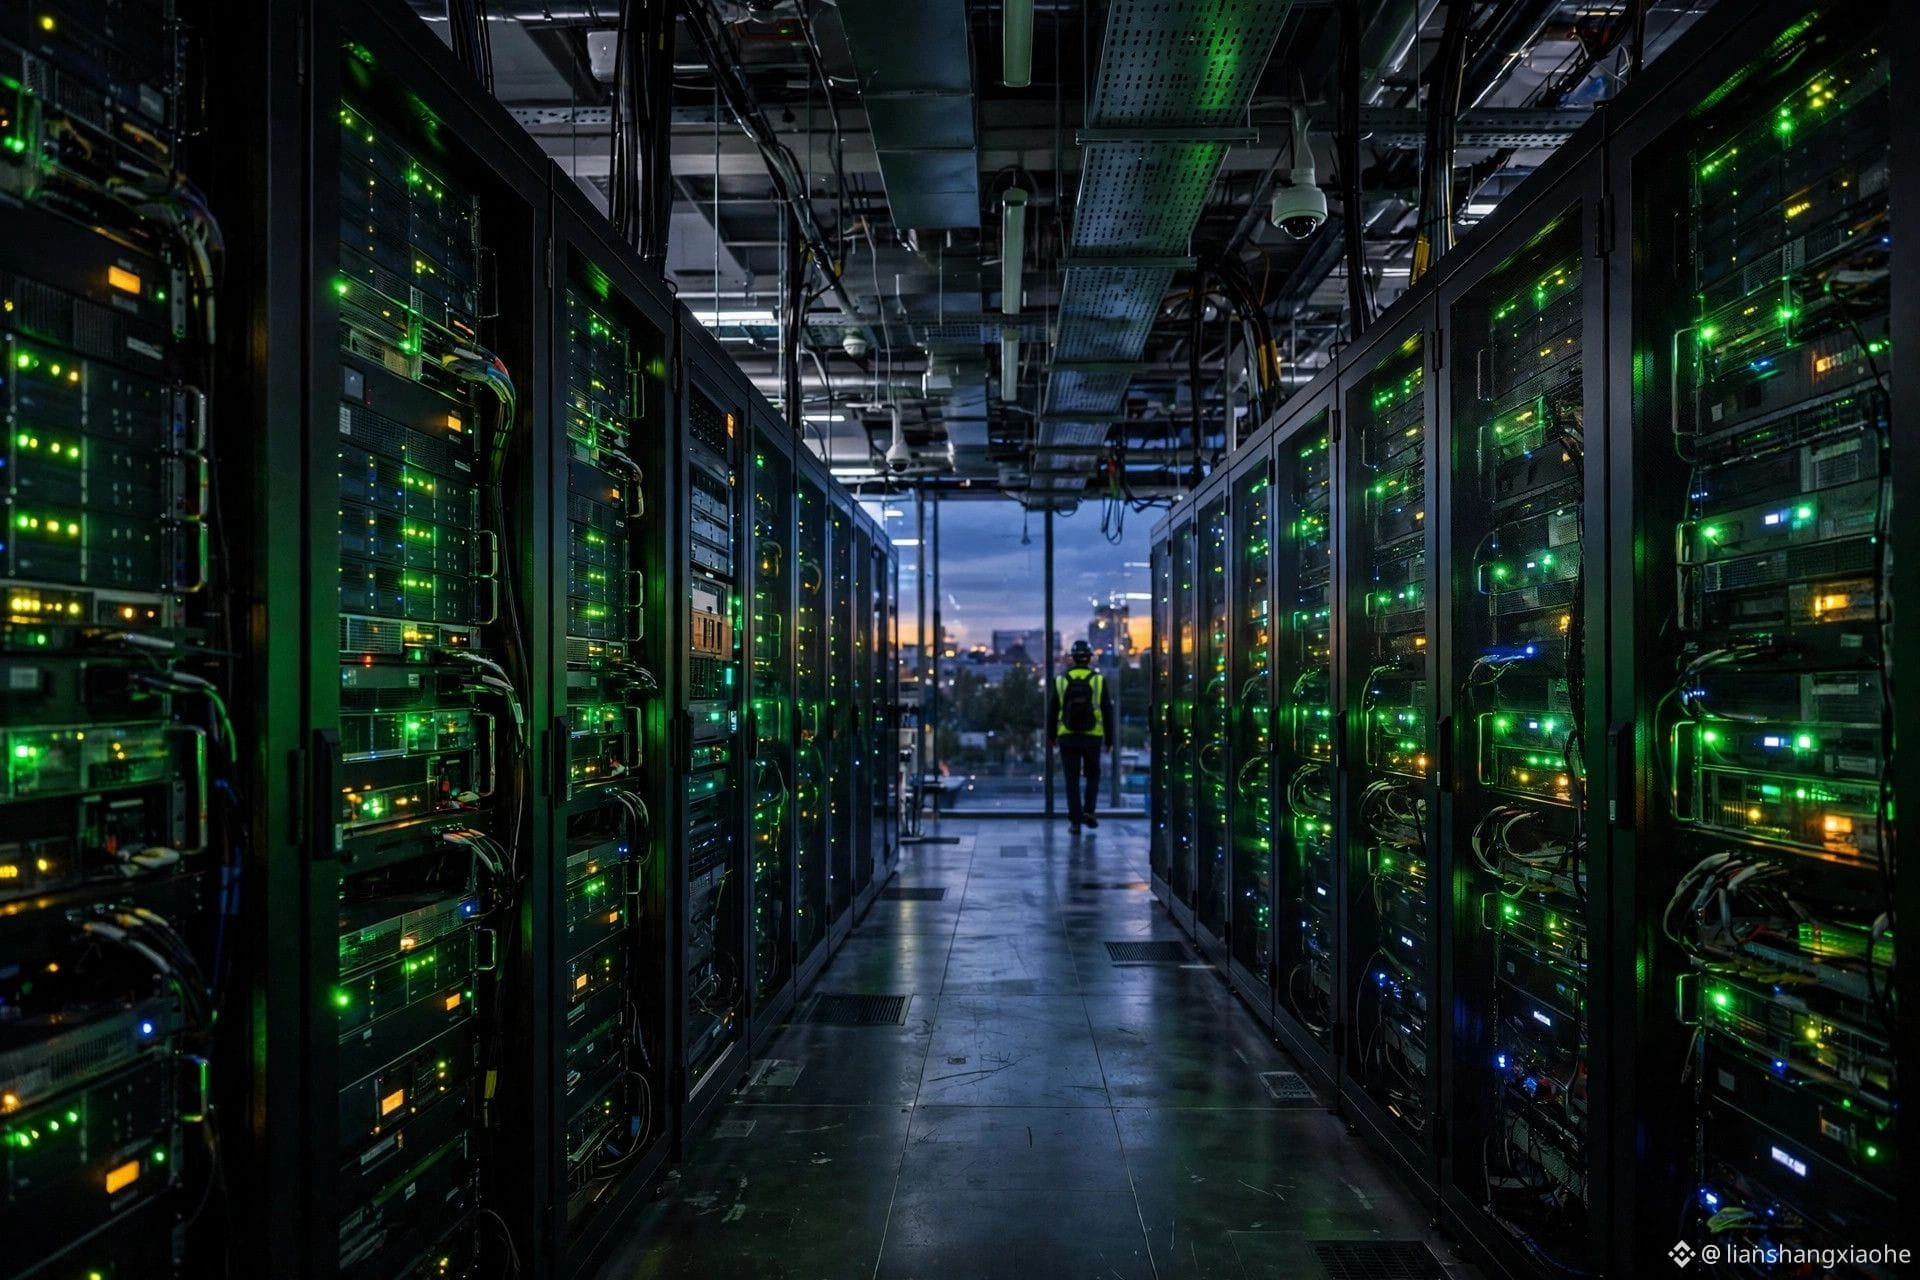
After Galaxy Digital’s Q3 earnings came out, GLXY jumped 9.5% that day, closing at $17.18: it earned $323 million in the third quarter, after losing $85 million last quarter—a remarkable turnaround. Adjusted gross profit was $569 million and adjusted EBITDA was $455 million. Data centers were the biggest driver: all 133 MW of Helios Phase I was delivered to CoreWeave, contributing $79 million in gross profit in its first full quarter. Trading volume rose 12% quarter over quarter, and the average loan book grew 27% to $1.8 billion. The board also approved a $200 million buyback. Crypto companies are shifting from making money by trading coins to earning rent and making loans. #Galaxy #Earnings
After Galaxy Digital’s Q3 earnings came out, GLXY jumped 9.5% that day, closing at $17.18: it earned $323 million in the third quarter, after losing $85 million last quarter—a remarkable turnaround. Adjusted gross profit was $569 million and adjusted EBITDA was $455 million. Data centers were the biggest driver: all 133 MW of Helios Phase I was delivered to CoreWeave, contributing $79 million in gross profit in its first full quarter. Trading volume rose 12% quarter over quarter, and the average loan book grew 27% to $1.8 billion. The board also approved a $200 million buyback. Crypto companies are shifting from making money by trading coins to earning rent and making loans. #Galaxy #Earnings
30

·
--
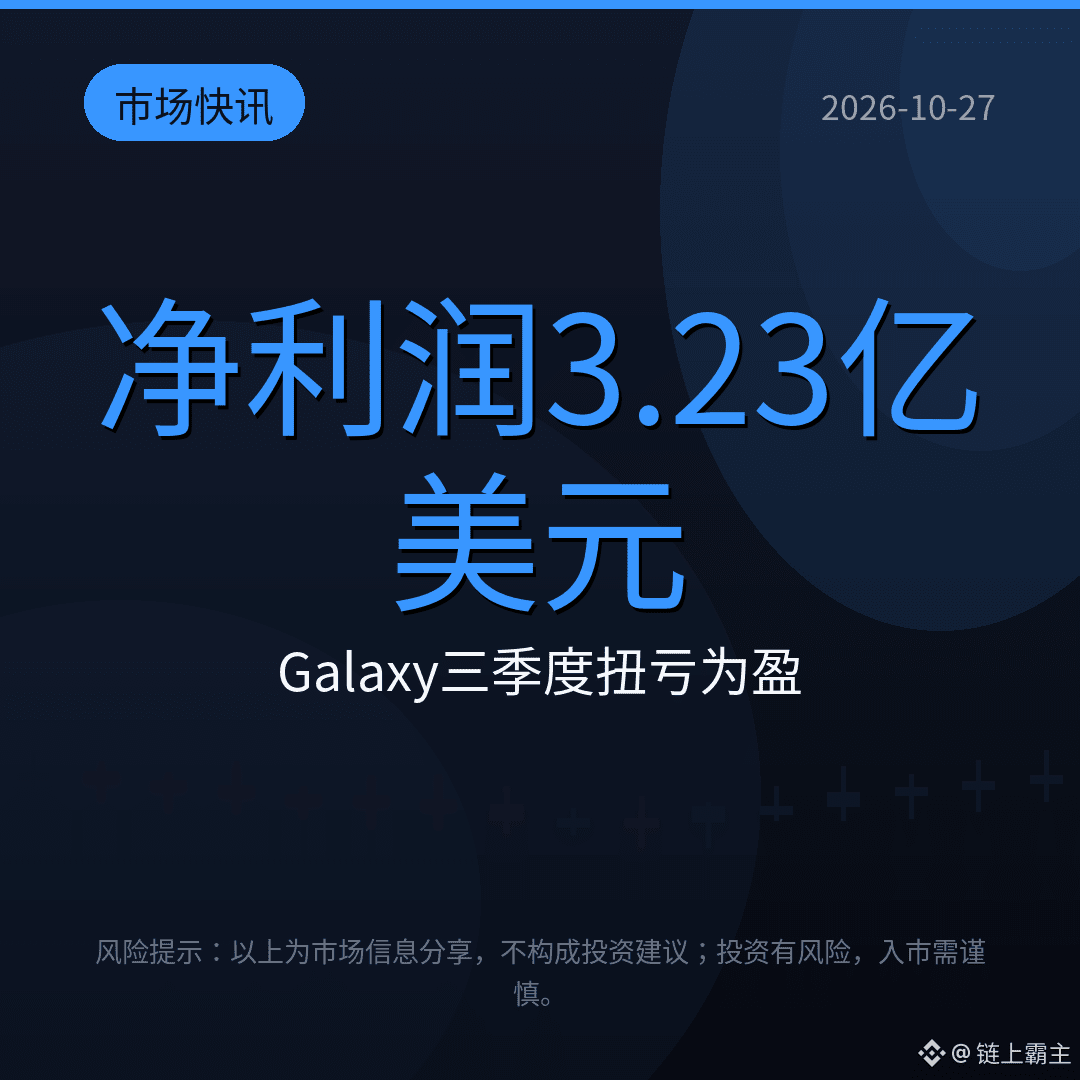
【Market Update】Galaxy swung to a profit in the third quarter: net income of $323 million, compared with a loss of $85 million last quarter; adjusted EBITDA rose from -$77 million to $455 million.
Proprietary and corporate businesses contributed $419 million, out of adjusted gross profit of $569 million; data centers rose from $20 million to $79 million.
Novogratz attributed the results to portfolio appreciation. Institutional earnings are rebounding—is the crypto winter over, or is this just a one-quarter bounce? Share your thoughts in the comments.
$BTC $ETH $SOL
#Galaxy #加密财报 #Bitcoin
(Source: Unchained)
⚠️Risk warning: The above is for sharing market information only and does not constitute investment advice. Investing involves risks; please exercise caution.
473

·
--
Bullish
$125k — no date. $76540 — with a deadline.
Galaxy (Alex Thorn) writes that Bitcoin’s bear market ended back in June, and that we’re now in the accumulation phase. Among the arguments: U.S. spot ETFs have added 87k BTC since the June low.
Channels have already turned this into “the best time to buy.” But the report itself says “at least $125k,” without saying when.
But the condition that would prove the thesis wrong is specific: a weekly close below the 50-week average of $76540, with no recovery above it within a month.
$BTC
{future}(BTCUSDT)
It’s now 80257 USDT. So the thesis will be tested not in a year, but in the coming weeks.
One more thing: Galaxy says in its disclaimer that it may itself hold assets covered in the report. So I read this as the view of a market participant.
I don’t hold bitcoin, and I wouldn’t make decisions based on a report like this until the weekly candles show it. Do you believe the bear market is already over? For now, I’m watching the level, not the text.
#GALAXY #bitcoin #BTC #etf #AlexThorn
$125k — no date. $76540 — with a deadline.
Galaxy (Alex Thorn) writes that Bitcoin’s bear market ended back in June, and that we’re now in the accumulation phase. Among the arguments: U.S. spot ETFs have added 87k BTC since the June low.
Channels have already turned this into “the best time to buy.” But the report itself says “at least $125k,” without saying when.
But the condition that would prove the thesis wrong is specific: a weekly close below the 50-week average of $76540, with no recovery above it within a month.
$BTC
It’s now 80257 USDT. So the thesis will be tested not in a year, but in the coming weeks.
One more thing: Galaxy says in its disclaimer that it may itself hold assets covered in the report. So I read this as the view of a market participant.
I don’t hold bitcoin, and I wouldn’t make decisions based on a report like this until the weekly candles show it. Do you believe the bear market is already over? For now, I’m watching the level, not the text.
#GALAXY #bitcoin #BTC #etf #AlexThorn
92

·
--
Half from crypto, half from data centers: Galaxy made $323 million in Q3Half of Galaxy’s money this quarter came from rising crypto prices, and the other half came from building data centers for AI.
On October 27, Galaxy (Nasdaq: GLXY) released its Q3 earnings report: net profit was $323 million, after a loss of $85 million in the previous quarter; diluted earnings per share were $0.66, adjusted EPS was $0.83; adjusted EBITDA was $455 million.
Several numbers worth taking a closer look at:
- Cash, stablecoins, and U.S. Treasuries totaled $4.9 billion, nearly doubling quarter over quarter, of which U.S. Treasuries were about $2.76 billion.
- Adjusted gross profit from the data center business was $79 million, up 293% quarter over quarter (Wu Shuo cited the financial report, mainly from delivering 133 MW to CoreWeave).
Half from crypto, half from data centers: Galaxy made $323 million in Q3
Half of Galaxy’s money this quarter came from rising crypto prices, and the other half came from building data centers for AI.
On October 27, Galaxy (Nasdaq: GLXY) released its Q3 earnings report: net profit was $323 million, after a loss of $85 million in the previous quarter; diluted earnings per share were $0.66, adjusted EPS was $0.83; adjusted EBITDA was $455 million.
Several numbers worth taking a closer look at:
- Cash, stablecoins, and U.S. Treasuries totaled $4.9 billion, nearly doubling quarter over quarter, of which U.S. Treasuries were about $2.76 billion.
- Adjusted gross profit from the data center business was $79 million, up 293% quarter over quarter (Wu Shuo cited the financial report, mainly from delivering 133 MW to CoreWeave).
146

·
--
Galaxy swings to a $323 million profit in Q3: Data center profits surge as crypto companies become AI infrastructure stocks
According to Galaxy’s official earnings report (10/27) and Investing.com:
· Q3 net income was $323 million (vs. an $85 million loss in Q2); diluted EPS was $0.66 and adjusted EPS was $0.83; adjusted EBITDA was $455 million
· Data center adjusted EBITDA was $69 million, up 498% quarter over quarter; adjusted EBITDA for the digital assets business remained at -$9 million
· Total power pipeline exceeded 5.7 GW. Galaxy completed a $3.5 billion senior secured notes offering to fund construction of Phase II of Helios I; the board authorized an additional $200 million in share repurchases
· Cash, stablecoins, and U.S. Treasuries totaled $4.9 billion, roughly double the previous quarter
[Viewpoint]
The most important takeaway from this report isn’t net income, but the business mix: trading and asset management are still near breakeven, while AI data centers are driving real growth. BTC is hovering below $80,000 today as the FOMC meeting gets underway. Gains in Galaxy’s investment portfolio benefited from Q3 market conditions, but whether that continues next quarter will depend on crypto prices. The market is repricing the shift from “miners/crypto companies” to AI computing power.
[Opportunities/Risks]
· Watch for: GLXY’s earnings call commentary on the Helios lease-up schedule and 2027 revenue guidance; whether mining stocks and AI transition plays (IREN, CORZ, etc.) rebound with sentiment
· Risks: Financing $3.5 billion of debt comes at a considerable cost in a high-interest-rate environment; newly listed cloud stocks have broadly plunged this month, and AI infrastructure valuations remain under pressure
· Crypto price benchmark: Galaxy Research noted that a weekly close below 76540 would challenge its bullish outlook, making this a useful BTC level to watch
Do you think crypto companies moving into AI computing power is a long-term path forward or a cyclical trade?
#Galaxy #加密股财报 #AI算力 #比特币 #FOMC
$BTC $ETH
For reference only; not investment advice
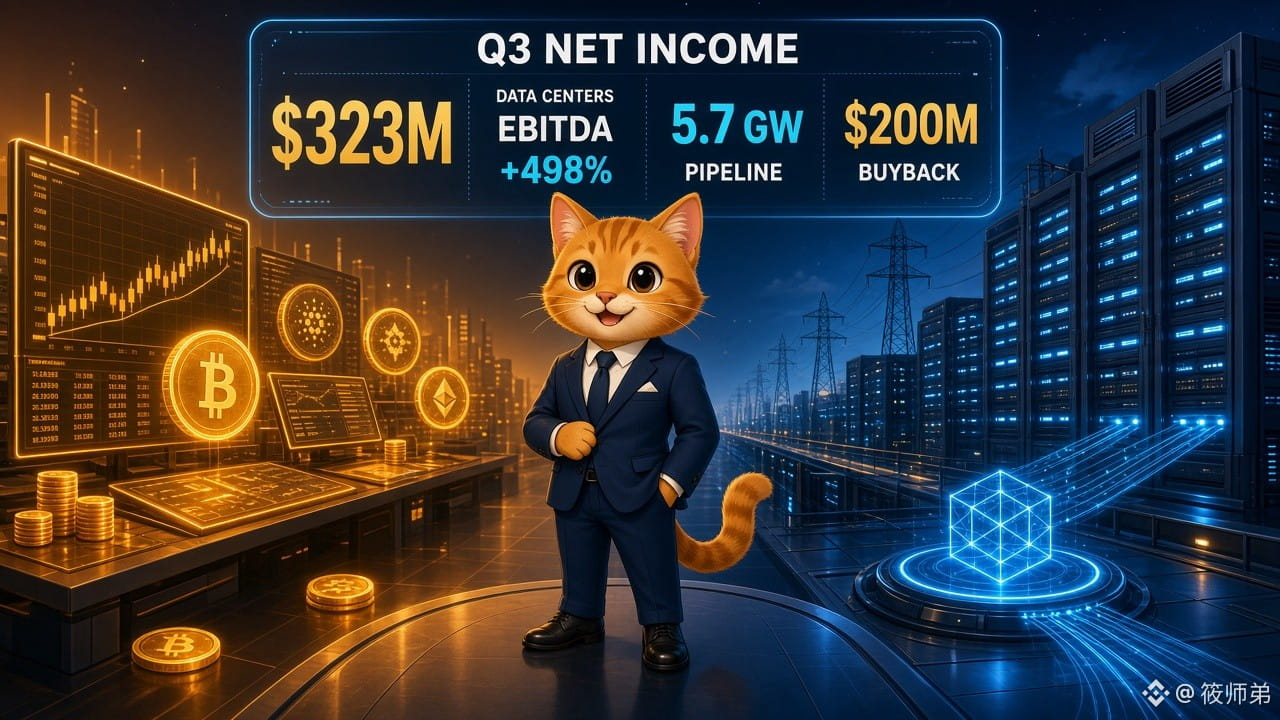
185

·
--
In the earnings reports of listed crypto companies, this time the numbers spoke louder than the slogans: a return to profit and a buyback were on the table together.
According to reports relayed by PANews / good.box and others: Galaxy Digital posted net profit of about US$323 million in the third quarter, a clear improvement from a net loss of about US$85 million in the previous quarter; the board approved an additional roughly US$200 million in share buyback authorization, and completed the issuance of about US$3.5 billion in senior secured notes to support the second phase of Helios I construction.
How to read it: the return to profitability shows that the cycle and the flexibility of trading / investment banking businesses are still there, but a single quarter of strong profit does not mean the trend is locked in; a buyback authorization means “can buy,” not “will buy.” What is more worth watching next is the actual buyback progress, the pace of Helios going into production, and whether profits can hold up after volatility eases in the next quarter. For ordinary people, the more practical approach is: treat earnings reports as a thermometer for the industry, and don’t directly turn a single-quarter net profit headline into a “signal that altcoins are rebounding.”
#Galaxy #财报 #加密股 #Industry Updates
14

·
--
Galaxy says: Bitcoin’s bear market bottomed in June; now is a window for long-term holding $BTC $ETH
Galaxy’s head of research issued a report saying that Bitcoin’s bear market bottomed in June. The reasoning is that three major factors are converging—the technical bottom is in, speculative money has largely been flushed out, and fiat currency depreciation is accelerating—pointing to the eve of a supercycle. The report also says this is the best window to buy and hold for the long term.
Note that the report’s key phrase is “hold for the long term,” not “go all in and buy the dip”—the fast money has already left; what remains is patient capital.
Some think this is an institution setting the tone for a bull market; others think that calling something the “best window” is an easy way to get proven wrong.
Do you believe June was the bottom? Let’s talk in the comments.
#比特币 #Galaxy
18

·
--
Galaxy Head of Research Alex Thorn issued a report on Monday, boldly calling the bottom: $BTC This bear market ended in June, and we’re now in an accumulation phase. “It’s a good time to buy and hold.”
Reason one: BTC spent 44 weeks below its 50-week moving average, reclaimed it in September, and as of 10/18 had closed above it for five consecutive weeks. Even the worst weekly close in June was only 4.7% below the 200-week moving average.
Reason two: Since 2011, the pattern of “falling below the 50-week moving average for more than 20 weeks, then reclaiming it” has occurred four times. In each case, the maximum drawdown over the following year was no more than 8.4%, and the price was up 55% to 1497% a year later.
The report also specifies a stop-loss level: if the weekly price falls back below the 50-week moving average (around 76540) and fails to recover it within a month, the thesis is considered invalidated.
$BTC BTC is currently around 79700, only about 4% above that level, making this a key price area ahead of the rate decision. Galaxy and Thorn himself both hold BTC.
#比特币 #Galaxy #Crypto Market
180

Galaxy says the bear market ended back in June, and now is “a good time to buy and hold.” Since last night, that’s been turned into “the bear market is officially over,” with the JUST IN account and the Bitcoin Conference’s official account shouting “STACK ACCORDINGLY” all the way.
Let’s break down the evidence: 44 weeks below the 50-week moving average, followed by 5 consecutive weekly closes back above it; a 53% drawdown, the shallowest on record; and ETFs have added about 87,000 BTC since the low. That’s it.
Five weekly candles, and they’re ready to declare the cycle over? With a moving average, it only takes one candle to get back above it—and one to fall back below.
The timeline is even funnier. Just last week, data from that same Galaxy Research said that through October 18 this year, wallets dormant for more than 5 years had sold 127,000 more BTC than ETFs and company treasuries had bought. A week later, it’s “selling pressure from long-term holders is easing, so it’s time to buy.” The data isn’t wrong, but the narrative sure changed direction fast.
There’s one more thing people rarely mention: Galaxy itself is a crypto trading and asset management firm. Its research department saying “now is a good time to buy” is much like a brokerage research report issuing a buy rating—take it for what it’s worth; they’re not a neutral referee. In the same week, Strategy didn’t buy a single coin, leaving its holdings at 848,517 BTC.
The only thing I agree with is that they specified an invalidation level: 76.5K, according to the reports. With the price around 80K, it’s just over 4% away from disproving the “bear market is over” call, and the FOMC is on Wednesday.
So this isn’t some “bottom confirmed” call; it’s a thesis with a tight stop. If you really believe it, stick to that stop—and if it breaks, don’t start calling it a “deep retest.”
#BTC #Galaxy
265
·
--
Galaxy: Over 11.1 million BTC remain unattributed
CoinDesk, citing an October snapshot from Galaxy Research, reported on 10/26 that about 11.1 million BTC (roughly 55% of the approximately 20.1 million BTC mined so far) are held at addresses that cannot be linked to known entities such as exchanges, funds, or governments. Research head Alex Thorn said that even after years of institutional adoption, a large—perhaps even majority—share of BTC is still held by individuals in self-custody. The identifiable 45% or so includes exchanges, ETFs such as BlackRock’s, and the U.S. government; Satoshi’s roughly 1.124 million BTC (the Patoshi pattern) are counted separately. The unattributed portion may also include lost coins, unidentified institutions, and complex custody arrangements.
【Viewpoint】Wall Street’s Bitcoin buying is making plenty of noise, but less than half of the supply is truly “named” on-chain. Narratives around circulating supply and potential sell pressure can easily be amplified by ETF flows; the self-custody base remains substantial.
【Opportunity/Risk】Watch whether net ETF inflows can genuinely reduce the unattributed share. Lost coins reinforce the scarcity narrative but are hard to quantify. Ahead of this week’s FOMC meeting, don’t treat 55% as a short-term catalyst; first watch whether $82,500 can be reclaimed.
Do you think most of that 55% is held in self-custody by retail investors, or does it mainly consist of lost coins and unidentified institutions?
#比特币 #Galaxy #自托管 $BTC
For informational purposes only; not investment advice

4

📰 Galaxy Signs Texas Tech Naming Rights Deal: 15-year stadium partnership highlights crypto's institutional ambitions
On July 19, 2026, Galaxy Digital has secured a 15-year naming rights agreement for Texas Tech University's football stadium, marking one of the largest crypto-branded sponsorships in collegiate sports. The deal demonstrates how crypto firms are investing in mainstream brand recognition.
This partnership follows similar moves by other crypto companies into sports sponsorships, signaling that the industry views long-term brand building as essential despite market cycles. Total crypto market cap of $2.30T provides the financial foundation for such investments.
📌 Key Takeaway:
Galaxy's Texas Tech stadium deal is a bet on crypto's permanent place in the financial landscape. When firms sign 15-year naming rights, they're signaling confidence in the industry's longevity.
#Galaxy #CryptoAdoption #Institutional
#BinanceAlphaAlert
19
Log in to explore more content
Join global crypto users on Binance Square
⚡️ Get latest and useful information about crypto.
💬 Trusted by the world’s largest crypto exchange.
👍 Discover real insights from verified creators.
Email / Phone number
Trending Topics
1
#BinanceToResumePhaseOneOfWithdrawals
3,261 views
202 Discussing
2
#BinanceHadAlreadyCovered$6BofHackLoss
1,184 views
39 Discussing
3
#FBIConfirmsNorthKoreaIsResponsibleForBinanceCryptoHack
6,565 views
51 Discussing
4
#BinanceSAFUFundTransferCompleted7499BTC
69,266 views
1,214 Discussing
5
#CZDismissesClaimsBinanceHackWasPredicted
366 views
34 Discussing
6
#BinanceRecovery90% of stolen assets
195,615 views
219 Discussing
7
#YiHe:ProofOfReserves:10TokensAt100%Backing
175,825 views
1,045 Discussing
8
#BackedNotBroken:RichardTengSaysUsersBearNoLoss
61,707 views
651 Discussing
9
#B14gReportsUnauthorizedTransferOfAbout97MCORE
3,531 views
113 Discussing
10
#USSpotETHETFsPost23StraightDaysOfNetOutflows
4,290 views
109 Discussing