

#bitcoinspotetfs
bitcoinspotetfs
3,634 views
37 Discussing
Hot
Latest

If you're still relying purely on technical indicators while ignoring institutional flow data, stop now.
Most retail traders keep missing clean entries or getting chopped up by sudden liquidity sweeps because they treat Bitcoin price action like it's still 2021. The reality is that the structural mechanics of market depth have shifted entirely.
The debate right now is whether institutional products like $BTC spot funds are genuinely absorbing supply or just setting up massive distribution zones for traditional desks. One side argues that steady daily inflows create an unbreakable price floor that will eventually trigger an aggressive supply squeeze. On the flip side, skeptics claim these vehicles simply allow large funds to hedge via CME futures and park liquidity into $USDT without driving real spot demand.
Looking closely at how order books react, the institutional bid clearly dictates macro trend momentum far more than retail volume ever did.
Are we seeing genuine long-term accumulation here, or are retail traders walking into a liquidity trap set by Wall Street?
#BitcoinSpotETFs #USDTAdds845900HoldersInPast7Days
If you're still relying purely on technical indicators while ignoring institutional flow data, stop now.
Most retail traders keep missing clean entries or getting chopped up by sudden liquidity sweeps because they treat Bitcoin price action like it's still 2021. The reality is that the structural mechanics of market depth have shifted entirely.
The debate right now is whether institutional products like $BTC spot funds are genuinely absorbing supply or just setting up massive distribution zones for traditional desks. One side argues that steady daily inflows create an unbreakable price floor that will eventually trigger an aggressive supply squeeze. On the flip side, skeptics claim these vehicles simply allow large funds to hedge via CME futures and park liquidity into $USDT without driving real spot demand.
Looking closely at how order books react, the institutional bid clearly dictates macro trend momentum far more than retail volume ever did.
Are we seeing genuine long-term accumulation here, or are retail traders walking into a liquidity trap set by Wall Street?
#BitcoinSpotETFs #USDTAdds845900HoldersInPast7Days
Most retail traders keep missing clean entries or getting chopped up by sudden liquidity sweeps because they treat Bitcoin price action like it's still 2021. The reality is that the structural mechanics of market depth have shifted entirely.
The debate right now is whether institutional products like $BTC spot funds are genuinely absorbing supply or just setting up massive distribution zones for traditional desks. One side argues that steady daily inflows create an unbreakable price floor that will eventually trigger an aggressive supply squeeze. On the flip side, skeptics claim these vehicles simply allow large funds to hedge via CME futures and park liquidity into $USDT without driving real spot demand.
Looking closely at how order books react, the institutional bid clearly dictates macro trend momentum far more than retail volume ever did.
Are we seeing genuine long-term accumulation here, or are retail traders walking into a liquidity trap set by Wall Street?
#BitcoinSpotETFs #USDTAdds845900HoldersInPast7Days

16

·
--
Institutional ETF inflows create the illusion of infinite liquidity until TradFi market hours close and the order books suddenly thin out. Most retail traders buy the breakout thinking Wall Street will endlessly bid up $BTC, only to get chopped up the moment spot desks finish their daily rebalancing window.
When you look at settlement cycles, ETF issuers don't execute trades in real-time like on-chain degens. They bundle flow and rebalance during specific NAV pricing windows. If heavy redemption pressure kicks in while retail is chasing momentum in assets like $SUI or $ONDO, market makers pull their bids, leaving late buyers trapped in brutal wick downs.
Treating ETF volume as a perpetual safety net usually ends with holding heavy bags during off-market hours. When sentiment flips to greed and liquidity concentrates strictly around institutional cutoffs, retail order flow becomes the exit exit liquidity.
Are you adjusting your execution times around institutional market hours, or still trading the continuous crypto tape like usual?
#BitcoinSpotETFs #USDTAdds845900HoldersInPast7Days
Institutional ETF inflows create the illusion of infinite liquidity until TradFi market hours close and the order books suddenly thin out. Most retail traders buy the breakout thinking Wall Street will endlessly bid up $BTC , only to get chopped up the moment spot desks finish their daily rebalancing window.
When you look at settlement cycles, ETF issuers don't execute trades in real-time like on-chain degens. They bundle flow and rebalance during specific NAV pricing windows. If heavy redemption pressure kicks in while retail is chasing momentum in assets like $SUI or $ONDO , market makers pull their bids, leaving late buyers trapped in brutal wick downs.
Treating ETF volume as a perpetual safety net usually ends with holding heavy bags during off-market hours. When sentiment flips to greed and liquidity concentrates strictly around institutional cutoffs, retail order flow becomes the exit exit liquidity.
Are you adjusting your execution times around institutional market hours, or still trading the continuous crypto tape like usual?
#BitcoinSpotETFs #USDTAdds845900HoldersInPast7Days
When you look at settlement cycles, ETF issuers don't execute trades in real-time like on-chain degens. They bundle flow and rebalance during specific NAV pricing windows. If heavy redemption pressure kicks in while retail is chasing momentum in assets like $SUI or $ONDO , market makers pull their bids, leaving late buyers trapped in brutal wick downs.
Treating ETF volume as a perpetual safety net usually ends with holding heavy bags during off-market hours. When sentiment flips to greed and liquidity concentrates strictly around institutional cutoffs, retail order flow becomes the exit exit liquidity.
Are you adjusting your execution times around institutional market hours, or still trading the continuous crypto tape like usual?
#BitcoinSpotETFs #USDTAdds845900HoldersInPast7Days

57

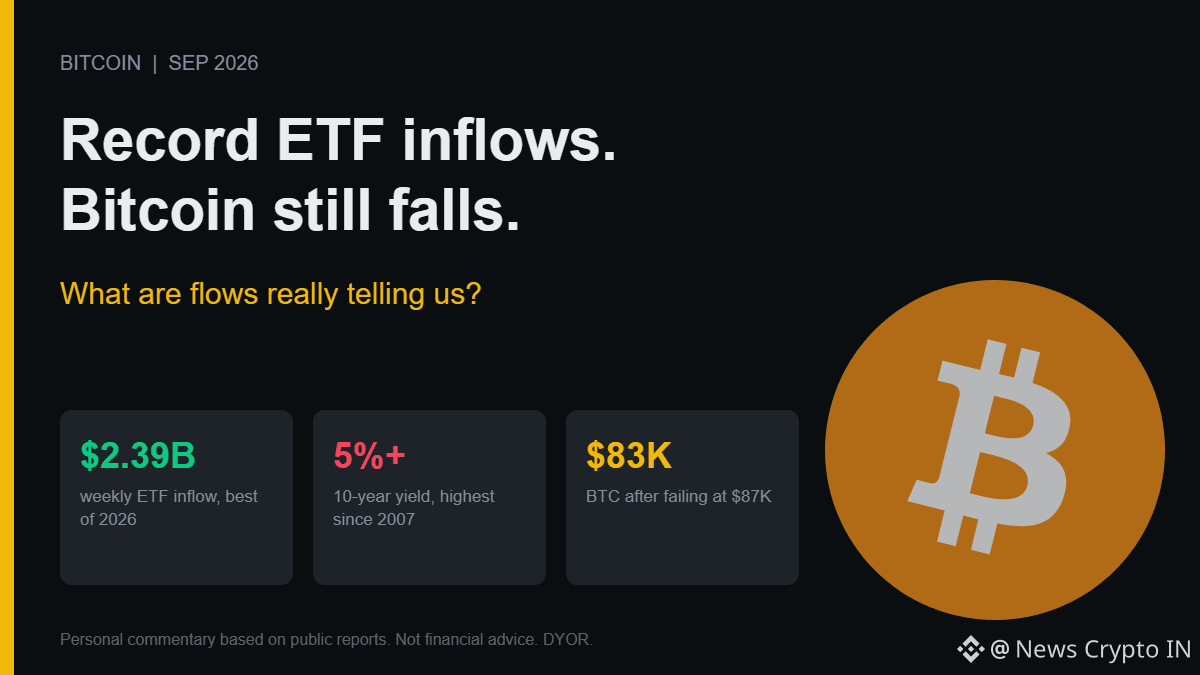
Bitcoin slipped to about $83K after failing to hold $87K, in the same week spot ETFs took in $2.39B, the best week of 2026. Record inflow, red candle. That's the paradox everyone is asking about.
Here's what the "ETF demand" story leaves out. The 10-year Treasury yield has pushed past 5%, a level last seen in 2007. Brent is near $106 after Trump rejected Iran's latest proposal on reopening the Strait of Hormuz. The dollar is stronger. None of those care how many ETF shares were created.
The read that explains both: ETF buyers are real, but they're absorbing supply from holders selling into the $84K-$87K zone. Fresh capital meets sellers, so price goes sideways to down instead of up. That isn't "no demand." It's demand equal to supply at that price.
Why it matters: ETF flow headlines are treated like a price signal. Flows tell you who is buying, not whether the buyer is winning. With a Treasury yield above 5%, every dollar into $BTC is a dollar giving up a safe yield, and the bar for holding it keeps rising.
One more gap to watch: Fear & Greed still reads 68 (Greed) while price is falling. Sentiment hasn't caught up with the tape.
If record flows can't lift price with yields above 5%, what can?
#BTCFallsBelow$83000 #BitcoinSpotETFs$2.39BWeeklyNetInflow
Bitcoin slipped to about $83K after failing to hold $87K, in the same week spot ETFs took in $2.39B, the best week of 2026. Record inflow, red candle. That's the paradox everyone is asking about.
Here's what the "ETF demand" story leaves out. The 10-year Treasury yield has pushed past 5%, a level last seen in 2007. Brent is near $106 after Trump rejected Iran's latest proposal on reopening the Strait of Hormuz. The dollar is stronger. None of those care how many ETF shares were created.
The read that explains both: ETF buyers are real, but they're absorbing supply from holders selling into the $84K-$87K zone. Fresh capital meets sellers, so price goes sideways to down instead of up. That isn't "no demand." It's demand equal to supply at that price.
Why it matters: ETF flow headlines are treated like a price signal. Flows tell you who is buying, not whether the buyer is winning. With a Treasury yield above 5%, every dollar into $BTC is a dollar giving up a safe yield, and the bar for holding it keeps rising.
One more gap to watch: Fear & Greed still reads 68 (Greed) while price is falling. Sentiment hasn't caught up with the tape.
If record flows can't lift price with yields above 5%, what can?
#BTCFallsBelow$83000 #BitcoinSpotETFs$2.39BWeeklyNetInflow
Here's what the "ETF demand" story leaves out. The 10-year Treasury yield has pushed past 5%, a level last seen in 2007. Brent is near $106 after Trump rejected Iran's latest proposal on reopening the Strait of Hormuz. The dollar is stronger. None of those care how many ETF shares were created.
The read that explains both: ETF buyers are real, but they're absorbing supply from holders selling into the $84K-$87K zone. Fresh capital meets sellers, so price goes sideways to down instead of up. That isn't "no demand." It's demand equal to supply at that price.
Why it matters: ETF flow headlines are treated like a price signal. Flows tell you who is buying, not whether the buyer is winning. With a Treasury yield above 5%, every dollar into $BTC is a dollar giving up a safe yield, and the bar for holding it keeps rising.
One more gap to watch: Fear & Greed still reads 68 (Greed) while price is falling. Sentiment hasn't caught up with the tape.
If record flows can't lift price with yields above 5%, what can?
#BTCFallsBelow$83000 #BitcoinSpotETFs$2.39BWeeklyNetInflow
BTC+0.23%
AGGETF+0.01%
1
57

·
--
Bullish
#BitcoinSpotETFs $2.39BWeeklyNetInflow
🟠 #BitcoinSpotETFs — $2.39B Weekly Net Inflow
U.S. spot Bitcoin ETFs recorded $2.39 billion in net inflows during Sept. 21–25, with inflows on all five trading days. It was the strongest weekly inflow since October 2025.
BlackRock IBIT: about $1.16B inflow
Fidelity FBTC: about $702M
ARKB: about $295M
Monday: nearly $999M, the biggest daily inflow of the week.
Total cumulative Bitcoin spot ETF inflows reached roughly $57.55B.
Market discussion: The strong ETF demand shows substantial capital continuing to enter regulated Bitcoin investment products. However, ETF inflows alone don't guarantee that BTC's price will rise, and flows can reverse quickly.
Short theme:
$2.39B weekly inflow highlights strong institutional demand for Bitcoin ETFs, keeping ETF flows a key market indicator to watch.
$BTC
{future}(BTCUSDT)
#BitcoinSpotETFs $2.39BWeeklyNetInflow
🟠 #BitcoinSpotETFs — $2.39B Weekly Net Inflow
U.S. spot Bitcoin ETFs recorded $2.39 billion in net inflows during Sept. 21–25, with inflows on all five trading days. It was the strongest weekly inflow since October 2025.
BlackRock IBIT: about $1.16B inflow
Fidelity FBTC: about $702M
ARKB: about $295M
Monday: nearly $999M, the biggest daily inflow of the week.
Total cumulative Bitcoin spot ETF inflows reached roughly $57.55B.
Market discussion: The strong ETF demand shows substantial capital continuing to enter regulated Bitcoin investment products. However, ETF inflows alone don't guarantee that BTC's price will rise, and flows can reverse quickly.
Short theme:
$2.39B weekly inflow highlights strong institutional demand for Bitcoin ETFs, keeping ETF flows a key market indicator to watch.
$BTC
🟠 #BitcoinSpotETFs — $2.39B Weekly Net Inflow
U.S. spot Bitcoin ETFs recorded $2.39 billion in net inflows during Sept. 21–25, with inflows on all five trading days. It was the strongest weekly inflow since October 2025.
BlackRock IBIT: about $1.16B inflow
Fidelity FBTC: about $702M
ARKB: about $295M
Monday: nearly $999M, the biggest daily inflow of the week.
Total cumulative Bitcoin spot ETF inflows reached roughly $57.55B.
Market discussion: The strong ETF demand shows substantial capital continuing to enter regulated Bitcoin investment products. However, ETF inflows alone don't guarantee that BTC's price will rise, and flows can reverse quickly.
Short theme:
$2.39B weekly inflow highlights strong institutional demand for Bitcoin ETFs, keeping ETF flows a key market indicator to watch.
$BTC
50

·
--
📰 ETF inflows for 8 days—why are traders suddenly betting on 90K+ BTC?
I just mentioned ETF inflows for 8 days a couple of days ago, and now traders are starting to price in bullish options above 90K. What’s the rationale behind this move?
Institutional money continues to flow into ETFs, suggesting their long-term stance on BTC hasn’t changed. But with the current price stuck at 83K, traders suddenly stacking bullish options above 90K indicates smart money doesn’t view 83K as the ceiling. The 8-day ETF inflow record suggests institutions are slowly accumulating, not chasing higher prices. Still, the 90K options imply someone in the market believes the uptrend has the potential to break through the recent resistance level.
**Why is this news important?** It reflects a divergence between institutional behavior and retail sentiment. Institutions are buying steadily, while expectations for a near-term breakout are heating up inside the market. This kind of mismatch often signals that the window for direction is about to open.
**Impact on the market** In the short term, bullish options sentiment could help push prices to break above 83K. In the medium term, if ETF inflows keep going, BTC will likely test 90K and possibly even higher. But the market is complex—this stagnant phase could simply be building momentum.
💡 Bull case: I think if BTC can hold above 84K for two days, 90K is the next stop. But if ETF inflows suddenly stop and BTC breaks below 81K, then this view is invalid.
If geopolitical tensions suddenly escalate and cause safe-haven capital to leave, then this view is also invalid.
This article has no project sponsor, and the author does not hold any of the assets mentioned.
$BTC $ETH #BTC #ETH
⚠️ Not investment advice; predictions are for reference only
#BitcoinSpotETFs$2.39BWeeklyNetInflow
📰 ETF inflows for 8 days—why are traders suddenly betting on 90K+ BTC?
I just mentioned ETF inflows for 8 days a couple of days ago, and now traders are starting to price in bullish options above 90K. What’s the rationale behind this move?
Institutional money continues to flow into ETFs, suggesting their long-term stance on BTC hasn’t changed. But with the current price stuck at 83K, traders suddenly stacking bullish options above 90K indicates smart money doesn’t view 83K as the ceiling. The 8-day ETF inflow record suggests institutions are slowly accumulating, not chasing higher prices. Still, the 90K options imply someone in the market believes the uptrend has the potential to break through the recent resistance level.
**Why is this news important?** It reflects a divergence between institutional behavior and retail sentiment. Institutions are buying steadily, while expectations for a near-term breakout are heating up inside the market. This kind of mismatch often signals that the window for direction is about to open.
**Impact on the market** In the short term, bullish options sentiment could help push prices to break above 83K. In the medium term, if ETF inflows keep going, BTC will likely test 90K and possibly even higher. But the market is complex—this stagnant phase could simply be building momentum.
💡 Bull case: I think if BTC can hold above 84K for two days, 90K is the next stop. But if ETF inflows suddenly stop and BTC breaks below 81K, then this view is invalid.
If geopolitical tensions suddenly escalate and cause safe-haven capital to leave, then this view is also invalid.
This article has no project sponsor, and the author does not hold any of the assets mentioned.
$BTC $ETH #BTC #ETH
⚠️ Not investment advice; predictions are for reference only
#BitcoinSpotETFs$2.39BWeeklyNetInflow
I just mentioned ETF inflows for 8 days a couple of days ago, and now traders are starting to price in bullish options above 90K. What’s the rationale behind this move?
Institutional money continues to flow into ETFs, suggesting their long-term stance on BTC hasn’t changed. But with the current price stuck at 83K, traders suddenly stacking bullish options above 90K indicates smart money doesn’t view 83K as the ceiling. The 8-day ETF inflow record suggests institutions are slowly accumulating, not chasing higher prices. Still, the 90K options imply someone in the market believes the uptrend has the potential to break through the recent resistance level.
**Why is this news important?** It reflects a divergence between institutional behavior and retail sentiment. Institutions are buying steadily, while expectations for a near-term breakout are heating up inside the market. This kind of mismatch often signals that the window for direction is about to open.
**Impact on the market** In the short term, bullish options sentiment could help push prices to break above 83K. In the medium term, if ETF inflows keep going, BTC will likely test 90K and possibly even higher. But the market is complex—this stagnant phase could simply be building momentum.
💡 Bull case: I think if BTC can hold above 84K for two days, 90K is the next stop. But if ETF inflows suddenly stop and BTC breaks below 81K, then this view is invalid.
If geopolitical tensions suddenly escalate and cause safe-haven capital to leave, then this view is also invalid.
This article has no project sponsor, and the author does not hold any of the assets mentioned.
$BTC $ETH #BTC #ETH
⚠️ Not investment advice; predictions are for reference only
#BitcoinSpotETFs$2.39BWeeklyNetInflow



136
·
--
📰 Just said Ethereum is leading Bitcoin—now it suddenly reverses: why did ETF net inflows make the whole crypto market jump?
Just a couple of days ago, I said Ethereum was outperforming Bitcoin—then it suddenly reversed: why did ETF net inflows cause crypto across the board to rise? Why did Bitcoin and Ethereum perform stronger than Solana and XRP after the ETF net inflow news?
📰 [Headline: Just said Ethereum is leading Bitcoin—now it suddenly reverses: why did ETF net inflows make the whole crypto market jump?]
Event Overview
Yesterday’s news said that ETFs for four coins—Bitcoin, Ethereum, Solana, and XRP—all saw net inflows. Today, looking at market data, Bitcoin at $84,075.08 and Ethereum at $2,712.91 posted higher gains than the other two. Why did Bitcoin and Ethereum perform better than Solana and XRP after the ETF net inflow news?
In-Depth Analysis
Why is this news important?
This news matters because ETF net inflows indicate that institutional capital continues to show interest. And the strong performance of Bitcoin and Ethereum suggests they may be the preferred allocation targets for that capital. In simple terms: institutions aren’t just buying random digital assets now—they have clear preferences, with Bitcoin and Ethereum being more favored.
Impact on the market
For BTC and ETH, this short-term sentiment is a strong tailwind, indicating that once the information is confirmed, capital begins taking action. For the market structure, it means Ethereum’s leading position is further reinforced, while Solana and XRP may need to look for new opportunities to differentiate within capital allocation. Historically, whenever an ETF records net inflows, Bitcoin and Ethereum’s relative performance tends to be stronger than other coins.
Trading idea
💡 I think Bitcoin and Ethereum will continue to be strong. If they hold the $83,000 level, they have a chance to challenge $85,000. But if tomorrow institutional funds begin flowing out of the ETFs, this view is invalid.
This article is not sponsored by any project, and the author does not hold the assets mentioned
$BTC $ETH #BTC #ETH
⚠️ Not investment advice; predictions are for reference only
#BitcoinSpotETFs$2.39BWeeklyNetInflow
📰 Just said Ethereum is leading Bitcoin—now it suddenly reverses: why did ETF net inflows make the whole crypto market jump?
Just a couple of days ago, I said Ethereum was outperforming Bitcoin—then it suddenly reversed: why did ETF net inflows cause crypto across the board to rise? Why did Bitcoin and Ethereum perform stronger than Solana and XRP after the ETF net inflow news?
📰 [Headline: Just said Ethereum is leading Bitcoin—now it suddenly reverses: why did ETF net inflows make the whole crypto market jump?]
Event Overview
Yesterday’s news said that ETFs for four coins—Bitcoin, Ethereum, Solana, and XRP—all saw net inflows. Today, looking at market data, Bitcoin at $84,075.08 and Ethereum at $2,712.91 posted higher gains than the other two. Why did Bitcoin and Ethereum perform better than Solana and XRP after the ETF net inflow news?
In-Depth Analysis
Why is this news important?
This news matters because ETF net inflows indicate that institutional capital continues to show interest. And the strong performance of Bitcoin and Ethereum suggests they may be the preferred allocation targets for that capital. In simple terms: institutions aren’t just buying random digital assets now—they have clear preferences, with Bitcoin and Ethereum being more favored.
Impact on the market
For BTC and ETH, this short-term sentiment is a strong tailwind, indicating that once the information is confirmed, capital begins taking action. For the market structure, it means Ethereum’s leading position is further reinforced, while Solana and XRP may need to look for new opportunities to differentiate within capital allocation. Historically, whenever an ETF records net inflows, Bitcoin and Ethereum’s relative performance tends to be stronger than other coins.
Trading idea
💡 I think Bitcoin and Ethereum will continue to be strong. If they hold the $83,000 level, they have a chance to challenge $85,000. But if tomorrow institutional funds begin flowing out of the ETFs, this view is invalid.
This article is not sponsored by any project, and the author does not hold the assets mentioned
$BTC $ETH #BTC #ETH
⚠️ Not investment advice; predictions are for reference only
#BitcoinSpotETFs$2.39BWeeklyNetInflow
Just a couple of days ago, I said Ethereum was outperforming Bitcoin—then it suddenly reversed: why did ETF net inflows cause crypto across the board to rise? Why did Bitcoin and Ethereum perform stronger than Solana and XRP after the ETF net inflow news?
📰 [Headline: Just said Ethereum is leading Bitcoin—now it suddenly reverses: why did ETF net inflows make the whole crypto market jump?]
Event Overview
Yesterday’s news said that ETFs for four coins—Bitcoin, Ethereum, Solana, and XRP—all saw net inflows. Today, looking at market data, Bitcoin at $84,075.08 and Ethereum at $2,712.91 posted higher gains than the other two. Why did Bitcoin and Ethereum perform better than Solana and XRP after the ETF net inflow news?
In-Depth Analysis
Why is this news important?
This news matters because ETF net inflows indicate that institutional capital continues to show interest. And the strong performance of Bitcoin and Ethereum suggests they may be the preferred allocation targets for that capital. In simple terms: institutions aren’t just buying random digital assets now—they have clear preferences, with Bitcoin and Ethereum being more favored.
Impact on the market
For BTC and ETH, this short-term sentiment is a strong tailwind, indicating that once the information is confirmed, capital begins taking action. For the market structure, it means Ethereum’s leading position is further reinforced, while Solana and XRP may need to look for new opportunities to differentiate within capital allocation. Historically, whenever an ETF records net inflows, Bitcoin and Ethereum’s relative performance tends to be stronger than other coins.
Trading idea
💡 I think Bitcoin and Ethereum will continue to be strong. If they hold the $83,000 level, they have a chance to challenge $85,000. But if tomorrow institutional funds begin flowing out of the ETFs, this view is invalid.
This article is not sponsored by any project, and the author does not hold the assets mentioned
$BTC $ETH #BTC #ETH
⚠️ Not investment advice; predictions are for reference only
#BitcoinSpotETFs$2.39BWeeklyNetInflow



303
·
--
Recently, the popularity of Bitcoin spot ETFs has continued to surge. According to the latest data, these ETFs recorded as much as $2.39 billion in weekly net inflows last week. Not only does this figure set a new all-time high, it also shows investors’ strong interest in the cryptocurrency market. Previously, the U.S. Securities and Exchange Commission (SEC) approved multiple Bitcoin spot ETFs, giving investors a more convenient and compliant way to invest. As of the latest update, the total assets under management for these ETFs have exceeded $10 billion, while the largest ETF has surpassed $4 billion in assets under management. Analysts believe this trend is driven by the stability of the cryptocurrency market and the potential for high returns. As more investors move in, the market position of Bitcoin spot ETFs is expected to further strengthen. #BitcoinSpotETFs
#BitcoinSpotETFs$2.39BWeeklyNetInflow $BTC
Recently, the popularity of Bitcoin spot ETFs has continued to surge. According to the latest data, these ETFs recorded as much as $2.39 billion in weekly net inflows last week. Not only does this figure set a new all-time high, it also shows investors’ strong interest in the cryptocurrency market. Previously, the U.S. Securities and Exchange Commission (SEC) approved multiple Bitcoin spot ETFs, giving investors a more convenient and compliant way to invest. As of the latest update, the total assets under management for these ETFs have exceeded $10 billion, while the largest ETF has surpassed $4 billion in assets under management. Analysts believe this trend is driven by the stability of the cryptocurrency market and the potential for high returns. As more investors move in, the market position of Bitcoin spot ETFs is expected to further strengthen. #BitcoinSpotETFs
#BitcoinSpotETFs$2.39BWeeklyNetInflow $BTC
#BitcoinSpotETFs$2.39BWeeklyNetInflow $BTC
6
·
--
Bitcoin spot ETF net inflows have recently reached $999 million, indicating an increase in mainstream acceptance of crypto assets. Does this trend suggest that Bitcoin may be entering a new round of upward movement? What factors do you think will influence future price action?#BitcoinSpotETFs
$BTC #BTC
Bitcoin spot ETF net inflows have recently reached $999 million, indicating an increase in mainstream acceptance of crypto assets. Does this trend suggest that Bitcoin may be entering a new round of upward movement? What factors do you think will influence future price action?#BitcoinSpotETFs
$BTC #BTC
$BTC #BTC
32

·
--
Bearish
#BitcoinSpotETFs$1.79BWeeklyOutflow
Sharks Run Away, Will BTC Drop to $50,000? 📉🚨
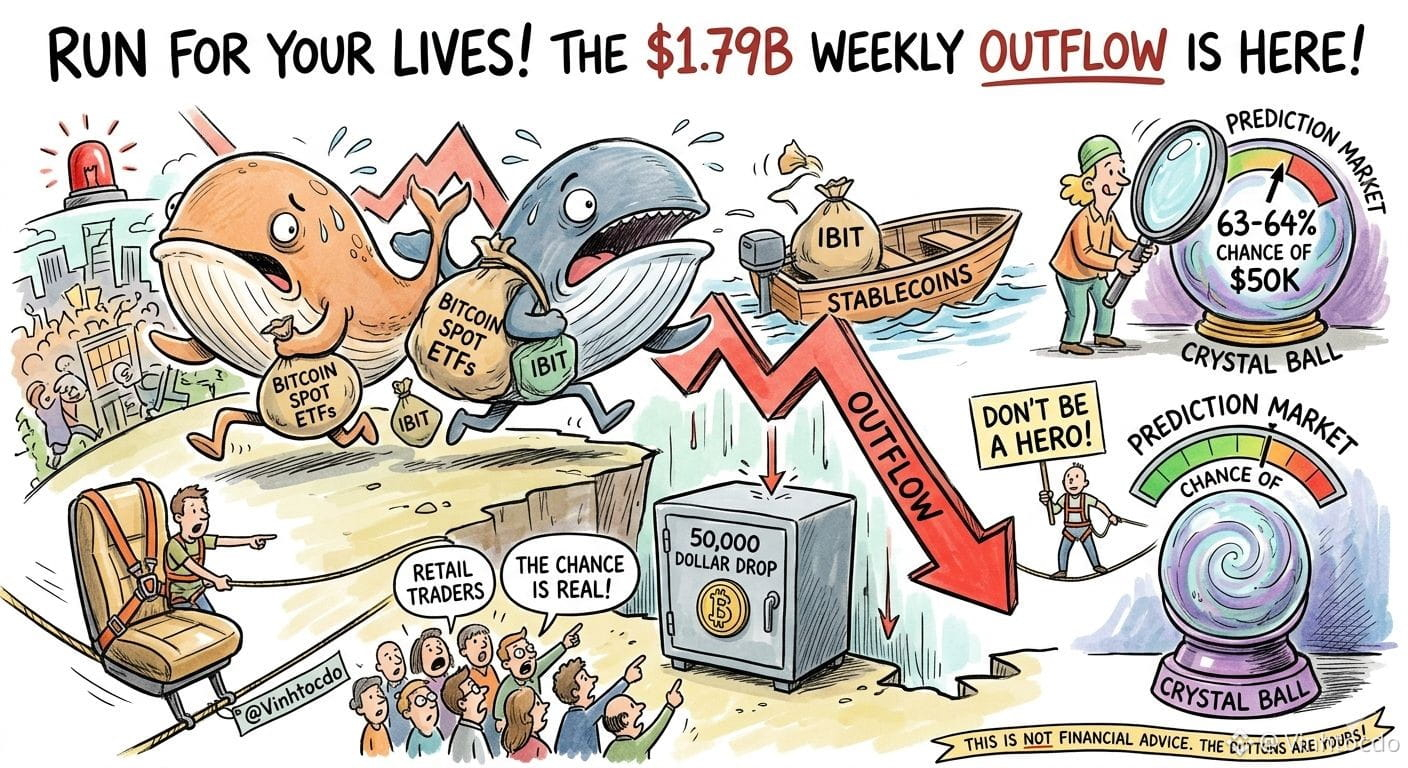
Things are getting really tense, guys! Last week, major funds all saw massive net outflows of a record $1.79 billion from #BitcoinSpotETFs . In particular, BlackRock’s IBIT fund accounted for as much as 73% of the sell-off. With big money fleeing like this, the path back to the $50,000 price zone is looking more certain than ever!
After a quick sweep of the market and Polymarket predictions, the betting side is pushing the odds of BTC falling straight to $50k up to 63%–64%! And yes—crystal ball believers, self-check yourselves.
💡 What should traders do? When even whales are scared, don’t be a hero—dial it back. Sit tight, buckle up, and hold onto stablecoins while waiting for the storm to pass. Want smooth deposits/withdrawals? Go all in right at the 50k mark—register an account now using the Feng Shui code: VINHTOCDO to get the maximum reduction on trading fees!
⚠️ This is not financial advice! You hold the money, you press the buttons!
#BTC #BearishAlert #VINHTOCDO
$BTC
{future}(BTCUSDT)
$ETH
{future}(ETHUSDT)
$BNB
{future}(BNBUSDT)
#BitcoinSpotETFs$1.79BWeeklyOutflow
Sharks Run Away, Will BTC Drop to $50,000? 📉🚨
Things are getting really tense, guys! Last week, major funds all saw massive net outflows of a record $1.79 billion from #BitcoinSpotETFs . In particular, BlackRock’s IBIT fund accounted for as much as 73% of the sell-off. With big money fleeing like this, the path back to the $50,000 price zone is looking more certain than ever!
After a quick sweep of the market and Polymarket predictions, the betting side is pushing the odds of BTC falling straight to $50k up to 63%–64%! And yes—crystal ball believers, self-check yourselves.
💡 What should traders do? When even whales are scared, don’t be a hero—dial it back. Sit tight, buckle up, and hold onto stablecoins while waiting for the storm to pass. Want smooth deposits/withdrawals? Go all in right at the 50k mark—register an account now using the Feng Shui code: VINHTOCDO to get the maximum reduction on trading fees!
⚠️ This is not financial advice! You hold the money, you press the buttons!
#BTC #BearishAlert #VINHTOCDO
$BTC
$ETH
$BNB
Sharks Run Away, Will BTC Drop to $50,000? 📉🚨
Things are getting really tense, guys! Last week, major funds all saw massive net outflows of a record $1.79 billion from #BitcoinSpotETFs . In particular, BlackRock’s IBIT fund accounted for as much as 73% of the sell-off. With big money fleeing like this, the path back to the $50,000 price zone is looking more certain than ever!
After a quick sweep of the market and Polymarket predictions, the betting side is pushing the odds of BTC falling straight to $50k up to 63%–64%! And yes—crystal ball believers, self-check yourselves.
💡 What should traders do? When even whales are scared, don’t be a hero—dial it back. Sit tight, buckle up, and hold onto stablecoins while waiting for the storm to pass. Want smooth deposits/withdrawals? Go all in right at the 50k mark—register an account now using the Feng Shui code: VINHTOCDO to get the maximum reduction on trading fees!
⚠️ This is not financial advice! You hold the money, you press the buttons!
#BTC #BearishAlert #VINHTOCDO
$BTC
$ETH
$BNB
1
192

·
--
Bullish
#BitcoinSpotETFs
🔥 $999M NET INFLOW — BIG MONEY IS MOVING INTO BTC! 🤯
💡 MY Take: A huge one-day inflow points to strong institutional demand, but the key question is whether the money arrived before or after the BTC move.
📊 Show Your Trade: Watch BTC momentum and key support/resistance before entering.
Trading View: BUY
🚀 Are institutions driving the next BTC move? "CLICK ON THE BELOW YELLOW COIN TAG TO GO TO DESIRED TRADING PAGE TO GET BENEFIT TRADE"$BTC
{spot}(BTCUSDT)
#bitcoin #crypto
#BitcoinSpotETFs
🔥 $999M NET INFLOW — BIG MONEY IS MOVING INTO BTC! 🤯
💡 MY Take: A huge one-day inflow points to strong institutional demand, but the key question is whether the money arrived before or after the BTC move.
📊 Show Your Trade: Watch BTC momentum and key support/resistance before entering.
Trading View: BUY
🚀 Are institutions driving the next BTC move? "CLICK ON THE BELOW YELLOW COIN TAG TO GO TO DESIRED TRADING PAGE TO GET BENEFIT TRADE"$BTC
#bitcoin #crypto
🔥 $999M NET INFLOW — BIG MONEY IS MOVING INTO BTC! 🤯
💡 MY Take: A huge one-day inflow points to strong institutional demand, but the key question is whether the money arrived before or after the BTC move.
📊 Show Your Trade: Watch BTC momentum and key support/resistance before entering.
Trading View: BUY
🚀 Are institutions driving the next BTC move? "CLICK ON THE BELOW YELLOW COIN TAG TO GO TO DESIRED TRADING PAGE TO GET BENEFIT TRADE"$BTC
#bitcoin #crypto

1
8

·
--
XMR at $569 | BTC spot ETF saw net inflows of about $999.9 million yesterday | When privacy coins don’t follow the rally, first look at relative strength
My stance is that I won’t chase the XMR rebound for now. On the Binance Square, the current hot topics include #BitcoinSpotETFs$999MNetInflow, but XMR isn’t on the trending list. This topic is related to fund rotation; you can’t directly label BTC fund subscriptions as XMR buying.
Binance News cited SoSoValue saying that as of 9/21 in U.S. Eastern Time, total net inflows for U.S. Bitcoin spot ETFs were about $999.9 million, with IBIT at roughly $381 million and ARKB at about $289 million. This is the previously reported figures from the last trading day; it doesn’t mean inflows are still ongoing today, and you also can’t infer that privacy coins receive institutional allocations.
Why look at it? Spot ETF funds first move through the fund share issuance/redemption linkage with Bitcoin spot, influencing BTC; sentiment may then spill over to other coins. The strength of that spillover must be confirmed by XMR’s own quotes. Meanwhile, Strategy’s website has officially published that on 9/21 they bought 950 BTC—that’s a corporate BTC holdings disclosure and cannot be mistaken for XMR demand. If the strong large-cap narrative doesn’t help XMR reclaim a key range, I’ll treat it as relative weakness, not a “catch-up rally sooner or later.”
Currently, KuCoin publicly shows the latest XMRUSDTM perpetual quote around $569, with a 24-hour range of about $551.39–$602.77. The funding rate is around +0.0698%, and open interest is about 8.12 million contracts. Each contract is 0.01 XMR—so you can’t miswrite contract count as coin count. In the 15-minute data, it dropped to about 567.1 around 17:45. At 18:00 it bounced to 572.85, but it didn’t hold in the high area; as of the completed 18:30 candle, it closed around 570.06. There’s a pullback, but in the 573–576 zone, buyers still need to prove they can continue. A positive funding rate also suggests the cost of being long is crowded, not a guarantee of rising.
Data can change at any time—use the live order book at the moment.
If this were my own trade: I wouldn’t participate now; position is 0. I’d only consider experimenting with spot upside, without opening high leverage. First, wait for two complete 15-minute candles to hold above 568. Then, if the next candle closes with volume above 575 and the following one doesn’t fall back below 572, I’d use up to 1% of principal to scale in in batches as a long. First target: 580–584—if reached, cut the position in half. Second target: 588–592—cut the remaining position. If after entering the 15-minute candle closes below 567, exit immediately and go fully flat. If it first breaks below 565 and the bounce back to 568 fails, cancel the long plan and continue staying in cash—no “hard catch” just because of the so-called catch-up.
What truly overturns my cautious judgment is holding above 576 along with expanded trading volume. Conversely, losing 565 means the assumed spillover hasn’t been realized in XMR. What I’m discussing here is conditional planning, not a record of executed trades.
#BitcoinSpotETFs$999MNetInflow #XMR
The above is only my personal market observations and does not constitute investment advice.
XMR at $569 | BTC spot ETF saw net inflows of about $999.9 million yesterday | When privacy coins don’t follow the rally, first look at relative strength
My stance is that I won’t chase the XMR rebound for now. On the Binance Square, the current hot topics include #BitcoinSpotETFs$999MNetInflow, but XMR isn’t on the trending list. This topic is related to fund rotation; you can’t directly label BTC fund subscriptions as XMR buying.
Binance News cited SoSoValue saying that as of 9/21 in U.S. Eastern Time, total net inflows for U.S. Bitcoin spot ETFs were about $999.9 million, with IBIT at roughly $381 million and ARKB at about $289 million. This is the previously reported figures from the last trading day; it doesn’t mean inflows are still ongoing today, and you also can’t infer that privacy coins receive institutional allocations.
Why look at it? Spot ETF funds first move through the fund share issuance/redemption linkage with Bitcoin spot, influencing BTC; sentiment may then spill over to other coins. The strength of that spillover must be confirmed by XMR’s own quotes. Meanwhile, Strategy’s website has officially published that on 9/21 they bought 950 BTC—that’s a corporate BTC holdings disclosure and cannot be mistaken for XMR demand. If the strong large-cap narrative doesn’t help XMR reclaim a key range, I’ll treat it as relative weakness, not a “catch-up rally sooner or later.”
Currently, KuCoin publicly shows the latest XMRUSDTM perpetual quote around $569, with a 24-hour range of about $551.39–$602.77. The funding rate is around +0.0698%, and open interest is about 8.12 million contracts. Each contract is 0.01 XMR—so you can’t miswrite contract count as coin count. In the 15-minute data, it dropped to about 567.1 around 17:45. At 18:00 it bounced to 572.85, but it didn’t hold in the high area; as of the completed 18:30 candle, it closed around 570.06. There’s a pullback, but in the 573–576 zone, buyers still need to prove they can continue. A positive funding rate also suggests the cost of being long is crowded, not a guarantee of rising.
Data can change at any time—use the live order book at the moment.
If this were my own trade: I wouldn’t participate now; position is 0. I’d only consider experimenting with spot upside, without opening high leverage. First, wait for two complete 15-minute candles to hold above 568. Then, if the next candle closes with volume above 575 and the following one doesn’t fall back below 572, I’d use up to 1% of principal to scale in in batches as a long. First target: 580–584—if reached, cut the position in half. Second target: 588–592—cut the remaining position. If after entering the 15-minute candle closes below 567, exit immediately and go fully flat. If it first breaks below 565 and the bounce back to 568 fails, cancel the long plan and continue staying in cash—no “hard catch” just because of the so-called catch-up.
What truly overturns my cautious judgment is holding above 576 along with expanded trading volume. Conversely, losing 565 means the assumed spillover hasn’t been realized in XMR. What I’m discussing here is conditional planning, not a record of executed trades.
#BitcoinSpotETFs$999MNetInflow #XMR
The above is only my personal market observations and does not constitute investment advice.
My stance is that I won’t chase the XMR rebound for now. On the Binance Square, the current hot topics include #BitcoinSpotETFs$999MNetInflow, but XMR isn’t on the trending list. This topic is related to fund rotation; you can’t directly label BTC fund subscriptions as XMR buying.
Binance News cited SoSoValue saying that as of 9/21 in U.S. Eastern Time, total net inflows for U.S. Bitcoin spot ETFs were about $999.9 million, with IBIT at roughly $381 million and ARKB at about $289 million. This is the previously reported figures from the last trading day; it doesn’t mean inflows are still ongoing today, and you also can’t infer that privacy coins receive institutional allocations.
Why look at it? Spot ETF funds first move through the fund share issuance/redemption linkage with Bitcoin spot, influencing BTC; sentiment may then spill over to other coins. The strength of that spillover must be confirmed by XMR’s own quotes. Meanwhile, Strategy’s website has officially published that on 9/21 they bought 950 BTC—that’s a corporate BTC holdings disclosure and cannot be mistaken for XMR demand. If the strong large-cap narrative doesn’t help XMR reclaim a key range, I’ll treat it as relative weakness, not a “catch-up rally sooner or later.”
Currently, KuCoin publicly shows the latest XMRUSDTM perpetual quote around $569, with a 24-hour range of about $551.39–$602.77. The funding rate is around +0.0698%, and open interest is about 8.12 million contracts. Each contract is 0.01 XMR—so you can’t miswrite contract count as coin count. In the 15-minute data, it dropped to about 567.1 around 17:45. At 18:00 it bounced to 572.85, but it didn’t hold in the high area; as of the completed 18:30 candle, it closed around 570.06. There’s a pullback, but in the 573–576 zone, buyers still need to prove they can continue. A positive funding rate also suggests the cost of being long is crowded, not a guarantee of rising.
Data can change at any time—use the live order book at the moment.
If this were my own trade: I wouldn’t participate now; position is 0. I’d only consider experimenting with spot upside, without opening high leverage. First, wait for two complete 15-minute candles to hold above 568. Then, if the next candle closes with volume above 575 and the following one doesn’t fall back below 572, I’d use up to 1% of principal to scale in in batches as a long. First target: 580–584—if reached, cut the position in half. Second target: 588–592—cut the remaining position. If after entering the 15-minute candle closes below 567, exit immediately and go fully flat. If it first breaks below 565 and the bounce back to 568 fails, cancel the long plan and continue staying in cash—no “hard catch” just because of the so-called catch-up.
What truly overturns my cautious judgment is holding above 576 along with expanded trading volume. Conversely, losing 565 means the assumed spillover hasn’t been realized in XMR. What I’m discussing here is conditional planning, not a record of executed trades.
#BitcoinSpotETFs$999MNetInflow #XMR
The above is only my personal market observations and does not constitute investment advice.

163

·
--
#oilpricerises × #BitcoinSpotETFs — The Divergence That Could Decide BTC
Oil opened lower Sunday (Brent ~$72.49, WTI ~$69.96) after Axios reported US-Iran agreed to "stand down" for talks. Markets cheered. But the physical layer tells a different story:
💥Saudi Aramco helicopter down at Ras Tanura — 14 dead
💥Qatar's Ras Laffan LNG detonated last week
💥IRGC struck US bases in Kuwait & Bahrain ~36 hours ago
💥SPR at 181M barrels — just 41 days of max draw
Paper oil is being sold by algos into a fragile peace narrative. Physical oil is pricing active supply-chain attacks. When that gap snaps shut, the move is violent.
The BTC link: $1.79B ETF outflow last week (7th straight week, IBIT bled $1.3B). Institutions are positioned for recession + rate hikes. Oil determines the next leg.
Scenario A — Talks hold, oil falls: Disinflation wins, Fed stays dovish, BTC relief rally to ~$65K.
Scenario B — Talks break, oil rips: Brent > $75 reprices geopolitical risk. PCE (4.1%) accelerates, rate hikes become certain, ETF outflows double down, BTC breaks $59K support and slides toward $45K–50K.
🔧 Trade Setup — The Asymmetric Bet
Short $BTC if Brent closes above $75 on a daily candle. That's the signal that the diplomatic narrative failed and physical scarcity is being repriced.
💥Entry at market on trigger.
💥Target: $50K.
💥Stop-loss: $63K.
💥Leverage 3-5x max — this is a fat-tail setup, not a core position.
{future}(BTCUSDT)
If Brent stays below $72 and keeps falling, the BTC relief trade (spot long) is the better edge. But the risk/reward on the short side — given the disconnect between paper and physical oil — is the most compelling macro setup right now.
Bottom line: Watch $75 Brent. It's the release valve. Either oil confirms dovish disinflation (bullish BTC) or it shatters the narrative entirely (bearish BTC). Clean signal, defined setup. Wait for confirmation.
⚠️ Not financial advice. Do your own research.
#oilpricerises × #BitcoinSpotETFs — The Divergence That Could Decide BTC
Oil opened lower Sunday (Brent ~$72.49, WTI ~$69.96) after Axios reported US-Iran agreed to "stand down" for talks. Markets cheered. But the physical layer tells a different story:
💥Saudi Aramco helicopter down at Ras Tanura — 14 dead
💥Qatar's Ras Laffan LNG detonated last week
💥IRGC struck US bases in Kuwait & Bahrain ~36 hours ago
💥SPR at 181M barrels — just 41 days of max draw
Paper oil is being sold by algos into a fragile peace narrative. Physical oil is pricing active supply-chain attacks. When that gap snaps shut, the move is violent.
The BTC link: $1.79B ETF outflow last week (7th straight week, IBIT bled $1.3B). Institutions are positioned for recession + rate hikes. Oil determines the next leg.
Scenario A — Talks hold, oil falls: Disinflation wins, Fed stays dovish, BTC relief rally to ~$65K.
Scenario B — Talks break, oil rips: Brent > $75 reprices geopolitical risk. PCE (4.1%) accelerates, rate hikes become certain, ETF outflows double down, BTC breaks $59K support and slides toward $45K–50K.
🔧 Trade Setup — The Asymmetric Bet
Short $BTC if Brent closes above $75 on a daily candle. That's the signal that the diplomatic narrative failed and physical scarcity is being repriced.
💥Entry at market on trigger.
💥Target: $50K.
💥Stop-loss: $63K.
💥Leverage 3-5x max — this is a fat-tail setup, not a core position.
If Brent stays below $72 and keeps falling, the BTC relief trade (spot long) is the better edge. But the risk/reward on the short side — given the disconnect between paper and physical oil — is the most compelling macro setup right now.
Bottom line: Watch $75 Brent. It's the release valve. Either oil confirms dovish disinflation (bullish BTC) or it shatters the narrative entirely (bearish BTC). Clean signal, defined setup. Wait for confirmation.
⚠️ Not financial advice. Do your own research.
Oil opened lower Sunday (Brent ~$72.49, WTI ~$69.96) after Axios reported US-Iran agreed to "stand down" for talks. Markets cheered. But the physical layer tells a different story:
💥Saudi Aramco helicopter down at Ras Tanura — 14 dead
💥Qatar's Ras Laffan LNG detonated last week
💥IRGC struck US bases in Kuwait & Bahrain ~36 hours ago
💥SPR at 181M barrels — just 41 days of max draw
Paper oil is being sold by algos into a fragile peace narrative. Physical oil is pricing active supply-chain attacks. When that gap snaps shut, the move is violent.
The BTC link: $1.79B ETF outflow last week (7th straight week, IBIT bled $1.3B). Institutions are positioned for recession + rate hikes. Oil determines the next leg.
Scenario A — Talks hold, oil falls: Disinflation wins, Fed stays dovish, BTC relief rally to ~$65K.
Scenario B — Talks break, oil rips: Brent > $75 reprices geopolitical risk. PCE (4.1%) accelerates, rate hikes become certain, ETF outflows double down, BTC breaks $59K support and slides toward $45K–50K.
🔧 Trade Setup — The Asymmetric Bet
Short $BTC if Brent closes above $75 on a daily candle. That's the signal that the diplomatic narrative failed and physical scarcity is being repriced.
💥Entry at market on trigger.
💥Target: $50K.
💥Stop-loss: $63K.
💥Leverage 3-5x max — this is a fat-tail setup, not a core position.
If Brent stays below $72 and keeps falling, the BTC relief trade (spot long) is the better edge. But the risk/reward on the short side — given the disconnect between paper and physical oil — is the most compelling macro setup right now.
Bottom line: Watch $75 Brent. It's the release valve. Either oil confirms dovish disinflation (bullish BTC) or it shatters the narrative entirely (bearish BTC). Clean signal, defined setup. Wait for confirmation.
⚠️ Not financial advice. Do your own research.
69
·
--
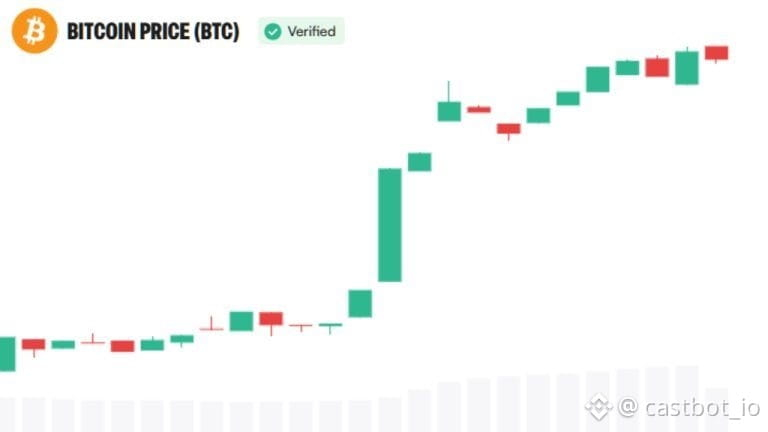
📰 Why are institutions building a financial system around Bitcoin? It means Bitcoin is no longer the finish line
Institutional investors are no longer debating whether to hold Bitcoin; instead, they’re starting to think about how to use Bitcoin for financing, holding, and trading. According to a research report released by CoinDesk, this shift may signal that Bitcoin adoption is entering a new stage. Institutions are beginning to treat Bitcoin as a core asset and to develop more complex financial products, such as Bitcoin-backed loans or Bitcoin funds. This change reflects growing market acceptance of cryptocurrencies, as well as institutional investors’ recognition of their financial characteristics.
Why is this news important?
The significance lies in the fact that it reveals a fundamental shift in institutional investors’ attitude toward cryptocurrencies. In the past, institutions focused on Bitcoin’s potential as an investment asset; now they focus on its role as a financial instrument. This shift means Bitcoin is evolving from a simple digital asset into the foundation of a more complex financial ecosystem. The underlying reason is that institutional investors increasingly recognize Bitcoin’s scarcity and programmability, making it an ideal base for building financial products.
Impact on the market
In the short term, this news may boost confidence in Bitcoin because institutional investors see it as foundational financial infrastructure, implying higher adoption rates and demand. In the long term, Bitcoin may attract more institutional capital inflows and further integrate into the traditional financial system. The impact on the market landscape could be significant, as Bitcoin could become a benchmark asset for other cryptocurrencies. On the regulatory front, this shift may prompt regulators to further consider how to oversee financial products related to Bitcoin. In terms of capital flows, we may see more traditional financial funds flowing into the cryptocurrency space.
Trading idea
💡 I think this Bitcoin phase may be starting. If Bitcoin can hold the key level of $83,000 over the next few weeks, it may continue upward to test $85,000. But if it fails to hold this level, then this view is invalid.
This article has no project sponsor. The author does not hold any of the assets mentioned
$BTC $ETH #BTC #ETH
⚠️ Not investment advice; predictions are for reference only
#BitcoinSpotETFs$2.39BWeeklyNetInflow
📰 Why are institutions building a financial system around Bitcoin? It means Bitcoin is no longer the finish line
Institutional investors are no longer debating whether to hold Bitcoin; instead, they’re starting to think about how to use Bitcoin for financing, holding, and trading. According to a research report released by CoinDesk, this shift may signal that Bitcoin adoption is entering a new stage. Institutions are beginning to treat Bitcoin as a core asset and to develop more complex financial products, such as Bitcoin-backed loans or Bitcoin funds. This change reflects growing market acceptance of cryptocurrencies, as well as institutional investors’ recognition of their financial characteristics.
Why is this news important?
The significance lies in the fact that it reveals a fundamental shift in institutional investors’ attitude toward cryptocurrencies. In the past, institutions focused on Bitcoin’s potential as an investment asset; now they focus on its role as a financial instrument. This shift means Bitcoin is evolving from a simple digital asset into the foundation of a more complex financial ecosystem. The underlying reason is that institutional investors increasingly recognize Bitcoin’s scarcity and programmability, making it an ideal base for building financial products.
Impact on the market
In the short term, this news may boost confidence in Bitcoin because institutional investors see it as foundational financial infrastructure, implying higher adoption rates and demand. In the long term, Bitcoin may attract more institutional capital inflows and further integrate into the traditional financial system. The impact on the market landscape could be significant, as Bitcoin could become a benchmark asset for other cryptocurrencies. On the regulatory front, this shift may prompt regulators to further consider how to oversee financial products related to Bitcoin. In terms of capital flows, we may see more traditional financial funds flowing into the cryptocurrency space.
Trading idea
💡 I think this Bitcoin phase may be starting. If Bitcoin can hold the key level of $83,000 over the next few weeks, it may continue upward to test $85,000. But if it fails to hold this level, then this view is invalid.
This article has no project sponsor. The author does not hold any of the assets mentioned
$BTC $ETH #BTC #ETH
⚠️ Not investment advice; predictions are for reference only
#BitcoinSpotETFs$2.39BWeeklyNetInflow
Institutional investors are no longer debating whether to hold Bitcoin; instead, they’re starting to think about how to use Bitcoin for financing, holding, and trading. According to a research report released by CoinDesk, this shift may signal that Bitcoin adoption is entering a new stage. Institutions are beginning to treat Bitcoin as a core asset and to develop more complex financial products, such as Bitcoin-backed loans or Bitcoin funds. This change reflects growing market acceptance of cryptocurrencies, as well as institutional investors’ recognition of their financial characteristics.
Why is this news important?
The significance lies in the fact that it reveals a fundamental shift in institutional investors’ attitude toward cryptocurrencies. In the past, institutions focused on Bitcoin’s potential as an investment asset; now they focus on its role as a financial instrument. This shift means Bitcoin is evolving from a simple digital asset into the foundation of a more complex financial ecosystem. The underlying reason is that institutional investors increasingly recognize Bitcoin’s scarcity and programmability, making it an ideal base for building financial products.
Impact on the market
In the short term, this news may boost confidence in Bitcoin because institutional investors see it as foundational financial infrastructure, implying higher adoption rates and demand. In the long term, Bitcoin may attract more institutional capital inflows and further integrate into the traditional financial system. The impact on the market landscape could be significant, as Bitcoin could become a benchmark asset for other cryptocurrencies. On the regulatory front, this shift may prompt regulators to further consider how to oversee financial products related to Bitcoin. In terms of capital flows, we may see more traditional financial funds flowing into the cryptocurrency space.
Trading idea
💡 I think this Bitcoin phase may be starting. If Bitcoin can hold the key level of $83,000 over the next few weeks, it may continue upward to test $85,000. But if it fails to hold this level, then this view is invalid.
This article has no project sponsor. The author does not hold any of the assets mentioned
$BTC $ETH #BTC #ETH
⚠️ Not investment advice; predictions are for reference only
#BitcoinSpotETFs$2.39BWeeklyNetInflow


120

·
--
Earnings Report Season: Will It Blow Away Market Sentiment?
💥 Earnings report season is heating up the community—everyone is waiting to see which “big player” will deliver great results.
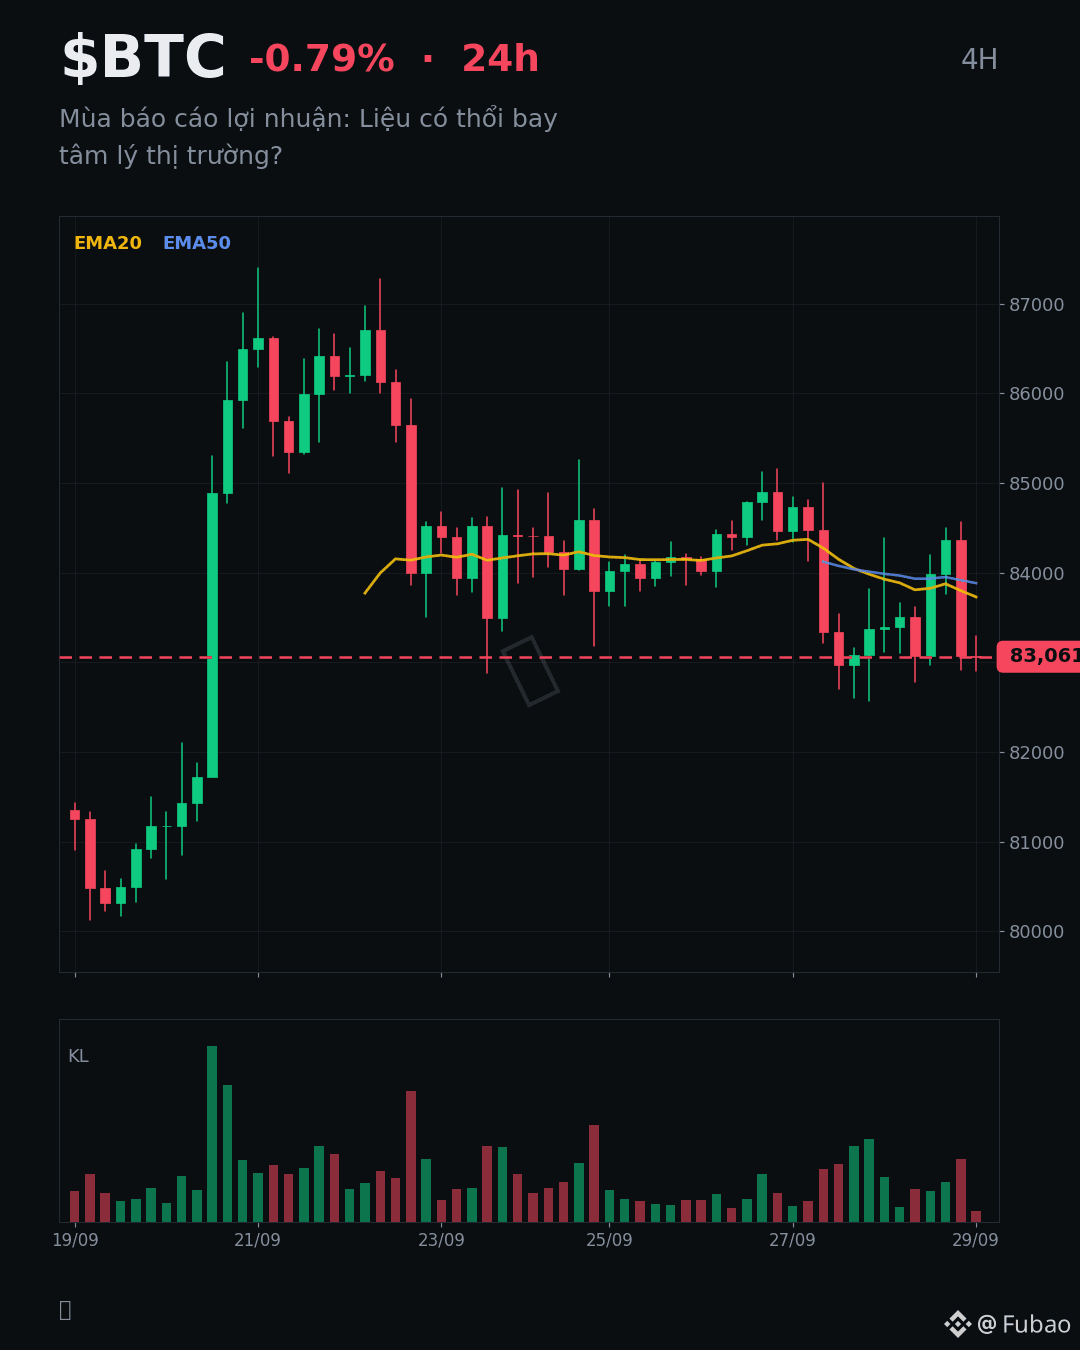
But this is what I’m concerned about when I see Bitcoin ($BTC) just moving sideways:
🔥 Could capital flows from funds be temporarily shifting away from crypto?
🔥 If results don’t match expectations, will overall sentiment be affected?
🔥 I keep thinking that large investors might be reconsidering their portfolios.
To be honest, seeing BTC dip slightly (-0.79%) even though volume is still healthy makes me a bit uneasy. My personal view is that you should stay level-headed, understand the reasons behind the up-and-down moves, instead of just following the crowd. What do you think?
For reference only, not investment advice. DYOR.
#BTC #EarningsSeason #BitcoinSpotETFs$2.39BWeeklyNetInflow
Earnings Report Season: Will It Blow Away Market Sentiment?
💥 Earnings report season is heating up the community—everyone is waiting to see which “big player” will deliver great results.
But this is what I’m concerned about when I see Bitcoin ($BTC ) just moving sideways:
🔥 Could capital flows from funds be temporarily shifting away from crypto?
🔥 If results don’t match expectations, will overall sentiment be affected?
🔥 I keep thinking that large investors might be reconsidering their portfolios.
To be honest, seeing BTC dip slightly (-0.79%) even though volume is still healthy makes me a bit uneasy. My personal view is that you should stay level-headed, understand the reasons behind the up-and-down moves, instead of just following the crowd. What do you think?
For reference only, not investment advice. DYOR.
#BTC #EarningsSeason #BitcoinSpotETFs$2.39BWeeklyNetInflow
💥 Earnings report season is heating up the community—everyone is waiting to see which “big player” will deliver great results.
But this is what I’m concerned about when I see Bitcoin ($BTC ) just moving sideways:
🔥 Could capital flows from funds be temporarily shifting away from crypto?
🔥 If results don’t match expectations, will overall sentiment be affected?
🔥 I keep thinking that large investors might be reconsidering their portfolios.
To be honest, seeing BTC dip slightly (-0.79%) even though volume is still healthy makes me a bit uneasy. My personal view is that you should stay level-headed, understand the reasons behind the up-and-down moves, instead of just following the crowd. What do you think?
For reference only, not investment advice. DYOR.
#BTC #EarningsSeason #BitcoinSpotETFs$2.39BWeeklyNetInflow
295

·
--
Day 2/45: More discipline than trying to guess the top and bottom
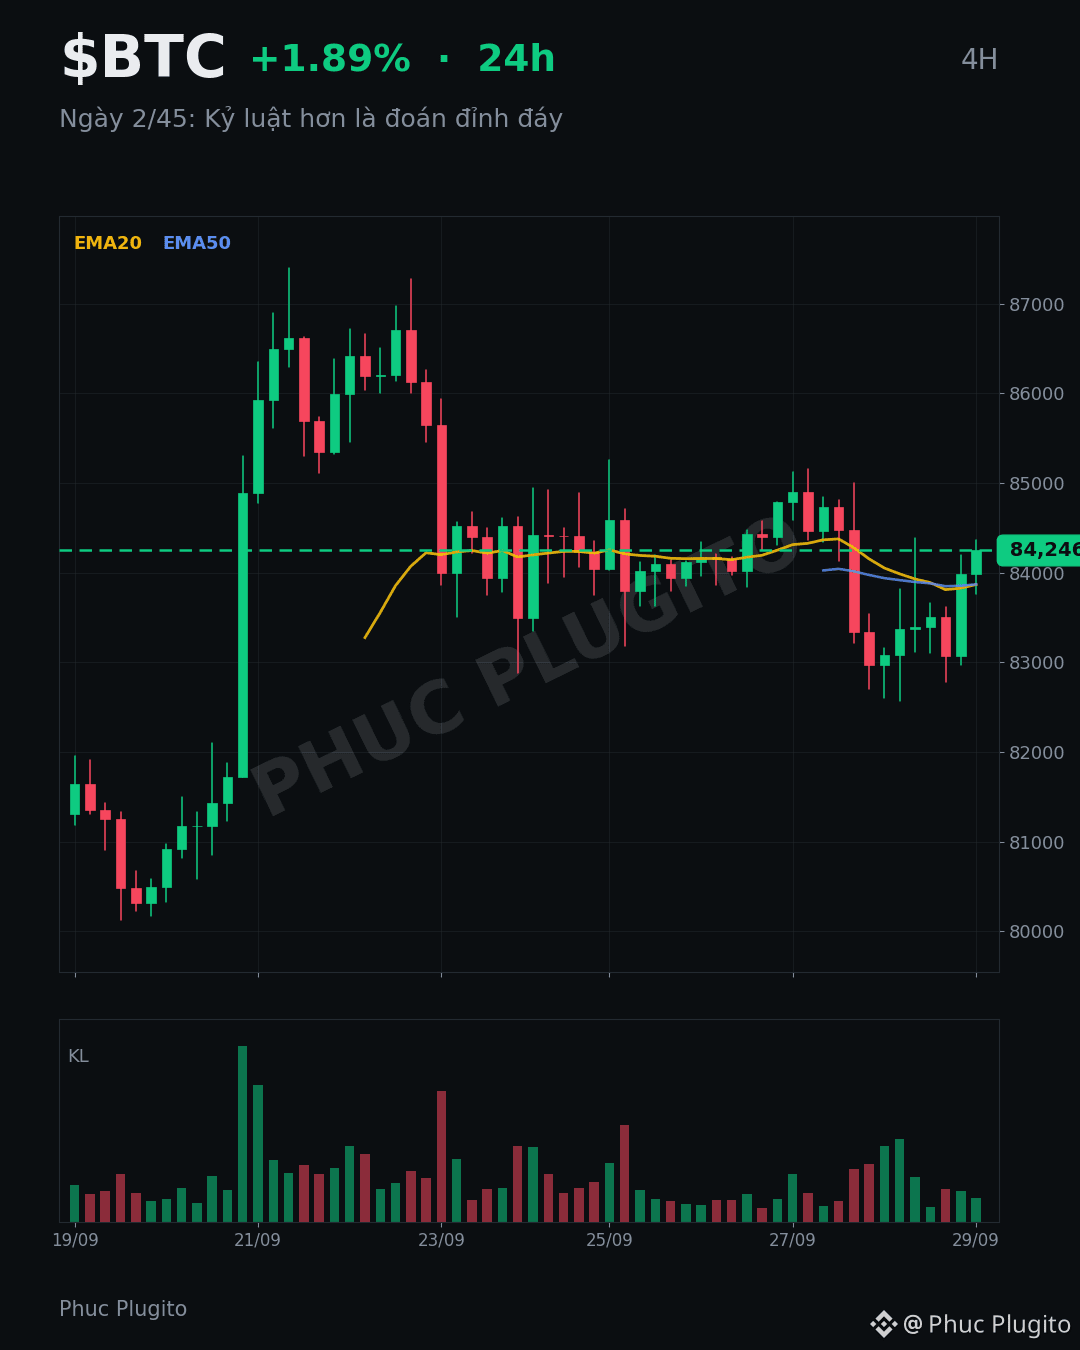
On the second day of the 45-day financial freedom journey, I’m still steadily setting aside 50u to buy more Bitcoin ($BTC). Today the price is up slightly, and it’s nice to see, but I remind myself not to get too carried away by minor fluctuations. The main thing is to stick to the strategy.
Honestly, I’ve realized that trying to predict where the market’s top and bottom are is exhausting and often not effective. Instead, it’s better to keep consistently adding bit by bit, without paying too much attention to short-term price movements—this is what really matters. I think this patience and discipline is a core factor for going the distance.
Reference information only, not investment advice. DYOR.
#45ngaytudotaichinh #BitcoinSpotETFs$2.39BWeeklyNetInflow
Day 2/45: More discipline than trying to guess the top and bottom
On the second day of the 45-day financial freedom journey, I’m still steadily setting aside 50u to buy more Bitcoin ($BTC ). Today the price is up slightly, and it’s nice to see, but I remind myself not to get too carried away by minor fluctuations. The main thing is to stick to the strategy.
Honestly, I’ve realized that trying to predict where the market’s top and bottom are is exhausting and often not effective. Instead, it’s better to keep consistently adding bit by bit, without paying too much attention to short-term price movements—this is what really matters. I think this patience and discipline is a core factor for going the distance.
Reference information only, not investment advice. DYOR.
#45ngaytudotaichinh #BitcoinSpotETFs$2.39BWeeklyNetInflow
On the second day of the 45-day financial freedom journey, I’m still steadily setting aside 50u to buy more Bitcoin ($BTC ). Today the price is up slightly, and it’s nice to see, but I remind myself not to get too carried away by minor fluctuations. The main thing is to stick to the strategy.
Honestly, I’ve realized that trying to predict where the market’s top and bottom are is exhausting and often not effective. Instead, it’s better to keep consistently adding bit by bit, without paying too much attention to short-term price movements—this is what really matters. I think this patience and discipline is a core factor for going the distance.
Reference information only, not investment advice. DYOR.
#45ngaytudotaichinh #BitcoinSpotETFs$2.39BWeeklyNetInflow
1
261

·
--
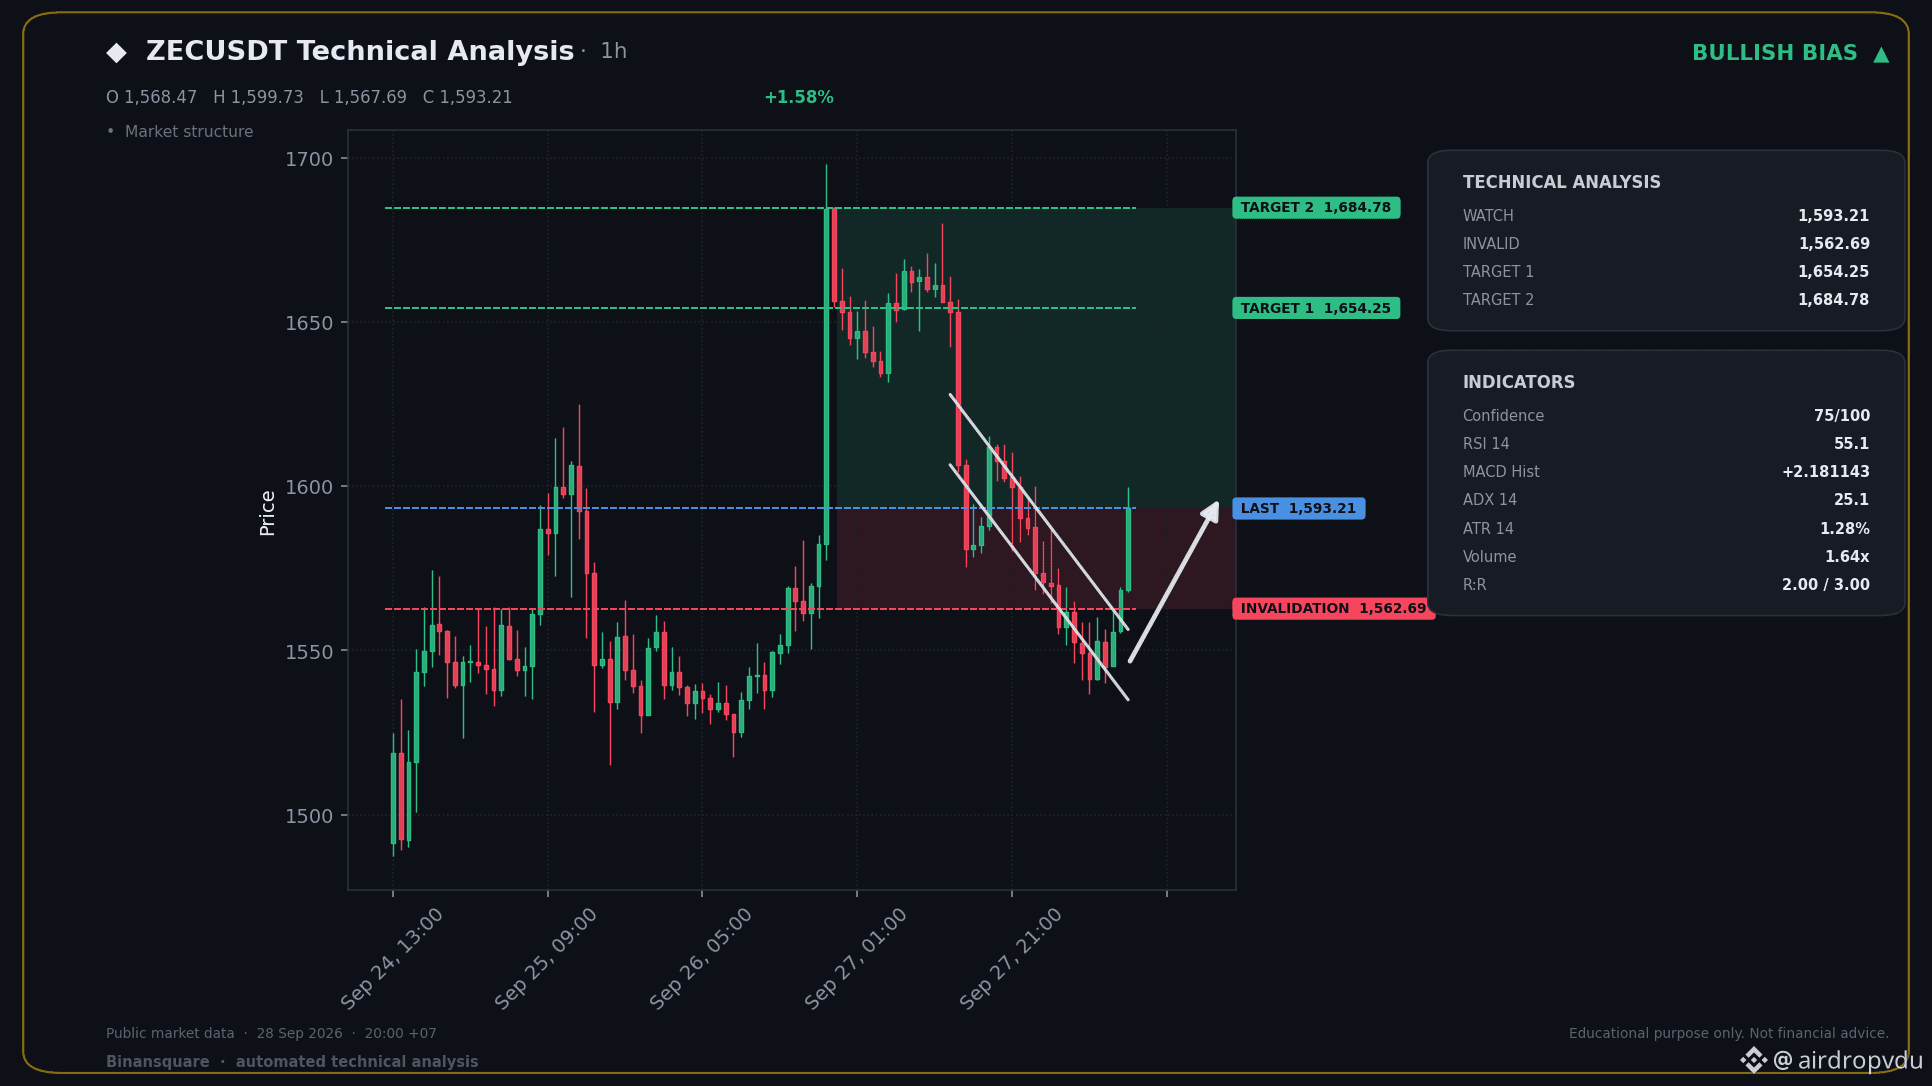
📈 BIG LONG NOW - ZECUSDT
📍 KEY LEVELS
Entry: 1,593.21
🛑 SL: 1,562.69
🎯 TP1: 1,654.25
🎯 TP2: 1,684.78
The trend is still solid with the 50-day EMA above the 200-day. Momentum's picking back up as the MACD just crossed bullish, and the RSI is recovering from a dip.
This signal was generated automatically from technical indicators. It does not guarantee profit and is not investment advice. Always manage your own risk and DYOR.
$ZEC
#BTCFallsBelow$83000 #BitcoinSpotETFs$2.39BWeeklyNetInflow
📈 BIG LONG NOW - ZECUSDT
📍 KEY LEVELS
Entry: 1,593.21
🛑 SL: 1,562.69
🎯 TP1: 1,654.25
🎯 TP2: 1,684.78
The trend is still solid with the 50-day EMA above the 200-day. Momentum's picking back up as the MACD just crossed bullish, and the RSI is recovering from a dip.
This signal was generated automatically from technical indicators. It does not guarantee profit and is not investment advice. Always manage your own risk and DYOR.
$ZEC
#BTCFallsBelow$83000 #BitcoinSpotETFs$2.39BWeeklyNetInflow
📍 KEY LEVELS
Entry: 1,593.21
🛑 SL: 1,562.69
🎯 TP1: 1,654.25
🎯 TP2: 1,684.78
The trend is still solid with the 50-day EMA above the 200-day. Momentum's picking back up as the MACD just crossed bullish, and the RSI is recovering from a dip.
This signal was generated automatically from technical indicators. It does not guarantee profit and is not investment advice. Always manage your own risk and DYOR.
$ZEC
#BTCFallsBelow$83000 #BitcoinSpotETFs$2.39BWeeklyNetInflow
161


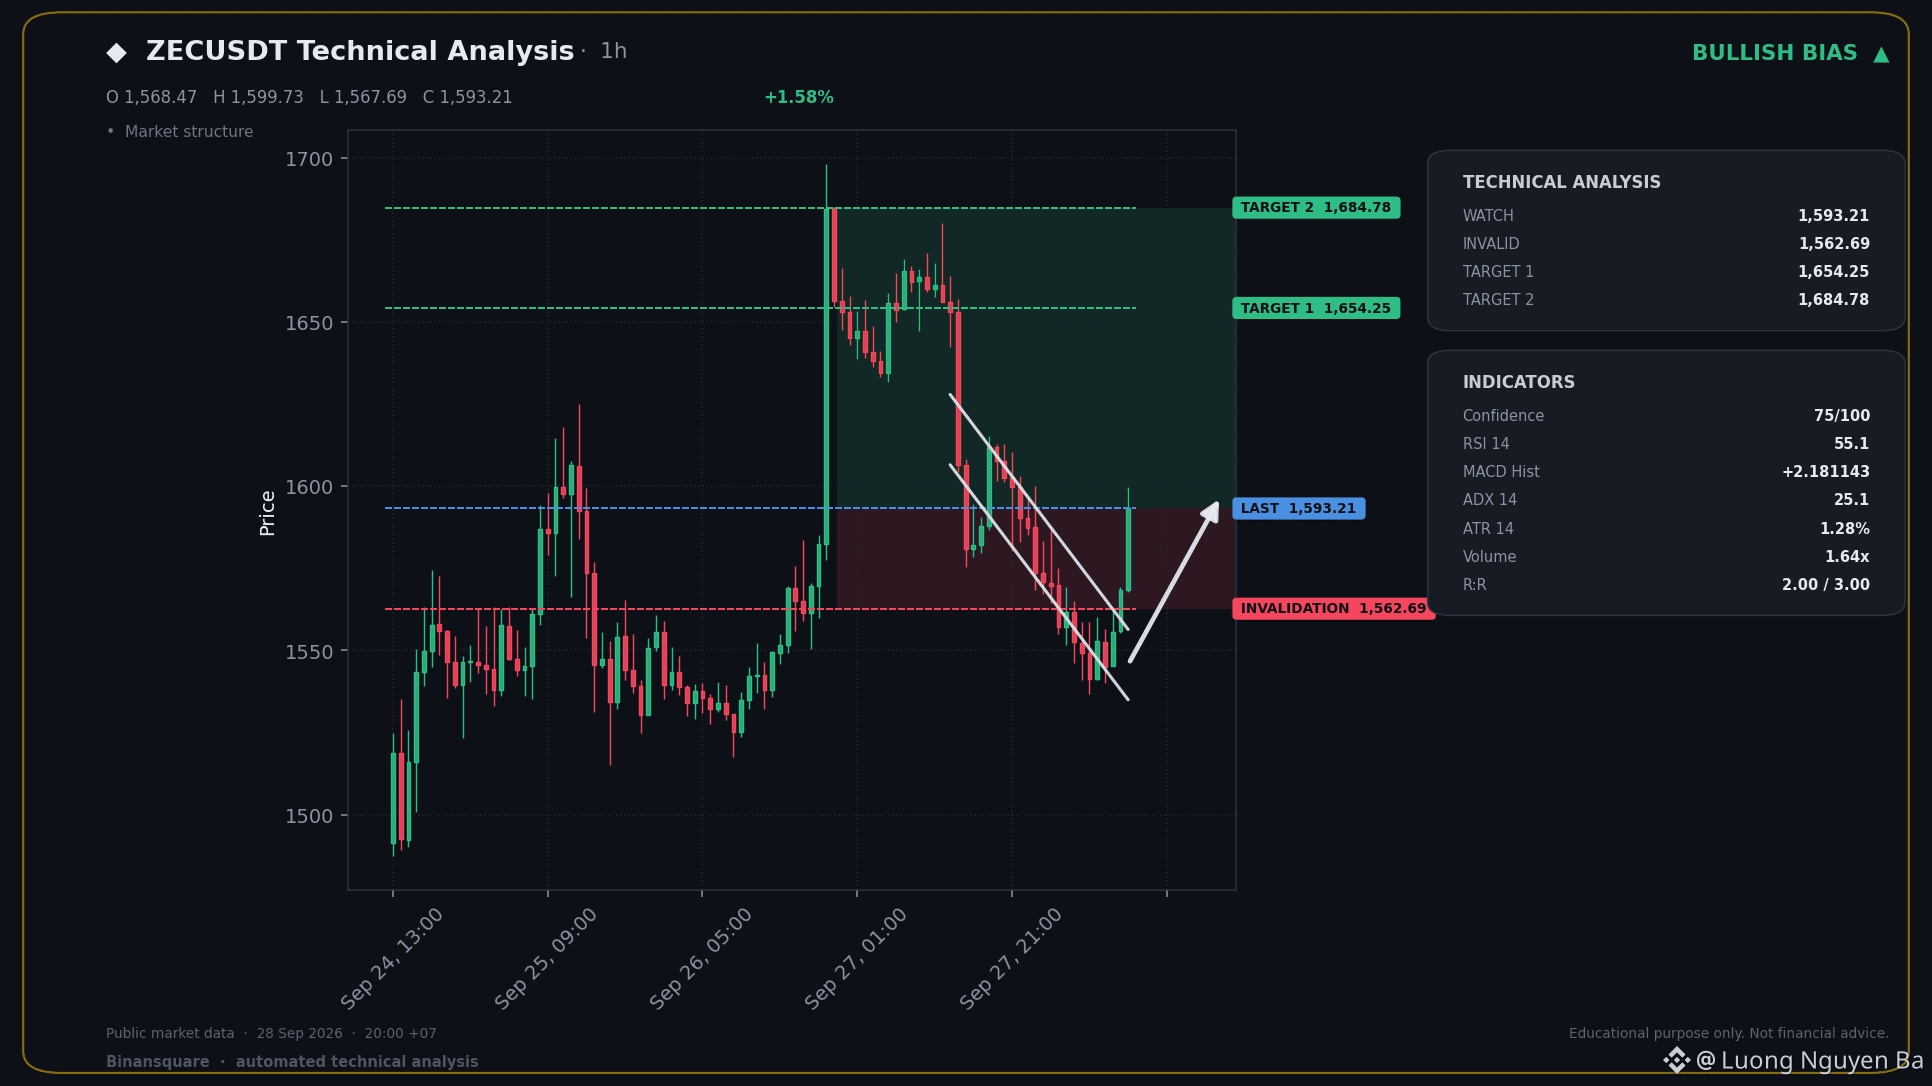
📈 BIG LONG NOW - ZECUSDT
📍 KEY LEVELS
Entry: 1,593.21
🛑 SL: 1,562.69
🎯 TP1: 1,654.25
🎯 TP2: 1,684.78
The trend is still solid with the 50-day EMA above the 200-day. Momentum's picking back up as the MACD just crossed bullish, and the RSI is recovering from a dip.
This signal was generated automatically from technical indicators. It does not guarantee profit and is not investment advice. Always manage your own risk and DYOR.
$ZEC
#BTCFallsBelow$83000 #BitcoinSpotETFs$2.39BWeeklyNetInflow
📈 BIG LONG NOW - ZECUSDT
📍 KEY LEVELS
Entry: 1,593.21
🛑 SL: 1,562.69
🎯 TP1: 1,654.25
🎯 TP2: 1,684.78
The trend is still solid with the 50-day EMA above the 200-day. Momentum's picking back up as the MACD just crossed bullish, and the RSI is recovering from a dip.
This signal was generated automatically from technical indicators. It does not guarantee profit and is not investment advice. Always manage your own risk and DYOR.
$ZEC
#BTCFallsBelow$83000 #BitcoinSpotETFs$2.39BWeeklyNetInflow
📍 KEY LEVELS
Entry: 1,593.21
🛑 SL: 1,562.69
🎯 TP1: 1,654.25
🎯 TP2: 1,684.78
The trend is still solid with the 50-day EMA above the 200-day. Momentum's picking back up as the MACD just crossed bullish, and the RSI is recovering from a dip.
This signal was generated automatically from technical indicators. It does not guarantee profit and is not investment advice. Always manage your own risk and DYOR.
$ZEC
#BTCFallsBelow$83000 #BitcoinSpotETFs$2.39BWeeklyNetInflow
164

·
--
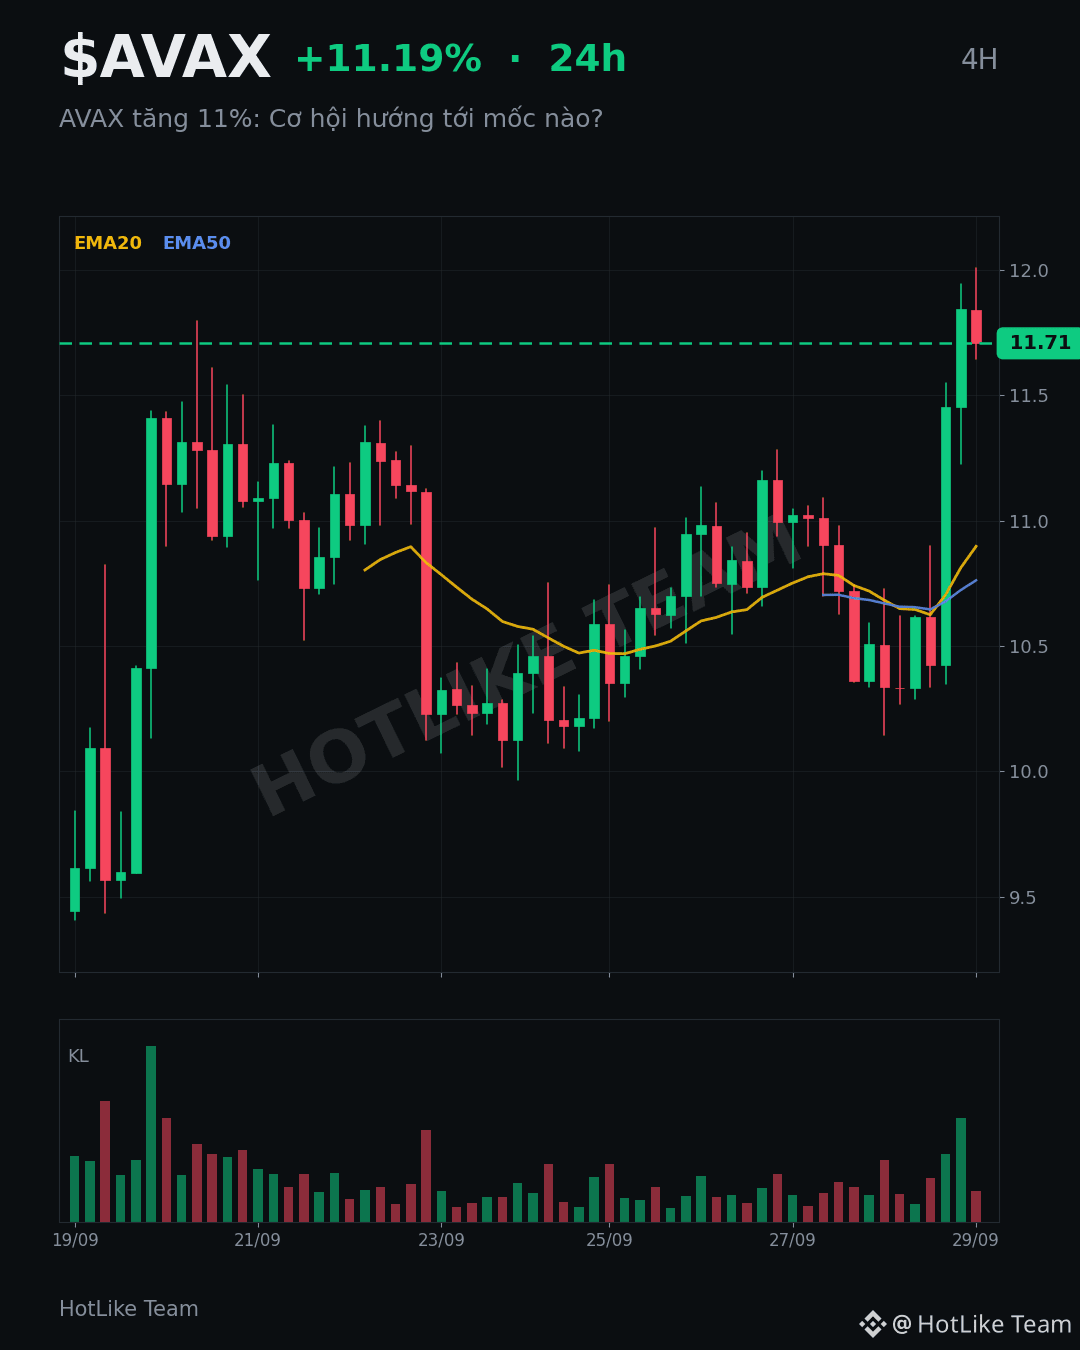
AVAX up 11%: What price level could it target next?
To be honest, watching the market these past few days has been a bit nerve-wracking—especially while Bitcoin is still stuck in its range of fluctuations. But some altcoins are quietly showing impressive strength. This morning, when I opened the price board, I saw that Avalanche () has risen more than 11% within 24 hours—an encouraging signal.
With the current price action, I’m leaning toward the possibility $AVAX could move toward a higher price zone. This is my personal view, not investment advice, and the crypto market is always full of volatility. So make sure you’re mentally prepared for every scenario.
Personally, I still believe in Avalanche’s long-term potential with its growing ecosystem. But will this rally continue, and will AVAX soon reach new highs? What do you think about the AVAX trend over the next few days?
#NEAR #BitcoinSpotETFs$2.39BWeeklyNetInflow $NEAR
AVAX up 11%: What price level could it target next?
To be honest, watching the market these past few days has been a bit nerve-wracking—especially while Bitcoin is still stuck in its range of fluctuations. But some altcoins are quietly showing impressive strength. This morning, when I opened the price board, I saw that Avalanche () has risen more than 11% within 24 hours—an encouraging signal.
With the current price action, I’m leaning toward the possibility $AVAX could move toward a higher price zone. This is my personal view, not investment advice, and the crypto market is always full of volatility. So make sure you’re mentally prepared for every scenario.
Personally, I still believe in Avalanche’s long-term potential with its growing ecosystem. But will this rally continue, and will AVAX soon reach new highs? What do you think about the AVAX trend over the next few days?
#NEAR #BitcoinSpotETFs$2.39BWeeklyNetInflow $NEAR
To be honest, watching the market these past few days has been a bit nerve-wracking—especially while Bitcoin is still stuck in its range of fluctuations. But some altcoins are quietly showing impressive strength. This morning, when I opened the price board, I saw that Avalanche () has risen more than 11% within 24 hours—an encouraging signal.
With the current price action, I’m leaning toward the possibility $AVAX could move toward a higher price zone. This is my personal view, not investment advice, and the crypto market is always full of volatility. So make sure you’re mentally prepared for every scenario.
Personally, I still believe in Avalanche’s long-term potential with its growing ecosystem. But will this rally continue, and will AVAX soon reach new highs? What do you think about the AVAX trend over the next few days?
#NEAR #BitcoinSpotETFs$2.39BWeeklyNetInflow $NEAR
73
·
--
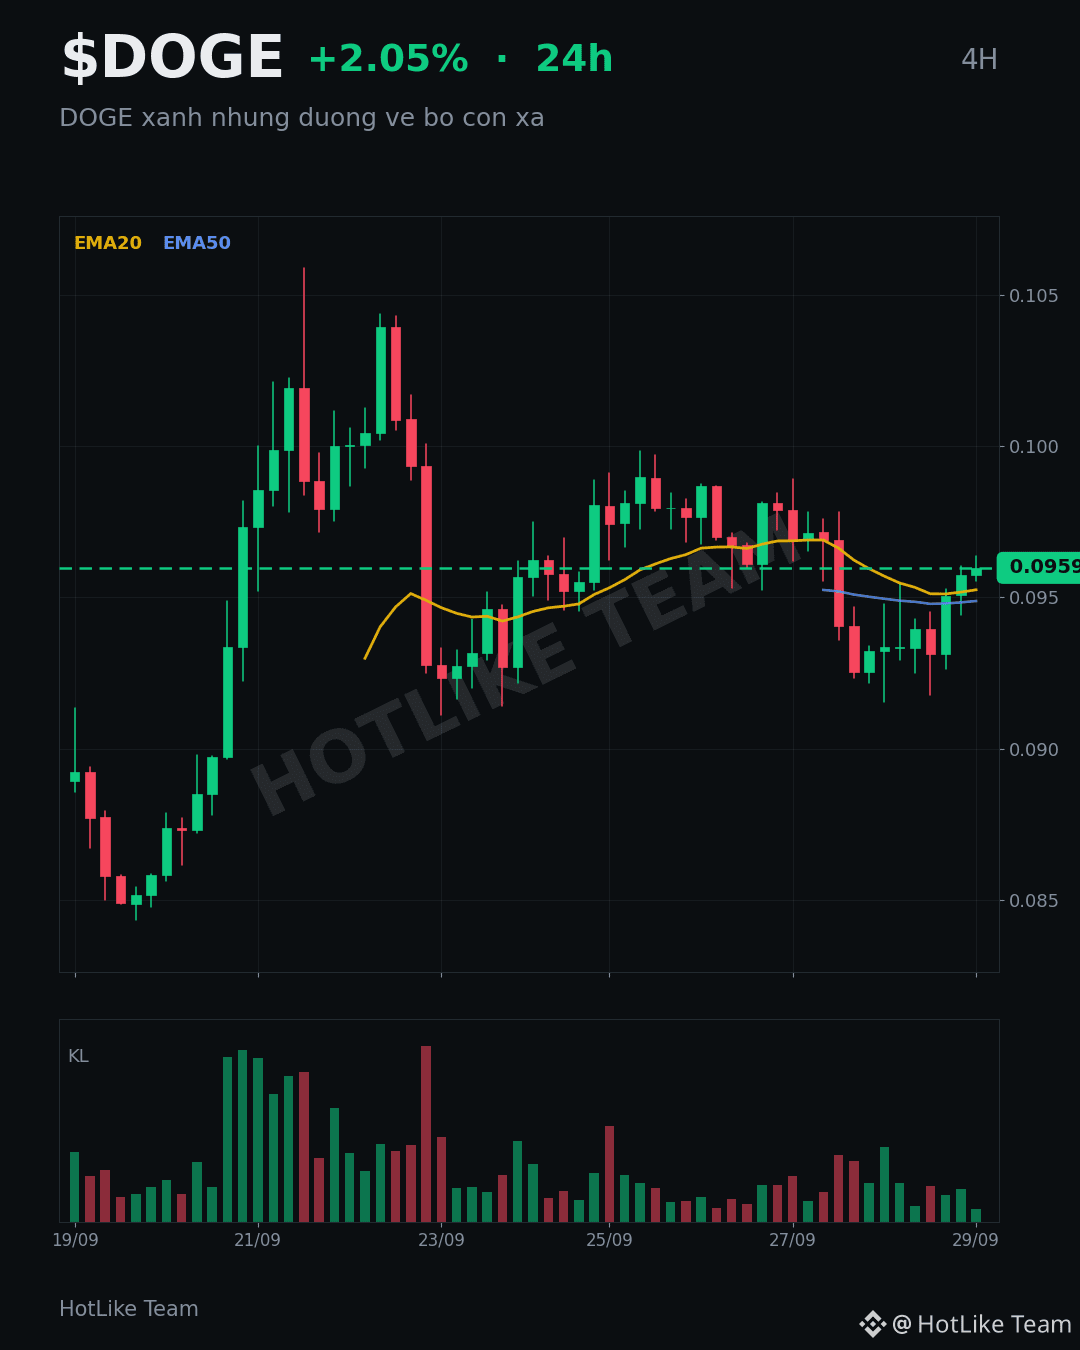
Green DOGE but the path still leads far from the border of the coin
$DOGE is green +2.05% over the past 24h. Seeing the rising candle, many brothers are probably pretty excited. The long crowd makes up 71%.
Remember when DOGE was making waves a few seasons ago, like SHIB from 2–3 years back. Everyone thought it was a meme coin for quick riches.
Now it’s different. Even with a bullish wave, I’m still keeping a close eye on spot volume and the real money flow into the market. One green candle doesn’t mean much—breaking resistance is one thing, but holding the momentum is another.
Just my personal view, not financial advice to buy or sell. I won’t chase after those hot breakout candles too hastily. What about you guys?
#DOGE #BitcoinSpotETFs$2.39BWeeklyNetInflow
Green DOGE but the path still leads far from the border of the coin
$DOGE is green +2.05% over the past 24h. Seeing the rising candle, many brothers are probably pretty excited. The long crowd makes up 71%.
Remember when DOGE was making waves a few seasons ago, like SHIB from 2–3 years back. Everyone thought it was a meme coin for quick riches.
Now it’s different. Even with a bullish wave, I’m still keeping a close eye on spot volume and the real money flow into the market. One green candle doesn’t mean much—breaking resistance is one thing, but holding the momentum is another.
Just my personal view, not financial advice to buy or sell. I won’t chase after those hot breakout candles too hastily. What about you guys?
#DOGE #BitcoinSpotETFs$2.39BWeeklyNetInflow
$DOGE is green +2.05% over the past 24h. Seeing the rising candle, many brothers are probably pretty excited. The long crowd makes up 71%.
Remember when DOGE was making waves a few seasons ago, like SHIB from 2–3 years back. Everyone thought it was a meme coin for quick riches.
Now it’s different. Even with a bullish wave, I’m still keeping a close eye on spot volume and the real money flow into the market. One green candle doesn’t mean much—breaking resistance is one thing, but holding the momentum is another.
Just my personal view, not financial advice to buy or sell. I won’t chase after those hot breakout candles too hastily. What about you guys?
#DOGE #BitcoinSpotETFs$2.39BWeeklyNetInflow
64

·
--
Bullish
#BitcoinSpotETFsNetInflow$191M $191M into Bitcoin Spot ETFs — but the headline is only half the story.
U.S. Spot Bitcoin ETFs recorded roughly $191M in net inflows on Sept. 24, extending the positive-flow streak to six consecutive sessions and more than $2.8B combined.
What caught my attention is the concentration: BlackRock’s IBIT alone absorbed ~$162.6M — roughly 85% of the day’s total net inflow.
But there is an even more interesting signal.
ETF demand remains positive while BTC has struggled to translate that demand into an equally strong price expansion around the ~$84K area.
That divergence matters.
Positive ETF flow ≠ automatic price pump.
It tells us regulated investment vehicles are seeing net demand. It does NOT tell us that all selling pressure elsewhere in the market has disappeared.
Monday brought almost $1B of ETF inflows. Thursday brought ~$191M. So the direction remains positive, but the velocity of inflows has clearly cooled.
What I would watch next:
• Does the ETF inflow streak continue?
• Does BTC finally expand with the flows instead of absorbing them sideways?
• Is IBIT leadership joined by broader ETF participation?
• What happens when the first meaningful ETF outflow day arrives?
The strongest signal won’t be one $191M print. It will be whether persistent institutional demand eventually forces price to respond.
Follow the flows — but always confirm them with price, volume, liquidity and market structure. 🐆
#bitcoin #BTC #BitcoinETF #BitcoinSpotETFs #Crypto #BlackRock #IBIT
#BitcoinSpotETFsNetInflow$191M $191M into Bitcoin Spot ETFs — but the headline is only half the story.
U.S. Spot Bitcoin ETFs recorded roughly $191M in net inflows on Sept. 24, extending the positive-flow streak to six consecutive sessions and more than $2.8B combined.
What caught my attention is the concentration: BlackRock’s IBIT alone absorbed ~$162.6M — roughly 85% of the day’s total net inflow.
But there is an even more interesting signal.
ETF demand remains positive while BTC has struggled to translate that demand into an equally strong price expansion around the ~$84K area.
That divergence matters.
Positive ETF flow ≠ automatic price pump.
It tells us regulated investment vehicles are seeing net demand. It does NOT tell us that all selling pressure elsewhere in the market has disappeared.
Monday brought almost $1B of ETF inflows. Thursday brought ~$191M. So the direction remains positive, but the velocity of inflows has clearly cooled.
What I would watch next:
• Does the ETF inflow streak continue?
• Does BTC finally expand with the flows instead of absorbing them sideways?
• Is IBIT leadership joined by broader ETF participation?
• What happens when the first meaningful ETF outflow day arrives?
The strongest signal won’t be one $191M print. It will be whether persistent institutional demand eventually forces price to respond.
Follow the flows — but always confirm them with price, volume, liquidity and market structure. 🐆
#bitcoin #BTC #BitcoinETF #BitcoinSpotETFs #Crypto #BlackRock #IBIT
U.S. Spot Bitcoin ETFs recorded roughly $191M in net inflows on Sept. 24, extending the positive-flow streak to six consecutive sessions and more than $2.8B combined.
What caught my attention is the concentration: BlackRock’s IBIT alone absorbed ~$162.6M — roughly 85% of the day’s total net inflow.
But there is an even more interesting signal.
ETF demand remains positive while BTC has struggled to translate that demand into an equally strong price expansion around the ~$84K area.
That divergence matters.
Positive ETF flow ≠ automatic price pump.
It tells us regulated investment vehicles are seeing net demand. It does NOT tell us that all selling pressure elsewhere in the market has disappeared.
Monday brought almost $1B of ETF inflows. Thursday brought ~$191M. So the direction remains positive, but the velocity of inflows has clearly cooled.
What I would watch next:
• Does the ETF inflow streak continue?
• Does BTC finally expand with the flows instead of absorbing them sideways?
• Is IBIT leadership joined by broader ETF participation?
• What happens when the first meaningful ETF outflow day arrives?
The strongest signal won’t be one $191M print. It will be whether persistent institutional demand eventually forces price to respond.
Follow the flows — but always confirm them with price, volume, liquidity and market structure. 🐆
#bitcoin #BTC #BitcoinETF #BitcoinSpotETFs #Crypto #BlackRock #IBIT
BTC+0.23%
IBITETF-0.25%
Warriorfish:
When interest rates are moving higher, non-yielding assets such as equities and cryptocurrencies become increasingly expensive to hold. As the opportunity and carrying costs rise, investors may have a stronger incentive to rotate into interest-bearing assets, creating additional selling pressure on stocks and crypto.
7
2
9
109
Log in to explore more content
Join global crypto users on Binance Square
⚡️ Get latest and useful information about crypto.
💬 Trusted by the world’s largest crypto exchange.
👍 Discover real insights from verified creators.
Email / Phone number
Trending Topics
1
#TrumpRejectsAIRulesForVoluntaryAudits
43 views
25 Discussing
2
#BitgetHotWalletBreachTiedToThirdPartySecurityFlaw
33 views
21 Discussing
3
#OpenAIUnveilsAlwaysOnAgentDots
1,034 views
70 Discussing
4
#ChainlinkLaunchesBankSWIFTLedgerFramework
2,528 views
79 Discussing
5
#EarningsSeason
433,426 views
3,274 Discussing
6
#SECChairWantsStockMarketsOnChain
5,651 views
173 Discussing
7
#MulticoinInvestsInGrass
3,377 views
119 Discussing
8
#CEARenamesToBNBStandardUnderBNC
4,494 views
129 Discussing
9
#BitwiseLaunchesFirstSpotNEARETF
58,181 views
752 Discussing
10
#USJobOpeningsFallToFiveMonthLow
61,850 views
589 Discussing