

#bitcoinbreaksabovemayhighnears$86k
bitcoinbreaksabovemayhighnears$86k
49,567 views
269 Discussing
Hot
Latest


#BitcoinBreaksAboveMayHighNears$86K
🚨 Bitcoin Breaks Above May High, Nears $86K: Is the Market Waking Up? 🚨
The screen was quiet, then Bitcoin suddenly pushed through a level traders had been watching for months. What looked like another resistance test quickly became a serious statement from buyers.
Bitcoin has now pushed above the May high area and traded around the $86K zone, reaching an eight-month high above $87K earlier today. Binance market data also showed BTC briefly moving back below $86K, highlighting how quickly this breakout is being contested.
The move is not coming from one factor alone. Recent coverage points to stronger U.S. spot Bitcoin ETF demand, short covering, improved regulatory sentiment and broader risk appetite supporting the rebound.
But this is where the chart becomes more interesting. Breaking resistance is one thing; holding above it is another. If buyers can defend the reclaimed zone, the breakout gains technical credibility. A sharp rejection would suggest sellers are still active near these higher levels.
My takeaway: Bitcoin has changed the conversation from recovery to confirmation. The next phase is less about celebrating the breakout and more about watching whether price can build acceptance above it.
In markets, the strongest move is not always the first candle. It is the level that survives the retest.
❓Do you think BTC can establish a stable base above $86K, or is another rejection coming?
Disclaimer: This is for educational purposes only, not financial advice. Crypto markets are highly volatile and involve significant risk.
#Bitcoin #BTC #GrowWithSAC $BTC $BCH $PENGU
#BitcoinBreaksAboveMayHighNears$86K
🚨 Bitcoin Breaks Above May High, Nears $86K: Is the Market Waking Up? 🚨
The screen was quiet, then Bitcoin suddenly pushed through a level traders had been watching for months. What looked like another resistance test quickly became a serious statement from buyers.
Bitcoin has now pushed above the May high area and traded around the $86K zone, reaching an eight-month high above $87K earlier today. Binance market data also showed BTC briefly moving back below $86K, highlighting how quickly this breakout is being contested.
The move is not coming from one factor alone. Recent coverage points to stronger U.S. spot Bitcoin ETF demand, short covering, improved regulatory sentiment and broader risk appetite supporting the rebound.
But this is where the chart becomes more interesting. Breaking resistance is one thing; holding above it is another. If buyers can defend the reclaimed zone, the breakout gains technical credibility. A sharp rejection would suggest sellers are still active near these higher levels.
My takeaway: Bitcoin has changed the conversation from recovery to confirmation. The next phase is less about celebrating the breakout and more about watching whether price can build acceptance above it.
In markets, the strongest move is not always the first candle. It is the level that survives the retest.
❓Do you think BTC can establish a stable base above $86K, or is another rejection coming?
Disclaimer: This is for educational purposes only, not financial advice. Crypto markets are highly volatile and involve significant risk.
#Bitcoin #BTC #GrowWithSAC $BTC $BCH $PENGU
🚨 Bitcoin Breaks Above May High, Nears $86K: Is the Market Waking Up? 🚨
The screen was quiet, then Bitcoin suddenly pushed through a level traders had been watching for months. What looked like another resistance test quickly became a serious statement from buyers.
Bitcoin has now pushed above the May high area and traded around the $86K zone, reaching an eight-month high above $87K earlier today. Binance market data also showed BTC briefly moving back below $86K, highlighting how quickly this breakout is being contested.
The move is not coming from one factor alone. Recent coverage points to stronger U.S. spot Bitcoin ETF demand, short covering, improved regulatory sentiment and broader risk appetite supporting the rebound.
But this is where the chart becomes more interesting. Breaking resistance is one thing; holding above it is another. If buyers can defend the reclaimed zone, the breakout gains technical credibility. A sharp rejection would suggest sellers are still active near these higher levels.
My takeaway: Bitcoin has changed the conversation from recovery to confirmation. The next phase is less about celebrating the breakout and more about watching whether price can build acceptance above it.
In markets, the strongest move is not always the first candle. It is the level that survives the retest.
❓Do you think BTC can establish a stable base above $86K, or is another rejection coming?
Disclaimer: This is for educational purposes only, not financial advice. Crypto markets are highly volatile and involve significant risk.
#Bitcoin #BTC #GrowWithSAC $BTC $BCH $PENGU

206 Atlas:
Holding the breakout matters more than the spike. Watch for volume on retests to confirm acceptance above $86K.
2
4
4.1k

#BitcoinBreaksAboveMayHighNears$86K
🚨 BITCOIN BREAKS THE CEILING: $86K IS NO LONGER JUST A DREAM 🚀
The market was quiet, then the door moved.
Bitcoin pushed through the zone that had kept bulls waiting, and suddenly the old resistance became the new test.
BTC climbed above $86,000 this week, reaching roughly $87,400 before cooling back toward the mid-$85K area. Binance currently shows BTC around $85.8K, keeping the breakout zone firmly in focus.
The bigger story is the money behind the move. U.S. spot Bitcoin ETFs recorded about $999M of net inflows on September 21, followed by another strong session, pushing two-day inflows above $1.7B.
But there is another layer: short covering helped accelerate the initial move. That matters because ETF demand can provide sustained buying, while short squeezes can create faster, more fragile upside.
My Take: the important question is no longer whether BTC touched $86K. It is whether price can hold above the former breakout area without relying on forced short covering.
If ETF flows weaken or yields rise, momentum could cool quickly. A breakout is information, not a guarantee of continuation.
The real strength will be revealed by what Bitcoin does after the excitement fades.
Do you think BTC can establish $86K as new support?
Disclaimer: This is for informational purposes only, not financial advice.
#Bitcoin #BTC #GrowWithSAC $BTC $XRP $ZEC
#BitcoinBreaksAboveMayHighNears$86K
🚨 BITCOIN BREAKS THE CEILING: $86K IS NO LONGER JUST A DREAM 🚀
The market was quiet, then the door moved.
Bitcoin pushed through the zone that had kept bulls waiting, and suddenly the old resistance became the new test.
BTC climbed above $86,000 this week, reaching roughly $87,400 before cooling back toward the mid-$85K area. Binance currently shows BTC around $85.8K, keeping the breakout zone firmly in focus.
The bigger story is the money behind the move. U.S. spot Bitcoin ETFs recorded about $999M of net inflows on September 21, followed by another strong session, pushing two-day inflows above $1.7B.
But there is another layer: short covering helped accelerate the initial move. That matters because ETF demand can provide sustained buying, while short squeezes can create faster, more fragile upside.
My Take: the important question is no longer whether BTC touched $86K. It is whether price can hold above the former breakout area without relying on forced short covering.
If ETF flows weaken or yields rise, momentum could cool quickly. A breakout is information, not a guarantee of continuation.
The real strength will be revealed by what Bitcoin does after the excitement fades.
Do you think BTC can establish $86K as new support?
Disclaimer: This is for informational purposes only, not financial advice.
#Bitcoin #BTC #GrowWithSAC $BTC $XRP $ZEC
🚨 BITCOIN BREAKS THE CEILING: $86K IS NO LONGER JUST A DREAM 🚀
The market was quiet, then the door moved.
Bitcoin pushed through the zone that had kept bulls waiting, and suddenly the old resistance became the new test.
BTC climbed above $86,000 this week, reaching roughly $87,400 before cooling back toward the mid-$85K area. Binance currently shows BTC around $85.8K, keeping the breakout zone firmly in focus.
The bigger story is the money behind the move. U.S. spot Bitcoin ETFs recorded about $999M of net inflows on September 21, followed by another strong session, pushing two-day inflows above $1.7B.
But there is another layer: short covering helped accelerate the initial move. That matters because ETF demand can provide sustained buying, while short squeezes can create faster, more fragile upside.
My Take: the important question is no longer whether BTC touched $86K. It is whether price can hold above the former breakout area without relying on forced short covering.
If ETF flows weaken or yields rise, momentum could cool quickly. A breakout is information, not a guarantee of continuation.
The real strength will be revealed by what Bitcoin does after the excitement fades.
Do you think BTC can establish $86K as new support?
Disclaimer: This is for informational purposes only, not financial advice.
#Bitcoin #BTC #GrowWithSAC $BTC $XRP $ZEC

342
·
--
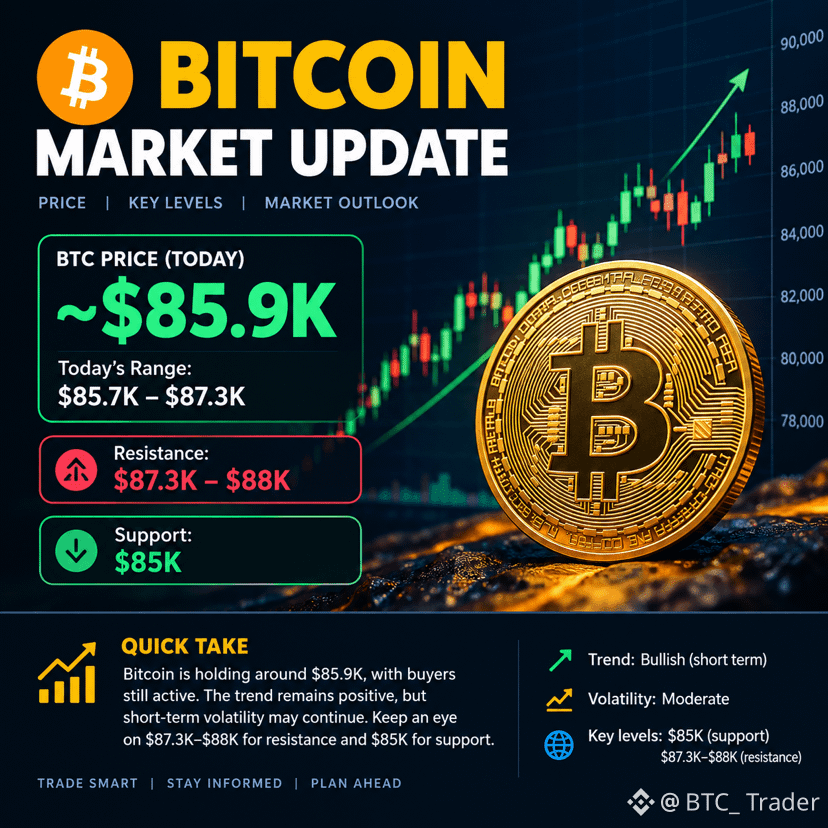
$BTC is trading around $85.9K, holding above the key $85K support. BTC faces resistance around $87.3K–$88K; a breakout above that zone could strengthen momentum toward $90K, while losing $85K could bring a deeper pullback.
Key levels:
🟢 Support: $85K
🔴 Resistance: $87.3K–$88K
🎯 Next major level: $90K
#AIStocksWhatNext #BitcoinBreaksAboveMayHighNears$86K #BitcoinTops$87KAtEightMonthHigh #21SharesLaunchesEuropesFirstZcashETP
$BTC is trading around $85.9K, holding above the key $85K support. BTC faces resistance around $87.3K–$88K; a breakout above that zone could strengthen momentum toward $90K, while losing $85K could bring a deeper pullback.
Key levels:
🟢 Support: $85K
🔴 Resistance: $87.3K–$88K
🎯 Next major level: $90K
#AIStocksWhatNext #BitcoinBreaksAboveMayHighNears$86K #BitcoinTops$87KAtEightMonthHigh #21SharesLaunchesEuropesFirstZcashETP
Key levels:
🟢 Support: $85K
🔴 Resistance: $87.3K–$88K
🎯 Next major level: $90K
#AIStocksWhatNext #BitcoinBreaksAboveMayHighNears$86K #BitcoinTops$87KAtEightMonthHigh #21SharesLaunchesEuropesFirstZcashETP
92

·
--
Bullish
#BitcoinBreaksAboveMayHighNears$86K
Is this the beginning of the 2026 bull run? 🚀
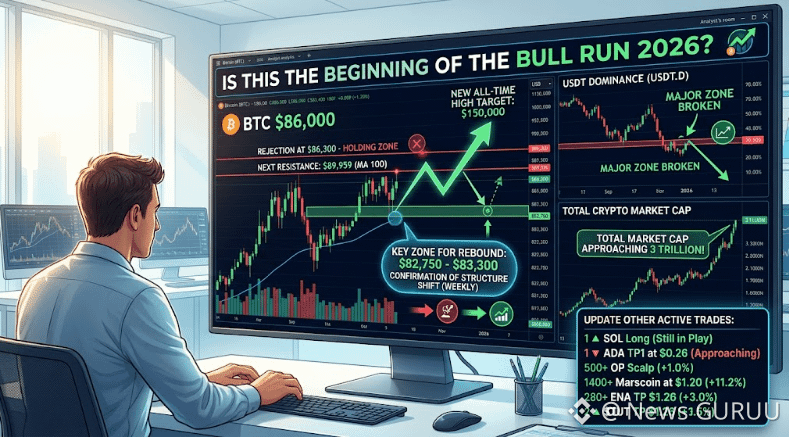
BTC is around $86K, while total crypto market cap approaches $3T. USDT dominance has broken a major zone, but I’m watching for a weekly structure confirmation and a retest of the $82,750–$83,300 area.
Key BTC levels: $86,300 resistance, followed by $89,959 (MA 100). A successful breakout could open the door toward $150K, while the retracement may be sharp.
Meanwhile, $SOL remains in play, ADA is nearing the $0.26 TP, and several setups like $OP and Marscoin have delivered solid moves.
Lock profits, trail your SLs, and stay ready for the next setups. 🔥 "CLICK ON THE BELOW YELLOW COIN TAG TO GO TO DESIRED TRADING PAGE TO GET BENEFIT TRADE"$ADA $BTC
{spot}(BTCUSDT)
{spot}(ADAUSDT)
#ADA #bullish
#BitcoinBreaksAboveMayHighNears$86K
Is this the beginning of the 2026 bull run? 🚀
BTC is around $86K, while total crypto market cap approaches $3T. USDT dominance has broken a major zone, but I’m watching for a weekly structure confirmation and a retest of the $82,750–$83,300 area.
Key BTC levels: $86,300 resistance, followed by $89,959 (MA 100). A successful breakout could open the door toward $150K, while the retracement may be sharp.
Meanwhile, $SOL remains in play, ADA is nearing the $0.26 TP, and several setups like $OP and Marscoin have delivered solid moves.
Lock profits, trail your SLs, and stay ready for the next setups. 🔥 "CLICK ON THE BELOW YELLOW COIN TAG TO GO TO DESIRED TRADING PAGE TO GET BENEFIT TRADE"$ADA $BTC
#ADA #bullish
Is this the beginning of the 2026 bull run? 🚀
BTC is around $86K, while total crypto market cap approaches $3T. USDT dominance has broken a major zone, but I’m watching for a weekly structure confirmation and a retest of the $82,750–$83,300 area.
Key BTC levels: $86,300 resistance, followed by $89,959 (MA 100). A successful breakout could open the door toward $150K, while the retracement may be sharp.
Meanwhile, $SOL remains in play, ADA is nearing the $0.26 TP, and several setups like $OP and Marscoin have delivered solid moves.
Lock profits, trail your SLs, and stay ready for the next setups. 🔥 "CLICK ON THE BELOW YELLOW COIN TAG TO GO TO DESIRED TRADING PAGE TO GET BENEFIT TRADE"$ADA $BTC
#ADA #bullish
2
58

·
--

Article
Blockchain Investing
Crypto Market Update: Bitcoin Surpasses US$86,000, Liquidates US$846 Million iElsewhere in the crypto landscape, Strategy is nearing an all-time Bitcoin holding record.
Michael Förtsch / Unsplash
Get the latest insights on Bitcoin, Ether and altcoins, along with a round-up of key cryptocurrency market news.
#AIStocksWhatNext
Here's a quick recap of the crypto landscape for Monday (September 21) as of 11:00 p.m. UTC.
Bitcoin price updateBitcoin price chartEther and altcoin price updateToday's crypto news to know
#DogecoinRises15%
Bitcoin price update
Bitcoin (BTC) was priced at US$86,603.13, trading 6.9 percent higher over the past 24 hours.
#BNBMarketCapPassesBNYMellon
The asset absorbed a Federal Reserve interest rate hike, a Bank of Japan rate hike to a 31 year high, and the Senate's rejection of the Clarity Act without trading meaningfully below US$75,000. Easing macroeconomic pressures propelled the rally as Brent crude hit a half-month low and US 10 year Treasury yields fell to 4.93 percent. Short sellers have suffered massive losses as crypto short liquidations approach US$850 million over 24 hours.
#BitcoinBreaksAboveMayHighNears$86K
Spot buying cleared resistance at US$82,000 and forced more than US$230 million in Bitcoin shorts to liquidate as secondary stop-loss orders pushed the price through US$84,000.
#21SharesLaunchesEuropesFirstZcashETP
Spot Bitcoin exchange-traded funds (ETFs) finished the week with US$6.2 million in net inflows after reclaiming US$592 million across Thursday and Friday to erase earlier weekly losses.
Blockchain Investing Crypto Market Update: Bitcoin Surpasses US$86,000, Liquidates US$846 Million i
Elsewhere in the crypto landscape, Strategy is nearing an all-time Bitcoin holding record.
Michael Förtsch / Unsplash
Get the latest insights on Bitcoin, Ether and altcoins, along with a round-up of key cryptocurrency market news.
#AIStocksWhatNext
Here's a quick recap of the crypto landscape for Monday (September 21) as of 11:00 p.m. UTC.
Bitcoin price updateBitcoin price chartEther and altcoin price updateToday's crypto news to know
#DogecoinRises15%
Bitcoin price update
Bitcoin (BTC) was priced at US$86,603.13, trading 6.9 percent higher over the past 24 hours.
#BNBMarketCapPassesBNYMellon
The asset absorbed a Federal Reserve interest rate hike, a Bank of Japan rate hike to a 31 year high, and the Senate's rejection of the Clarity Act without trading meaningfully below US$75,000. Easing macroeconomic pressures propelled the rally as Brent crude hit a half-month low and US 10 year Treasury yields fell to 4.93 percent. Short sellers have suffered massive losses as crypto short liquidations approach US$850 million over 24 hours.
#BitcoinBreaksAboveMayHighNears$86K
Spot buying cleared resistance at US$82,000 and forced more than US$230 million in Bitcoin shorts to liquidate as secondary stop-loss orders pushed the price through US$84,000.
#21SharesLaunchesEuropesFirstZcashETP
Spot Bitcoin exchange-traded funds (ETFs) finished the week with US$6.2 million in net inflows after reclaiming US$592 million across Thursday and Friday to erase earlier weekly losses.
Michael Förtsch / Unsplash
Get the latest insights on Bitcoin, Ether and altcoins, along with a round-up of key cryptocurrency market news.
#AIStocksWhatNext
Here's a quick recap of the crypto landscape for Monday (September 21) as of 11:00 p.m. UTC.
Bitcoin price updateBitcoin price chartEther and altcoin price updateToday's crypto news to know
#DogecoinRises15%
Bitcoin price update
Bitcoin (BTC) was priced at US$86,603.13, trading 6.9 percent higher over the past 24 hours.
#BNBMarketCapPassesBNYMellon
The asset absorbed a Federal Reserve interest rate hike, a Bank of Japan rate hike to a 31 year high, and the Senate's rejection of the Clarity Act without trading meaningfully below US$75,000. Easing macroeconomic pressures propelled the rally as Brent crude hit a half-month low and US 10 year Treasury yields fell to 4.93 percent. Short sellers have suffered massive losses as crypto short liquidations approach US$850 million over 24 hours.
#BitcoinBreaksAboveMayHighNears$86K
Spot buying cleared resistance at US$82,000 and forced more than US$230 million in Bitcoin shorts to liquidate as secondary stop-loss orders pushed the price through US$84,000.
#21SharesLaunchesEuropesFirstZcashETP
Spot Bitcoin exchange-traded funds (ETFs) finished the week with US$6.2 million in net inflows after reclaiming US$592 million across Thursday and Friday to erase earlier weekly losses.
71

·
--
$BTC short overview — 23 Sep 2026
BTC: ~$86,500 / ₹82.7 lakh 24h: about +1.2% 7 days: about +14% 24h range: ~$85,150–$87,265.
Key levels:
🟢 Support: $85K–$86K 🟡 Resistance: $87.3K–$88K 🔴 Below $85K: watch $82K–$83K
#AIStocksWhatNext #AIStocksWhatNext #BitwiseNEARStakingETPAssetsTop$100M #BitcoinBreaksAboveMayHighNears$86K #BNBMarketCapPassesBNYMellon
$BTC short overview — 23 Sep 2026
BTC: ~$86,500 / ₹82.7 lakh 24h: about +1.2% 7 days: about +14% 24h range: ~$85,150–$87,265.
Key levels:
🟢 Support: $85K–$86K 🟡 Resistance: $87.3K–$88K 🔴 Below $85K: watch $82K–$83K
#AIStocksWhatNext #AIStocksWhatNext #BitwiseNEARStakingETPAssetsTop$100M #BitcoinBreaksAboveMayHighNears$86K #BNBMarketCapPassesBNYMellon
BTC: ~$86,500 / ₹82.7 lakh 24h: about +1.2% 7 days: about +14% 24h range: ~$85,150–$87,265.
Key levels:
🟢 Support: $85K–$86K 🟡 Resistance: $87.3K–$88K 🔴 Below $85K: watch $82K–$83K
#AIStocksWhatNext #AIStocksWhatNext #BitwiseNEARStakingETPAssetsTop$100M #BitcoinBreaksAboveMayHighNears$86K #BNBMarketCapPassesBNYMellon
85

·
--
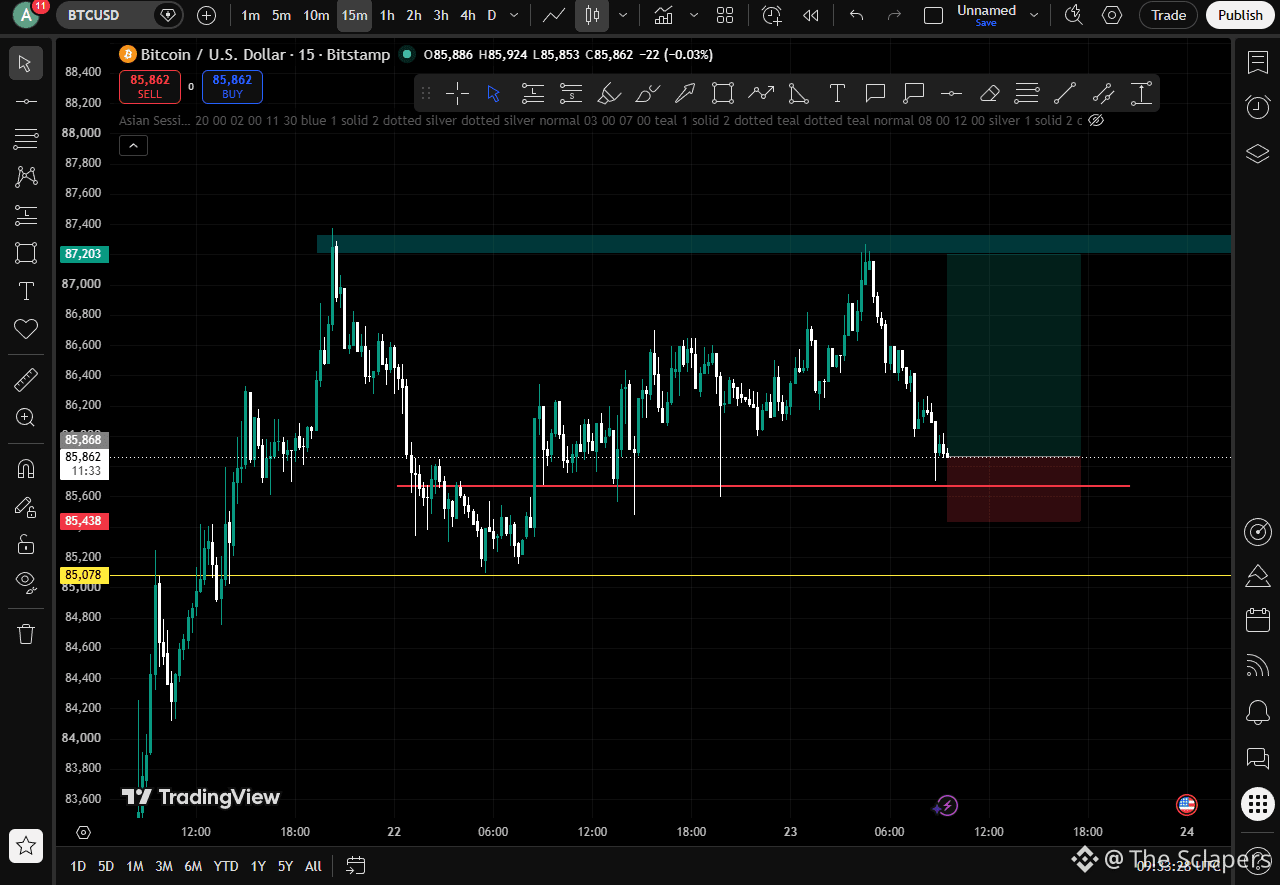
$BTC wants to fly again , this time we also go with it.
Takes long now :
Tp 1 ; 86,595$
Tp 2 ; 87,223$
Close where you wanted , SL must be at ; 85,438$
See you with the result ,
Never stop taking Trades........
{spot}(BTCUSDT)
#BitcoinBreaksAboveMayHighNears$86K
$BTC wants to fly again , this time we also go with it.
Takes long now :
Tp 1 ; 86,595$
Tp 2 ; 87,223$
Close where you wanted , SL must be at ; 85,438$
See you with the result ,
Never stop taking Trades........
#BitcoinBreaksAboveMayHighNears$86K
Takes long now :
Tp 1 ; 86,595$
Tp 2 ; 87,223$
Close where you wanted , SL must be at ; 85,438$
See you with the result ,
Never stop taking Trades........
#BitcoinBreaksAboveMayHighNears$86K
1
107

·
--
Bullish
Is this the beginning of the bull run 2026?
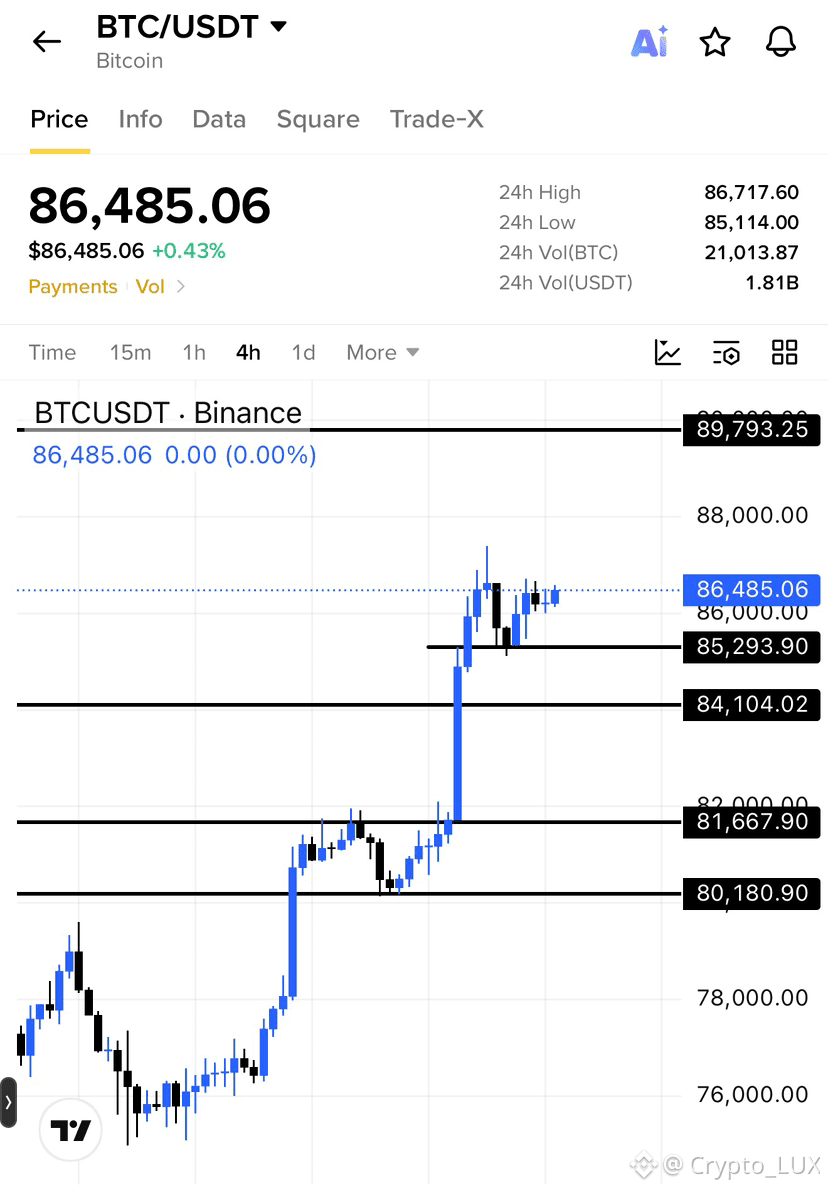
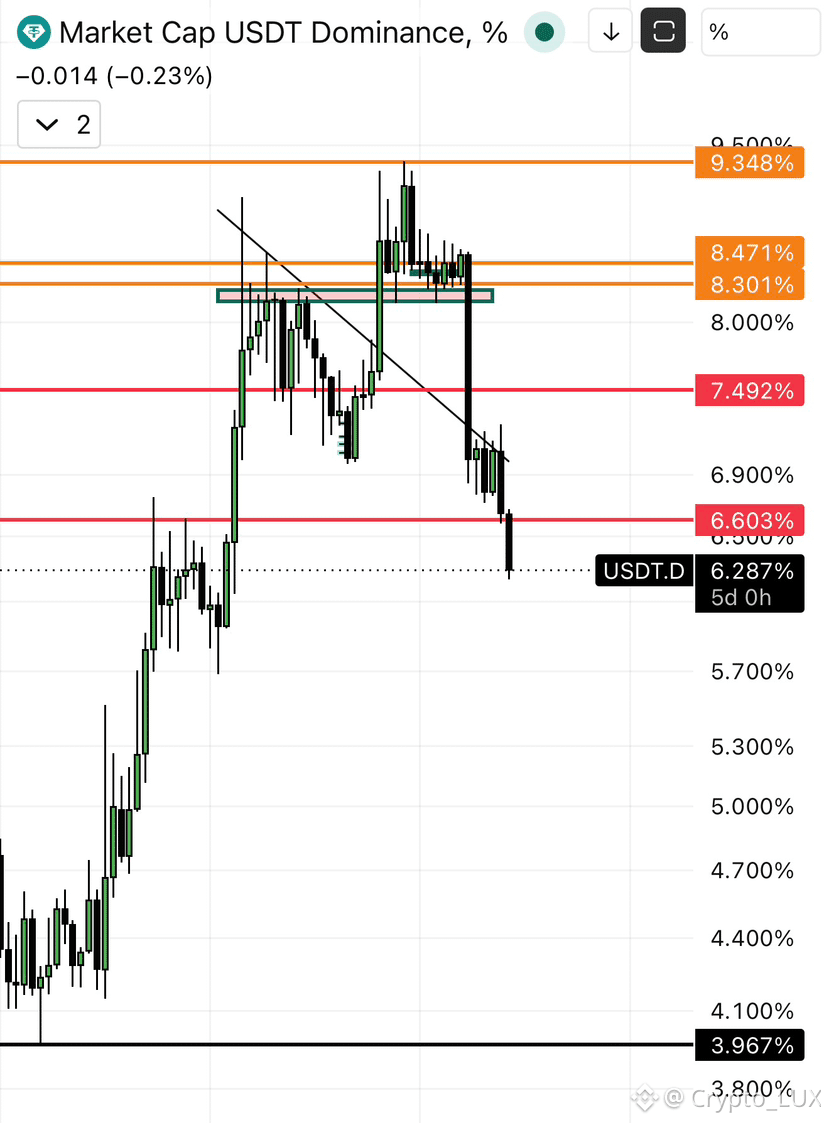
$BTC trading at $86,000 what’s the next potential move? Targets and key levels, let me explain with the confluence of USDT dominance!
Total crypto market cap approaching 3 TRILLION..!
So yes, USDT dominance has broken a major zone, and now we could be looking at a new all-time high for crypto. But there’s one confirmation I want to see, and that’s what I’m looking for: a retracement of this candle, confirmation of the structure shift on the weekly timeframe, and a rebound from the $82,750–$83,300 zone to validate the surge toward a new high at $150,000 for BTC.
But the question remains: what level do we get before that retracement?
What I’m watching right now is the rejection at $86,300, which is holding that zone. BTC traded around this area for almost the whole day. Another solid level to watch is $89,959 the MA 100 resistance after the MA 50. Which is surely gonna tested after 86300$…..
So keep your eyes on it. The retracement could be fast and hard.
Today, we got a number of setups involving $TUT , Marscoin, OP, ENA, and many other pairs. Some stop-losses weren’t hit or may have been counted as one. The rest had solid moves, and most are still in play, like the recent OP and Marscoin scalps, which did great.
The SOL long is still in play, $ADA is approaching the first TP at $0.26, momentum is great, and so are we!
Let me know, guys, how do you like these setups? I really want your feedback on the performance!
See you soon with fresh setups.
Lock your profits on the running trades, trail your stop-losses, and for the rest, I’m here to guide you.
Your @RiseHigh_Community !
{future}(BTCUSDT)
{future}(TUTUSDT)
{future}(ADAUSDT)
#AIStocksWhatNext #BitcoinBreaksAboveMayHighNears$86K #CryptoMarketCapReclaims$3Trillion
Is this the beginning of the bull run 2026?
$BTC trading at $86,000 what’s the next potential move? Targets and key levels, let me explain with the confluence of USDT dominance!
Total crypto market cap approaching 3 TRILLION..!
So yes, USDT dominance has broken a major zone, and now we could be looking at a new all-time high for crypto. But there’s one confirmation I want to see, and that’s what I’m looking for: a retracement of this candle, confirmation of the structure shift on the weekly timeframe, and a rebound from the $82,750–$83,300 zone to validate the surge toward a new high at $150,000 for BTC.
But the question remains: what level do we get before that retracement?
What I’m watching right now is the rejection at $86,300, which is holding that zone. BTC traded around this area for almost the whole day. Another solid level to watch is $89,959 the MA 100 resistance after the MA 50. Which is surely gonna tested after 86300$…..
So keep your eyes on it. The retracement could be fast and hard.
Today, we got a number of setups involving $TUT , Marscoin, OP, ENA, and many other pairs. Some stop-losses weren’t hit or may have been counted as one. The rest had solid moves, and most are still in play, like the recent OP and Marscoin scalps, which did great.
The SOL long is still in play, $ADA is approaching the first TP at $0.26, momentum is great, and so are we!
Let me know, guys, how do you like these setups? I really want your feedback on the performance!
See you soon with fresh setups.
Lock your profits on the running trades, trail your stop-losses, and for the rest, I’m here to guide you.
Your @Crypto_LUX !
#AIStocksWhatNext #BitcoinBreaksAboveMayHighNears$86K #CryptoMarketCapReclaims$3Trillion
$BTC trading at $86,000 what’s the next potential move? Targets and key levels, let me explain with the confluence of USDT dominance!
Total crypto market cap approaching 3 TRILLION..!
So yes, USDT dominance has broken a major zone, and now we could be looking at a new all-time high for crypto. But there’s one confirmation I want to see, and that’s what I’m looking for: a retracement of this candle, confirmation of the structure shift on the weekly timeframe, and a rebound from the $82,750–$83,300 zone to validate the surge toward a new high at $150,000 for BTC.
But the question remains: what level do we get before that retracement?
What I’m watching right now is the rejection at $86,300, which is holding that zone. BTC traded around this area for almost the whole day. Another solid level to watch is $89,959 the MA 100 resistance after the MA 50. Which is surely gonna tested after 86300$…..
So keep your eyes on it. The retracement could be fast and hard.
Today, we got a number of setups involving $TUT , Marscoin, OP, ENA, and many other pairs. Some stop-losses weren’t hit or may have been counted as one. The rest had solid moves, and most are still in play, like the recent OP and Marscoin scalps, which did great.
The SOL long is still in play, $ADA is approaching the first TP at $0.26, momentum is great, and so are we!
Let me know, guys, how do you like these setups? I really want your feedback on the performance!
See you soon with fresh setups.
Lock your profits on the running trades, trail your stop-losses, and for the rest, I’m here to guide you.
Your @Crypto_LUX !
#AIStocksWhatNext #BitcoinBreaksAboveMayHighNears$86K #CryptoMarketCapReclaims$3Trillion
AngelOfCrypto_-:
nice
13
42
32.6k

·
--
🚨₿ #BITCOIN JUST SMASHED THROUGH A MAJOR RESISTANCE! 🔥
$BTC BREAKS ABOVE ITS MAY HIGH — NEAR $86K! 👀📈
Bitcoin has pushed above its previous May peak of $82,293, briefly reaching around $85.3K on September 21 before moving above $86K.
🔥 WHAT’S POWERING THE MOVE?
• 💰 Strong U.S. spot Bitcoin ETF inflows
• 📈 Short positions getting squeezed
• 🌎 Improving broader market sentiment
• ⚡ $BTC breaking a major technical resistance zone
U.S. spot Bitcoin ETFs recorded nearly $1 billion in net inflows on September 21, adding another major headline to the rally.
Now the big question everyone is watching:
CAN BTC HOLD ABOVE THE MAY HIGH AND KEEP THE MOMENTUM ALIVE? 👀
The $86K area has become a key level to watch as traders assess whether the breakout can hold.
₿ BITCOIN IS MOVING — AND THE MARKET IS WATCHING EVERY CANDLE! 🔥
#Bitcoin #BTC #Crypto #BitcoinNews #CryptoMarket #BTCUSD #MIFICrypto #BinanceSquare
#BitcoinBreaksAboveMayHighNears$86K
{spot}(XRPUSDT)
{spot}(ETHUSDT)
{spot}(BTCUSDT)
🚨₿ #BITCOIN JUST SMASHED THROUGH A MAJOR RESISTANCE! 🔥
$BTC BREAKS ABOVE ITS MAY HIGH — NEAR $86K! 👀📈
Bitcoin has pushed above its previous May peak of $82,293, briefly reaching around $85.3K on September 21 before moving above $86K.
🔥 WHAT’S POWERING THE MOVE?
• 💰 Strong U.S. spot Bitcoin ETF inflows
• 📈 Short positions getting squeezed
• 🌎 Improving broader market sentiment
• ⚡ $BTC breaking a major technical resistance zone
U.S. spot Bitcoin ETFs recorded nearly $1 billion in net inflows on September 21, adding another major headline to the rally.
Now the big question everyone is watching:
CAN BTC HOLD ABOVE THE MAY HIGH AND KEEP THE MOMENTUM ALIVE? 👀
The $86K area has become a key level to watch as traders assess whether the breakout can hold.
₿ BITCOIN IS MOVING — AND THE MARKET IS WATCHING EVERY CANDLE! 🔥
#Bitcoin #BTC #Crypto #BitcoinNews #CryptoMarket #BTCUSD #MIFICrypto #BinanceSquare
#BitcoinBreaksAboveMayHighNears$86K
$BTC BREAKS ABOVE ITS MAY HIGH — NEAR $86K! 👀📈
Bitcoin has pushed above its previous May peak of $82,293, briefly reaching around $85.3K on September 21 before moving above $86K.
🔥 WHAT’S POWERING THE MOVE?
• 💰 Strong U.S. spot Bitcoin ETF inflows
• 📈 Short positions getting squeezed
• 🌎 Improving broader market sentiment
• ⚡ $BTC breaking a major technical resistance zone
U.S. spot Bitcoin ETFs recorded nearly $1 billion in net inflows on September 21, adding another major headline to the rally.
Now the big question everyone is watching:
CAN BTC HOLD ABOVE THE MAY HIGH AND KEEP THE MOMENTUM ALIVE? 👀
The $86K area has become a key level to watch as traders assess whether the breakout can hold.
₿ BITCOIN IS MOVING — AND THE MARKET IS WATCHING EVERY CANDLE! 🔥
#Bitcoin #BTC #Crypto #BitcoinNews #CryptoMarket #BTCUSD #MIFICrypto #BinanceSquare
#BitcoinBreaksAboveMayHighNears$86K

1
59

·
--
Bullish
🚨 #BitcoinBreaksAboveMayHighNears$86K — $BTC just cleared a level that rejected the market for months.
Bitcoin is trading near $86K after convincingly breaking above its May high, while the broader risk backdrop has improved as oil prices eased and equities strengthened.
The next trigger is simple:
Hold $85K–$86K → break $87K → $90K comes into focus.
But leverage is building fast: more than $2B in futures exposure was added during the breakout, so the next leg needs real spot demand — not just short covering.
BTC finally broke the May ceiling. Now the market gets to find out whether this is a real breakout… or another leveraged trap. 👀
{future}(BTCUSDT)
{future}(ZECUSDT)
{future}(SUIUSDT)
$ZEC $SUI #AIStocksWhatNext #BitwiseNEARStakingETPAssetsTop$100M #DogecoinRises15% #$14BBitcoinOptionsExpireFriday
🚨 #BitcoinBreaksAboveMayHighNears$86K — $BTC just cleared a level that rejected the market for months.
Bitcoin is trading near $86K after convincingly breaking above its May high, while the broader risk backdrop has improved as oil prices eased and equities strengthened.
The next trigger is simple:
Hold $85K–$86K → break $87K → $90K comes into focus.
But leverage is building fast: more than $2B in futures exposure was added during the breakout, so the next leg needs real spot demand — not just short covering.
BTC finally broke the May ceiling. Now the market gets to find out whether this is a real breakout… or another leveraged trap. 👀
$ZEC $SUI #AIStocksWhatNext #BitwiseNEARStakingETPAssetsTop$100M #DogecoinRises15% #$14BBitcoinOptionsExpireFriday
Bitcoin is trading near $86K after convincingly breaking above its May high, while the broader risk backdrop has improved as oil prices eased and equities strengthened.
The next trigger is simple:
Hold $85K–$86K → break $87K → $90K comes into focus.
But leverage is building fast: more than $2B in futures exposure was added during the breakout, so the next leg needs real spot demand — not just short covering.
BTC finally broke the May ceiling. Now the market gets to find out whether this is a real breakout… or another leveraged trap. 👀
$ZEC $SUI #AIStocksWhatNext #BitwiseNEARStakingETPAssetsTop$100M #DogecoinRises15% #$14BBitcoinOptionsExpireFriday

112

·
--
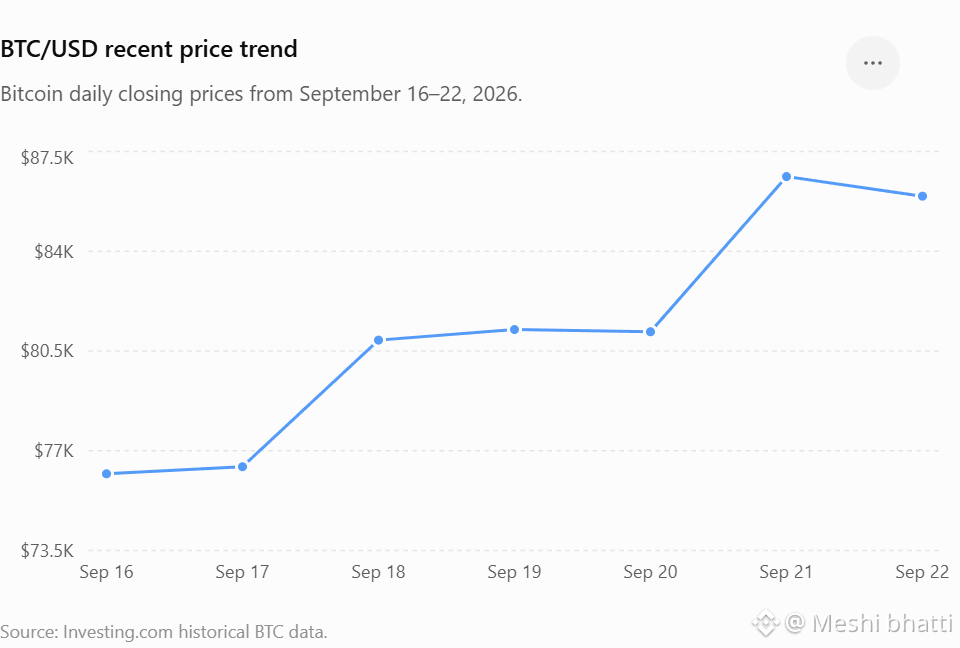
$BTC is trading around $86K after a strong rally from the ~$76K area in mid-September. Recent data shows a sharp move higher, with $BTC reaching around $87.3K before pulling back.
Resistance: ~$87K–$90K Support: ~$84K, then ~$81K Trend: Short-term momentum remains positive, but $BTC is near an important resistance zone. A sustained break above ~$87K could keep upside momentum active; losing ~$84K could bring a deeper pullback toward ~$81K.
#AIStocksWhatNext
#BitcoinBreaksAboveMayHighNears$86K
#$14BBitcoinOptionsExpireFriday
{spot}(BTCUSDT)
$BTC is trading around $86K after a strong rally from the ~$76K area in mid-September. Recent data shows a sharp move higher, with $BTC reaching around $87.3K before pulling back.
Resistance: ~$87K–$90K Support: ~$84K, then ~$81K Trend: Short-term momentum remains positive, but $BTC is near an important resistance zone. A sustained break above ~$87K could keep upside momentum active; losing ~$84K could bring a deeper pullback toward ~$81K.
#AIStocksWhatNext
#BitcoinBreaksAboveMayHighNears$86K
#$14BBitcoinOptionsExpireFriday
Resistance: ~$87K–$90K Support: ~$84K, then ~$81K Trend: Short-term momentum remains positive, but $BTC is near an important resistance zone. A sustained break above ~$87K could keep upside momentum active; losing ~$84K could bring a deeper pullback toward ~$81K.
#AIStocksWhatNext
#BitcoinBreaksAboveMayHighNears$86K
#$14BBitcoinOptionsExpireFriday
49

·
--
Bullish
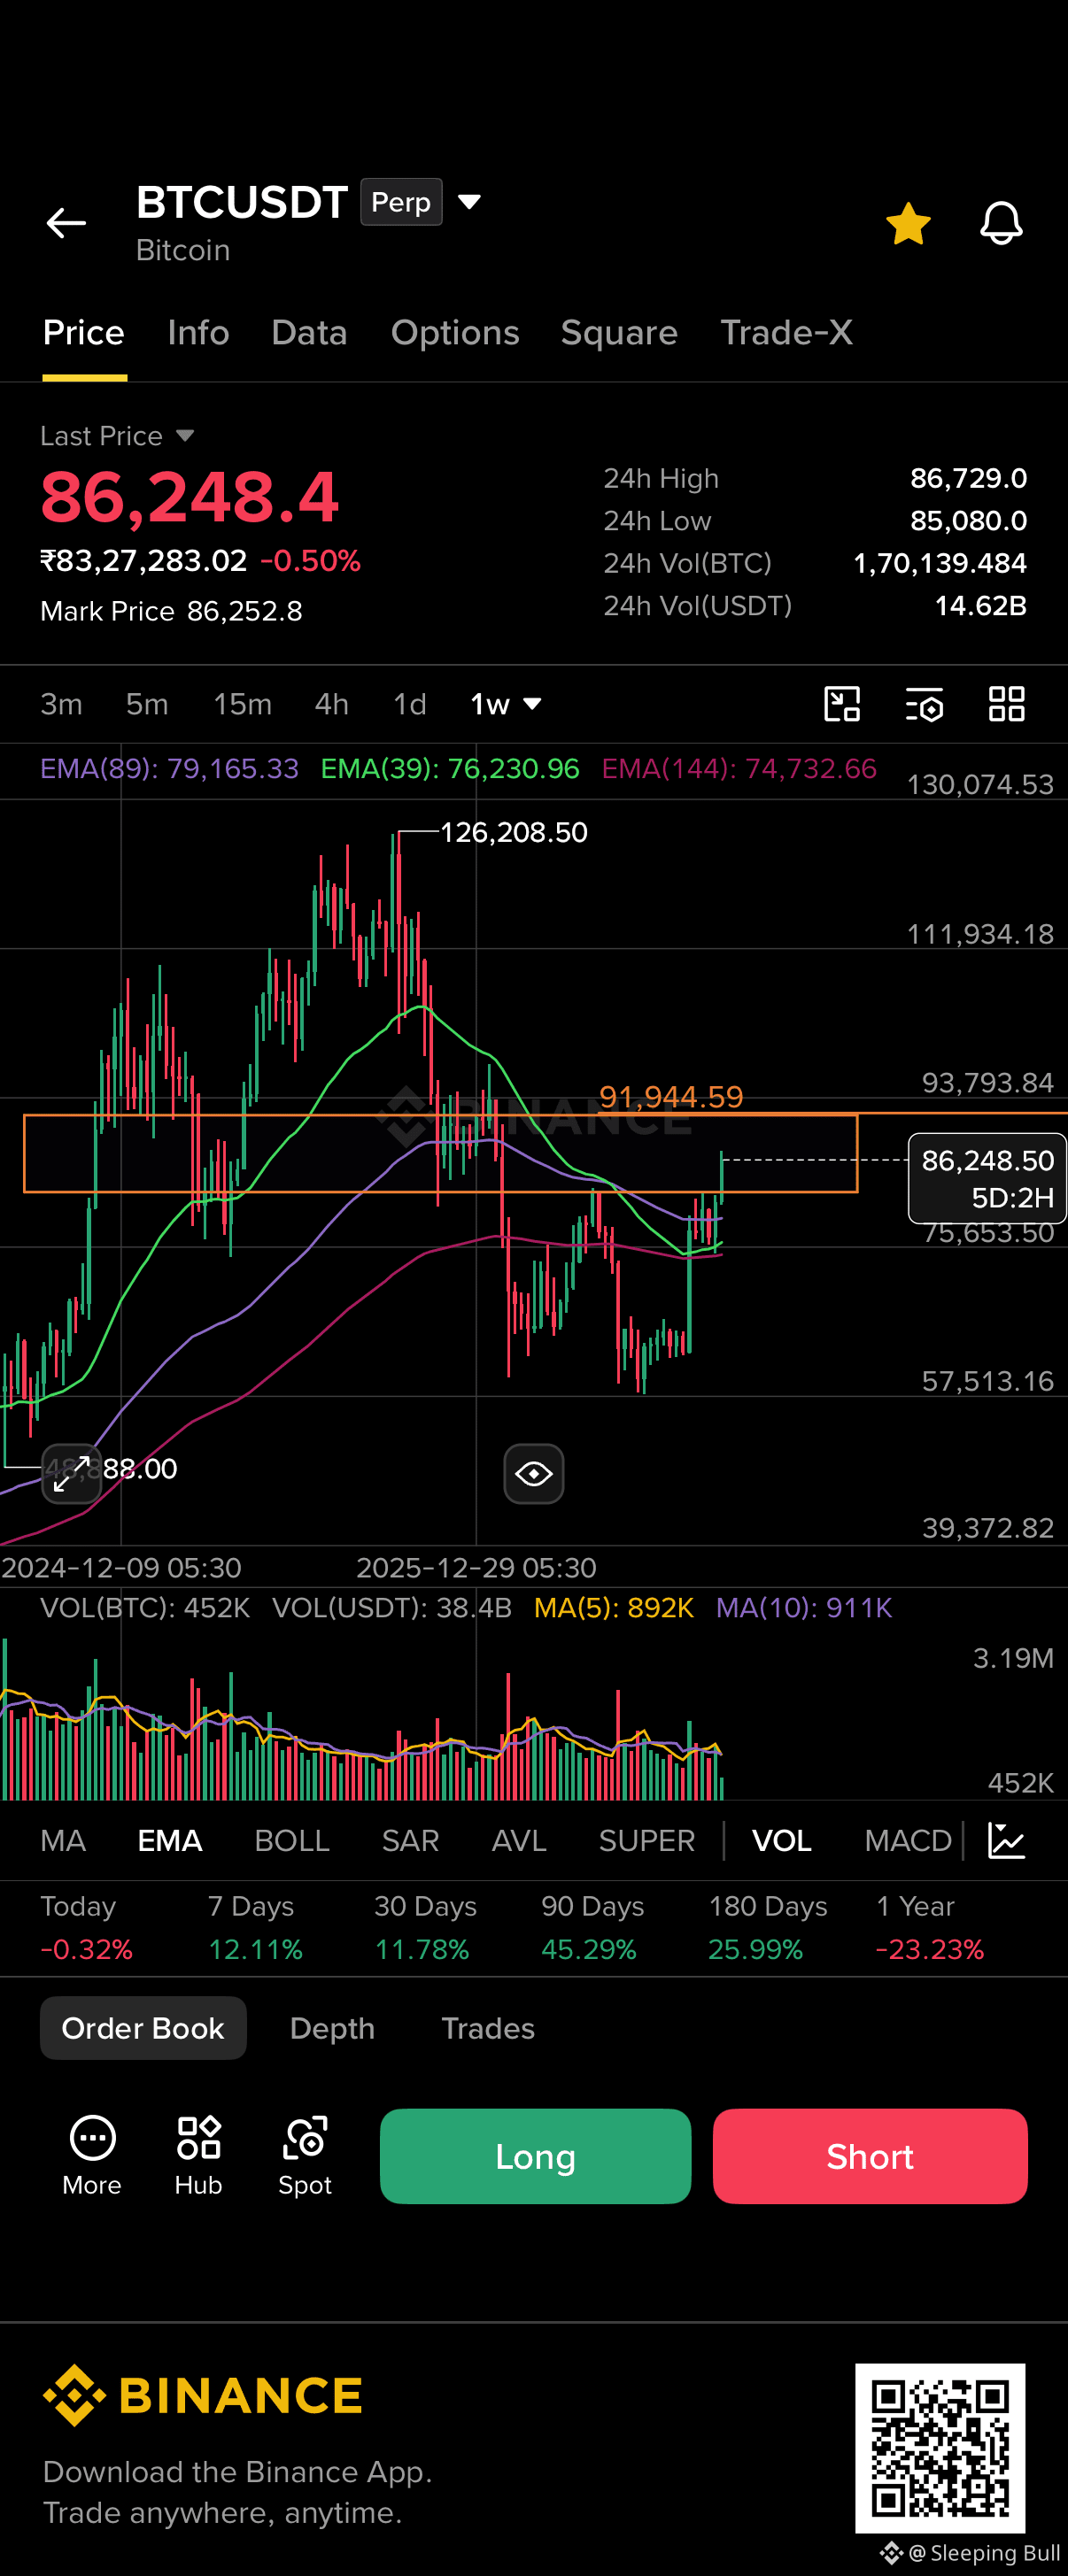
$BTC A push towards 91000$ will be agressive for sure then we will expect a decent pullback to the 86-87 level which make sense In order to break the trend and push the momentum upward.
Weekly timeframe is bullish and A clear breakout spotted which is attracting the big players to enter.
DYOR — If price holds and rise then yes bull run 2026 starts 🚀💸
#StrategyAdds950Bitcoin #BitcoinBreaksAboveMayHighNears$86K
$BTC A push towards 91000$ will be agressive for sure then we will expect a decent pullback to the 86-87 level which make sense In order to break the trend and push the momentum upward.
Weekly timeframe is bullish and A clear breakout spotted which is attracting the big players to enter.
DYOR — If price holds and rise then yes bull run 2026 starts 🚀💸
#StrategyAdds950Bitcoin #BitcoinBreaksAboveMayHighNears$86K
Weekly timeframe is bullish and A clear breakout spotted which is attracting the big players to enter.
DYOR — If price holds and rise then yes bull run 2026 starts 🚀💸
#StrategyAdds950Bitcoin #BitcoinBreaksAboveMayHighNears$86K
Sourced by user sharing on Binance
68

·
--
Bearish
$BTC
{future}(BTCUSDT)
🚨#Bitcoin has climbed above $86,000 and briefly touched $87,000 as analysts linked the breakout to falling oil prices, lower Treasury yields, a short squeeze and returning U.S.🇺🇸 spot ETF demand.#BitcoinBreaksAboveMayHighNears$86K
$BTC
🚨#Bitcoin has climbed above $86,000 and briefly touched $87,000 as analysts linked the breakout to falling oil prices, lower Treasury yields, a short squeeze and returning U.S.🇺🇸 spot ETF demand.#BitcoinBreaksAboveMayHighNears$86K
🚨#Bitcoin has climbed above $86,000 and briefly touched $87,000 as analysts linked the breakout to falling oil prices, lower Treasury yields, a short squeeze and returning U.S.🇺🇸 spot ETF demand.#BitcoinBreaksAboveMayHighNears$86K

70

$BTC #BitcoinBreaksAboveMayHighNears$86K
{future}(BTCUSDT)
BTC breaks above the May high, nears $86,000
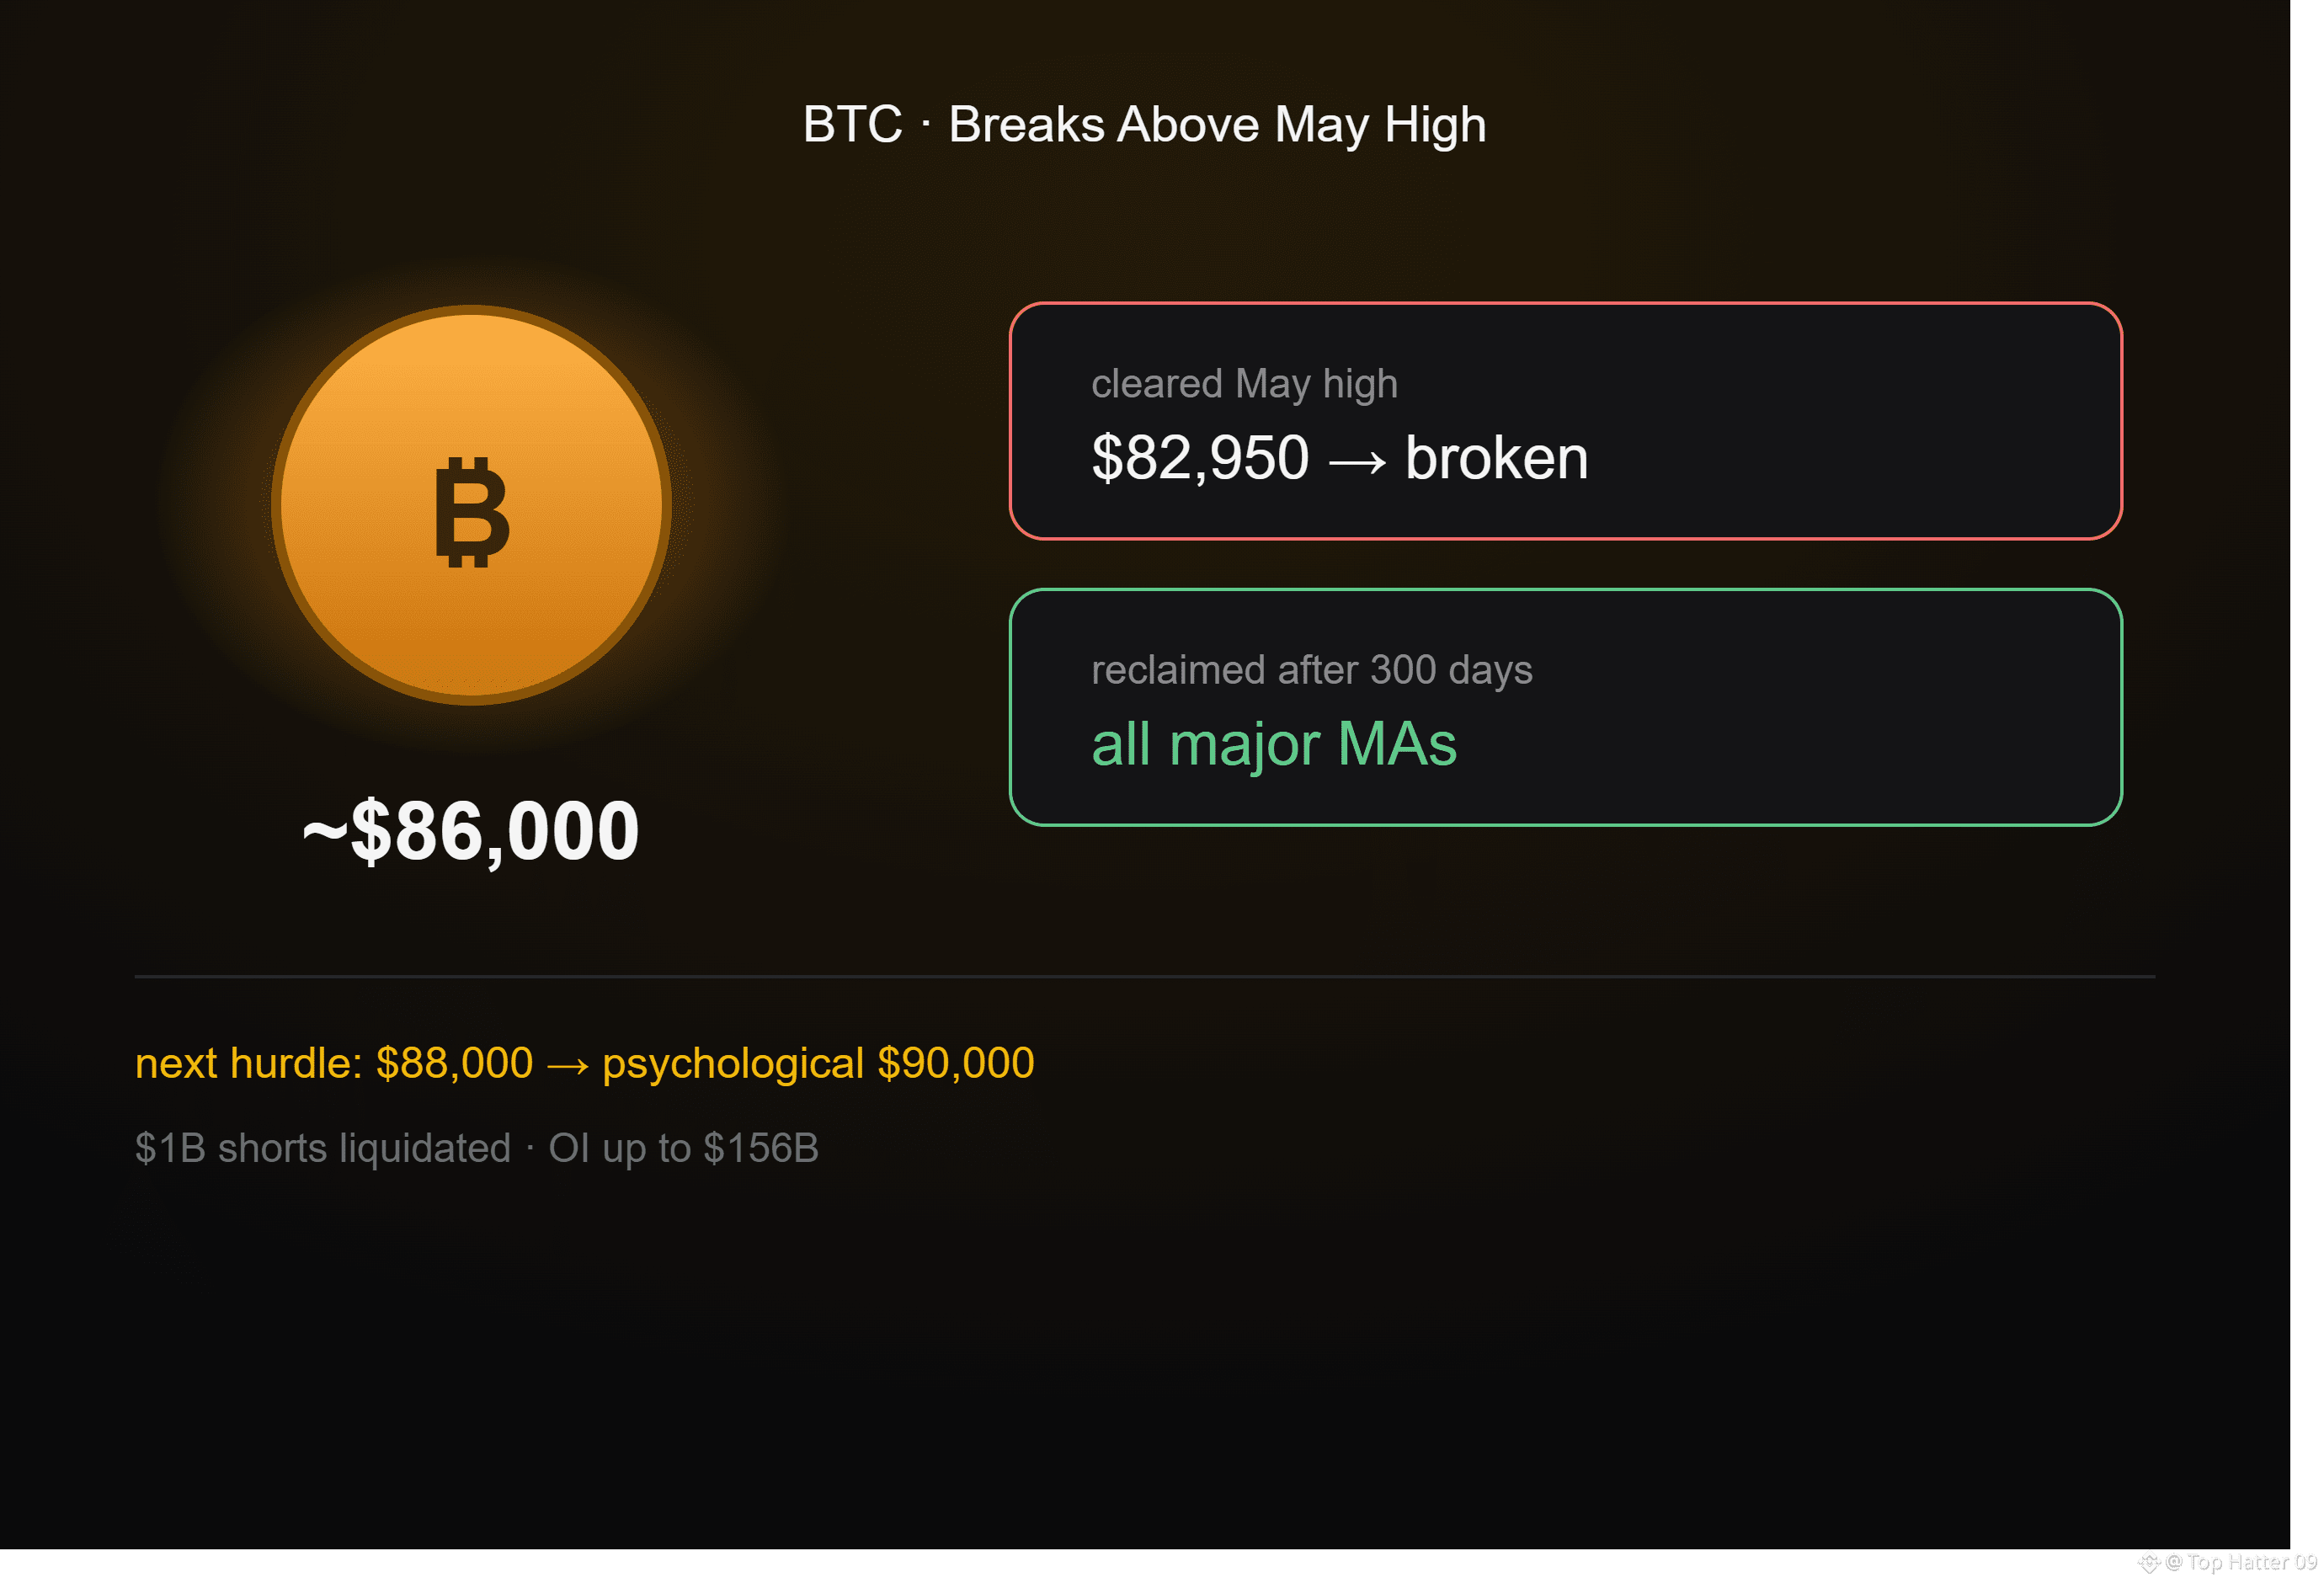
Bitcoin has decisively cleared its May local high of $82,950 — a level that had capped every rally attempt since — and pushed toward $86,000, touching an intraday high near $86,602, its first visit there since late January (a 33-week high).
Structural significance: BTC has now reclaimed all of its major long-term moving averages (including the 200-day) after spending roughly 300 days below them — a meaningful technical shift, not just a bounce.
The move's fuel:
Nearly $1 billion in short liquidations over 24 hours Aggregate crypto open interest rose to ~$156 billion (+7.6%), showing traders re-leveraging quickly after the squeeze Four of the top five cryptocurrencies are now trading above every level seen in the past three months — this rally's gains are broad, not just BTC-driven
What's next: Analysts widely flag $88,000 as the first hurdle to clear, with $90,000 as the bigger psychological target. Beyond that, some are eyeing $93,000+ zones based on breakout pattern analysis. The key caveat: sustained spot demand (not just short-covering) will determine whether this becomes a durable trend or fades once the squeeze exhausts itself.
$BTC #Bitcoin #BTCPriceAlert #BitcoinBreaksAboveMayHighNears$86K
$BTC #BitcoinBreaksAboveMayHighNears$86K
BTC breaks above the May high, nears $86,000
Bitcoin has decisively cleared its May local high of $82,950 — a level that had capped every rally attempt since — and pushed toward $86,000, touching an intraday high near $86,602, its first visit there since late January (a 33-week high).
Structural significance: BTC has now reclaimed all of its major long-term moving averages (including the 200-day) after spending roughly 300 days below them — a meaningful technical shift, not just a bounce.
The move's fuel:
Nearly $1 billion in short liquidations over 24 hours Aggregate crypto open interest rose to ~$156 billion (+7.6%), showing traders re-leveraging quickly after the squeeze Four of the top five cryptocurrencies are now trading above every level seen in the past three months — this rally's gains are broad, not just BTC-driven
What's next: Analysts widely flag $88,000 as the first hurdle to clear, with $90,000 as the bigger psychological target. Beyond that, some are eyeing $93,000+ zones based on breakout pattern analysis. The key caveat: sustained spot demand (not just short-covering) will determine whether this becomes a durable trend or fades once the squeeze exhausts itself.
$BTC #Bitcoin #BTCPriceAlert #BitcoinBreaksAboveMayHighNears$86K
BTC breaks above the May high, nears $86,000
Bitcoin has decisively cleared its May local high of $82,950 — a level that had capped every rally attempt since — and pushed toward $86,000, touching an intraday high near $86,602, its first visit there since late January (a 33-week high).
Structural significance: BTC has now reclaimed all of its major long-term moving averages (including the 200-day) after spending roughly 300 days below them — a meaningful technical shift, not just a bounce.
The move's fuel:
Nearly $1 billion in short liquidations over 24 hours Aggregate crypto open interest rose to ~$156 billion (+7.6%), showing traders re-leveraging quickly after the squeeze Four of the top five cryptocurrencies are now trading above every level seen in the past three months — this rally's gains are broad, not just BTC-driven
What's next: Analysts widely flag $88,000 as the first hurdle to clear, with $90,000 as the bigger psychological target. Beyond that, some are eyeing $93,000+ zones based on breakout pattern analysis. The key caveat: sustained spot demand (not just short-covering) will determine whether this becomes a durable trend or fades once the squeeze exhausts itself.
$BTC #Bitcoin #BTCPriceAlert #BitcoinBreaksAboveMayHighNears$86K
124

·
--
Article
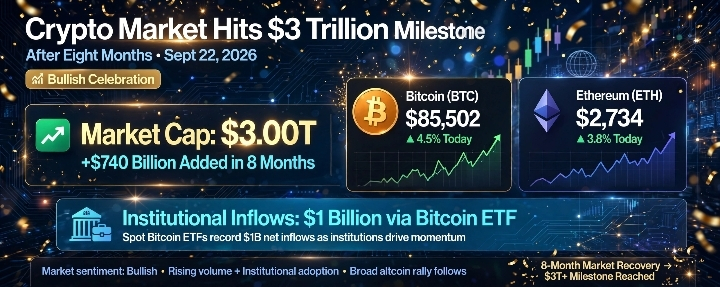
Crypto Market Hits $3 Trillion Milestone After Eight MonthsOn September 22, the crypto market made a big comeback and crossed the $3 Trillion market cap for the first time in eight months. The market added over $740 billion since late August, which shows how fast money is coming back. Bitcoin led the rally by climbing to around $85,502 with a 4.5% daily gain. Ethereum also followed and hit $2,734, up 2.37% on the day. This strong move proves that buyers are back in control after months of fear and sideways trading. The milestone is important because $3 trillion is a psychological level that brings new confidence to investors.
The main reason behind this rally is institutional money. In just one session, nearly $1 billion flowed into U.S. spot Bitcoin ETFs, which is one of the biggest inflows in recent months. Big institutions are buying Bitcoin through ETFs instead of selling. Another strong signal is that Bitcoin broke above its 50-week moving average, a key indicator that traders use to confirm if the bear market is over. When Bitcoin stays above this average, it usually means the long-term trend has turned bullish. Altcoins also joined the party, with Dogecoin jumping 11% and other major coins showing strong gains. This shows the rally is not just Bitcoin alone, but the whole market is moving.
Now traders are watching the next resistance between $87,000 and $88,000. If Bitcoin breaks this zone, the next leg up could start quickly. However, experts are also warning about high leverage in futures markets, which can cause sudden volatility and sharp pullbacks. So while the mood is bullish, some caution is needed. Still, after eight months of waiting, the return to $3 trillion market cap is a clear sign that the crypto winter is ending and a new bull phase is starting.
$BTC
#AIStocksWhatNext
#DogecoinRises15%
#BitcoinBreaksAboveMayHighNears$86K $ETH $BNB
Crypto Market Hits $3 Trillion Milestone After Eight Months
On September 22, the crypto market made a big comeback and crossed the $3 Trillion market cap for the first time in eight months. The market added over $740 billion since late August, which shows how fast money is coming back. Bitcoin led the rally by climbing to around $85,502 with a 4.5% daily gain. Ethereum also followed and hit $2,734, up 2.37% on the day. This strong move proves that buyers are back in control after months of fear and sideways trading. The milestone is important because $3 trillion is a psychological level that brings new confidence to investors.
The main reason behind this rally is institutional money. In just one session, nearly $1 billion flowed into U.S. spot Bitcoin ETFs, which is one of the biggest inflows in recent months. Big institutions are buying Bitcoin through ETFs instead of selling. Another strong signal is that Bitcoin broke above its 50-week moving average, a key indicator that traders use to confirm if the bear market is over. When Bitcoin stays above this average, it usually means the long-term trend has turned bullish. Altcoins also joined the party, with Dogecoin jumping 11% and other major coins showing strong gains. This shows the rally is not just Bitcoin alone, but the whole market is moving.
Now traders are watching the next resistance between $87,000 and $88,000. If Bitcoin breaks this zone, the next leg up could start quickly. However, experts are also warning about high leverage in futures markets, which can cause sudden volatility and sharp pullbacks. So while the mood is bullish, some caution is needed. Still, after eight months of waiting, the return to $3 trillion market cap is a clear sign that the crypto winter is ending and a new bull phase is starting.
$BTC
#AIStocksWhatNext
#DogecoinRises15%
#BitcoinBreaksAboveMayHighNears$86K $ETH $BNB
The main reason behind this rally is institutional money. In just one session, nearly $1 billion flowed into U.S. spot Bitcoin ETFs, which is one of the biggest inflows in recent months. Big institutions are buying Bitcoin through ETFs instead of selling. Another strong signal is that Bitcoin broke above its 50-week moving average, a key indicator that traders use to confirm if the bear market is over. When Bitcoin stays above this average, it usually means the long-term trend has turned bullish. Altcoins also joined the party, with Dogecoin jumping 11% and other major coins showing strong gains. This shows the rally is not just Bitcoin alone, but the whole market is moving.
Now traders are watching the next resistance between $87,000 and $88,000. If Bitcoin breaks this zone, the next leg up could start quickly. However, experts are also warning about high leverage in futures markets, which can cause sudden volatility and sharp pullbacks. So while the mood is bullish, some caution is needed. Still, after eight months of waiting, the return to $3 trillion market cap is a clear sign that the crypto winter is ending and a new bull phase is starting.
$BTC
#AIStocksWhatNext
#DogecoinRises15%
#BitcoinBreaksAboveMayHighNears$86K $ETH $BNB
1
112

🚀 BTC Market Update: Bulls Reclaim Control Above $86,000!
Bitcoin ($BTC) has staged an impressive recovery, breaking past key resistance to trade around $86,400+. After a brief dip following regulatory headlines earlier in the month, market sentiment has flipped strongly bullish.
📊 Key Technical Highlights:
Immediate Support: $82,000 – $83,000 zone
Next Resistance Targets: $87,500 (2026 Yearly Open) followed by $90,000
Market Sentiment: Deribit options data shows high call-to-put open interest, indicating institutional optimism.
$BTC
#AIStocksWhatNext
#BitcoinBreaksAboveMayHighNears$86K
🚀 BTC Market Update: Bulls Reclaim Control Above $86,000!
Bitcoin ($BTC ) has staged an impressive recovery, breaking past key resistance to trade around $86,400+. After a brief dip following regulatory headlines earlier in the month, market sentiment has flipped strongly bullish.
📊 Key Technical Highlights:
Immediate Support: $82,000 – $83,000 zone
Next Resistance Targets: $87,500 (2026 Yearly Open) followed by $90,000
Market Sentiment: Deribit options data shows high call-to-put open interest, indicating institutional optimism.
$BTC
#AIStocksWhatNext
#BitcoinBreaksAboveMayHighNears$86K
Bitcoin ($BTC ) has staged an impressive recovery, breaking past key resistance to trade around $86,400+. After a brief dip following regulatory headlines earlier in the month, market sentiment has flipped strongly bullish.
📊 Key Technical Highlights:
Immediate Support: $82,000 – $83,000 zone
Next Resistance Targets: $87,500 (2026 Yearly Open) followed by $90,000
Market Sentiment: Deribit options data shows high call-to-put open interest, indicating institutional optimism.
$BTC
#AIStocksWhatNext
#BitcoinBreaksAboveMayHighNears$86K
humkash:
Please Follow me. I Followed you back. Please like my post.
1
1
81


Article
Crypto Market Stages Powerful Comeback: $BTC Breaks $86K, Total Market Cap Reclaims $3 Trillion!September 22, 2026:
---
🚨 Crypto Market Stages Powerful Comeback: $BTC Breaks $86K, Total Market Cap Reclaims $3 Trillion!
📌 The crypto market is officially back in action today, with a broad-based rally signaling a potential regime shift. Here’s your full breakdown of what’s happening right now.
1. $BTC Surges Past $86,000 – 8-Month High
Bitcoin climbed from around $80K** through $84K and $85K, briefly touching **$87,381 before settling near $86,600 — its hig$hest level since late January. The move represents a stunning 13% rally in just four days, lifting BTC above its 50-week moving average for the first time in 45 weeks.
2. Total Crypto Market Cap Reclaims $3 Trillion**
The total crypto market capitalization crossed **$3 trillion on September 22, adding roughly $740 billion in value since late August. This was driven by the U.S. Treasury's decision to expand long-dated bond buybacks, which loosened financial conditions and pushed capital into high-beta assets like crypto.
3. Massive Short Squeeze Accelerates the Move
Over $920 million** in bearish positions were liquidated on September 21 alone, with total crypto liquidations exceeding $1 billion over 24 hours — short bets accounting for roughly $840 million of that. This forced buying mechanically accelerated the rally, with open interest in perpetual futures reaching approximately **$160 billion, the highest since late October 2025.
4. Institutional Demand Returns with Force
U.S. spot Bitcoin ETFs drew nearly $1 billion** in net inflows on September 21 — their largest single-day haul since October 2025. BlackRock's IBIT led with $381.4 million, followed by Ark's ARKB at $289.1 million and Fidelity's FBTC at **$238.8 million. This marks the first three-day consecutive inflow streak in two weeks.
5. Altcoin Rotation Builds – Glassnode Flips to Altcoin Season
Glassnode's Altcoin Cycle Signal officially flipped from Bitcoin season to altcoin season on September 22, 2026. Unlike August's move where altcoins sat flat while BTC ran alone, this push shows wide participation: Dogecoin led large caps with an 11% gain, XRP added 5.7%, Solana rose 3.6%, and Ether advanced 2.3%. Bitcoin dominance dropped below 60%, signaling capital is rotating down the risk curve.
6. Analyst Outlook: Bear Market Confirmed Over?
Renowned analyst PlanB stated that Bitcoin has confirmed the end of the bear market after reclaiming the 50-week moving average (~$79,000). His next target is the 100-week moving average at approximately $89,000. Other analysts see BTC targeting the $93K–$95K range as part of a fifth-wave rally.
---
📊 What to Watch
· Key Resistance: A sustained break above $87,000** would pull flows back into Bitcoin and potentially trigger a gamma squeeze toward **$95,000.
· Key Support: $84,000 is the critical level — it was the breakout zone and should now hold as the floor if this is a genuine regime change rather than a short squeeze.
· Caution Signal: The Fear & Greed Index has entered Extreme Greed at 78, which historically raises the risk of profit-taking.
· ETF Flow Sustainability: Watch whether ETFs return to sustained inflows and whether altcoins remain strong when BTC's rally slows — both would provide better evidence of a durable recovery.
---
💬 What’s Your Take?
The market is showing all the signs of a major regime shift — BTC above $86K, $3T market cap reclaimed, altcoin season signal triggered, and nearly $1B in ETF inflows. Is this the start of a new bull run, or just a short squeeze before another pullback? Drop your thoughts below! 👇
$BTC $ETH $BNB $XRP #CryptoNews #Bitcoin #AltcoinSeason #BinanceSquare
#BitcoinBreaksAboveMayHighNears$86K #AIStocksWhatNext #CryptoMarketCapReclaims$3Trillion #StrategyAdds950Bitcoin #StrategyAdds950Bitcoin
Crypto Market Stages Powerful Comeback: $BTC Breaks $86K, Total Market Cap Reclaims $3 Trillion!
September 22, 2026:
---
🚨 Crypto Market Stages Powerful Comeback: $BTC Breaks $86K, Total Market Cap Reclaims $3 Trillion!
📌 The crypto market is officially back in action today, with a broad-based rally signaling a potential regime shift. Here’s your full breakdown of what’s happening right now.
1. $BTC Surges Past $86,000 – 8-Month High
Bitcoin climbed from around $80K** through $84K and $85K, briefly touching **$87,381 before settling near $86,600 — its hig$hest level since late January. The move represents a stunning 13% rally in just four days, lifting BTC above its 50-week moving average for the first time in 45 weeks.
2. Total Crypto Market Cap Reclaims $3 Trillion**
The total crypto market capitalization crossed **$3 trillion on September 22, adding roughly $740 billion in value since late August. This was driven by the U.S. Treasury's decision to expand long-dated bond buybacks, which loosened financial conditions and pushed capital into high-beta assets like crypto.
3. Massive Short Squeeze Accelerates the Move
Over $920 million** in bearish positions were liquidated on September 21 alone, with total crypto liquidations exceeding $1 billion over 24 hours — short bets accounting for roughly $840 million of that. This forced buying mechanically accelerated the rally, with open interest in perpetual futures reaching approximately **$160 billion, the highest since late October 2025.
4. Institutional Demand Returns with Force
U.S. spot Bitcoin ETFs drew nearly $1 billion** in net inflows on September 21 — their largest single-day haul since October 2025. BlackRock's IBIT led with $381.4 million, followed by Ark's ARKB at $289.1 million and Fidelity's FBTC at **$238.8 million. This marks the first three-day consecutive inflow streak in two weeks.
5. Altcoin Rotation Builds – Glassnode Flips to Altcoin Season
Glassnode's Altcoin Cycle Signal officially flipped from Bitcoin season to altcoin season on September 22, 2026. Unlike August's move where altcoins sat flat while BTC ran alone, this push shows wide participation: Dogecoin led large caps with an 11% gain, XRP added 5.7%, Solana rose 3.6%, and Ether advanced 2.3%. Bitcoin dominance dropped below 60%, signaling capital is rotating down the risk curve.
6. Analyst Outlook: Bear Market Confirmed Over?
Renowned analyst PlanB stated that Bitcoin has confirmed the end of the bear market after reclaiming the 50-week moving average (~$79,000). His next target is the 100-week moving average at approximately $89,000. Other analysts see BTC targeting the $93K–$95K range as part of a fifth-wave rally.
---
📊 What to Watch
· Key Resistance: A sustained break above $87,000** would pull flows back into Bitcoin and potentially trigger a gamma squeeze toward **$95,000.
· Key Support: $84,000 is the critical level — it was the breakout zone and should now hold as the floor if this is a genuine regime change rather than a short squeeze.
· Caution Signal: The Fear & Greed Index has entered Extreme Greed at 78, which historically raises the risk of profit-taking.
· ETF Flow Sustainability: Watch whether ETFs return to sustained inflows and whether altcoins remain strong when BTC's rally slows — both would provide better evidence of a durable recovery.
---
💬 What’s Your Take?
The market is showing all the signs of a major regime shift — BTC above $86K, $3T market cap reclaimed, altcoin season signal triggered, and nearly $1B in ETF inflows. Is this the start of a new bull run, or just a short squeeze before another pullback? Drop your thoughts below! 👇
$BTC $ETH $BNB $XRP #CryptoNews #Bitcoin #AltcoinSeason #BinanceSquare
#BitcoinBreaksAboveMayHighNears$86K #AIStocksWhatNext #CryptoMarketCapReclaims$3Trillion #StrategyAdds950Bitcoin #StrategyAdds950Bitcoin
---
🚨 Crypto Market Stages Powerful Comeback: $BTC Breaks $86K, Total Market Cap Reclaims $3 Trillion!
📌 The crypto market is officially back in action today, with a broad-based rally signaling a potential regime shift. Here’s your full breakdown of what’s happening right now.
1. $BTC Surges Past $86,000 – 8-Month High
Bitcoin climbed from around $80K** through $84K and $85K, briefly touching **$87,381 before settling near $86,600 — its hig$hest level since late January. The move represents a stunning 13% rally in just four days, lifting BTC above its 50-week moving average for the first time in 45 weeks.
2. Total Crypto Market Cap Reclaims $3 Trillion**
The total crypto market capitalization crossed **$3 trillion on September 22, adding roughly $740 billion in value since late August. This was driven by the U.S. Treasury's decision to expand long-dated bond buybacks, which loosened financial conditions and pushed capital into high-beta assets like crypto.
3. Massive Short Squeeze Accelerates the Move
Over $920 million** in bearish positions were liquidated on September 21 alone, with total crypto liquidations exceeding $1 billion over 24 hours — short bets accounting for roughly $840 million of that. This forced buying mechanically accelerated the rally, with open interest in perpetual futures reaching approximately **$160 billion, the highest since late October 2025.
4. Institutional Demand Returns with Force
U.S. spot Bitcoin ETFs drew nearly $1 billion** in net inflows on September 21 — their largest single-day haul since October 2025. BlackRock's IBIT led with $381.4 million, followed by Ark's ARKB at $289.1 million and Fidelity's FBTC at **$238.8 million. This marks the first three-day consecutive inflow streak in two weeks.
5. Altcoin Rotation Builds – Glassnode Flips to Altcoin Season
Glassnode's Altcoin Cycle Signal officially flipped from Bitcoin season to altcoin season on September 22, 2026. Unlike August's move where altcoins sat flat while BTC ran alone, this push shows wide participation: Dogecoin led large caps with an 11% gain, XRP added 5.7%, Solana rose 3.6%, and Ether advanced 2.3%. Bitcoin dominance dropped below 60%, signaling capital is rotating down the risk curve.
6. Analyst Outlook: Bear Market Confirmed Over?
Renowned analyst PlanB stated that Bitcoin has confirmed the end of the bear market after reclaiming the 50-week moving average (~$79,000). His next target is the 100-week moving average at approximately $89,000. Other analysts see BTC targeting the $93K–$95K range as part of a fifth-wave rally.
---
📊 What to Watch
· Key Resistance: A sustained break above $87,000** would pull flows back into Bitcoin and potentially trigger a gamma squeeze toward **$95,000.
· Key Support: $84,000 is the critical level — it was the breakout zone and should now hold as the floor if this is a genuine regime change rather than a short squeeze.
· Caution Signal: The Fear & Greed Index has entered Extreme Greed at 78, which historically raises the risk of profit-taking.
· ETF Flow Sustainability: Watch whether ETFs return to sustained inflows and whether altcoins remain strong when BTC's rally slows — both would provide better evidence of a durable recovery.
---
💬 What’s Your Take?
The market is showing all the signs of a major regime shift — BTC above $86K, $3T market cap reclaimed, altcoin season signal triggered, and nearly $1B in ETF inflows. Is this the start of a new bull run, or just a short squeeze before another pullback? Drop your thoughts below! 👇
$BTC $ETH $BNB $XRP #CryptoNews #Bitcoin #AltcoinSeason #BinanceSquare
#BitcoinBreaksAboveMayHighNears$86K #AIStocksWhatNext #CryptoMarketCapReclaims$3Trillion #StrategyAdds950Bitcoin #StrategyAdds950Bitcoin
158

·
--

Article
Bitcoin Breaks $86K: Can The Breakout Hold?#BitcoinBreaksAboveMayHighNears$86K
Bitcoin Breaks Above $86K: What Matters After the Breakout?
Bitcoin ($BTC) has broken above $86,000, reaching its highest level since January as the broader crypto market continues to move higher.
But the breakout itself may not be the most important part of the move.
What matters now is whether Bitcoin can actually hold these higher levels once the initial momentum starts to cool.
One of the biggest pieces of the move is the return of capital through U.S. spot Bitcoin ETFs. The ETFs recorded roughly $999 million in net inflows on Monday, bringing total inflows across three consecutive sessions to around $1.59 billion.
That gives the breakout a more interesting backdrop.
Is Spot Demand Supporting the Move?
Bitcoin's move wasn't driven by one factor alone.
Short covering helped accelerate the upside as bearish positions were forced to close, while futures leverage can amplify price movements in both directions. Profit-taking also becomes an important factor after a sharp move higher.
That's why the next few sessions could tell us more than the initial breakout.
If buyers continue showing up after the short-covering activity fades, it would provide stronger evidence that demand is supporting the move rather than price simply being pushed higher by positioning.
On the other hand, if momentum weakens quickly, Bitcoin may need time to consolidate after the breakout.
What Traders Should Watch
Instead of focusing only on the next BTC price target, the bigger signal is how the market behaves around the breakout zone.
Can Bitcoin hold above the level it just reclaimed?
Do spot buyers continue providing demand?
And does ETF inflow strength continue while excessive futures leverage remains under control?
Those factors could determine whether this move develops into a broader trend or simply becomes another sharp rally followed by consolidation.
For now, the breakout has changed the short-term picture.
But the real test starts after the excitement fades.
Is Bitcoin beginning a stronger trend, or does BTC need to consolidate before making its next major move?
Bitcoin Breaks $86K: Can The Breakout Hold?
#BitcoinBreaksAboveMayHighNears$86K
Bitcoin Breaks Above $86K: What Matters After the Breakout?
Bitcoin ($BTC) has broken above $86,000, reaching its highest level since January as the broader crypto market continues to move higher.
But the breakout itself may not be the most important part of the move.
What matters now is whether Bitcoin can actually hold these higher levels once the initial momentum starts to cool.
One of the biggest pieces of the move is the return of capital through U.S. spot Bitcoin ETFs. The ETFs recorded roughly $999 million in net inflows on Monday, bringing total inflows across three consecutive sessions to around $1.59 billion.
That gives the breakout a more interesting backdrop.
Is Spot Demand Supporting the Move?
Bitcoin's move wasn't driven by one factor alone.
Short covering helped accelerate the upside as bearish positions were forced to close, while futures leverage can amplify price movements in both directions. Profit-taking also becomes an important factor after a sharp move higher.
That's why the next few sessions could tell us more than the initial breakout.
If buyers continue showing up after the short-covering activity fades, it would provide stronger evidence that demand is supporting the move rather than price simply being pushed higher by positioning.
On the other hand, if momentum weakens quickly, Bitcoin may need time to consolidate after the breakout.
What Traders Should Watch
Instead of focusing only on the next BTC price target, the bigger signal is how the market behaves around the breakout zone.
Can Bitcoin hold above the level it just reclaimed?
Do spot buyers continue providing demand?
And does ETF inflow strength continue while excessive futures leverage remains under control?
Those factors could determine whether this move develops into a broader trend or simply becomes another sharp rally followed by consolidation.
For now, the breakout has changed the short-term picture.
But the real test starts after the excitement fades.
Is Bitcoin beginning a stronger trend, or does BTC need to consolidate before making its next major move?
Bitcoin Breaks Above $86K: What Matters After the Breakout?
Bitcoin ($BTC) has broken above $86,000, reaching its highest level since January as the broader crypto market continues to move higher.
But the breakout itself may not be the most important part of the move.
What matters now is whether Bitcoin can actually hold these higher levels once the initial momentum starts to cool.
One of the biggest pieces of the move is the return of capital through U.S. spot Bitcoin ETFs. The ETFs recorded roughly $999 million in net inflows on Monday, bringing total inflows across three consecutive sessions to around $1.59 billion.
That gives the breakout a more interesting backdrop.
Is Spot Demand Supporting the Move?
Bitcoin's move wasn't driven by one factor alone.
Short covering helped accelerate the upside as bearish positions were forced to close, while futures leverage can amplify price movements in both directions. Profit-taking also becomes an important factor after a sharp move higher.
That's why the next few sessions could tell us more than the initial breakout.
If buyers continue showing up after the short-covering activity fades, it would provide stronger evidence that demand is supporting the move rather than price simply being pushed higher by positioning.
On the other hand, if momentum weakens quickly, Bitcoin may need time to consolidate after the breakout.
What Traders Should Watch
Instead of focusing only on the next BTC price target, the bigger signal is how the market behaves around the breakout zone.
Can Bitcoin hold above the level it just reclaimed?
Do spot buyers continue providing demand?
And does ETF inflow strength continue while excessive futures leverage remains under control?
Those factors could determine whether this move develops into a broader trend or simply becomes another sharp rally followed by consolidation.
For now, the breakout has changed the short-term picture.
But the real test starts after the excitement fades.
Is Bitcoin beginning a stronger trend, or does BTC need to consolidate before making its next major move?
29
·
--
#BitcoinBreaksAboveMayHighNears$86K
Bitcoin just broke above $86K. But the breakout itself isn't the most interesting part. ₿
BTC reached its highest level since January as the broader risk-on move accelerated. U.S. spot Bitcoin ETFs also saw roughly $999M of net inflows on Monday, bringing three consecutive sessions of inflows to about $1.59B.
Here's what I'm watching now:
Can BTC keep holding the breakout with genuine spot demand?
Short covering helped fuel the move, while futures leverage and profit-taking are still factors traders need to watch.
So I wouldn't focus only on the next price target.
The bigger signal is whether buyers continue showing up after the initial breakout momentum fades.
Is this the start of a stronger trend, or does BTC need to consolidate first?
$BTC
{spot}(BTCUSDT)
#BitcoinBreaksAboveMayHighNears$86K
Bitcoin just broke above $86K. But the breakout itself isn't the most interesting part. ₿
BTC reached its highest level since January as the broader risk-on move accelerated. U.S. spot Bitcoin ETFs also saw roughly $999M of net inflows on Monday, bringing three consecutive sessions of inflows to about $1.59B.
Here's what I'm watching now:
Can BTC keep holding the breakout with genuine spot demand?
Short covering helped fuel the move, while futures leverage and profit-taking are still factors traders need to watch.
So I wouldn't focus only on the next price target.
The bigger signal is whether buyers continue showing up after the initial breakout momentum fades.
Is this the start of a stronger trend, or does BTC need to consolidate first?
$BTC
Bitcoin just broke above $86K. But the breakout itself isn't the most interesting part. ₿
BTC reached its highest level since January as the broader risk-on move accelerated. U.S. spot Bitcoin ETFs also saw roughly $999M of net inflows on Monday, bringing three consecutive sessions of inflows to about $1.59B.
Here's what I'm watching now:
Can BTC keep holding the breakout with genuine spot demand?
Short covering helped fuel the move, while futures leverage and profit-taking are still factors traders need to watch.
So I wouldn't focus only on the next price target.
The bigger signal is whether buyers continue showing up after the initial breakout momentum fades.
Is this the start of a stronger trend, or does BTC need to consolidate first?
$BTC

17

Article
Next PredictionToday’s signal
BTC's daily price swings in candlestick format. (TradingView)
BTC's daily price chart. (TradingView)
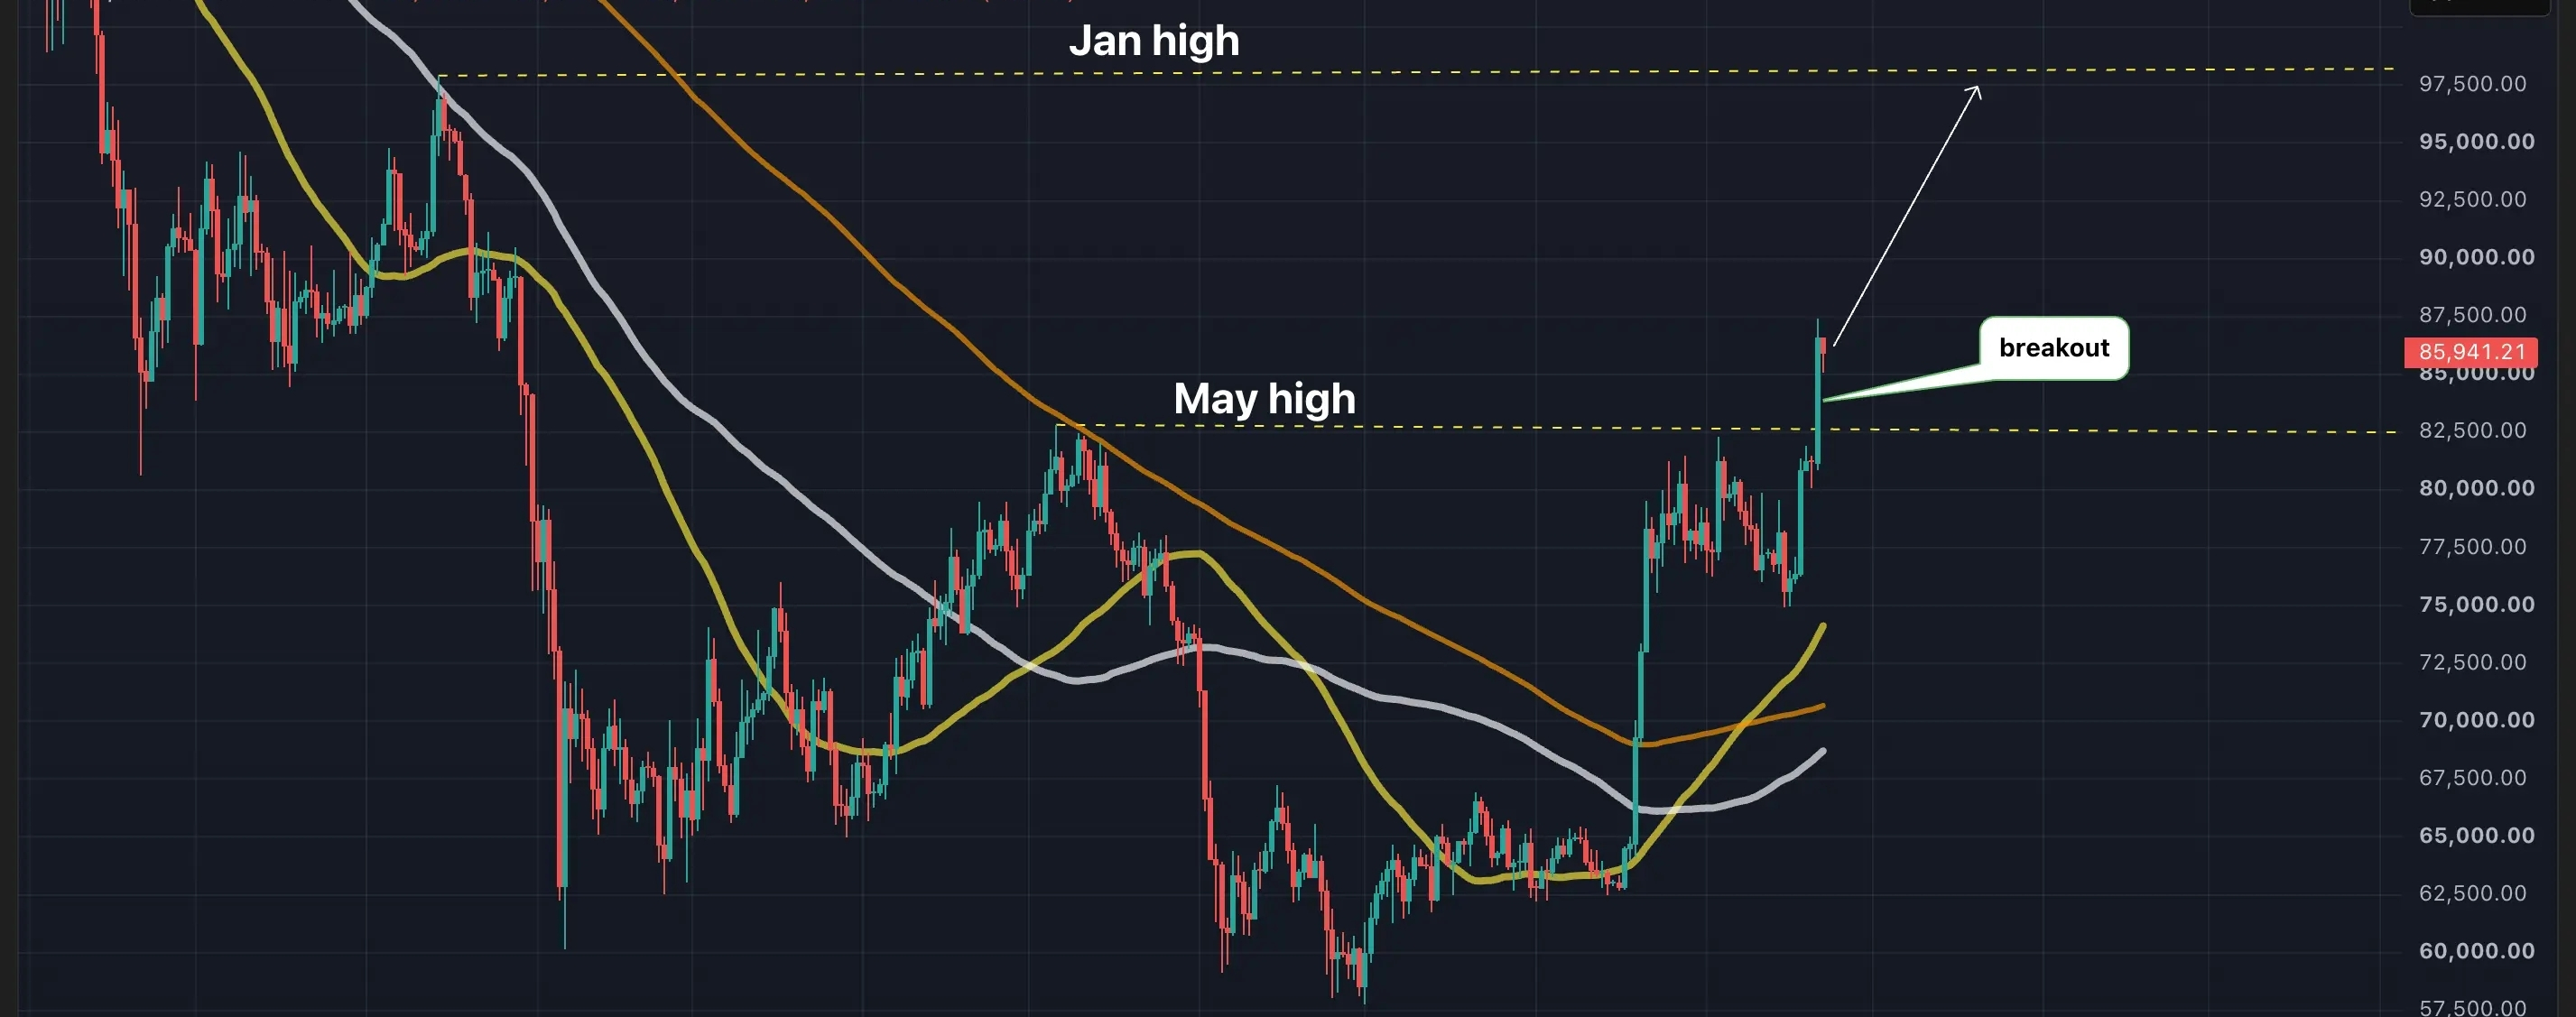
The chart shows bitcoin’s daily price swings in candlestick format. Overlaid on the chart are 50-, 100- and 200-day moving averages.
BTC is trading well above all three averages, a bullish configuration.
"BTC has reclaimed every one of its long-term moving averages. After around 300 days underneath them, this dynamic has now flipped. Holding above them is what maintains a long-term uptrend," Glassnode said.
In addition, BTC’s Monday candle ended well above the May high, topping the key resistance to mark yet another bullish breakout. The next big resistance, or level, from where markets fell, is marked by the January high of above $98,000.
#BitcoinBreaksAboveMayHighNears$86K
#CryptoMarketCapReclaims$3Trillion
$BTC $ETH
{spot}(BTCUSDT)
Next Prediction
Today’s signal
BTC's daily price swings in candlestick format. (TradingView)
BTC's daily price chart. (TradingView)
The chart shows bitcoin’s daily price swings in candlestick format. Overlaid on the chart are 50-, 100- and 200-day moving averages.
BTC is trading well above all three averages, a bullish configuration.
"BTC has reclaimed every one of its long-term moving averages. After around 300 days underneath them, this dynamic has now flipped. Holding above them is what maintains a long-term uptrend," Glassnode said.
In addition, BTC’s Monday candle ended well above the May high, topping the key resistance to mark yet another bullish breakout. The next big resistance, or level, from where markets fell, is marked by the January high of above $98,000.
#BitcoinBreaksAboveMayHighNears$86K
#CryptoMarketCapReclaims$3Trillion
$BTC $ETH
BTC's daily price swings in candlestick format. (TradingView)
BTC's daily price chart. (TradingView)
The chart shows bitcoin’s daily price swings in candlestick format. Overlaid on the chart are 50-, 100- and 200-day moving averages.
BTC is trading well above all three averages, a bullish configuration.
"BTC has reclaimed every one of its long-term moving averages. After around 300 days underneath them, this dynamic has now flipped. Holding above them is what maintains a long-term uptrend," Glassnode said.
In addition, BTC’s Monday candle ended well above the May high, topping the key resistance to mark yet another bullish breakout. The next big resistance, or level, from where markets fell, is marked by the January high of above $98,000.
#BitcoinBreaksAboveMayHighNears$86K
#CryptoMarketCapReclaims$3Trillion
$BTC $ETH
70
Log in to explore more content
Join global crypto users on Binance Square
⚡️ Get latest and useful information about crypto.
💬 Trusted by the world’s largest crypto exchange.
👍 Discover real insights from verified creators.
Email / Phone number
Trending Topics
1
#AnthropicIPOProspectusCouldValueItOver$2T
74 views
21 Discussing
2
#HackersDrainOver12.4MXRPFromDCENTWallets
1,380 views
54 Discussing
3
#SECSaysDecentralizedTokenBuybacksNotInvestmentContracts
7 views
2 Discussing
4
#UKFCAWinsCourtOrderToRecover851400Pounds
53,343 views
975 Discussing
5
#ChainlinkLaunchesCCIP2WithEnterpriseVerification
63,315 views
1,117 Discussing
6
#GoldFallsTo$4144
21,184 views
175 Discussing
7
#QNTFallsOver40%FromMorningHigh
112,521 views
1,495 Discussing
8
#USDTAdds845900HoldersInPast7Days
31,013 views
554 Discussing
9
#KospiFalls2.7%SamsungSKHynixDropOver5%
42,079 views
669 Discussing
10
#BitgetCEOConfirms$388MStolenInHack
6,080 views
45 Discussing