

#96
96
4,748 views
39 Discussing
Hot
Latest

·
--
Breaking news! CT drops sharply 3.6% at a key time point—first look to buy the dip at these supports22:58 (just now) CT saw a drop of 3.6% at an important time point (5-minute window 22:53→22:58). As of 22:58:59, the current price is 0.4891, up 3.8% over 24h. Also moving in the same batch: BAT and XPL.
📅 Data as of 22:58:59 (event trigger times are noted on each item; prices are real-time snapshots at the time of writing)
📌 In one sentence: During important time windows (K-line close / U.S. stock open and close), most of the unusual moves involve institutions, so the signals are higher quality
Market Overview: BTC 85,653.30 (+2.03%) · ETH 2,709.14 (+0.85%); Across the whole market, 391 stocks rose / 103 fell over the past 24h. Top gainer over 24h: MAGMA +64.98%; biggest loser: Lobster -61.38%.
Breaking news! CT drops sharply 3.6% at a key time point—first look to buy the dip at these supports
22:58 (just now) CT saw a drop of 3.6% at an important time point (5-minute window 22:53→22:58). As of 22:58:59, the current price is 0.4891, up 3.8% over 24h. Also moving in the same batch: BAT and XPL.
📅 Data as of 22:58:59 (event trigger times are noted on each item; prices are real-time snapshots at the time of writing)
📌 In one sentence: During important time windows (K-line close / U.S. stock open and close), most of the unusual moves involve institutions, so the signals are higher quality
Market Overview: BTC 85,653.30 (+2.03%) · ETH 2,709.14 (+0.85%); Across the whole market, 391 stocks rose / 103 fell over the past 24h. Top gainer over 24h: MAGMA +64.98%; biggest loser: Lobster -61.38%.
📅 Data as of 22:58:59 (event trigger times are noted on each item; prices are real-time snapshots at the time of writing)
📌 In one sentence: During important time windows (K-line close / U.S. stock open and close), most of the unusual moves involve institutions, so the signals are higher quality
Market Overview: BTC 85,653.30 (+2.03%) · ETH 2,709.14 (+0.85%); Across the whole market, 391 stocks rose / 103 fell over the past 24h. Top gainer over 24h: MAGMA +64.98%; biggest loser: Lobster -61.38%.
5

·
--
ENA This move isn’t small.
The price in the 15m timeframe fell 0.28%. It doesn’t look like much, but OI dropped 2.05% in an hour. With nominal value at 2.95 million U withdrawing, this isn’t new shorts entering—it’s long positions reducing exposure. Active trade imbalance is -7.2%, buy/sell ratio is 0.87, sell pressure is more actively applied. In the 5m timeframe, Binance liquidations via proxy totaled 246K U, and the sell-side direction is more concentrated.
The funding rate is still in the recent high percentile. The combination here is kind of interesting: a relatively high funding rate suggests longs were previously crowded. Now with OI down and price drifting lower, it looks more like leverage can’t hold itself up first. Whole-pool abnormality #96, nominal change #15—depth confirmation has been checked; this isn’t small-scale action.
In the past 24 hours, spot volume is 365 million U, and liquidity is sufficient. But with this kind of structure, don’t rush to jump in—wait until longs finish deleveraging before taking action.
ENA This move isn’t small.
The price in the 15m timeframe fell 0.28%. It doesn’t look like much, but OI dropped 2.05% in an hour. With nominal value at 2.95 million U withdrawing, this isn’t new shorts entering—it’s long positions reducing exposure. Active trade imbalance is -7.2%, buy/sell ratio is 0.87, sell pressure is more actively applied. In the 5m timeframe, Binance liquidations via proxy totaled 246K U, and the sell-side direction is more concentrated.
The funding rate is still in the recent high percentile. The combination here is kind of interesting: a relatively high funding rate suggests longs were previously crowded. Now with OI down and price drifting lower, it looks more like leverage can’t hold itself up first. Whole-pool abnormality #96, nominal change #15—depth confirmation has been checked; this isn’t small-scale action.
In the past 24 hours, spot volume is 365 million U, and liquidity is sufficient. But with this kind of structure, don’t rush to jump in—wait until longs finish deleveraging before taking action.
The price in the 15m timeframe fell 0.28%. It doesn’t look like much, but OI dropped 2.05% in an hour. With nominal value at 2.95 million U withdrawing, this isn’t new shorts entering—it’s long positions reducing exposure. Active trade imbalance is -7.2%, buy/sell ratio is 0.87, sell pressure is more actively applied. In the 5m timeframe, Binance liquidations via proxy totaled 246K U, and the sell-side direction is more concentrated.
The funding rate is still in the recent high percentile. The combination here is kind of interesting: a relatively high funding rate suggests longs were previously crowded. Now with OI down and price drifting lower, it looks more like leverage can’t hold itself up first. Whole-pool abnormality #96, nominal change #15—depth confirmation has been checked; this isn’t small-scale action.
In the past 24 hours, spot volume is 365 million U, and liquidity is sufficient. But with this kind of structure, don’t rush to jump in—wait until longs finish deleveraging before taking action.
5

·
--
** How to Create a Daily Binance Square Trading Plan – For Beginners and Intermediate Traders 🚀Aerodrome Finance (AEROUSDT) is trending right now!
Rank: #96
** ### 📌 1. Fetch Today’s Market Data **Step:** Go to the “Market” tab on Binance Square, filter the “Spot” → “USDT” pairs. **Why is it important?** Real-time price and volume information forms the basis of your decision. **Example (24 Sep 2026):** - = **86 486 USDT** (+5.84 % 24 h) – volume 2.70 B USDT - = **2 774.58 USDT** (+3.44 % 24 h) – volume 1.51 B USDT - Biggest gainer: **DOGEUSDT** = **0.10064 USDT** (+13.85 %) > **Practical:** Create a file on your phone or in a notebook called “Today-Data,” and save the three prices above and their % changes. --- ### 📈 2. General Trend Analysis (24 h, 7 d, 30 d) **Step:** On TradingView, open the “BTCUSDT”, “ETHUSDT” charts for the same pairs, set the “Timeframe” to **1D** and **4H**. **Why is it important?** The trend direction increases the accuracy of buy/sell signals. **Visual Hint:** - **Upward slope** = “Higher Highs & Higher Lows” → Bull market. - **Downward slope** = “Lower Highs & Lower Lows” → Bear market. **Current Situation (4H BTC):** Price broke above the 86 200 → 86 486 level, **forming a Higher High**. > **Practical:** Open the chart and connect the two most recent high and low points. If the line slopes upward, add it to your “Buy” list. --- ### 📊 3. Identify Support & Resistance Levels **Step:** Place the lines using the “Horizontal Line” tool at the previous **high/low** and **fibonacci retracement** (23.6-38.2-61.8) levels. **Why is it important?** These are often the places where the price is more likely to reverse;
** How to Create a Daily Binance Square Trading Plan – For Beginners and Intermediate Traders 🚀
Aerodrome Finance (AEROUSDT) is trending right now!
Rank: #96
** ### 📌 1. Fetch Today’s Market Data **Step:** Go to the “Market” tab on Binance Square, filter the “Spot” → “USDT” pairs. **Why is it important?** Real-time price and volume information forms the basis of your decision. **Example (24 Sep 2026):** - = **86 486 USDT** (+5.84 % 24 h) – volume 2.70 B USDT - = **2 774.58 USDT** (+3.44 % 24 h) – volume 1.51 B USDT - Biggest gainer: **DOGEUSDT** = **0.10064 USDT** (+13.85 %) > **Practical:** Create a file on your phone or in a notebook called “Today-Data,” and save the three prices above and their % changes. --- ### 📈 2. General Trend Analysis (24 h, 7 d, 30 d) **Step:** On TradingView, open the “BTCUSDT”, “ETHUSDT” charts for the same pairs, set the “Timeframe” to **1D** and **4H**. **Why is it important?** The trend direction increases the accuracy of buy/sell signals. **Visual Hint:** - **Upward slope** = “Higher Highs & Higher Lows” → Bull market. - **Downward slope** = “Lower Highs & Lower Lows” → Bear market. **Current Situation (4H BTC):** Price broke above the 86 200 → 86 486 level, **forming a Higher High**. > **Practical:** Open the chart and connect the two most recent high and low points. If the line slopes upward, add it to your “Buy” list. --- ### 📊 3. Identify Support & Resistance Levels **Step:** Place the lines using the “Horizontal Line” tool at the previous **high/low** and **fibonacci retracement** (23.6-38.2-61.8) levels. **Why is it important?** These are often the places where the price is more likely to reverse;
Rank: #96
** ### 📌 1. Fetch Today’s Market Data **Step:** Go to the “Market” tab on Binance Square, filter the “Spot” → “USDT” pairs. **Why is it important?** Real-time price and volume information forms the basis of your decision. **Example (24 Sep 2026):** - = **86 486 USDT** (+5.84 % 24 h) – volume 2.70 B USDT - = **2 774.58 USDT** (+3.44 % 24 h) – volume 1.51 B USDT - Biggest gainer: **DOGEUSDT** = **0.10064 USDT** (+13.85 %) > **Practical:** Create a file on your phone or in a notebook called “Today-Data,” and save the three prices above and their % changes. --- ### 📈 2. General Trend Analysis (24 h, 7 d, 30 d) **Step:** On TradingView, open the “BTCUSDT”, “ETHUSDT” charts for the same pairs, set the “Timeframe” to **1D** and **4H**. **Why is it important?** The trend direction increases the accuracy of buy/sell signals. **Visual Hint:** - **Upward slope** = “Higher Highs & Higher Lows” → Bull market. - **Downward slope** = “Lower Highs & Lower Lows” → Bear market. **Current Situation (4H BTC):** Price broke above the 86 200 → 86 486 level, **forming a Higher High**. > **Practical:** Open the chart and connect the two most recent high and low points. If the line slopes upward, add it to your “Buy” list. --- ### 📊 3. Identify Support & Resistance Levels **Step:** Place the lines using the “Horizontal Line” tool at the previous **high/low** and **fibonacci retracement** (23.6-38.2-61.8) levels. **Why is it important?** These are often the places where the price is more likely to reverse;
65
·
--
** Is it a %2.1 increase, or a %19.8 breakout?**Aerodrome Finance (AEROUSDT) is trending right now!
Rank: #96
** Today it’s only **%2.145** up, but in a single day it made **%19.848**—this difference doesn’t show up on most traders’ radar. 📈 Right now it’s at **,684.38**, and it gathered **68.5M** in volume within 24 hours. This is still an indication of liquidity competition, but the price action is calm. In my view, this “calm” rally is an ideal entry signal for a **pump-and-hold** strategy. Especially those doing DCA can see ’s current level as a “dip.” On the other hand, **NEARUSDT** surged to **.269** within 24 hours, becoming the most active coin with **4.38M** trading volume. With the open price at .562, the last price was .269 — a **%19.848** jump. This is a “rocket-fuel” effect triggered by new integrations in the **Layer-2** and **DeFi** ecosystem. Most analysts say **NEAR has already been overvalued**, but I **see that smart money flow is still turning toward this project**. In particular, **staking** yields and new dApp launches can push the price even higher. Other notable movers: **AVAX** is up **10.5%** to the 1.598 level, **ATOM** is up **2.6%** to .781, **DOT** is up **2.5%** to .148. All of them are generating between **50M–40M** in volume within 24 hours. This shows the **inter-chain** trend is still hot. Personal tactics: 1. **** for a short-term “ape-in” — 20% stop-loss, 40% target. 2. **** for weekly DCA — add more on every 5% drop. 3. **AVAX** and **DOT** for “trend-follow” — above the 50-day EMA.
** Is it a %2.1 increase, or a %19.8 breakout?**
Aerodrome Finance (AEROUSDT) is trending right now!
Rank: #96
** Today it’s only **%2.145** up, but in a single day it made **%19.848**—this difference doesn’t show up on most traders’ radar. 📈 Right now it’s at **,684.38**, and it gathered **68.5M** in volume within 24 hours. This is still an indication of liquidity competition, but the price action is calm. In my view, this “calm” rally is an ideal entry signal for a **pump-and-hold** strategy. Especially those doing DCA can see ’s current level as a “dip.” On the other hand, **NEARUSDT** surged to **.269** within 24 hours, becoming the most active coin with **4.38M** trading volume. With the open price at .562, the last price was .269 — a **%19.848** jump. This is a “rocket-fuel” effect triggered by new integrations in the **Layer-2** and **DeFi** ecosystem. Most analysts say **NEAR has already been overvalued**, but I **see that smart money flow is still turning toward this project**. In particular, **staking** yields and new dApp launches can push the price even higher. Other notable movers: **AVAX** is up **10.5%** to the 1.598 level, **ATOM** is up **2.6%** to .781, **DOT** is up **2.5%** to .148. All of them are generating between **50M–40M** in volume within 24 hours. This shows the **inter-chain** trend is still hot. Personal tactics: 1. **** for a short-term “ape-in” — 20% stop-loss, 40% target. 2. **** for weekly DCA — add more on every 5% drop. 3. **AVAX** and **DOT** for “trend-follow” — above the 50-day EMA.
Rank: #96
** Today it’s only **%2.145** up, but in a single day it made **%19.848**—this difference doesn’t show up on most traders’ radar. 📈 Right now it’s at **,684.38**, and it gathered **68.5M** in volume within 24 hours. This is still an indication of liquidity competition, but the price action is calm. In my view, this “calm” rally is an ideal entry signal for a **pump-and-hold** strategy. Especially those doing DCA can see ’s current level as a “dip.” On the other hand, **NEARUSDT** surged to **.269** within 24 hours, becoming the most active coin with **4.38M** trading volume. With the open price at .562, the last price was .269 — a **%19.848** jump. This is a “rocket-fuel” effect triggered by new integrations in the **Layer-2** and **DeFi** ecosystem. Most analysts say **NEAR has already been overvalued**, but I **see that smart money flow is still turning toward this project**. In particular, **staking** yields and new dApp launches can push the price even higher. Other notable movers: **AVAX** is up **10.5%** to the 1.598 level, **ATOM** is up **2.6%** to .781, **DOT** is up **2.5%** to .148. All of them are generating between **50M–40M** in volume within 24 hours. This shows the **inter-chain** trend is still hot. Personal tactics: 1. **** for a short-term “ape-in” — 20% stop-loss, 40% target. 2. **** for weekly DCA — add more on every 5% drop. 3. **AVAX** and **DOT** for “trend-follow” — above the 50-day EMA.
79
·
--
🤑 ETH Leads as Markets SteadyPons (PONSUSDT) is trending right now!
Rank: #96
Big surprise here? Not really! 😅 ETH is leading the pack with a **490.08** price tag and **0.28% gain** in 24hrs! Meanwhile, is steady at **9,797.18** with a **-0.03% change**. I'm thinking this stability is a good sign for the market. ETH's volume is also on the rise with **0.26B** traded in 24hrs. What's your take on this steady market? Is ETH poised for a moon shot soon?
#bitcoin #ethereum #crypto
🤑 ETH Leads as Markets Steady
Pons (PONSUSDT) is trending right now!
Rank: #96
Big surprise here? Not really! 😅 ETH is leading the pack with a **490.08** price tag and **0.28% gain** in 24hrs! Meanwhile, is steady at **9,797.18** with a **-0.03% change**. I'm thinking this stability is a good sign for the market. ETH's volume is also on the rise with **0.26B** traded in 24hrs. What's your take on this steady market? Is ETH poised for a moon shot soon?
#bitcoin #ethereum #crypto
Rank: #96
Big surprise here? Not really! 😅 ETH is leading the pack with a **490.08** price tag and **0.28% gain** in 24hrs! Meanwhile, is steady at **9,797.18** with a **-0.03% change**. I'm thinking this stability is a good sign for the market. ETH's volume is also on the rise with **0.26B** traded in 24hrs. What's your take on this steady market? Is ETH poised for a moon shot soon?
#bitcoin #ethereum #crypto
294

·
--
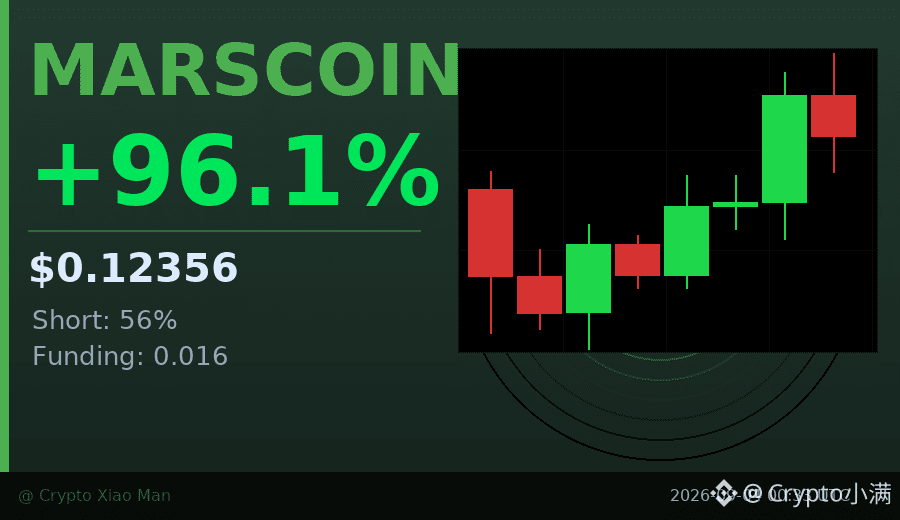
Up 96%, yet the number of people shorting is still higher than those going long.
Today, MARSCOIN’s trading volume surged to $536 million. The price rose from 0.059 to 0.123 and stayed strong for 8 hours. What’s interesting, though, is that in the contract market, 56% of participants are opening short positions, while only 44% are going long—despite the big rally, the market is actually more cautious.
This situation usually comes from two possibilities: either the shorts are betting on a pullback, or they’re on their way to getting squeezed. The funding rate is only 0.016, which suggests leverage isn’t being carried to an extreme yet.
I tend to believe this is a typical period of hesitation for short sellers: the price has already moved up, but everyone hasn’t fully bought into it. If it continues to break through the 0.134 high, it could force shorts and accelerate the squeeze.
$MARSCOIN #逼空信号 #96%涨幅
Click the small card below to quickly check the行情👇
Up 96%, yet the number of people shorting is still higher than those going long.
Today, MARSCOIN’s trading volume surged to $536 million. The price rose from 0.059 to 0.123 and stayed strong for 8 hours. What’s interesting, though, is that in the contract market, 56% of participants are opening short positions, while only 44% are going long—despite the big rally, the market is actually more cautious.
This situation usually comes from two possibilities: either the shorts are betting on a pullback, or they’re on their way to getting squeezed. The funding rate is only 0.016, which suggests leverage isn’t being carried to an extreme yet.
I tend to believe this is a typical period of hesitation for short sellers: the price has already moved up, but everyone hasn’t fully bought into it. If it continues to break through the 0.134 high, it could force shorts and accelerate the squeeze.
$MARSCOIN #逼空信号 #96%涨幅
Click the small card below to quickly check the行情👇
Today, MARSCOIN’s trading volume surged to $536 million. The price rose from 0.059 to 0.123 and stayed strong for 8 hours. What’s interesting, though, is that in the contract market, 56% of participants are opening short positions, while only 44% are going long—despite the big rally, the market is actually more cautious.
This situation usually comes from two possibilities: either the shorts are betting on a pullback, or they’re on their way to getting squeezed. The funding rate is only 0.016, which suggests leverage isn’t being carried to an extreme yet.
I tend to believe this is a typical period of hesitation for short sellers: the price has already moved up, but everyone hasn’t fully bought into it. If it continues to break through the 0.134 high, it could force shorts and accelerate the squeeze.
$MARSCOIN #逼空信号 #96%涨幅
Click the small card below to quickly check the行情👇
178

FET is hitting the daily peak, the checklist needs to be concise but comprehensive.
✅ Price at $FET is currently $0.25, up +17.37761%/24h. Daily range $0.21–$0.25 → strong short-term momentum, but being close to the ceiling means the next move needs confirmation by holding the price, not just green candles.
✅ 24h volume reached $229.26M, market cap $564.26M, rank #96. Liquidity is standing out compared to the market cap, suitable for a short-term watchlist.
✅ The AI narrative remains the core of the Artificial Superintelligence Alliance, but today’s market watch should prioritize the range: hold around $0.25 or pull back to the mid-range of $0.21–$0.25.
Which scenario are you leaning towards? #FET $FET #Crypto #BinanceSquare #DYOR
FET is hitting the daily peak, the checklist needs to be concise but comprehensive.
✅ Price at $FET is currently $0.25, up +17.37761%/24h. Daily range $0.21–$0.25 → strong short-term momentum, but being close to the ceiling means the next move needs confirmation by holding the price, not just green candles.
✅ 24h volume reached $229.26M, market cap $564.26M, rank #96. Liquidity is standing out compared to the market cap, suitable for a short-term watchlist.
✅ The AI narrative remains the core of the Artificial Superintelligence Alliance, but today’s market watch should prioritize the range: hold around $0.25 or pull back to the mid-range of $0.21–$0.25.
Which scenario are you leaning towards? #FET $FET #Crypto #BinanceSquare #DYOR
✅ Price at $FET is currently $0.25, up +17.37761%/24h. Daily range $0.21–$0.25 → strong short-term momentum, but being close to the ceiling means the next move needs confirmation by holding the price, not just green candles.
✅ 24h volume reached $229.26M, market cap $564.26M, rank #96. Liquidity is standing out compared to the market cap, suitable for a short-term watchlist.
✅ The AI narrative remains the core of the Artificial Superintelligence Alliance, but today’s market watch should prioritize the range: hold around $0.25 or pull back to the mid-range of $0.21–$0.25.
Which scenario are you leaning towards? #FET $FET #Crypto #BinanceSquare #DYOR
336

·
--
Contract Quant Brief #96|It hasn’t gone bad, but I’d rather wait for a pullback to confirm
The market is still leaning strong. Funding rates overall aren’t out of control, but SYN’s rally has started to show some divergence. I won’t chase buys at this kind of position—I’d rather wait for a pullback and hold, then reassess whether to continue.
Top candidates
1. SYNUSDT
- This line is the strongest: up 27.19% over 24 hours. It’s still extending over the past 6 hours, but the 1-hour chart has slightly pulled back, and open interest is also decreasing—suggesting it’s not a mindless one-way acceleration.
- Watch level: around 0.365
- Trigger condition: after a pullback that does not break 0.365, reclaims the area near 0.378
- Invalidation condition: breaks below 0.350, and the subsequent rebound fails to reclaim
2. GWEIUSDT
- The move is also strong. Funding rates are still relatively moderate. After the 1-hour pullback, open interest continues to rise—this is the type that has follow-through from funding.
- Watch level: 0.154 - 0.155
- Trigger condition: holds 0.155 and then reclaims above 0.165
- Invalidation condition: falls back below 0.145 and cannot rapidly recover
Secondary watch / Not chasing for now
- VELVETUSDT: volume is very large and open interest is also increasing, but it’s stretched farther away from the moving averages. Treat it as a show-of-strength observation for now—no rush to chase.
Risk warning
- This isn’t a “buy the top” setup; it’s more like a chart that says “wait for confirmation before acting.”
- If the pullback can’t hold, missing it means missing it—don’t force entries at the tail end of an acceleration.
One-sentence summary
I’ll first watch for SYN’s pullback confirmation; GWEI is the second choice, and VELVET stays under observation—no chasing.
Contract Quant Brief #96|It hasn’t gone bad, but I’d rather wait for a pullback to confirm
The market is still leaning strong. Funding rates overall aren’t out of control, but SYN’s rally has started to show some divergence. I won’t chase buys at this kind of position—I’d rather wait for a pullback and hold, then reassess whether to continue.
Top candidates
1. SYNUSDT
- This line is the strongest: up 27.19% over 24 hours. It’s still extending over the past 6 hours, but the 1-hour chart has slightly pulled back, and open interest is also decreasing—suggesting it’s not a mindless one-way acceleration.
- Watch level: around 0.365
- Trigger condition: after a pullback that does not break 0.365, reclaims the area near 0.378
- Invalidation condition: breaks below 0.350, and the subsequent rebound fails to reclaim
2. GWEIUSDT
- The move is also strong. Funding rates are still relatively moderate. After the 1-hour pullback, open interest continues to rise—this is the type that has follow-through from funding.
- Watch level: 0.154 - 0.155
- Trigger condition: holds 0.155 and then reclaims above 0.165
- Invalidation condition: falls back below 0.145 and cannot rapidly recover
Secondary watch / Not chasing for now
- VELVETUSDT: volume is very large and open interest is also increasing, but it’s stretched farther away from the moving averages. Treat it as a show-of-strength observation for now—no rush to chase.
Risk warning
- This isn’t a “buy the top” setup; it’s more like a chart that says “wait for confirmation before acting.”
- If the pullback can’t hold, missing it means missing it—don’t force entries at the tail end of an acceleration.
One-sentence summary
I’ll first watch for SYN’s pullback confirmation; GWEI is the second choice, and VELVET stays under observation—no chasing.
The market is still leaning strong. Funding rates overall aren’t out of control, but SYN’s rally has started to show some divergence. I won’t chase buys at this kind of position—I’d rather wait for a pullback and hold, then reassess whether to continue.
Top candidates
1. SYNUSDT
- This line is the strongest: up 27.19% over 24 hours. It’s still extending over the past 6 hours, but the 1-hour chart has slightly pulled back, and open interest is also decreasing—suggesting it’s not a mindless one-way acceleration.
- Watch level: around 0.365
- Trigger condition: after a pullback that does not break 0.365, reclaims the area near 0.378
- Invalidation condition: breaks below 0.350, and the subsequent rebound fails to reclaim
2. GWEIUSDT
- The move is also strong. Funding rates are still relatively moderate. After the 1-hour pullback, open interest continues to rise—this is the type that has follow-through from funding.
- Watch level: 0.154 - 0.155
- Trigger condition: holds 0.155 and then reclaims above 0.165
- Invalidation condition: falls back below 0.145 and cannot rapidly recover
Secondary watch / Not chasing for now
- VELVETUSDT: volume is very large and open interest is also increasing, but it’s stretched farther away from the moving averages. Treat it as a show-of-strength observation for now—no rush to chase.
Risk warning
- This isn’t a “buy the top” setup; it’s more like a chart that says “wait for confirmation before acting.”
- If the pullback can’t hold, missing it means missing it—don’t force entries at the tail end of an acceleration.
One-sentence summary
I’ll first watch for SYN’s pullback confirmation; GWEI is the second choice, and VELVET stays under observation—no chasing.
760

That’s not just a move - it’s a statement.
Kenya’s decision to migrate 30 million academic credentials to the Avalanche blockchain isn’t just a technical shift - it’s a signal. And it’s coming from a country where blockchain is still a novelty.
The move raises a question: Why Avalanche? Why now?
Let’s unpack it.
That’s not a small choice.
Why Avalanche?
Avalanche is not the only blockchain in the world, but it’s one of the few that has made institutional trust a core part of its architecture. It’s built for scalability, for fast finality, and for interoperability - all things that matter when you’re moving millions of records across a national system.
What’s unique about Avalanche is that it doesn’t just promise trust - it builds it in.
And that’s exactly what Kenya’s government is looking for.
What does this mean for the sector?
This move is not just about Kenya. It’s a glimpse into the future of blockchain in education and beyond.
And that’s a shift.
What’s next?
This isn’t a one-off move. It’s a step in a direction that’s likely to accelerate.
Looks like a small step, but the numbers tell a bigger story.
—
For educational purposes only. Not financial advice.
📌 Crypto 101 · #96 · #CryptoEducation #CryptoSighted $AVAX
That’s not just a move - it’s a statement.
Kenya’s decision to migrate 30 million academic credentials to the Avalanche blockchain isn’t just a technical shift - it’s a signal. And it’s coming from a country where blockchain is still a novelty.
The move raises a question: Why Avalanche? Why now?
Let’s unpack it.
That’s not a small choice.
Why Avalanche?
Avalanche is not the only blockchain in the world, but it’s one of the few that has made institutional trust a core part of its architecture. It’s built for scalability, for fast finality, and for interoperability - all things that matter when you’re moving millions of records across a national system.
What’s unique about Avalanche is that it doesn’t just promise trust - it builds it in.
And that’s exactly what Kenya’s government is looking for.
What does this mean for the sector?
This move is not just about Kenya. It’s a glimpse into the future of blockchain in education and beyond.
And that’s a shift.
What’s next?
This isn’t a one-off move. It’s a step in a direction that’s likely to accelerate.
Looks like a small step, but the numbers tell a bigger story.
—
For educational purposes only. Not financial advice.
📌 Crypto 101 · #96 · #CryptoEducation #CryptoSighted $AVAX
Kenya’s decision to migrate 30 million academic credentials to the Avalanche blockchain isn’t just a technical shift - it’s a signal. And it’s coming from a country where blockchain is still a novelty.
The move raises a question: Why Avalanche? Why now?
Let’s unpack it.
That’s not a small choice.
Why Avalanche?
Avalanche is not the only blockchain in the world, but it’s one of the few that has made institutional trust a core part of its architecture. It’s built for scalability, for fast finality, and for interoperability - all things that matter when you’re moving millions of records across a national system.
What’s unique about Avalanche is that it doesn’t just promise trust - it builds it in.
And that’s exactly what Kenya’s government is looking for.
What does this mean for the sector?
This move is not just about Kenya. It’s a glimpse into the future of blockchain in education and beyond.
And that’s a shift.
What’s next?
This isn’t a one-off move. It’s a step in a direction that’s likely to accelerate.
Looks like a small step, but the numbers tell a bigger story.
—
For educational purposes only. Not financial advice.
📌 Crypto 101 · #96 · #CryptoEducation #CryptoSighted $AVAX
313
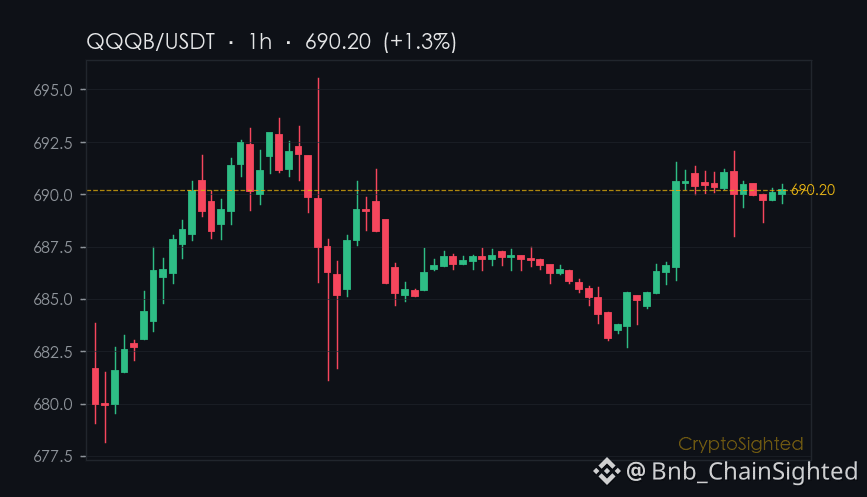
Tokenized stock trading surged in July, and one token is at the center of it all - $QQQB.
The question isn’t just why it’s leading the charge, but who’s behind the move and what it means for the broader market.
Binance has added QQQB as a collateral asset and launched USDⓈ-margin perpetual contracts for it, signaling institutional interest.
That’s not just a sign of support - it’s a move that could shift the playing field.
—
Not financial advice. DYOR.
📌 News Take · #96 · #CryptoNews #CryptoSighted $QQQB
Tokenized stock trading surged in July, and one token is at the center of it all - $QQQB .
The question isn’t just why it’s leading the charge, but who’s behind the move and what it means for the broader market.
Binance has added QQQB as a collateral asset and launched USDⓈ-margin perpetual contracts for it, signaling institutional interest.
That’s not just a sign of support - it’s a move that could shift the playing field.
—
Not financial advice. DYOR.
📌 News Take · #96 · #CryptoNews #CryptoSighted $QQQB
The question isn’t just why it’s leading the charge, but who’s behind the move and what it means for the broader market.
Binance has added QQQB as a collateral asset and launched USDⓈ-margin perpetual contracts for it, signaling institutional interest.
That’s not just a sign of support - it’s a move that could shift the playing field.
—
Not financial advice. DYOR.
📌 News Take · #96 · #CryptoNews #CryptoSighted $QQQB
175

·
--
$FET In the last 24 hours, it surged +18.45%, currently trading at 0.253 USDT, getting close to the 24h high.
📈 Price action: 24h range 0.2118 / 0.2542, with a volatility of about 20.02%; lower bound at 0.2118 (16.28% below current price) / midline at 0.233 (7.91% below current price) / upper bound at 0.2542 (0.47% above current price), currently leaning towards the upper bound; about 0.47% away from the 24h high.
📊 Data insights: Quoted trading volume around 102.46M USDT; current open interest (OI) approximately 154.83M FET; whales holding long/short positions at about 59.90% / 40.10%, long/short ratio at 1.49; nominal scale at about 39.17M USDT based on the latest price; current funding rate +0.0029% (lower cost for longs), next settlement around 16:00 UTC.
🔎 Contract details: Contract asset $FET; trading pair FET/USDT; public market name Artificial Superintelligence Alliance; exchange category: AI; listed for about 1227 days; market cap ranking #96; market cap around 569.87M USD; spot 24h trading volume approximately 231.17M USD.
⚠️ Technical analysis: The upper bound at 0.2542 is the nearest point, about 0.47% away from the 24h high, watch for high-level trades and profit-taking pressure.
Data source: Binance Futures public market + CoinGecko.
Do you think FET can break through the upper bound of 0.2542? Feel free to discuss in the comments. #FET #Perpetual Contract
$FET In the last 24 hours, it surged +18.45%, currently trading at 0.253 USDT, getting close to the 24h high.
📈 Price action: 24h range 0.2118 / 0.2542, with a volatility of about 20.02%; lower bound at 0.2118 (16.28% below current price) / midline at 0.233 (7.91% below current price) / upper bound at 0.2542 (0.47% above current price), currently leaning towards the upper bound; about 0.47% away from the 24h high.
📊 Data insights: Quoted trading volume around 102.46M USDT; current open interest (OI) approximately 154.83M FET; whales holding long/short positions at about 59.90% / 40.10%, long/short ratio at 1.49; nominal scale at about 39.17M USDT based on the latest price; current funding rate +0.0029% (lower cost for longs), next settlement around 16:00 UTC.
🔎 Contract details: Contract asset $FET ; trading pair FET/USDT; public market name Artificial Superintelligence Alliance; exchange category: AI; listed for about 1227 days; market cap ranking #96; market cap around 569.87M USD; spot 24h trading volume approximately 231.17M USD.
⚠️ Technical analysis: The upper bound at 0.2542 is the nearest point, about 0.47% away from the 24h high, watch for high-level trades and profit-taking pressure.
Data source: Binance Futures public market + CoinGecko.
Do you think FET can break through the upper bound of 0.2542? Feel free to discuss in the comments. #FET #Perpetual Contract
📈 Price action: 24h range 0.2118 / 0.2542, with a volatility of about 20.02%; lower bound at 0.2118 (16.28% below current price) / midline at 0.233 (7.91% below current price) / upper bound at 0.2542 (0.47% above current price), currently leaning towards the upper bound; about 0.47% away from the 24h high.
📊 Data insights: Quoted trading volume around 102.46M USDT; current open interest (OI) approximately 154.83M FET; whales holding long/short positions at about 59.90% / 40.10%, long/short ratio at 1.49; nominal scale at about 39.17M USDT based on the latest price; current funding rate +0.0029% (lower cost for longs), next settlement around 16:00 UTC.
🔎 Contract details: Contract asset $FET ; trading pair FET/USDT; public market name Artificial Superintelligence Alliance; exchange category: AI; listed for about 1227 days; market cap ranking #96; market cap around 569.87M USD; spot 24h trading volume approximately 231.17M USD.
⚠️ Technical analysis: The upper bound at 0.2542 is the nearest point, about 0.47% away from the 24h high, watch for high-level trades and profit-taking pressure.
Data source: Binance Futures public market + CoinGecko.
Do you think FET can break through the upper bound of 0.2542? Feel free to discuss in the comments. #FET #Perpetual Contract
80

·
--
I’ve been scanning CoinGecko’s trending page and three tokens jumped out at me. 1️⃣ PIPEDOG (pipedog) surged +12.4% in the last 24 hours, catching my eye despite its #676 market‑cap rank. 2️⃣ FOLD (The Interfold) rallied +8.9%, a modest climb that hints at growing DeFi interest. 3️⃣ PUMP (Pump.fun) exploded +21.7%, proving the meme‑fuel hype is still alive. 🚀
I’m also keeping tabs on the heavyweights that keep the market humming. Bitcoin (BTC) held steady with a +0.3% move, reinforcing its #1 dominance. Hyperliquid (HYPE) ticked up +5.2% from a #9 spot, showing liquidity‑layer confidence. SUI (Sui) climbed +7.1%, a solid rebound for the #29 ranked layer‑1. 🌟
Finally, I can’t ignore the political meme token that’s still making waves. Official Trump (TRUMP) rose +9.4% today, nudging it into the top 100 at #96. I’ve learned that blending novelty with real‑world buzz can generate short‑term spikes, so I’m watching these moves closely for entry points. 📈
$TUT, $UTK, $TUT
I’ve been scanning CoinGecko’s trending page and three tokens jumped out at me. 1️⃣ PIPEDOG (pipedog) surged +12.4% in the last 24 hours, catching my eye despite its #676 market‑cap rank. 2️⃣ FOLD (The Interfold) rallied +8.9%, a modest climb that hints at growing DeFi interest. 3️⃣ PUMP (Pump.fun) exploded +21.7%, proving the meme‑fuel hype is still alive. 🚀
I’m also keeping tabs on the heavyweights that keep the market humming. Bitcoin (BTC) held steady with a +0.3% move, reinforcing its #1 dominance. Hyperliquid (HYPE) ticked up +5.2% from a #9 spot, showing liquidity‑layer confidence. SUI (Sui) climbed +7.1%, a solid rebound for the #29 ranked layer‑1. 🌟
Finally, I can’t ignore the political meme token that’s still making waves. Official Trump (TRUMP) rose +9.4% today, nudging it into the top 100 at #96. I’ve learned that blending novelty with real‑world buzz can generate short‑term spikes, so I’m watching these moves closely for entry points. 📈
$TUT , $UTK, $TUT
I’m also keeping tabs on the heavyweights that keep the market humming. Bitcoin (BTC) held steady with a +0.3% move, reinforcing its #1 dominance. Hyperliquid (HYPE) ticked up +5.2% from a #9 spot, showing liquidity‑layer confidence. SUI (Sui) climbed +7.1%, a solid rebound for the #29 ranked layer‑1. 🌟
Finally, I can’t ignore the political meme token that’s still making waves. Official Trump (TRUMP) rose +9.4% today, nudging it into the top 100 at #96. I’ve learned that blending novelty with real‑world buzz can generate short‑term spikes, so I’m watching these moves closely for entry points. 📈
$TUT , $UTK, $TUT
94
·
--
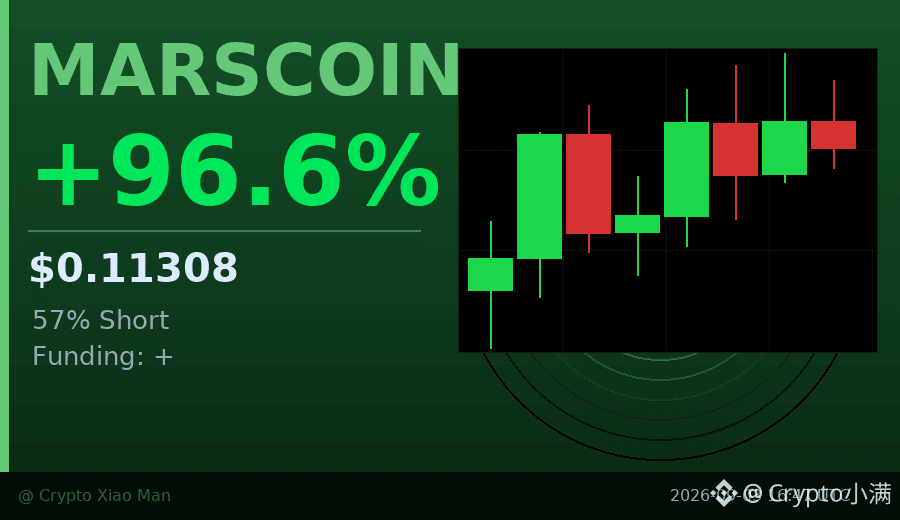
Behind the 96% surge, are shorts still adding positions?
MARSCOIN is up almost 100% today, and the trading volume has jumped to $396 million. But interestingly, 57% of the open positions are short — so many people think it will fall.
The funding rate is positive, meaning longs are paying shorts, but the rate isn’t extreme. Over the past 8 hours, the price action has kept pushing higher with no clear pullback.
This kind of setup usually has two scenarios: either the shorts get squeezed and it keeps rallying, or the longs run out of steam and quickly give back. My inclination is to first see whether 0.12 can hold.
$MARSCOIN #逼空行情 #96%
Click the small card below to quickly check the market👇
Behind the 96% surge, are shorts still adding positions?
MARSCOIN is up almost 100% today, and the trading volume has jumped to $396 million. But interestingly, 57% of the open positions are short — so many people think it will fall.
The funding rate is positive, meaning longs are paying shorts, but the rate isn’t extreme. Over the past 8 hours, the price action has kept pushing higher with no clear pullback.
This kind of setup usually has two scenarios: either the shorts get squeezed and it keeps rallying, or the longs run out of steam and quickly give back. My inclination is to first see whether 0.12 can hold.
$MARSCOIN #逼空行情 #96%
Click the small card below to quickly check the market👇
MARSCOIN is up almost 100% today, and the trading volume has jumped to $396 million. But interestingly, 57% of the open positions are short — so many people think it will fall.
The funding rate is positive, meaning longs are paying shorts, but the rate isn’t extreme. Over the past 8 hours, the price action has kept pushing higher with no clear pullback.
This kind of setup usually has two scenarios: either the shorts get squeezed and it keeps rallying, or the longs run out of steam and quickly give back. My inclination is to first see whether 0.12 can hold.
$MARSCOIN #逼空行情 #96%
Click the small card below to quickly check the market👇
47
·
--
We're tracking the latest trends in the crypto space, and our community is excited about the recent developments. According to CoinGecko, Pudgy Penguins (PENGU) and Venice Token (VVV) are gaining attention, with market cap ranks #96 and #79 respectively.
We're seeing notable market cap ranks from Hyperliquid (HYPE) at #11 and NEAR Protocol (NEAR) at #35 🚀.
We're concluding that the crypto market is dynamic, with tokens like Zcash (ZEC) and Railgun (RAIL) also making waves, and our community is ready to adapt to these changes 💡, with a keen eye on Anoma (XAN) 📊, and we're looking forward to seeing what's next 🔜.
$NIL, $DEXE, $PLAY
We're tracking the latest trends in the crypto space, and our community is excited about the recent developments. According to CoinGecko, Pudgy Penguins (PENGU) and Venice Token (VVV) are gaining attention, with market cap ranks #96 and #79 respectively.
We're seeing notable market cap ranks from Hyperliquid (HYPE) at #11 and NEAR Protocol (NEAR) at #35 🚀.
We're concluding that the crypto market is dynamic, with tokens like Zcash (ZEC) and Railgun (RAIL) also making waves, and our community is ready to adapt to these changes 💡, with a keen eye on Anoma (XAN) 📊, and we're looking forward to seeing what's next 🔜.
$NIL , $DEXE , $PLAY
We're seeing notable market cap ranks from Hyperliquid (HYPE) at #11 and NEAR Protocol (NEAR) at #35 🚀.
We're concluding that the crypto market is dynamic, with tokens like Zcash (ZEC) and Railgun (RAIL) also making waves, and our community is ready to adapt to these changes 💡, with a keen eye on Anoma (XAN) 📊, and we're looking forward to seeing what's next 🔜.
$NIL , $DEXE , $PLAY
1
190
↓3.88%
MORPHO is down 3.88% in 24 hours, but its 7-day gain of 4.9% suggests a pause, not a crash.
It’s a familiar pattern for some coins, but not all.
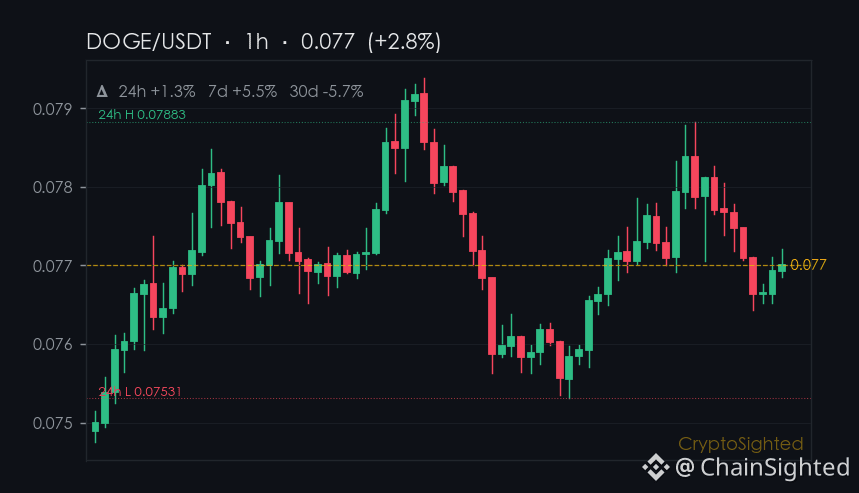
$DOGE, for instance, is up 1.22% in 24 hours, but down 10.8% over 30 days - a short-term rally on a long-term slide.
MORPHO’s move comes against a backdrop of a 30-day decline of 0.7%, showing a mix of near-term weakness and longer-term stability.
Not financial advice. DYOR.
📌 Hotspot Watch · #96 · #CryptoTrends #CryptoSighted $MORPHO
↓3.88%
MORPHO is down 3.88% in 24 hours, but its 7-day gain of 4.9% suggests a pause, not a crash.
It’s a familiar pattern for some coins, but not all.
$DOGE , for instance, is up 1.22% in 24 hours, but down 10.8% over 30 days - a short-term rally on a long-term slide.
MORPHO’s move comes against a backdrop of a 30-day decline of 0.7%, showing a mix of near-term weakness and longer-term stability.
Not financial advice. DYOR.
📌 Hotspot Watch · #96 · #CryptoTrends #CryptoSighted $MORPHO
MORPHO is down 3.88% in 24 hours, but its 7-day gain of 4.9% suggests a pause, not a crash.
It’s a familiar pattern for some coins, but not all.
$DOGE , for instance, is up 1.22% in 24 hours, but down 10.8% over 30 days - a short-term rally on a long-term slide.
MORPHO’s move comes against a backdrop of a 30-day decline of 0.7%, showing a mix of near-term weakness and longer-term stability.
Not financial advice. DYOR.
📌 Hotspot Watch · #96 · #CryptoTrends #CryptoSighted $MORPHO
20

·
--
$LIT This 30-day run is up 21%, but the last 7 days gave back 7%, and today it’s down another 3.66%. The issue isn’t how much it’s risen—it’s where the money came from, and how long it can last.
The real signal in the market lies in the trading volume. On July 2nd and 7th, $LIT ’s single-day trading volume surged to 150 million, and the price even touched $2.57. But afterward, volume kept shrinking steadily to the current 30 million level. The price is still around $2.17, but liquidity has clearly been ebbing. This isn’t a “buy the dip” signal—it’s a typical feature of a capital-driven rally entering a digestion phase.
What I care about more is that $LIT is still 72% away from its all-time high of $7.86, sitting at rank #96 with a market cap just over $500 million. At this level, nobody will treat it like a blue chip. Yet in 30 days it rose from $1.73 to $2.68, which suggests there was indeed a burst of narrative-driven capital pushing it forward. The question now is: the money hasn’t disappeared into thin air—it may be waiting for the next catalyst, or waiting for a better entry price to come back.
What really needs to be confirmed is whether the $2.11 24h low can hold if trading volume continues to hover around 30 million. If it can’t hold, the foundation of the 30-day gains will weaken. Then the sidelined will keep waiting, and holders will start figuring out whether they’re in profit or trapped at a loss.
If you’re watching $LIT, are you seeing any on-chain clues or capital-flow changes that are supporting your view? Feel free to add details—I’m only seeing volume and price on the chart doing the talking.
$LIT This 30-day run is up 21%, but the last 7 days gave back 7%, and today it’s down another 3.66%. The issue isn’t how much it’s risen—it’s where the money came from, and how long it can last.
The real signal in the market lies in the trading volume. On July 2nd and 7th, $LIT ’s single-day trading volume surged to 150 million, and the price even touched $2.57. But afterward, volume kept shrinking steadily to the current 30 million level. The price is still around $2.17, but liquidity has clearly been ebbing. This isn’t a “buy the dip” signal—it’s a typical feature of a capital-driven rally entering a digestion phase.
What I care about more is that $LIT is still 72% away from its all-time high of $7.86, sitting at rank #96 with a market cap just over $500 million. At this level, nobody will treat it like a blue chip. Yet in 30 days it rose from $1.73 to $2.68, which suggests there was indeed a burst of narrative-driven capital pushing it forward. The question now is: the money hasn’t disappeared into thin air—it may be waiting for the next catalyst, or waiting for a better entry price to come back.
What really needs to be confirmed is whether the $2.11 24h low can hold if trading volume continues to hover around 30 million. If it can’t hold, the foundation of the 30-day gains will weaken. Then the sidelined will keep waiting, and holders will start figuring out whether they’re in profit or trapped at a loss.
If you’re watching $LIT , are you seeing any on-chain clues or capital-flow changes that are supporting your view? Feel free to add details—I’m only seeing volume and price on the chart doing the talking.
The real signal in the market lies in the trading volume. On July 2nd and 7th, $LIT ’s single-day trading volume surged to 150 million, and the price even touched $2.57. But afterward, volume kept shrinking steadily to the current 30 million level. The price is still around $2.17, but liquidity has clearly been ebbing. This isn’t a “buy the dip” signal—it’s a typical feature of a capital-driven rally entering a digestion phase.
What I care about more is that $LIT is still 72% away from its all-time high of $7.86, sitting at rank #96 with a market cap just over $500 million. At this level, nobody will treat it like a blue chip. Yet in 30 days it rose from $1.73 to $2.68, which suggests there was indeed a burst of narrative-driven capital pushing it forward. The question now is: the money hasn’t disappeared into thin air—it may be waiting for the next catalyst, or waiting for a better entry price to come back.
What really needs to be confirmed is whether the $2.11 24h low can hold if trading volume continues to hover around 30 million. If it can’t hold, the foundation of the 30-day gains will weaken. Then the sidelined will keep waiting, and holders will start figuring out whether they’re in profit or trapped at a loss.
If you’re watching $LIT , are you seeing any on-chain clues or capital-flow changes that are supporting your view? Feel free to add details—I’m only seeing volume and price on the chart doing the talking.
69

·
--
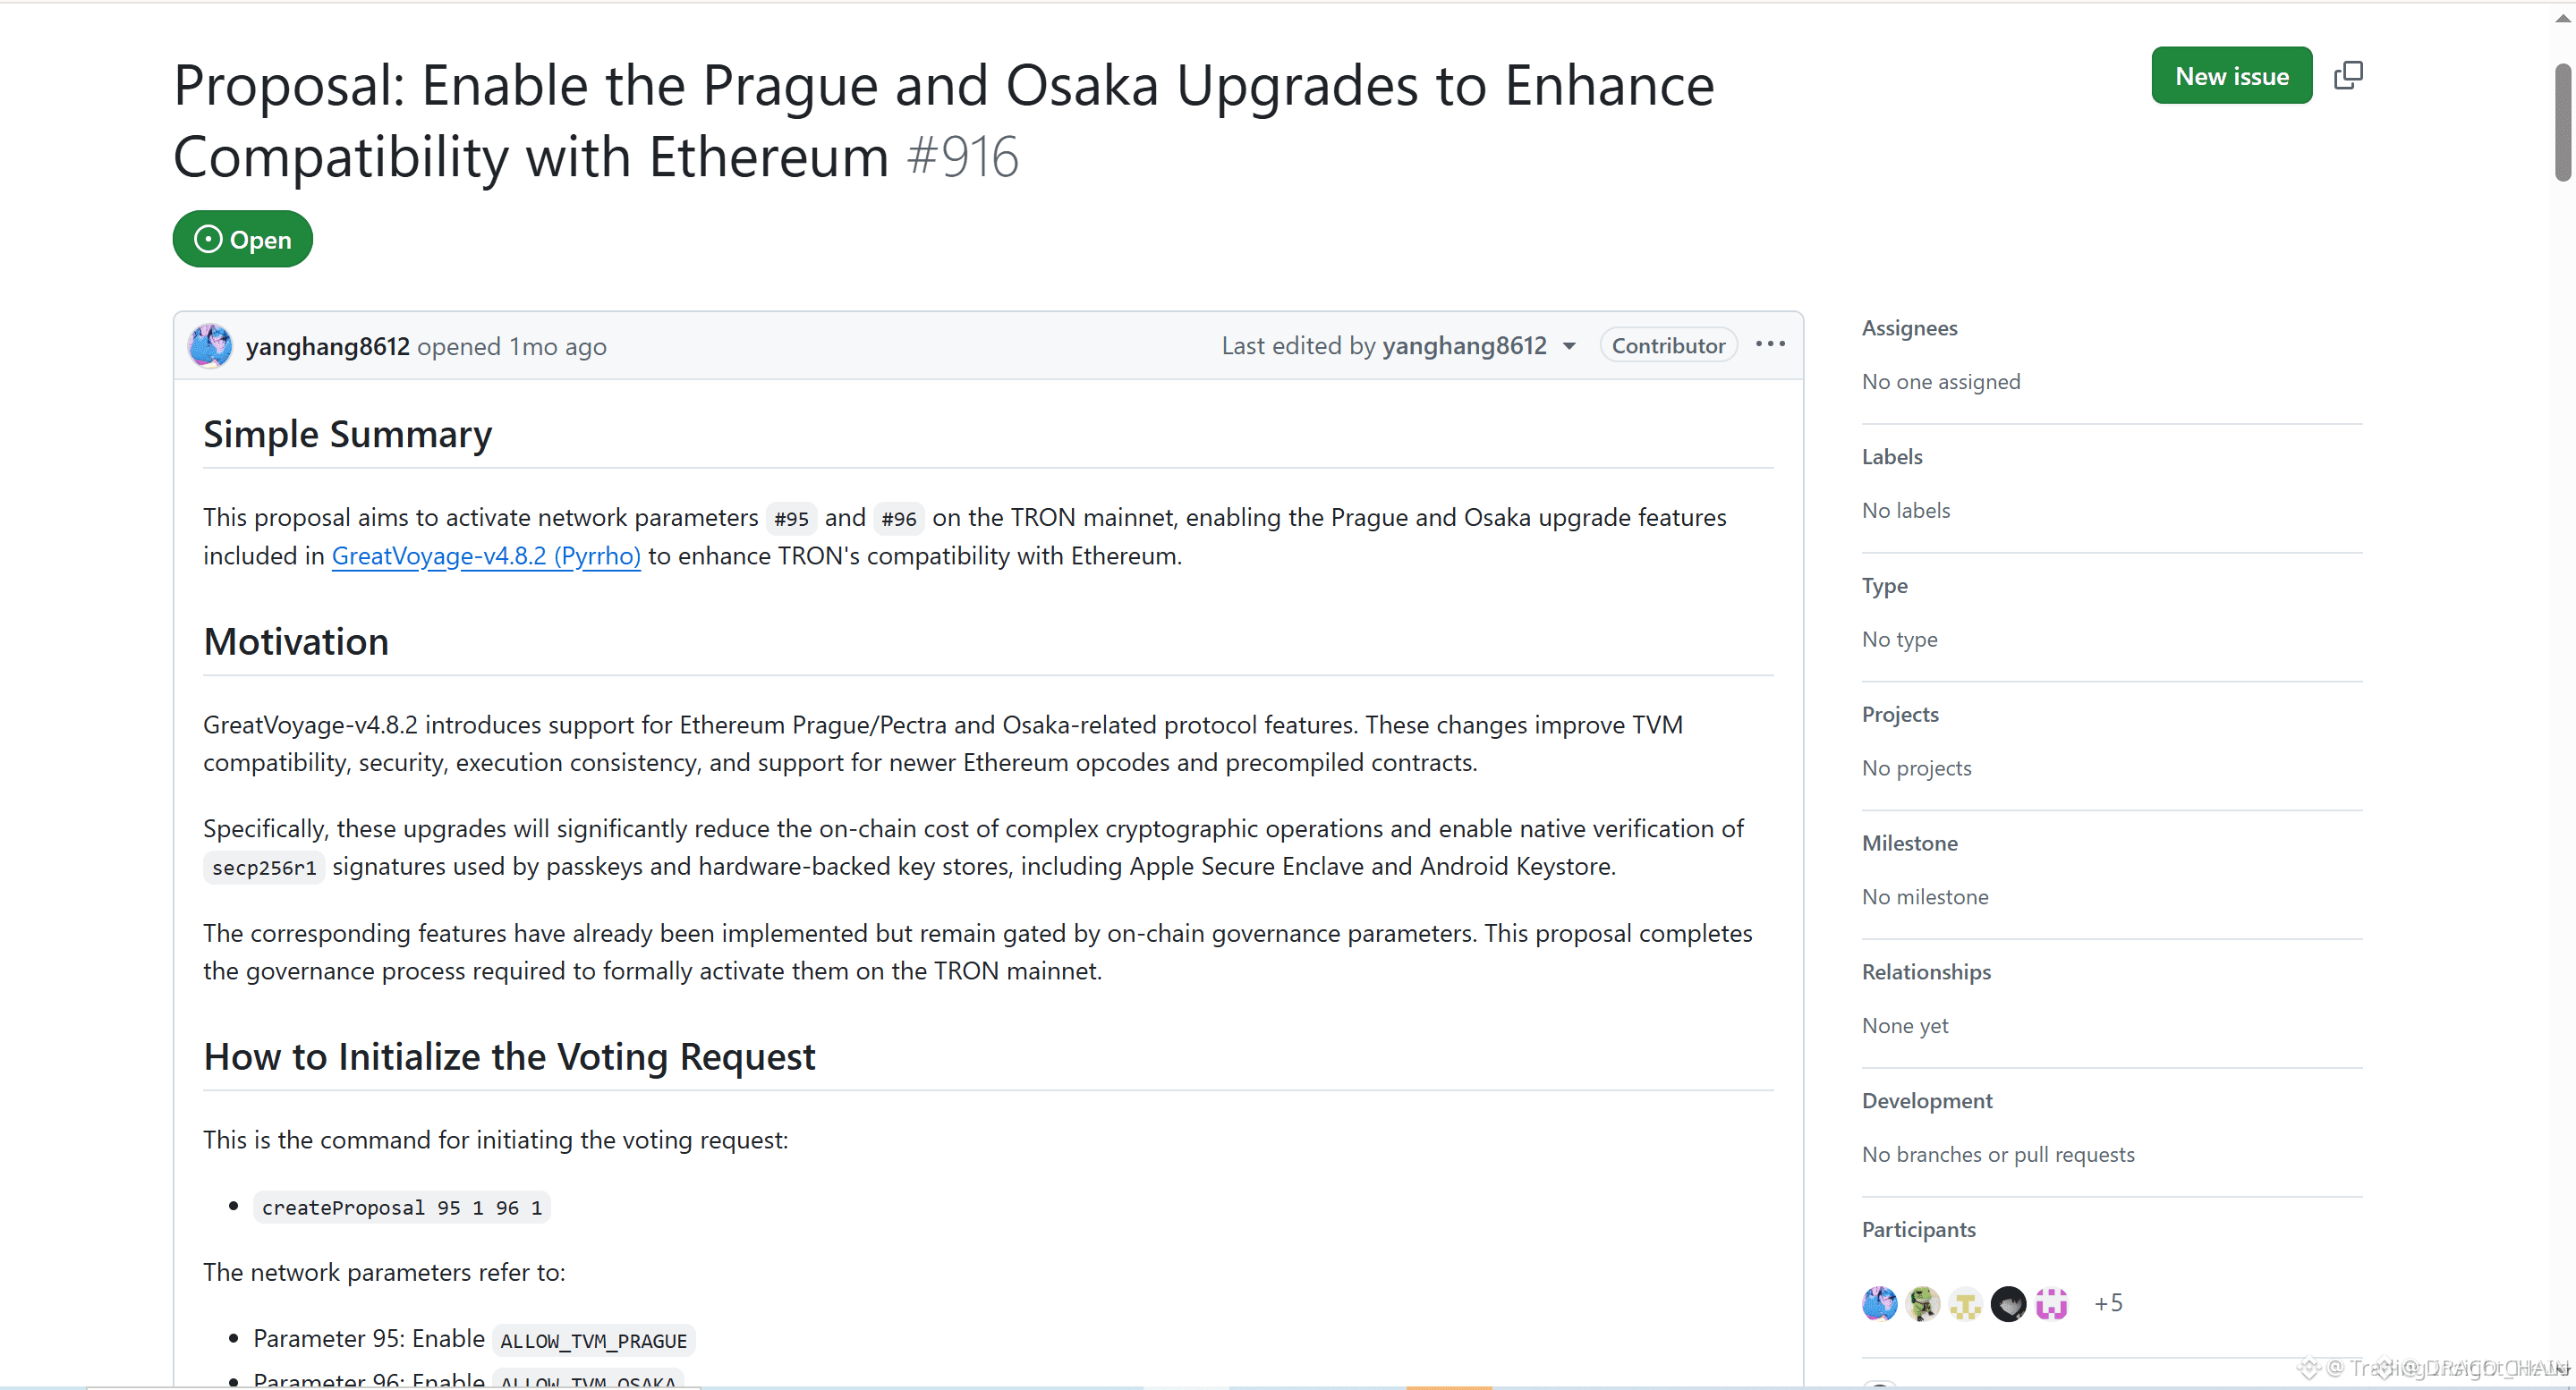
🚨 $TRX ALIGNS WITH ETHEREUM EVM STANDARDS IN MAJOR UPGRADE PROPOSAL! ⚡
The TRON community is voting on parameters #95 and #96 to activate Prague and Osaka execution features on August 25. 📊 By bridging the architectural gap with the Ethereum Virtual Machine, $TRX is systematically lowering structural friction for cross-chain capital and dApp deployments.
This upgrade enhances TVM infrastructure while maintaining high-throughput efficiency, reinforcing long-term network utility. 💡 As institutional liquidity seeks multi-chain expansion, aligning execution environments creates a powerful foundation for ecosystem order flow. 💬 Will EVM parity accelerate developer migration toward $TRX or remain a neutral structural pivot? 👇
⚠️ Not financial advice. Always manage your risk. 🛡️
🏷️ #TRX #TRON #Ethereum #Layer1 #Crypto
🎯 ⚡
🚨 $TRX ALIGNS WITH ETHEREUM EVM STANDARDS IN MAJOR UPGRADE PROPOSAL! ⚡
The TRON community is voting on parameters #95 and #96 to activate Prague and Osaka execution features on August 25. 📊 By bridging the architectural gap with the Ethereum Virtual Machine, $TRX is systematically lowering structural friction for cross-chain capital and dApp deployments.
This upgrade enhances TVM infrastructure while maintaining high-throughput efficiency, reinforcing long-term network utility. 💡 As institutional liquidity seeks multi-chain expansion, aligning execution environments creates a powerful foundation for ecosystem order flow. 💬 Will EVM parity accelerate developer migration toward $TRX or remain a neutral structural pivot? 👇
⚠️ Not financial advice. Always manage your risk. 🛡️
🏷️ #TRX #TRON #Ethereum #Layer1 #Crypto
🎯 ⚡
The TRON community is voting on parameters #95 and #96 to activate Prague and Osaka execution features on August 25. 📊 By bridging the architectural gap with the Ethereum Virtual Machine, $TRX is systematically lowering structural friction for cross-chain capital and dApp deployments.
This upgrade enhances TVM infrastructure while maintaining high-throughput efficiency, reinforcing long-term network utility. 💡 As institutional liquidity seeks multi-chain expansion, aligning execution environments creates a powerful foundation for ecosystem order flow. 💬 Will EVM parity accelerate developer migration toward $TRX or remain a neutral structural pivot? 👇
⚠️ Not financial advice. Always manage your risk. 🛡️
🏷️ #TRX #TRON #Ethereum #Layer1 #Crypto
🎯 ⚡
34
·
--
$VVV 24 hours is up 0.52%, which looks like sideways consolidation. But what really caught my attention is not this slight rise, but the fact that it’s up 8.10% over 7 days while still down 17.52% over 30 days. This isn’t a simple “small gain” signal; it’s the rhythm of funds tentatively buying in and then being pushed back down.
From the 30-day trend, $VVV fell all the way from 14.25 on June 20 to 10.57 on July 13, only rebounding to 11.71 in the last few days. Trading volume did not expand noticeably during the rebound; the latest 20.12M volume is far lower than the 70.5M on July 2. What does that mean? The rebound is not driven by active buying, but by temporary easing of selling pressure. The price has dropped 47.70% from its ATH of 22.58, and filling that hole will require sustained follow-through, not occasional letting go.
What I care more about is that the market cap rank is #96, which means market attention is still there, but the capital structure is loose. If volume cannot stay above 30M in the next few days, this rebound will only be a bear trap.
For current holders, the most awkward question is not whether to cut losses, but whether to add while watching the price recover from the bottom, fearing this is just a bear-market continuation. Those waiting on the sidelines are looking for a volume-confirmed breakout above 12, but by the time that signal appears, the upside may already be limited.
So here’s the question: if volume remains sluggish and $VVV continues to probe lower, do you think it’s capital fleeing, or big money quietly accumulating? Which variable is most likely to overturn my judgment?
$VVV 24 hours is up 0.52%, which looks like sideways consolidation. But what really caught my attention is not this slight rise, but the fact that it’s up 8.10% over 7 days while still down 17.52% over 30 days. This isn’t a simple “small gain” signal; it’s the rhythm of funds tentatively buying in and then being pushed back down.
From the 30-day trend, $VVV fell all the way from 14.25 on June 20 to 10.57 on July 13, only rebounding to 11.71 in the last few days. Trading volume did not expand noticeably during the rebound; the latest 20.12M volume is far lower than the 70.5M on July 2. What does that mean? The rebound is not driven by active buying, but by temporary easing of selling pressure. The price has dropped 47.70% from its ATH of 22.58, and filling that hole will require sustained follow-through, not occasional letting go.
What I care more about is that the market cap rank is #96, which means market attention is still there, but the capital structure is loose. If volume cannot stay above 30M in the next few days, this rebound will only be a bear trap.
For current holders, the most awkward question is not whether to cut losses, but whether to add while watching the price recover from the bottom, fearing this is just a bear-market continuation. Those waiting on the sidelines are looking for a volume-confirmed breakout above 12, but by the time that signal appears, the upside may already be limited.
So here’s the question: if volume remains sluggish and $VVV continues to probe lower, do you think it’s capital fleeing, or big money quietly accumulating? Which variable is most likely to overturn my judgment?
From the 30-day trend, $VVV fell all the way from 14.25 on June 20 to 10.57 on July 13, only rebounding to 11.71 in the last few days. Trading volume did not expand noticeably during the rebound; the latest 20.12M volume is far lower than the 70.5M on July 2. What does that mean? The rebound is not driven by active buying, but by temporary easing of selling pressure. The price has dropped 47.70% from its ATH of 22.58, and filling that hole will require sustained follow-through, not occasional letting go.
What I care more about is that the market cap rank is #96, which means market attention is still there, but the capital structure is loose. If volume cannot stay above 30M in the next few days, this rebound will only be a bear trap.
For current holders, the most awkward question is not whether to cut losses, but whether to add while watching the price recover from the bottom, fearing this is just a bear-market continuation. Those waiting on the sidelines are looking for a volume-confirmed breakout above 12, but by the time that signal appears, the upside may already be limited.
So here’s the question: if volume remains sluggish and $VVV continues to probe lower, do you think it’s capital fleeing, or big money quietly accumulating? Which variable is most likely to overturn my judgment?
76
·
--
$LIT At this spot, the most uncomfortable thing for a gap-chaser is this: it rose 24% in 30 days, but over the past week it has been stuck between $2.0 and $2.3, while trading volume has shrunk from the $150M level at the beginning of July down to the $20M range. If you chase it, you’re afraid it will shrink its volume and pull back to $2.0—maybe even lower—grinding your unrealized gains into misery; if you don’t chase, you’re afraid that on some day it will suddenly see a volume spike and rip a new candle, leaving you completely stuck outside the next leg.
The real thing that needs confirmation isn’t the price direction—it’s what liquidity is waiting for. In the 30-day chart, that $150M volume spike on July 2 was executed around $2.07. After that, price pushed up to $2.68, but volume never managed to keep up again, suggesting that round of smart money was distributing rather than adding. At the $2.16 level now, the trading volume is under $40M—down 70% versus the peak. If there isn’t new narrative or fresh buying power here, the probability of a downward tilt in the chop isn’t low.
But with a market cap rank of #96 and a $540M float—still 72% down from ATH—it’s clear it has gone through a full cycle. This kind of coin tends to have beta-type upside elasticity when the broader market recovers, provided that volume rises back above $50M and holds, and that it firmly establishes above $2.3. If volume continues to contract, the psychological level at $2.0 may not hold.
A multiple-choice question, based on your risk appetite: if over the next week $LIT continues to grind between $2.0 and $2.2 and the average daily trading volume stays below $35M, would you choose to start building a position with 1/3 first, or wait until it breaks below $2.0 before considering entry?
$LIT At this spot, the most uncomfortable thing for a gap-chaser is this: it rose 24% in 30 days, but over the past week it has been stuck between $2.0 and $2.3, while trading volume has shrunk from the $150M level at the beginning of July down to the $20M range. If you chase it, you’re afraid it will shrink its volume and pull back to $2.0—maybe even lower—grinding your unrealized gains into misery; if you don’t chase, you’re afraid that on some day it will suddenly see a volume spike and rip a new candle, leaving you completely stuck outside the next leg.
The real thing that needs confirmation isn’t the price direction—it’s what liquidity is waiting for. In the 30-day chart, that $150M volume spike on July 2 was executed around $2.07. After that, price pushed up to $2.68, but volume never managed to keep up again, suggesting that round of smart money was distributing rather than adding. At the $2.16 level now, the trading volume is under $40M—down 70% versus the peak. If there isn’t new narrative or fresh buying power here, the probability of a downward tilt in the chop isn’t low.
But with a market cap rank of #96 and a $540M float—still 72% down from ATH—it’s clear it has gone through a full cycle. This kind of coin tends to have beta-type upside elasticity when the broader market recovers, provided that volume rises back above $50M and holds, and that it firmly establishes above $2.3. If volume continues to contract, the psychological level at $2.0 may not hold.
A multiple-choice question, based on your risk appetite: if over the next week $LIT continues to grind between $2.0 and $2.2 and the average daily trading volume stays below $35M, would you choose to start building a position with 1/3 first, or wait until it breaks below $2.0 before considering entry?
The real thing that needs confirmation isn’t the price direction—it’s what liquidity is waiting for. In the 30-day chart, that $150M volume spike on July 2 was executed around $2.07. After that, price pushed up to $2.68, but volume never managed to keep up again, suggesting that round of smart money was distributing rather than adding. At the $2.16 level now, the trading volume is under $40M—down 70% versus the peak. If there isn’t new narrative or fresh buying power here, the probability of a downward tilt in the chop isn’t low.
But with a market cap rank of #96 and a $540M float—still 72% down from ATH—it’s clear it has gone through a full cycle. This kind of coin tends to have beta-type upside elasticity when the broader market recovers, provided that volume rises back above $50M and holds, and that it firmly establishes above $2.3. If volume continues to contract, the psychological level at $2.0 may not hold.
A multiple-choice question, based on your risk appetite: if over the next week $LIT continues to grind between $2.0 and $2.2 and the average daily trading volume stays below $35M, would you choose to start building a position with 1/3 first, or wait until it breaks below $2.0 before considering entry?
56

·
--
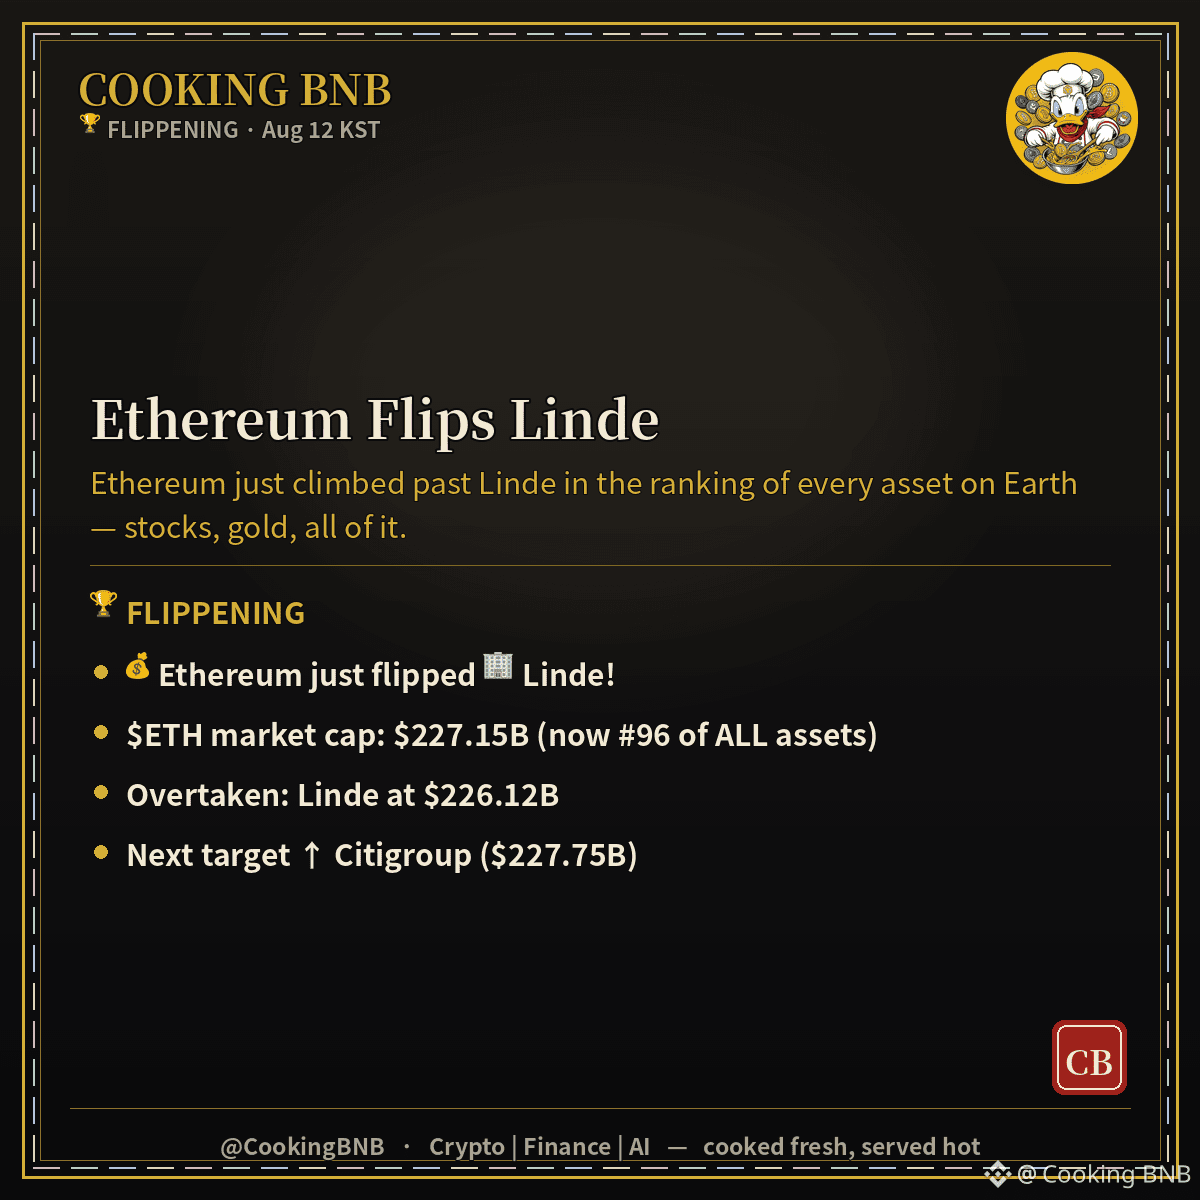
🏆 FLIPPENING
💰 Ethereum just flipped Linde!
$ETH $227.15B · now #96 of all assets
Passed Linde ($226.12B)
🍳 Crypto vs the whole world. Not financial advice.
#CookingBNB #Crypto #Bitcoin #BTC
🏆 FLIPPENING
💰 Ethereum just flipped Linde!
$ETH $227.15B · now #96 of all assets
Passed Linde ($226.12B)
🍳 Crypto vs the whole world. Not financial advice.
#CookingBNB #Crypto #Bitcoin #BTC
💰 Ethereum just flipped Linde!
$ETH $227.15B · now #96 of all assets
Passed Linde ($226.12B)
🍳 Crypto vs the whole world. Not financial advice.
#CookingBNB #Crypto #Bitcoin #BTC
6
Log in to explore more content
Join global crypto users on Binance Square
⚡️ Get latest and useful information about crypto.
💬 Trusted by the world’s largest crypto exchange.
👍 Discover real insights from verified creators.
Email / Phone number
Trending Topics
1
#BinanceLaunchesBinanceIntelligence
235,926 views
2,098 Discussing
2
#BitcoinTargets2026OpenAt$87570
0 views
2 Discussing
3
#BitcoinRejectedAt$87KThirdTime
0 views
20 Discussing
4
#StrategyMarketCapSurpassesRumble
0 views
0 Discussing
5
#StriveBuys2000BTCFor$169M
10,422 views
100 Discussing
6
#EvernorthXRPTreasuryCompletesSPACMerger
123,706 views
1,232 Discussing
7
#ADAGains10%Above$0.27
54,034 views
251 Discussing
8
#ETHUp70%InQ3ButLiquidityFalls
319,764 views
2,243 Discussing
9
#EthStakingExitQueueHits2026High
127,322 views
1,480 Discussing
10
#FedOctoberHoldOdds82.3%
136,868 views
1,411 Discussing