
#35
35
5,082 views
67 Discussing
Hot
Latest

·
--
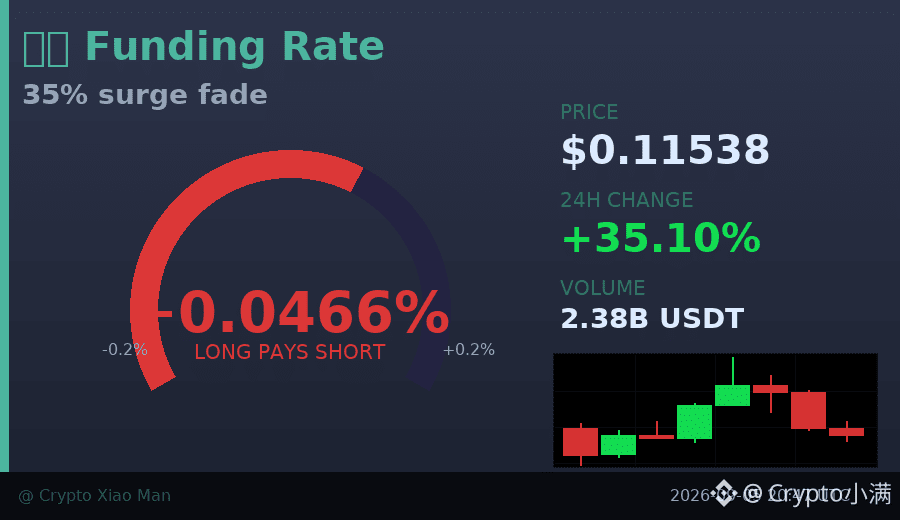
35% increase, trading volume surged to 238 million, but the hourly chart has already closed three consecutive bearish candles.
$牛来 This rally was very strong, surging from 0.08 all the way to 0.14, and the bulls are indeed in control. However, looking closely, volume started to shrink as it pulled back at higher levels, with the price retreating from 0.14 to around 0.115.
Bulls account for 55%, which is not extremely crowded. The funding rate of 0.046% is also still within a reasonable range, with no overheating signal.
The key is whether it can hold the 0.115 level next. If it continues to decline on shrinking volume, it may retest around 0.10 in the short term to look for support; if it can stabilize, there is still a chance to test the previous high again.
Chasing the rally should be done with caution; waiting for a clear stabilization signal is safer.
$牛来 #Meme行情 #35%涨幅
Click the small card below to quickly view the market👇
35% increase, trading volume surged to 238 million, but the hourly chart has already closed three consecutive bearish candles.
$牛来 This rally was very strong, surging from 0.08 all the way to 0.14, and the bulls are indeed in control. However, looking closely, volume started to shrink as it pulled back at higher levels, with the price retreating from 0.14 to around 0.115.
Bulls account for 55%, which is not extremely crowded. The funding rate of 0.046% is also still within a reasonable range, with no overheating signal.
The key is whether it can hold the 0.115 level next. If it continues to decline on shrinking volume, it may retest around 0.10 in the short term to look for support; if it can stabilize, there is still a chance to test the previous high again.
Chasing the rally should be done with caution; waiting for a clear stabilization signal is safer.
$牛来 #Meme行情 #35%涨幅
Click the small card below to quickly view the market👇
$牛来 This rally was very strong, surging from 0.08 all the way to 0.14, and the bulls are indeed in control. However, looking closely, volume started to shrink as it pulled back at higher levels, with the price retreating from 0.14 to around 0.115.
Bulls account for 55%, which is not extremely crowded. The funding rate of 0.046% is also still within a reasonable range, with no overheating signal.
The key is whether it can hold the 0.115 level next. If it continues to decline on shrinking volume, it may retest around 0.10 in the short term to look for support; if it can stabilize, there is still a chance to test the previous high again.
Chasing the rally should be done with caution; waiting for a clear stabilization signal is safer.
$牛来 #Meme行情 #35%涨幅
Click the small card below to quickly view the market👇
22
·
--
Behind the 35% surge, are funds quietly pulling out?
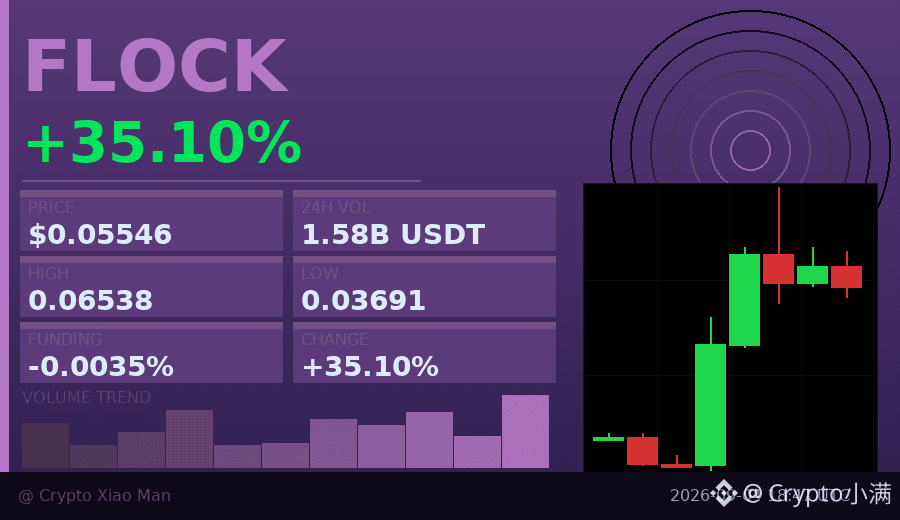
FLOCK surged to 0.05546 today, with trading volume expanding to $158 million, making the bulls look strong. But on closer inspection, the funding rate is negative at -0.00354%, which means that although more traders are going long (57% longs), not many are actually willing to pay interest to hold those positions.
The trend over the past 8 hours was indeed strong, climbing from 0.037 all the way to a high of 0.065, before pulling back to around 0.055 now. This combination of price-volume divergence and a negative funding rate is often a sign of short-term overheating—be careful chasing the rally.
$FLOCK #资金费率背离 #35%
Click the small card below to quickly check the market👇
Behind the 35% surge, are funds quietly pulling out?
FLOCK surged to 0.05546 today, with trading volume expanding to $158 million, making the bulls look strong. But on closer inspection, the funding rate is negative at -0.00354%, which means that although more traders are going long (57% longs), not many are actually willing to pay interest to hold those positions.
The trend over the past 8 hours was indeed strong, climbing from 0.037 all the way to a high of 0.065, before pulling back to around 0.055 now. This combination of price-volume divergence and a negative funding rate is often a sign of short-term overheating—be careful chasing the rally.
$FLOCK #资金费率背离 #35%
Click the small card below to quickly check the market👇
FLOCK surged to 0.05546 today, with trading volume expanding to $158 million, making the bulls look strong. But on closer inspection, the funding rate is negative at -0.00354%, which means that although more traders are going long (57% longs), not many are actually willing to pay interest to hold those positions.
The trend over the past 8 hours was indeed strong, climbing from 0.037 all the way to a high of 0.065, before pulling back to around 0.055 now. This combination of price-volume divergence and a negative funding rate is often a sign of short-term overheating—be careful chasing the rally.
$FLOCK #资金费率背离 #35%
Click the small card below to quickly check the market👇
27
·
--
A 35% rise, but 60% of positions are still short — this is a classic short squeeze.
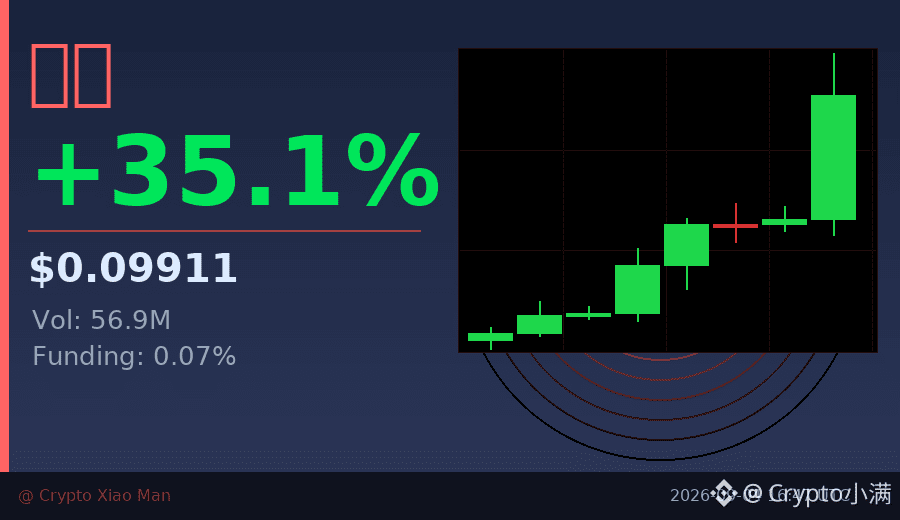
Lobster rallied from 0.071 to 0.099 today, with three consecutive bullish hourly candles, and the last one showed a clear increase in volume. Interestingly, despite the strong price action, the long/short ratio shows that 62% of traders are still holding short positions.
What does this mean? When most people are betting on a decline, any buying pressure can trigger a chain of liquidations. The funding rate of 0.07% is positive, indicating that longs are paying to hold positions, and market sentiment is shifting rapidly.
Key observation: if it breaks above the previous high of 0.102, short covering could accelerate the move higher. Conversely, if it falls back below 0.085, profit-taking by longs will create pressure.
$Lobster #轧空行情 #35%
Click the small card below to quickly check the market👇
A 35% rise, but 60% of positions are still short — this is a classic short squeeze.
Lobster rallied from 0.071 to 0.099 today, with three consecutive bullish hourly candles, and the last one showed a clear increase in volume. Interestingly, despite the strong price action, the long/short ratio shows that 62% of traders are still holding short positions.
What does this mean? When most people are betting on a decline, any buying pressure can trigger a chain of liquidations. The funding rate of 0.07% is positive, indicating that longs are paying to hold positions, and market sentiment is shifting rapidly.
Key observation: if it breaks above the previous high of 0.102, short covering could accelerate the move higher. Conversely, if it falls back below 0.085, profit-taking by longs will create pressure.
$Lobster #轧空行情 #35%
Click the small card below to quickly check the market👇
Lobster rallied from 0.071 to 0.099 today, with three consecutive bullish hourly candles, and the last one showed a clear increase in volume. Interestingly, despite the strong price action, the long/short ratio shows that 62% of traders are still holding short positions.
What does this mean? When most people are betting on a decline, any buying pressure can trigger a chain of liquidations. The funding rate of 0.07% is positive, indicating that longs are paying to hold positions, and market sentiment is shifting rapidly.
Key observation: if it breaks above the previous high of 0.102, short covering could accelerate the move higher. Conversely, if it falls back below 0.085, profit-taking by longs will create pressure.
$Lobster #轧空行情 #35%
Click the small card below to quickly check the market👇
38

·
--
Reached 81,223$ — while the market is up 4%, why aren’t we still talking about the “dip”?Bittensor (TAOUSDT) is trending right now!
Rank: #35
81,223 $ when I woke up one morning, a glow lit up on the screen. A %4.09 rise and a 1.57 bn USDT volume essentially buried the “dip” call in silence. Shocking, right? In my view, this isn’t just a “pump”; it’s also a “sell-the-news” trap. Most traders buy while saying “up,” but I still see $ in the “risk-off” zone. First, let’s look at $: the price at 2,640 $ rose by 5.42% to reach a 1.12 bn USDT volume. Ethereum’s Layer-2 solutions and the new “sharding” roadmap may give a “moon” signal in the short term, but to me it still carries an “overbought” risk. I think this rally is a preview of the next wave of the smart contract ecosystem, but it’s also a “re-entry” opportunity. As for the top movers, AVAX jumped to the 9.07 $ level with a 13.46% gain. That’s an indicator of new DeFi projects in the Avalanche ecosystem and “cross-chain” liquidity flow. At the same time, SOL rose to 111.69 $ with a 5.69% increase; Solana’s “Sealevel” update and the uptick in NFT demand could trigger a short-term “ape-in” wave. XRP came in at 1.4285 $ after a 7.92% rise, and ATOM also climbed by 7.24% to 1.762 $. These three are the initials of the “alt-coin rally” in a “risk-on” atmosphere. Now, let’s make a data-driven decision: in the last 24 hours, the 4–5% rise in $ and $ brought along a 30% increase in total volume. That’s a sign that “institutional” buying flow is still ongoing. But at the same time, “stop-
Reached 81,223$ — while the market is up 4%, why aren’t we still talking about the “dip”?
Bittensor (TAOUSDT) is trending right now!
Rank: #35
81,223 $ when I woke up one morning, a glow lit up on the screen. A %4.09 rise and a 1.57 bn USDT volume essentially buried the “dip” call in silence. Shocking, right? In my view, this isn’t just a “pump”; it’s also a “sell-the-news” trap. Most traders buy while saying “up,” but I still see $ in the “risk-off” zone. First, let’s look at $: the price at 2,640 $ rose by 5.42% to reach a 1.12 bn USDT volume. Ethereum’s Layer-2 solutions and the new “sharding” roadmap may give a “moon” signal in the short term, but to me it still carries an “overbought” risk. I think this rally is a preview of the next wave of the smart contract ecosystem, but it’s also a “re-entry” opportunity. As for the top movers, AVAX jumped to the 9.07 $ level with a 13.46% gain. That’s an indicator of new DeFi projects in the Avalanche ecosystem and “cross-chain” liquidity flow. At the same time, SOL rose to 111.69 $ with a 5.69% increase; Solana’s “Sealevel” update and the uptick in NFT demand could trigger a short-term “ape-in” wave. XRP came in at 1.4285 $ after a 7.92% rise, and ATOM also climbed by 7.24% to 1.762 $. These three are the initials of the “alt-coin rally” in a “risk-on” atmosphere. Now, let’s make a data-driven decision: in the last 24 hours, the 4–5% rise in $ and $ brought along a 30% increase in total volume. That’s a sign that “institutional” buying flow is still ongoing. But at the same time, “stop-
Rank: #35
81,223 $ when I woke up one morning, a glow lit up on the screen. A %4.09 rise and a 1.57 bn USDT volume essentially buried the “dip” call in silence. Shocking, right? In my view, this isn’t just a “pump”; it’s also a “sell-the-news” trap. Most traders buy while saying “up,” but I still see $ in the “risk-off” zone. First, let’s look at $: the price at 2,640 $ rose by 5.42% to reach a 1.12 bn USDT volume. Ethereum’s Layer-2 solutions and the new “sharding” roadmap may give a “moon” signal in the short term, but to me it still carries an “overbought” risk. I think this rally is a preview of the next wave of the smart contract ecosystem, but it’s also a “re-entry” opportunity. As for the top movers, AVAX jumped to the 9.07 $ level with a 13.46% gain. That’s an indicator of new DeFi projects in the Avalanche ecosystem and “cross-chain” liquidity flow. At the same time, SOL rose to 111.69 $ with a 5.69% increase; Solana’s “Sealevel” update and the uptick in NFT demand could trigger a short-term “ape-in” wave. XRP came in at 1.4285 $ after a 7.92% rise, and ATOM also climbed by 7.24% to 1.762 $. These three are the initials of the “alt-coin rally” in a “risk-on” atmosphere. Now, let’s make a data-driven decision: in the last 24 hours, the 4–5% rise in $ and $ brought along a 30% increase in total volume. That’s a sign that “institutional” buying flow is still ongoing. But at the same time, “stop-
32

·
--
$PENDLE This 15m move was pulled quite decisively—volume is at 2.44x, and the Wave Volatility Z value is 4.02. It directly broke through the upper edge of the past ~20 5m bars.
What’s interesting, though, is the OI: on both the 15m and 1h timeframes it’s slightly down, yet the nominal value actually rose by 1.4%+. Price is up while positions are decreasing—classic short-covering pushing the move forward; it’s not fresh long capital entering to build positions.
Active trade vs. expected is +16.5%, buy-sell ratio is 1.40, and the funding rate is still stuck in the recent high-percentile range. Short-term sentiment is a bit overheated—if you chase the price higher, be careful about getting “harvested” by a quick reversal.
Across the whole pool, the abnormal percentile is 90.7%. The nominal change ranks at #35, and depth is sufficient. In the past 24h, turnover is 43.9M— the market cap isn’t that large. A single big bullish candle or a single big bearish candle wouldn’t be hard.
First, see whether it can hold above this upper edge. If it can’t, then it’s just a failed breakout and a fill of the gap—done.
$PENDLE This 15m move was pulled quite decisively—volume is at 2.44x, and the Wave Volatility Z value is 4.02. It directly broke through the upper edge of the past ~20 5m bars.
What’s interesting, though, is the OI: on both the 15m and 1h timeframes it’s slightly down, yet the nominal value actually rose by 1.4%+. Price is up while positions are decreasing—classic short-covering pushing the move forward; it’s not fresh long capital entering to build positions.
Active trade vs. expected is +16.5%, buy-sell ratio is 1.40, and the funding rate is still stuck in the recent high-percentile range. Short-term sentiment is a bit overheated—if you chase the price higher, be careful about getting “harvested” by a quick reversal.
Across the whole pool, the abnormal percentile is 90.7%. The nominal change ranks at #35, and depth is sufficient. In the past 24h, turnover is 43.9M— the market cap isn’t that large. A single big bullish candle or a single big bearish candle wouldn’t be hard.
First, see whether it can hold above this upper edge. If it can’t, then it’s just a failed breakout and a fill of the gap—done.
What’s interesting, though, is the OI: on both the 15m and 1h timeframes it’s slightly down, yet the nominal value actually rose by 1.4%+. Price is up while positions are decreasing—classic short-covering pushing the move forward; it’s not fresh long capital entering to build positions.
Active trade vs. expected is +16.5%, buy-sell ratio is 1.40, and the funding rate is still stuck in the recent high-percentile range. Short-term sentiment is a bit overheated—if you chase the price higher, be careful about getting “harvested” by a quick reversal.
Across the whole pool, the abnormal percentile is 90.7%. The nominal change ranks at #35, and depth is sufficient. In the past 24h, turnover is 43.9M— the market cap isn’t that large. A single big bullish candle or a single big bearish candle wouldn’t be hard.
First, see whether it can hold above this upper edge. If it can’t, then it’s just a failed breakout and a fill of the gap—done.
35
·
--
$ETH This move has something to it.
The price only rose 0.15%, but the 15m trading volume directly jumped to 3.66x. In the past hour, OI increased by more than 200 million U, and the notional change is #1 across the whole pool. This is not something retail traders can create with just a couple of quick trades.
Structurally, it looks like price rising + OI increasing—typical of new leveraged long positions entering. Even though the buy-side aggressive execution gap is only 0.2%, the 5m Binance forced-liquidation proxy liquidated 2.11M USDT, and the buy direction is more concentrated—shorts are getting beaten up.
The abnormal percentile is 86.3%, ranking #35 in the whole pool, yet notional change is #1. What does that mean? The scale is large enough, but it’s not at extreme sentiment levels yet. In situations like this, it’s often not the top—it’s the night before the acceleration.
In 24h, trading volume is 9.2 billion, and liquidity is fine. Multiple consecutive cycles of abnormal OI are continuing, and depth confirms it.
Just watch for now—don’t rush in emotionally.
$ETH This move has something to it.
The price only rose 0.15%, but the 15m trading volume directly jumped to 3.66x. In the past hour, OI increased by more than 200 million U, and the notional change is #1 across the whole pool. This is not something retail traders can create with just a couple of quick trades.
Structurally, it looks like price rising + OI increasing—typical of new leveraged long positions entering. Even though the buy-side aggressive execution gap is only 0.2%, the 5m Binance forced-liquidation proxy liquidated 2.11M USDT, and the buy direction is more concentrated—shorts are getting beaten up.
The abnormal percentile is 86.3%, ranking #35 in the whole pool, yet notional change is #1. What does that mean? The scale is large enough, but it’s not at extreme sentiment levels yet. In situations like this, it’s often not the top—it’s the night before the acceleration.
In 24h, trading volume is 9.2 billion, and liquidity is fine. Multiple consecutive cycles of abnormal OI are continuing, and depth confirms it.
Just watch for now—don’t rush in emotionally.
The price only rose 0.15%, but the 15m trading volume directly jumped to 3.66x. In the past hour, OI increased by more than 200 million U, and the notional change is #1 across the whole pool. This is not something retail traders can create with just a couple of quick trades.
Structurally, it looks like price rising + OI increasing—typical of new leveraged long positions entering. Even though the buy-side aggressive execution gap is only 0.2%, the 5m Binance forced-liquidation proxy liquidated 2.11M USDT, and the buy direction is more concentrated—shorts are getting beaten up.
The abnormal percentile is 86.3%, ranking #35 in the whole pool, yet notional change is #1. What does that mean? The scale is large enough, but it’s not at extreme sentiment levels yet. In situations like this, it’s often not the top—it’s the night before the acceleration.
In 24h, trading volume is 9.2 billion, and liquidity is fine. Multiple consecutive cycles of abnormal OI are continuing, and depth confirms it.
Just watch for now—don’t rush in emotionally.
16
·
--
$MAGMA This move has some substance.
In 15m: it directly pulled up 2.98%, with volume reaching 3.18x. The Z value is 6.05, and the closing price broke above the top of the most recent 20 consecutive 5m intervals. This isn’t the kind of low-volume fake breakout—active trade flow difference is +11%, buy-sell ratio is 1.25, and buy orders are pushing.
More importantly is the OI (open interest): 1h +1.29%, 15m +0.81%. Price is rising along with open interest—classic signs of fresh leveraged long positions entering, not the “covering shorts” kind of false heat. The OI abnormal percentile is 95.2%; within the whole pool it ranks #11, and nominal change is #35, meaning this spike is also relatively high compared with the entire pool.
In the last 24h, turnover is only 6.48M, so the pool isn’t very deep. Pushing at this volume level is easier, but conversely, dumping down can be fast too.
It’s near a historical extreme zone—chase highs at your own discretion.
$MAGMA This move has some substance.
In 15m: it directly pulled up 2.98%, with volume reaching 3.18x. The Z value is 6.05, and the closing price broke above the top of the most recent 20 consecutive 5m intervals. This isn’t the kind of low-volume fake breakout—active trade flow difference is +11%, buy-sell ratio is 1.25, and buy orders are pushing.
More importantly is the OI (open interest): 1h +1.29%, 15m +0.81%. Price is rising along with open interest—classic signs of fresh leveraged long positions entering, not the “covering shorts” kind of false heat. The OI abnormal percentile is 95.2%; within the whole pool it ranks #11, and nominal change is #35, meaning this spike is also relatively high compared with the entire pool.
In the last 24h, turnover is only 6.48M, so the pool isn’t very deep. Pushing at this volume level is easier, but conversely, dumping down can be fast too.
It’s near a historical extreme zone—chase highs at your own discretion.
In 15m: it directly pulled up 2.98%, with volume reaching 3.18x. The Z value is 6.05, and the closing price broke above the top of the most recent 20 consecutive 5m intervals. This isn’t the kind of low-volume fake breakout—active trade flow difference is +11%, buy-sell ratio is 1.25, and buy orders are pushing.
More importantly is the OI (open interest): 1h +1.29%, 15m +0.81%. Price is rising along with open interest—classic signs of fresh leveraged long positions entering, not the “covering shorts” kind of false heat. The OI abnormal percentile is 95.2%; within the whole pool it ranks #11, and nominal change is #35, meaning this spike is also relatively high compared with the entire pool.
In the last 24h, turnover is only 6.48M, so the pool isn’t very deep. Pushing at this volume level is easier, but conversely, dumping down can be fast too.
It’s near a historical extreme zone—chase highs at your own discretion.
7
·
--
$REZ This move is a bit interesting.
In 15m, it surged directly by 2.79%. The trading volume reached 2.25 times the normal level, with a Z value of 3.94—this isn’t just some random little shake-up volume.
The key is that OI is rising at the same time—15m +1.46%, 1h +2.62%. Nominal change adds up to over 600k U. Price is up, positions are up—this looks like incremental leveraged long entry, not something like shorts covering to push price up.
Active trade imbalance is 29.3%, buy/sell ratio 1.83, and the buy-side is clearly pushing. At the close, it also broke above the high of the last ~20 consecutive 5m candles.
In the whole pool’s abnormal ranking, it’s #35, and nominal change is #31. It’s not the most explosive tier, but the depth confirmation is solid: volume, price levels, and direction all line up.
Over the past 24h, turnover is 76M. The pool isn’t small either. Such abnormal activity is worth watching to see whether it can hold and stay above the breakout level afterward. Whether to chase or not is up to you, but at least the structure right now is leaning bullish.
$REZ This move is a bit interesting.
In 15m, it surged directly by 2.79%. The trading volume reached 2.25 times the normal level, with a Z value of 3.94—this isn’t just some random little shake-up volume.
The key is that OI is rising at the same time—15m +1.46%, 1h +2.62%. Nominal change adds up to over 600k U. Price is up, positions are up—this looks like incremental leveraged long entry, not something like shorts covering to push price up.
Active trade imbalance is 29.3%, buy/sell ratio 1.83, and the buy-side is clearly pushing. At the close, it also broke above the high of the last ~20 consecutive 5m candles.
In the whole pool’s abnormal ranking, it’s #35, and nominal change is #31. It’s not the most explosive tier, but the depth confirmation is solid: volume, price levels, and direction all line up.
Over the past 24h, turnover is 76M. The pool isn’t small either. Such abnormal activity is worth watching to see whether it can hold and stay above the breakout level afterward. Whether to chase or not is up to you, but at least the structure right now is leaning bullish.
In 15m, it surged directly by 2.79%. The trading volume reached 2.25 times the normal level, with a Z value of 3.94—this isn’t just some random little shake-up volume.
The key is that OI is rising at the same time—15m +1.46%, 1h +2.62%. Nominal change adds up to over 600k U. Price is up, positions are up—this looks like incremental leveraged long entry, not something like shorts covering to push price up.
Active trade imbalance is 29.3%, buy/sell ratio 1.83, and the buy-side is clearly pushing. At the close, it also broke above the high of the last ~20 consecutive 5m candles.
In the whole pool’s abnormal ranking, it’s #35, and nominal change is #31. It’s not the most explosive tier, but the depth confirmation is solid: volume, price levels, and direction all line up.
Over the past 24h, turnover is 76M. The pool isn’t small either. Such abnormal activity is worth watching to see whether it can hold and stay above the breakout level afterward. Whether to chase or not is up to you, but at least the structure right now is leaning bullish.
10

·
--
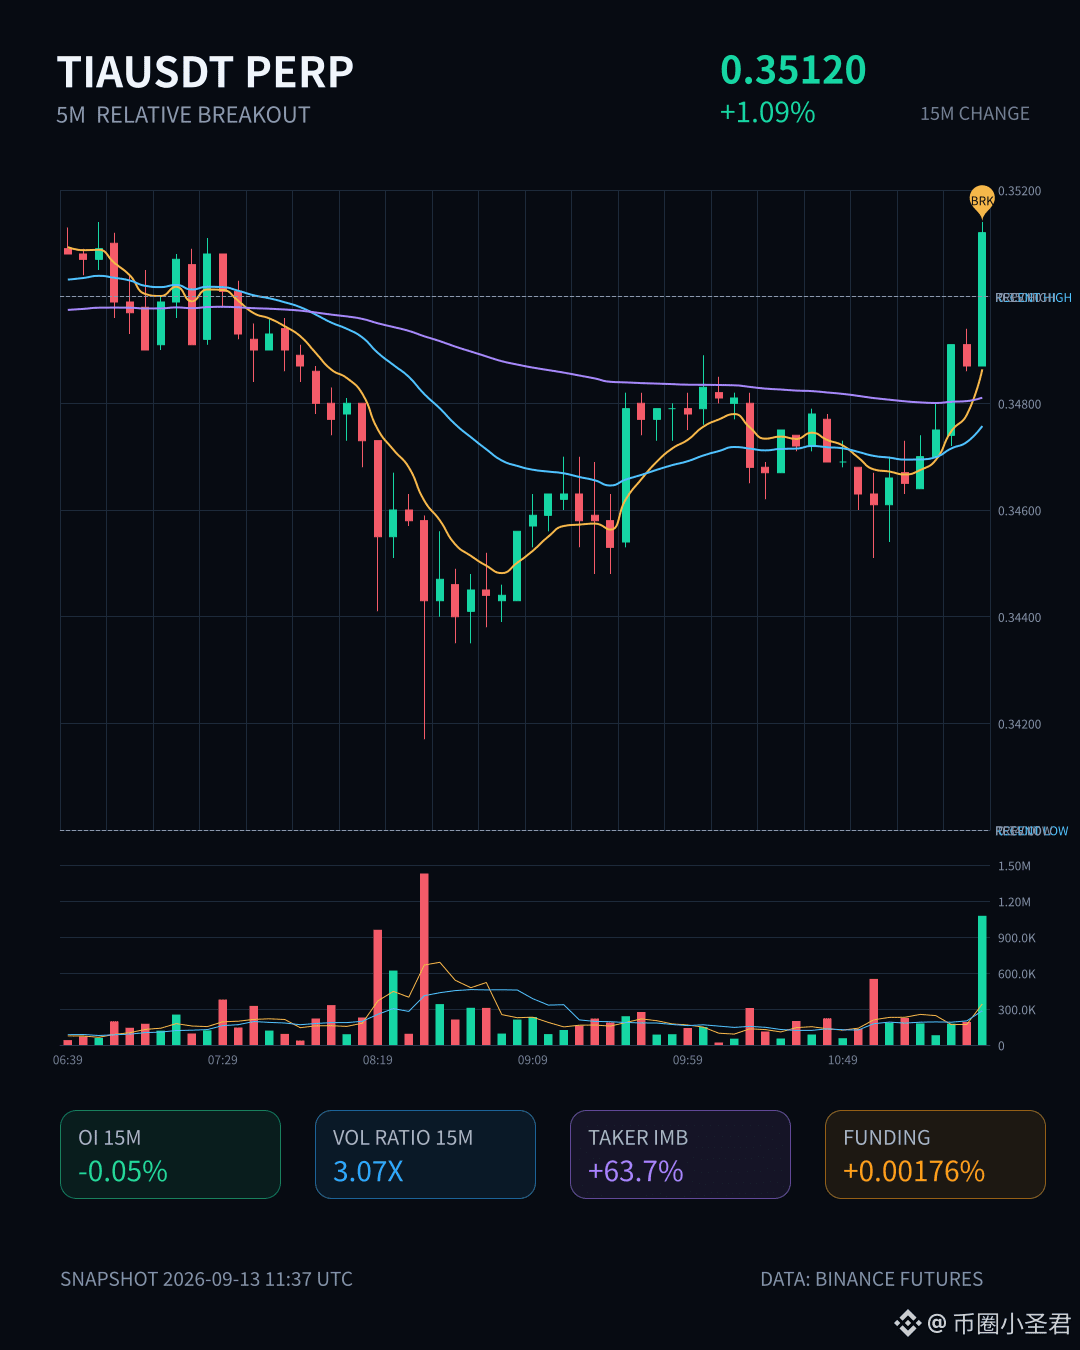
$TIA In these 15 minutes, it was pulled a bit aggressively—the volume directly hit 3x, with a Z-score of 3.13, already at one of the rarest volatility levels lately.
What’s interesting, though, is that OI—the 15m contract—actually dipped slightly by 0.05%, while 1h is only barely up by +0.15%. When price gets pushed upward, positions don’t stack alongside it. This structure looks more like shorts are being squeezed into covering rather than fresh long positions piling in big. Passive-to-active fill imbalance is worse by 63.7%, the buy/sell ratio is 4.51, and the direction is extremely clear. Even breaking above the upper bound of the recent 20 consecutive 5m ranges can be seen as a trigger signal.
The pool’s abnormal percentile is 97%, ranking at #9; nominal change is #35. It has been continuing across several consecutive cycles—so it doesn’t look like a one-off needle move. 24h trading value is 17.54M; the base isn’t especially thick, so it’s easy to pull it up, but you also have to be careful about how quickly pullbacks can happen when liquidity is thin.
With short-covering driving it, positions are shrinking while price is surging. If you chase this kind of structure, you need to watch OI closely—only if OI starts moving up in sync does the nature of the move change. Right now it looks more like a short washout, not confirmation of a new trend.
$TIA In these 15 minutes, it was pulled a bit aggressively—the volume directly hit 3x, with a Z-score of 3.13, already at one of the rarest volatility levels lately.
What’s interesting, though, is that OI—the 15m contract—actually dipped slightly by 0.05%, while 1h is only barely up by +0.15%. When price gets pushed upward, positions don’t stack alongside it. This structure looks more like shorts are being squeezed into covering rather than fresh long positions piling in big. Passive-to-active fill imbalance is worse by 63.7%, the buy/sell ratio is 4.51, and the direction is extremely clear. Even breaking above the upper bound of the recent 20 consecutive 5m ranges can be seen as a trigger signal.
The pool’s abnormal percentile is 97%, ranking at #9; nominal change is #35. It has been continuing across several consecutive cycles—so it doesn’t look like a one-off needle move. 24h trading value is 17.54M; the base isn’t especially thick, so it’s easy to pull it up, but you also have to be careful about how quickly pullbacks can happen when liquidity is thin.
With short-covering driving it, positions are shrinking while price is surging. If you chase this kind of structure, you need to watch OI closely—only if OI starts moving up in sync does the nature of the move change. Right now it looks more like a short washout, not confirmation of a new trend.
What’s interesting, though, is that OI—the 15m contract—actually dipped slightly by 0.05%, while 1h is only barely up by +0.15%. When price gets pushed upward, positions don’t stack alongside it. This structure looks more like shorts are being squeezed into covering rather than fresh long positions piling in big. Passive-to-active fill imbalance is worse by 63.7%, the buy/sell ratio is 4.51, and the direction is extremely clear. Even breaking above the upper bound of the recent 20 consecutive 5m ranges can be seen as a trigger signal.
The pool’s abnormal percentile is 97%, ranking at #9; nominal change is #35. It has been continuing across several consecutive cycles—so it doesn’t look like a one-off needle move. 24h trading value is 17.54M; the base isn’t especially thick, so it’s easy to pull it up, but you also have to be careful about how quickly pullbacks can happen when liquidity is thin.
With short-covering driving it, positions are shrinking while price is surging. If you chase this kind of structure, you need to watch OI closely—only if OI starts moving up in sync does the nature of the move change. Right now it looks more like a short washout, not confirmation of a new trend.
81
·
--
$RAYSOL This wave dropped 1.44% on the 15m, but what’s really worth watching is the OI: 15m -2.23%, 1h -2.20%, meaning the notional shrank by more than $640k. Price is down + OI is down—typical long deleveraging, not new shorts entering. The funding rate is still in a high percentile recently; the long positions that were squeezed earlier are cutting losses now. The buy/sell ratio is 0.85, with aggressive selling in control, but volume is only 1.04x—no volume surge panic; it looks more like stop-loss orders are being slowly absorbed. The notional change across the whole pool ranks #35, with an abnormal percentile of 88.9%; it has been shrinking for several consecutive cycles. This signal is more interesting than just looking at the downside move. Over the past 24h there’s still $490M in volume, so liquidity is fine—it’s just a matter of when this deleveraging wave stops.
$RAYSOL This wave dropped 1.44% on the 15m, but what’s really worth watching is the OI: 15m -2.23%, 1h -2.20%, meaning the notional shrank by more than $640k. Price is down + OI is down—typical long deleveraging, not new shorts entering. The funding rate is still in a high percentile recently; the long positions that were squeezed earlier are cutting losses now. The buy/sell ratio is 0.85, with aggressive selling in control, but volume is only 1.04x—no volume surge panic; it looks more like stop-loss orders are being slowly absorbed. The notional change across the whole pool ranks #35, with an abnormal percentile of 88.9%; it has been shrinking for several consecutive cycles. This signal is more interesting than just looking at the downside move. Over the past 24h there’s still $490M in volume, so liquidity is fine—it’s just a matter of when this deleveraging wave stops.
15

·
--
$MARSCOIN This move looks more like the bulls being lifted out.
15m down 1.40%, volume hasn’t expanded, but OI has been falling continuously—15m -1.72%, 1h -1.84%, notional shrank by 1.63M, and several consecutive cycles have been reducing positions. The aggressive trade gap is -22.8%, buy-sell ratio is 0.63. It’s getting slammed more than it’s being picked up, yet the price hasn’t collapsed—it’s just slowly bleeding out.
84.5% abnormal percentile, Pool #35 overall, notional change Pool #14. Over the past 24h, trading volume is 198M propping it up, and the depth isn’t too bad.
The issue is: when the longs delever, who’s taking the other side?
$MARSCOIN This move looks more like the bulls being lifted out.
15m down 1.40%, volume hasn’t expanded, but OI has been falling continuously—15m -1.72%, 1h -1.84%, notional shrank by 1.63M, and several consecutive cycles have been reducing positions. The aggressive trade gap is -22.8%, buy-sell ratio is 0.63. It’s getting slammed more than it’s being picked up, yet the price hasn’t collapsed—it’s just slowly bleeding out.
84.5% abnormal percentile, Pool #35 overall, notional change Pool #14. Over the past 24h, trading volume is 198M propping it up, and the depth isn’t too bad.
The issue is: when the longs delever, who’s taking the other side?
15m down 1.40%, volume hasn’t expanded, but OI has been falling continuously—15m -1.72%, 1h -1.84%, notional shrank by 1.63M, and several consecutive cycles have been reducing positions. The aggressive trade gap is -22.8%, buy-sell ratio is 0.63. It’s getting slammed more than it’s being picked up, yet the price hasn’t collapsed—it’s just slowly bleeding out.
84.5% abnormal percentile, Pool #35 overall, notional change Pool #14. Over the past 24h, trading volume is 198M propping it up, and the depth isn’t too bad.
The issue is: when the longs delever, who’s taking the other side?

21
·
--
$CHIP has something there.
In the 15m timeframe it rose 1.05%, and the volume surged straight to 1.96x. The Z value is 2.30, and the closing price has broken above the upper edge of the recent 20 consecutive 5m intervals. The OI data is even more interesting—on 15m, OI only increased by 0.08%, but in the 1h timeframe the notional change was 329K, up 2.92%. Together with the price moving upward, it looks more like fresh leveraged long positions are entering, not some kind of short-covering fake pump.
The active trade gap is 6.4%, buy-sell ratio is 1.14, and the order book is more buy-side. The funding rate is already at a recent high percentile, which suggests the long side sentiment is a bit crowded—chasing higher, be careful.
Abnormal activity within the whole pool ranks #18, notional change ranks #35, and the depth confirmation also passed—volume above normal, touching the boundary, and funding at a high level; all three conditions are met.
24h trading volume is 27.51M; the pool isn’t very thick. At this position, if someone starts taking profit, volatility could amplify. Watch it first—no rush to act.
$CHIP has something there.
In the 15m timeframe it rose 1.05%, and the volume surged straight to 1.96x. The Z value is 2.30, and the closing price has broken above the upper edge of the recent 20 consecutive 5m intervals. The OI data is even more interesting—on 15m, OI only increased by 0.08%, but in the 1h timeframe the notional change was 329K, up 2.92%. Together with the price moving upward, it looks more like fresh leveraged long positions are entering, not some kind of short-covering fake pump.
The active trade gap is 6.4%, buy-sell ratio is 1.14, and the order book is more buy-side. The funding rate is already at a recent high percentile, which suggests the long side sentiment is a bit crowded—chasing higher, be careful.
Abnormal activity within the whole pool ranks #18, notional change ranks #35, and the depth confirmation also passed—volume above normal, touching the boundary, and funding at a high level; all three conditions are met.
24h trading volume is 27.51M; the pool isn’t very thick. At this position, if someone starts taking profit, volatility could amplify. Watch it first—no rush to act.
In the 15m timeframe it rose 1.05%, and the volume surged straight to 1.96x. The Z value is 2.30, and the closing price has broken above the upper edge of the recent 20 consecutive 5m intervals. The OI data is even more interesting—on 15m, OI only increased by 0.08%, but in the 1h timeframe the notional change was 329K, up 2.92%. Together with the price moving upward, it looks more like fresh leveraged long positions are entering, not some kind of short-covering fake pump.
The active trade gap is 6.4%, buy-sell ratio is 1.14, and the order book is more buy-side. The funding rate is already at a recent high percentile, which suggests the long side sentiment is a bit crowded—chasing higher, be careful.
Abnormal activity within the whole pool ranks #18, notional change ranks #35, and the depth confirmation also passed—volume above normal, touching the boundary, and funding at a high level; all three conditions are met.
24h trading volume is 27.51M; the pool isn’t very thick. At this position, if someone starts taking profit, volatility could amplify. Watch it first—no rush to act.
13
·
--
$ATOM These 15 minutes seem a bit off.
The price is down 1.4%, volume has surged straight to 1.62 times the average, and the volatility Z hit 3.05—this isn’t the usual scale of wash-trading volume. More importantly, OI: both the 15m and 1h are rising, totaling about +0.3%, yet the notional size has actually shrunk by nearly 0.5 million USDT. The combination—price down, positions up, notional contracting—points very clearly to what’s happening: newly added leveraged short positions are entering the market, and this isn’t random, scattered retail trial-buying/selling; it’s abnormal activity that’s been continuing across multiple consecutive cycles.
At the 83.3rd percentile of anomalies, the whole pool ranks #27, with notional change at #35. A single coin moving into the top positions on both of these lists at the same time indicates this isn’t an isolated event. The 24h trading value is only 39.82M, the liquidity pool isn’t deep. With this level of active sell pressure pushing it down, the price elasticity will be very fragile.
Active成交差 (active trade imbalance) is -22.8%, and the buy/sell ratio is 0.63—bearish on the order book is extremely obvious. The 15m close has already broken below the lower bound of the range formed by the prior ~20 5m K-lines—meaning the base of that earlier consolidation structure has been punctured.
The key issue now is: the shorts are newly opened, and they’re still adding. As long as OI keeps rising and price keeps being pushed down, this is the formation of trend acceleration—not a mere wick. Conversely, if price holds sideways while OI starts to fall, that could mean the shorts are short-term cashing out, and then we’d need to reassess.
Don’t rush to catch at $ATOM . Wait until OI and price reveal which direction wins.
$ATOM These 15 minutes seem a bit off.
The price is down 1.4%, volume has surged straight to 1.62 times the average, and the volatility Z hit 3.05—this isn’t the usual scale of wash-trading volume. More importantly, OI: both the 15m and 1h are rising, totaling about +0.3%, yet the notional size has actually shrunk by nearly 0.5 million USDT. The combination—price down, positions up, notional contracting—points very clearly to what’s happening: newly added leveraged short positions are entering the market, and this isn’t random, scattered retail trial-buying/selling; it’s abnormal activity that’s been continuing across multiple consecutive cycles.
At the 83.3rd percentile of anomalies, the whole pool ranks #27, with notional change at #35. A single coin moving into the top positions on both of these lists at the same time indicates this isn’t an isolated event. The 24h trading value is only 39.82M, the liquidity pool isn’t deep. With this level of active sell pressure pushing it down, the price elasticity will be very fragile.
Active成交差 (active trade imbalance) is -22.8%, and the buy/sell ratio is 0.63—bearish on the order book is extremely obvious. The 15m close has already broken below the lower bound of the range formed by the prior ~20 5m K-lines—meaning the base of that earlier consolidation structure has been punctured.
The key issue now is: the shorts are newly opened, and they’re still adding. As long as OI keeps rising and price keeps being pushed down, this is the formation of trend acceleration—not a mere wick. Conversely, if price holds sideways while OI starts to fall, that could mean the shorts are short-term cashing out, and then we’d need to reassess.
Don’t rush to catch at $ATOM . Wait until OI and price reveal which direction wins.
The price is down 1.4%, volume has surged straight to 1.62 times the average, and the volatility Z hit 3.05—this isn’t the usual scale of wash-trading volume. More importantly, OI: both the 15m and 1h are rising, totaling about +0.3%, yet the notional size has actually shrunk by nearly 0.5 million USDT. The combination—price down, positions up, notional contracting—points very clearly to what’s happening: newly added leveraged short positions are entering the market, and this isn’t random, scattered retail trial-buying/selling; it’s abnormal activity that’s been continuing across multiple consecutive cycles.
At the 83.3rd percentile of anomalies, the whole pool ranks #27, with notional change at #35. A single coin moving into the top positions on both of these lists at the same time indicates this isn’t an isolated event. The 24h trading value is only 39.82M, the liquidity pool isn’t deep. With this level of active sell pressure pushing it down, the price elasticity will be very fragile.
Active成交差 (active trade imbalance) is -22.8%, and the buy/sell ratio is 0.63—bearish on the order book is extremely obvious. The 15m close has already broken below the lower bound of the range formed by the prior ~20 5m K-lines—meaning the base of that earlier consolidation structure has been punctured.
The key issue now is: the shorts are newly opened, and they’re still adding. As long as OI keeps rising and price keeps being pushed down, this is the formation of trend acceleration—not a mere wick. Conversely, if price holds sideways while OI starts to fall, that could mean the shorts are short-term cashing out, and then we’d need to reassess.
Don’t rush to catch at $ATOM . Wait until OI and price reveal which direction wins.
6
·
--
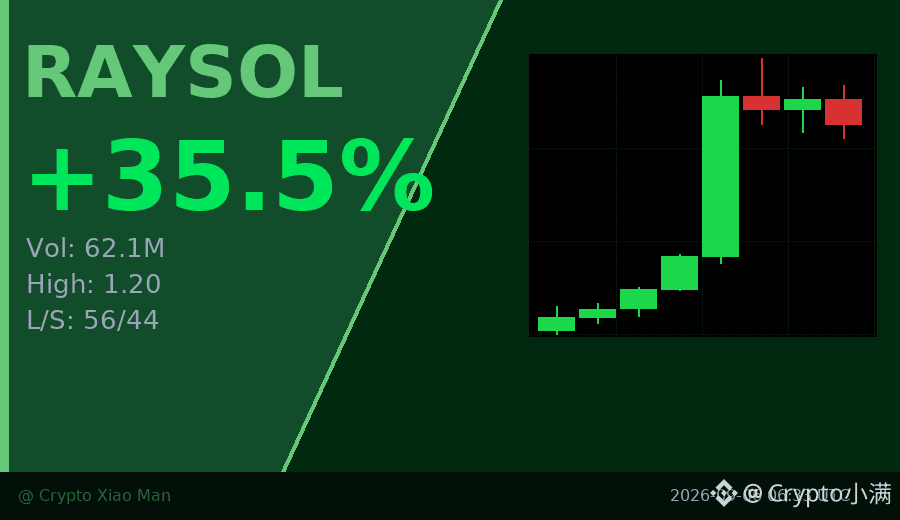
Behind the 35% surge, trading volume is the real signal.
RAYSOL has moved very steadily over the past 8 hours — starting from 0.89, peaking at 1.20, and now holding around 1.12. What stands out most is the volume: during the breakout, hourly volume surged to 17 million U, more than 10 times normal, showing this wasn’t an empty pump.
The funding rate is only 0.00027, and the long/short ratio is 56% to 44%, so sentiment isn’t extreme. This kind of post-breakout sideways consolidation is more worth watching than blindly chasing the rally.
The key is whether 1.10 can hold. If it does, the structure remains intact.
$RAYSOL #放量突破 #35%
Click the small card below to quickly check the market👇
Behind the 35% surge, trading volume is the real signal.
RAYSOL has moved very steadily over the past 8 hours — starting from 0.89, peaking at 1.20, and now holding around 1.12. What stands out most is the volume: during the breakout, hourly volume surged to 17 million U, more than 10 times normal, showing this wasn’t an empty pump.
The funding rate is only 0.00027, and the long/short ratio is 56% to 44%, so sentiment isn’t extreme. This kind of post-breakout sideways consolidation is more worth watching than blindly chasing the rally.
The key is whether 1.10 can hold. If it does, the structure remains intact.
$RAYSOL #放量突破 #35%
Click the small card below to quickly check the market👇
RAYSOL has moved very steadily over the past 8 hours — starting from 0.89, peaking at 1.20, and now holding around 1.12. What stands out most is the volume: during the breakout, hourly volume surged to 17 million U, more than 10 times normal, showing this wasn’t an empty pump.
The funding rate is only 0.00027, and the long/short ratio is 56% to 44%, so sentiment isn’t extreme. This kind of post-breakout sideways consolidation is more worth watching than blindly chasing the rally.
The key is whether 1.10 can hold. If it does, the structure remains intact.
$RAYSOL #放量突破 #35%
Click the small card below to quickly check the market👇
65

·
--
Bullish
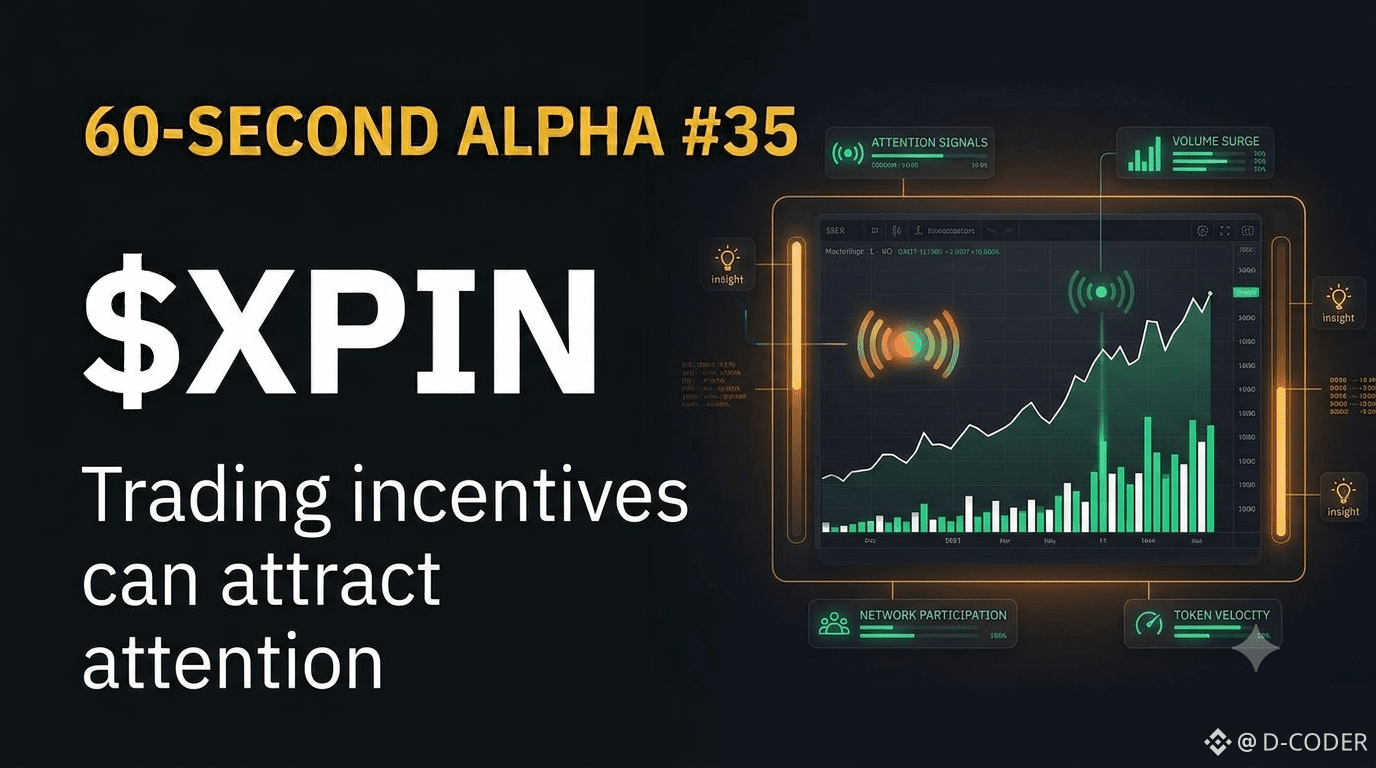
60-SECOND ALPHA #35 | $XPIN
$XPIN is currently featured on Binance Alpha, and Binance has launched a dedicated trading competition for the token with a $200K reward pool. The first competition period runs from September 4 to September 11.
That creates an important lesson about market attention: campaigns and incentives can temporarily increase trading activity, but increased activity alone doesn’t prove long-term adoption.
Alpha: Volume can tell you where attention is. It cannot tell you whether that attention will last.
{future}(XPINUSDT)
60-SECOND ALPHA #35 | $XPIN
$XPIN is currently featured on Binance Alpha, and Binance has launched a dedicated trading competition for the token with a $200K reward pool. The first competition period runs from September 4 to September 11.
That creates an important lesson about market attention: campaigns and incentives can temporarily increase trading activity, but increased activity alone doesn’t prove long-term adoption.
Alpha: Volume can tell you where attention is. It cannot tell you whether that attention will last.
$XPIN is currently featured on Binance Alpha, and Binance has launched a dedicated trading competition for the token with a $200K reward pool. The first competition period runs from September 4 to September 11.
That creates an important lesson about market attention: campaigns and incentives can temporarily increase trading activity, but increased activity alone doesn’t prove long-term adoption.
Alpha: Volume can tell you where attention is. It cannot tell you whether that attention will last.
222
·
--
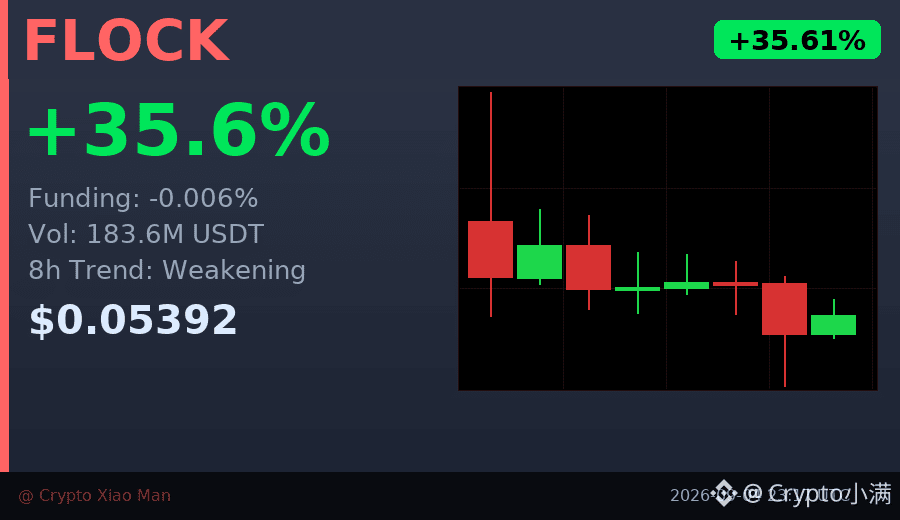
A 35% increase, but the funding rate is negative?
FLOCK surged 35.61% today, with trading volume of $184 million, which looks strong. But looking closely, the funding rate is -0.006%, which means longs weren’t paying a premium—something rarely seen in a sharp rally.
Over the past 8 hours, the candlestick trend has actually been weakening, and the long-side share at 59% isn’t extreme either. This kind of situation—prices rising but funding not following—often signals that short-term momentum is running out.
I’m not saying it’s about to drop immediately, but this divergence is worth watching. Before chasing the move, ask yourself: if this is a temporary top, can I accept that?
$FLOCK #资金费率背离 #35%
Click the small card below to quickly check the market👇
A 35% increase, but the funding rate is negative?
FLOCK surged 35.61% today, with trading volume of $184 million, which looks strong. But looking closely, the funding rate is -0.006%, which means longs weren’t paying a premium—something rarely seen in a sharp rally.
Over the past 8 hours, the candlestick trend has actually been weakening, and the long-side share at 59% isn’t extreme either. This kind of situation—prices rising but funding not following—often signals that short-term momentum is running out.
I’m not saying it’s about to drop immediately, but this divergence is worth watching. Before chasing the move, ask yourself: if this is a temporary top, can I accept that?
$FLOCK #资金费率背离 #35%
Click the small card below to quickly check the market👇
FLOCK surged 35.61% today, with trading volume of $184 million, which looks strong. But looking closely, the funding rate is -0.006%, which means longs weren’t paying a premium—something rarely seen in a sharp rally.
Over the past 8 hours, the candlestick trend has actually been weakening, and the long-side share at 59% isn’t extreme either. This kind of situation—prices rising but funding not following—often signals that short-term momentum is running out.
I’m not saying it’s about to drop immediately, but this divergence is worth watching. Before chasing the move, ask yourself: if this is a temporary top, can I accept that?
$FLOCK #资金费率背离 #35%
Click the small card below to quickly check the market👇
48
·
--
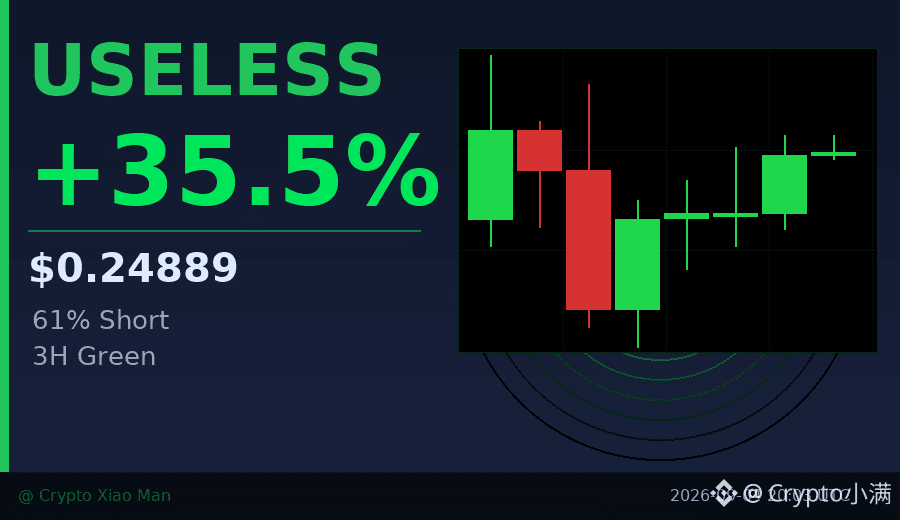
Behind the 35% surge, short sellers may be getting squeezed into covering their positions.
USELESS rose 35.51% in the past 24 hours, with trading volume reaching 915 million USDT, but position data shows that 61% of traders are holding short positions. As the price keeps climbing, there are more shorts than longs—this kind of divergence often means shorts are being squeezed.
The hourly chart has posted three consecutive bullish candles, and there are no obvious signs of buying power fading. When most people are bearish but the price keeps rising, the market is speaking with real money.
$USELESS #空头挤压 #35%
Click the small card below to quickly view the market👇
Behind the 35% surge, short sellers may be getting squeezed into covering their positions.
USELESS rose 35.51% in the past 24 hours, with trading volume reaching 915 million USDT, but position data shows that 61% of traders are holding short positions. As the price keeps climbing, there are more shorts than longs—this kind of divergence often means shorts are being squeezed.
The hourly chart has posted three consecutive bullish candles, and there are no obvious signs of buying power fading. When most people are bearish but the price keeps rising, the market is speaking with real money.
$USELESS #空头挤压 #35%
Click the small card below to quickly view the market👇
USELESS rose 35.51% in the past 24 hours, with trading volume reaching 915 million USDT, but position data shows that 61% of traders are holding short positions. As the price keeps climbing, there are more shorts than longs—this kind of divergence often means shorts are being squeezed.
The hourly chart has posted three consecutive bullish candles, and there are no obvious signs of buying power fading. When most people are bearish but the price keeps rising, the market is speaking with real money.
$USELESS #空头挤压 #35%
Click the small card below to quickly view the market👇
7
·
--
$T This drop is a bit downright decisive. In just 15 minutes, it’s down -3.63%. Trading volume is amplified to nearly 10 times the usual level, and the price has also fallen below the lower bound of the range formed by about 20 five-minute K-lines. More importantly—OI is declining in tandem. The 15-minute contract’s notional position has shrunk by -277K, and the 1-hour position has also been shrinking. This combination of price falling plus position cutting isn’t a crash scenario conjured out of thin air; it looks more like longs are being forced into stop-losses and deleveraging.
Anomalous activity from across the whole pool has crowded into #35, with notional changes ranking at #25. Aggressive matching is down -14.6%, and the buy/sell ratio is 0.75. In the order book, the shorts haven’t held back either—it feels like they’re just pressing down relentlessly.
Anyone wondering whether you can buy the dip? For now, don’t treat the absence of a “violent rebound” as a fact yet. A decline on shrinking volume could mean panic-driven clearance, but it could also be the prelude to a weakening trend. Let the bullets fly for a little while longer.
$T This drop is a bit downright decisive. In just 15 minutes, it’s down -3.63%. Trading volume is amplified to nearly 10 times the usual level, and the price has also fallen below the lower bound of the range formed by about 20 five-minute K-lines. More importantly—OI is declining in tandem. The 15-minute contract’s notional position has shrunk by -277K, and the 1-hour position has also been shrinking. This combination of price falling plus position cutting isn’t a crash scenario conjured out of thin air; it looks more like longs are being forced into stop-losses and deleveraging.
Anomalous activity from across the whole pool has crowded into #35, with notional changes ranking at #25. Aggressive matching is down -14.6%, and the buy/sell ratio is 0.75. In the order book, the shorts haven’t held back either—it feels like they’re just pressing down relentlessly.
Anyone wondering whether you can buy the dip? For now, don’t treat the absence of a “violent rebound” as a fact yet. A decline on shrinking volume could mean panic-driven clearance, but it could also be the prelude to a weakening trend. Let the bullets fly for a little while longer.
Anomalous activity from across the whole pool has crowded into #35, with notional changes ranking at #25. Aggressive matching is down -14.6%, and the buy/sell ratio is 0.75. In the order book, the shorts haven’t held back either—it feels like they’re just pressing down relentlessly.
Anyone wondering whether you can buy the dip? For now, don’t treat the absence of a “violent rebound” as a fact yet. A decline on shrinking volume could mean panic-driven clearance, but it could also be the prelude to a weakening trend. Let the bullets fly for a little while longer.
88
·
--
$COLLECT This 15-minute move directly -2.29%. At the close, it even broke through the lower edge of nearly 20 five-minute K-bars 😬 Volume expanded 4x, Z-score 2.32—this isn’t ordinary slow bleeding; someone is actually dumping.
The key is the on-chain leverage data—hourly OI nominal change is -537K (-5.64%), but the 15-minute contract OI is slightly up instead. Combined with aggressive trade imbalance of -36.4% and a buy/sell ratio of only 0.47, the shorts are actively adding positions and driving it down. This is the classic “price falling, OI rising” pattern: it means newly added leveraged shorts are participating actively—not retail getting forced into passive liquidation.
The abnormal percentile across the whole pool is 96.6%, ranking 8th. The nominal change also surged into #35. This is an extreme signal confirmed across multiple cycles; it can’t be explained by just one or two isolated abnormal K-lines.
In 24 hours the order book is only 8.18M. With liquidity like this, capital moves with very high efficiency. The follow-through for the short-term direction needs to be taken seriously. $COLLECT is currently deviating from the near-range boundary. The short-side volume is still building momentum. Whether the next 15 minutes can reclaim above the moving average is crucial. If the bounce lacks strength, keep watching for further extension of the lower end of the range. If volume manages to engulf back upward, this kind of extreme short setup could also face a squeeze and counterattack. Discipline first—don’t rush to bottom-pick and don’t chase the order 📉
$COLLECT This 15-minute move directly -2.29%. At the close, it even broke through the lower edge of nearly 20 five-minute K-bars 😬 Volume expanded 4x, Z-score 2.32—this isn’t ordinary slow bleeding; someone is actually dumping.
The key is the on-chain leverage data—hourly OI nominal change is -537K (-5.64%), but the 15-minute contract OI is slightly up instead. Combined with aggressive trade imbalance of -36.4% and a buy/sell ratio of only 0.47, the shorts are actively adding positions and driving it down. This is the classic “price falling, OI rising” pattern: it means newly added leveraged shorts are participating actively—not retail getting forced into passive liquidation.
The abnormal percentile across the whole pool is 96.6%, ranking 8th. The nominal change also surged into #35. This is an extreme signal confirmed across multiple cycles; it can’t be explained by just one or two isolated abnormal K-lines.
In 24 hours the order book is only 8.18M. With liquidity like this, capital moves with very high efficiency. The follow-through for the short-term direction needs to be taken seriously. $COLLECT is currently deviating from the near-range boundary. The short-side volume is still building momentum. Whether the next 15 minutes can reclaim above the moving average is crucial. If the bounce lacks strength, keep watching for further extension of the lower end of the range. If volume manages to engulf back upward, this kind of extreme short setup could also face a squeeze and counterattack. Discipline first—don’t rush to bottom-pick and don’t chase the order 📉
The key is the on-chain leverage data—hourly OI nominal change is -537K (-5.64%), but the 15-minute contract OI is slightly up instead. Combined with aggressive trade imbalance of -36.4% and a buy/sell ratio of only 0.47, the shorts are actively adding positions and driving it down. This is the classic “price falling, OI rising” pattern: it means newly added leveraged shorts are participating actively—not retail getting forced into passive liquidation.
The abnormal percentile across the whole pool is 96.6%, ranking 8th. The nominal change also surged into #35. This is an extreme signal confirmed across multiple cycles; it can’t be explained by just one or two isolated abnormal K-lines.
In 24 hours the order book is only 8.18M. With liquidity like this, capital moves with very high efficiency. The follow-through for the short-term direction needs to be taken seriously. $COLLECT is currently deviating from the near-range boundary. The short-side volume is still building momentum. Whether the next 15 minutes can reclaim above the moving average is crucial. If the bounce lacks strength, keep watching for further extension of the lower end of the range. If volume manages to engulf back upward, this kind of extreme short setup could also face a squeeze and counterattack. Discipline first—don’t rush to bottom-pick and don’t chase the order 📉
9


·
--
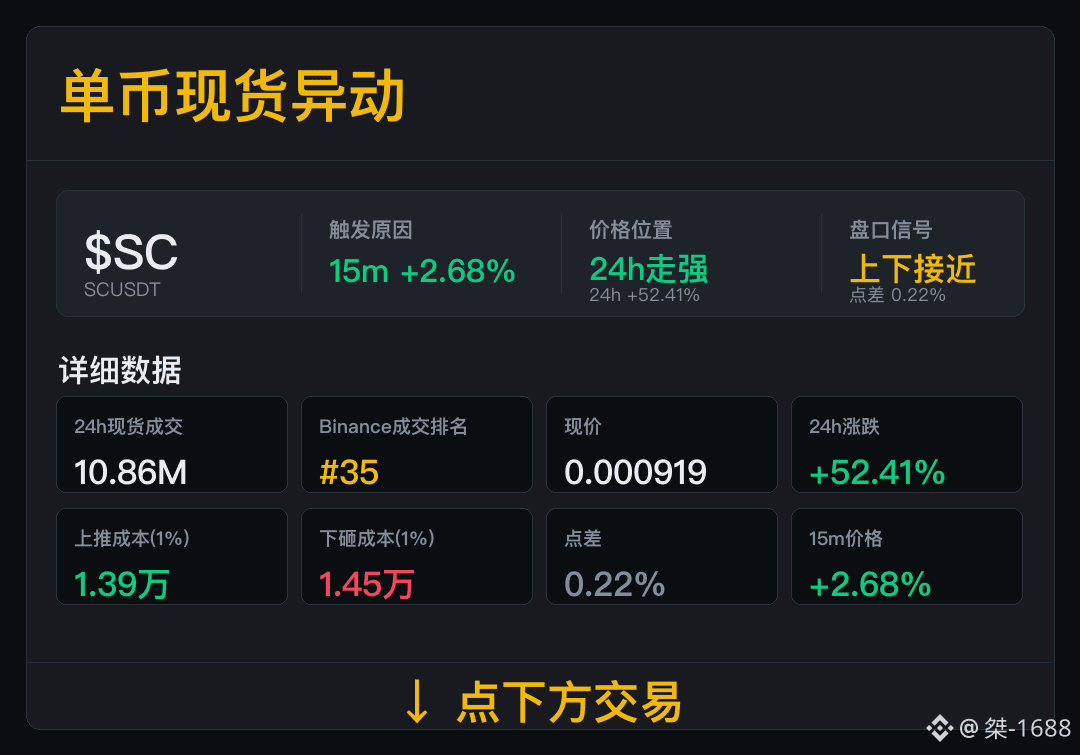
$SC 15m The price starts to change—first, verify spot trades.
Spot trades: 10.86M, Binance trade ranking #35. Spot trades are the current main clue; we’ll continue to track participation going forward.
Now, 24h gain/loss +52.41%; spread 0.22%. The cost pushed up is 13.9k, the cost pushed down is 14.5k. The first price move has already appeared; the second leg’s trades better indicate the persistence.
Next, watch whether trading volume stays consistent and whether the spread remains at the current level.
$SC 15m The price starts to change—first, verify spot trades.
Spot trades: 10.86M, Binance trade ranking #35. Spot trades are the current main clue; we’ll continue to track participation going forward.
Now, 24h gain/loss +52.41%; spread 0.22%. The cost pushed up is 13.9k, the cost pushed down is 14.5k. The first price move has already appeared; the second leg’s trades better indicate the persistence.
Next, watch whether trading volume stays consistent and whether the spread remains at the current level.
Spot trades: 10.86M, Binance trade ranking #35. Spot trades are the current main clue; we’ll continue to track participation going forward.
Now, 24h gain/loss +52.41%; spread 0.22%. The cost pushed up is 13.9k, the cost pushed down is 14.5k. The first price move has already appeared; the second leg’s trades better indicate the persistence.
Next, watch whether trading volume stays consistent and whether the spread remains at the current level.
214
Log in to explore more content
Join global crypto users on Binance Square
⚡️ Get latest and useful information about crypto.
💬 Trusted by the world’s largest crypto exchange.
👍 Discover real insights from verified creators.
Email / Phone number
Trending Topics
1
#CircleLaunchesInstitutionalBTCBackedBorrowing
0 views
0 Discussing
2
#BitcoinHits$85K
2,574 views
122 Discussing
3
#ZetaChainVotesToMigrateZETAToSolana
0 views
0 Discussing
4
#ECBStartsBlockchainEuroSettlement
3,828 views
299 Discussing
5
#SouthAfricaProposesCryptoExchangeControls
14,214 views
496 Discussing
6
#SolanaCutsTargetSlotTimeTo250ms
16,860 views
434 Discussing
7
#EthereumSurpasses$2700
15,516 views
197 Discussing
8
#CanaryFilesSecondAmendmentForStakedSEIETF
36,679 views
790 Discussing
9
#SaylorHintsStrategyBitcoinBuy
2.4M views
13,717 Discussing
10
#BOJRaisesRatesTo31YearHigh
351,878 views
3,996 Discussing