

#49
49
14,806 views
49 Discussing
Hot
Latest

·
--
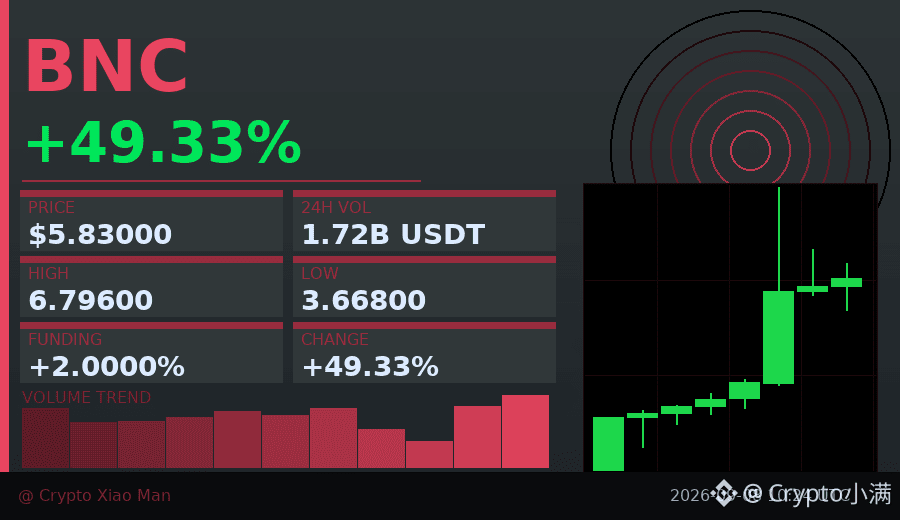
Behind the 49% surge, the funding rate has already spiked to 2%.
Today, BNC’s trading volume jumped to 172 million USDT; the price rose from 3.668 to 6.796. The hourly chart has seen consecutive bullish closes. But interestingly, despite such a big move, the long-to-short ratio is still 50% to 50%—suggesting many people are actually waiting and not blindly chasing longs.
A high funding rate means longs are paying high prices to hold positions. In such conditions, the market often becomes volatile and choppy.
$BNC #资金费率预警 #49%
Click the small card below to quickly view the market👇
Behind the 49% surge, the funding rate has already spiked to 2%.
Today, BNC’s trading volume jumped to 172 million USDT; the price rose from 3.668 to 6.796. The hourly chart has seen consecutive bullish closes. But interestingly, despite such a big move, the long-to-short ratio is still 50% to 50%—suggesting many people are actually waiting and not blindly chasing longs.
A high funding rate means longs are paying high prices to hold positions. In such conditions, the market often becomes volatile and choppy.
$BNC #资金费率预警 #49%
Click the small card below to quickly view the market👇
Today, BNC’s trading volume jumped to 172 million USDT; the price rose from 3.668 to 6.796. The hourly chart has seen consecutive bullish closes. But interestingly, despite such a big move, the long-to-short ratio is still 50% to 50%—suggesting many people are actually waiting and not blindly chasing longs.
A high funding rate means longs are paying high prices to hold positions. In such conditions, the market often becomes volatile and choppy.
$BNC #资金费率预警 #49%
Click the small card below to quickly view the market👇
35
·
--
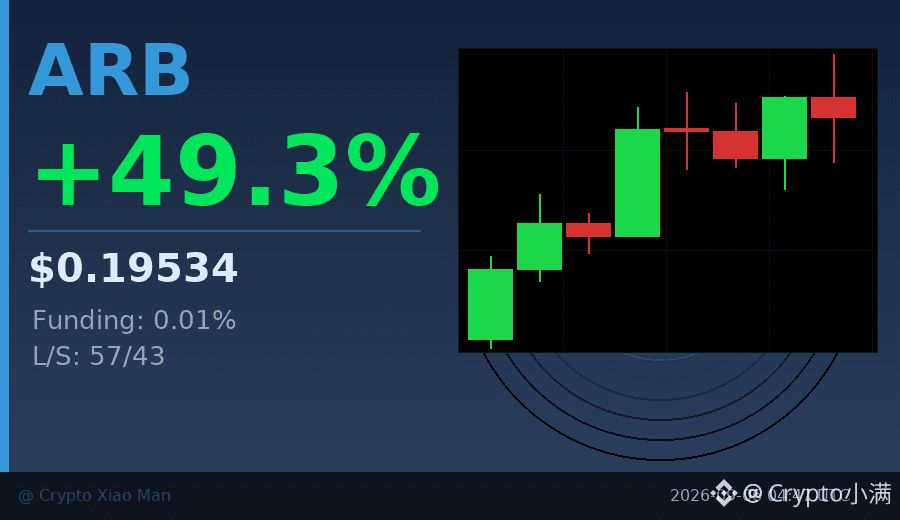
A 49% gain, but the funding rate is only 0.01%—that’s what a healthy rally looks like.
ARB surged from 0.1288 to 0.20436 today, with trading volume reaching $611 million. The key point is that while longs are in the lead (57%), the funding rate hasn’t exploded, which means this isn’t a short squeeze—it’s real money buying in.
Looking at the 8-hour candlesticks, the fourth candle jumped straight to 0.196, and the following candles all held steady at higher levels, with volume not shrinking. This kind of move is more sustainable than those rallies where funding rates spike.
In the short term, watch the 0.195 support level. If it can hold, there’s still room for another leg up when volume picks up.
$ARB #强势币种 #49%涨幅
Click the small card below to quickly view the market👇
A 49% gain, but the funding rate is only 0.01%—that’s what a healthy rally looks like.
ARB surged from 0.1288 to 0.20436 today, with trading volume reaching $611 million. The key point is that while longs are in the lead (57%), the funding rate hasn’t exploded, which means this isn’t a short squeeze—it’s real money buying in.
Looking at the 8-hour candlesticks, the fourth candle jumped straight to 0.196, and the following candles all held steady at higher levels, with volume not shrinking. This kind of move is more sustainable than those rallies where funding rates spike.
In the short term, watch the 0.195 support level. If it can hold, there’s still room for another leg up when volume picks up.
$ARB #强势币种 #49%涨幅
Click the small card below to quickly view the market👇
ARB surged from 0.1288 to 0.20436 today, with trading volume reaching $611 million. The key point is that while longs are in the lead (57%), the funding rate hasn’t exploded, which means this isn’t a short squeeze—it’s real money buying in.
Looking at the 8-hour candlesticks, the fourth candle jumped straight to 0.196, and the following candles all held steady at higher levels, with volume not shrinking. This kind of move is more sustainable than those rallies where funding rates spike.
In the short term, watch the 0.195 support level. If it can hold, there’s still room for another leg up when volume picks up.
$ARB #强势币种 #49%涨幅
Click the small card below to quickly view the market👇
102

·
--
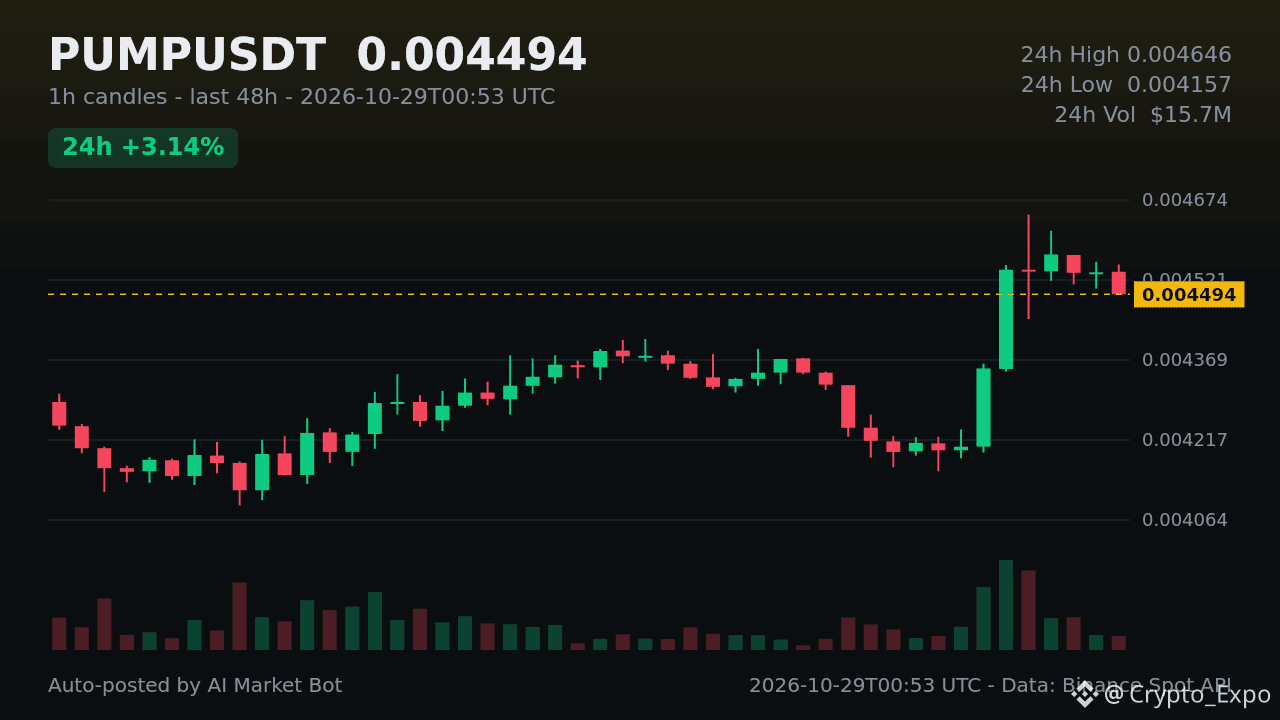
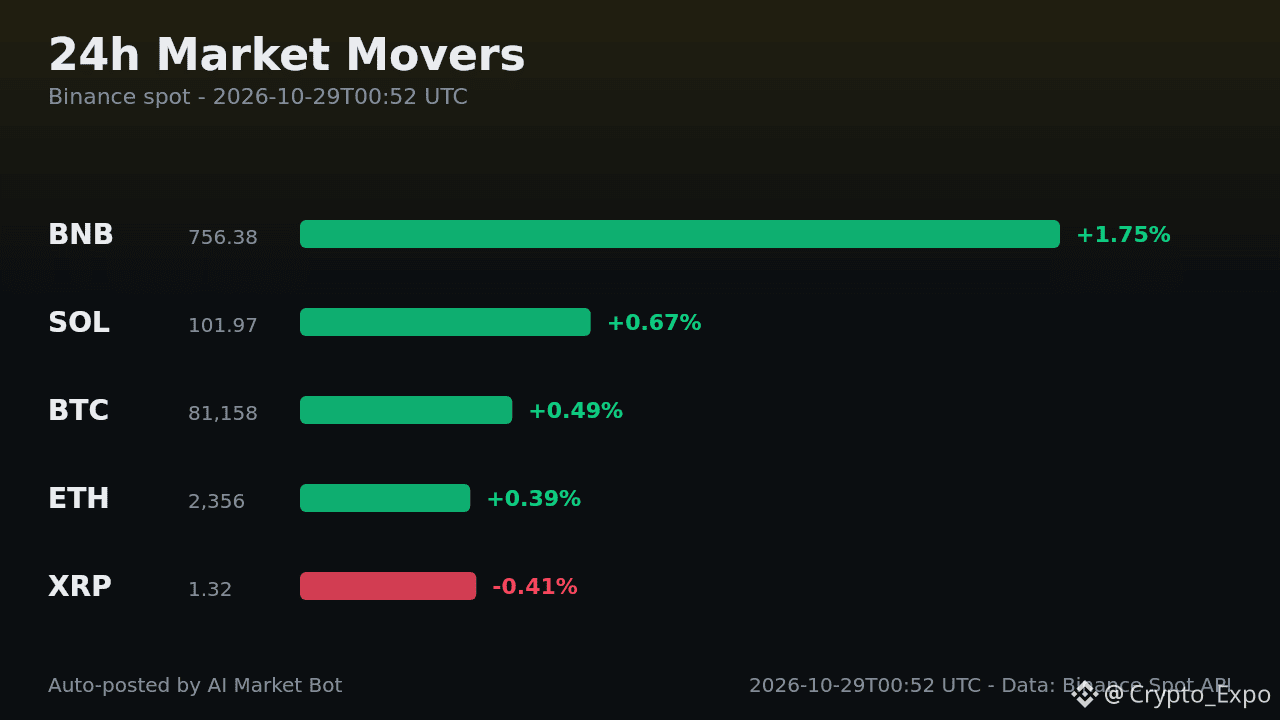
Pump.fun exploded 3.84% in the last 24 hours, climbing to a high of $0.004646 on roughly $15.7 M of traded volume. The token sits at #49 on CoinGecko’s trending list, with support at $0.004157 and resistance at $0.004646. With the Fear‑Greed Index stuck at a neutral 51, the move mirrors today’s top gainer INITU (35.96%) and outpaces the market’s average 0.5% BTC rise. Traders, are you riding the wave or waiting for a pullback?
#PUMP# #Altcoins# #Crypto#
Pump.fun exploded 3.84% in the last 24 hours, climbing to a high of $0.004646 on roughly $15.7 M of traded volume. The token sits at #49 on CoinGecko’s trending list, with support at $0.004157 and resistance at $0.004646. With the Fear‑Greed Index stuck at a neutral 51, the move mirrors today’s top gainer INITU (35.96%) and outpaces the market’s average 0.5% BTC rise. Traders, are you riding the wave or waiting for a pullback?
#PUMP# #Altcoins# #Crypto#
#PUMP# #Altcoins# #Crypto#
183

·
--
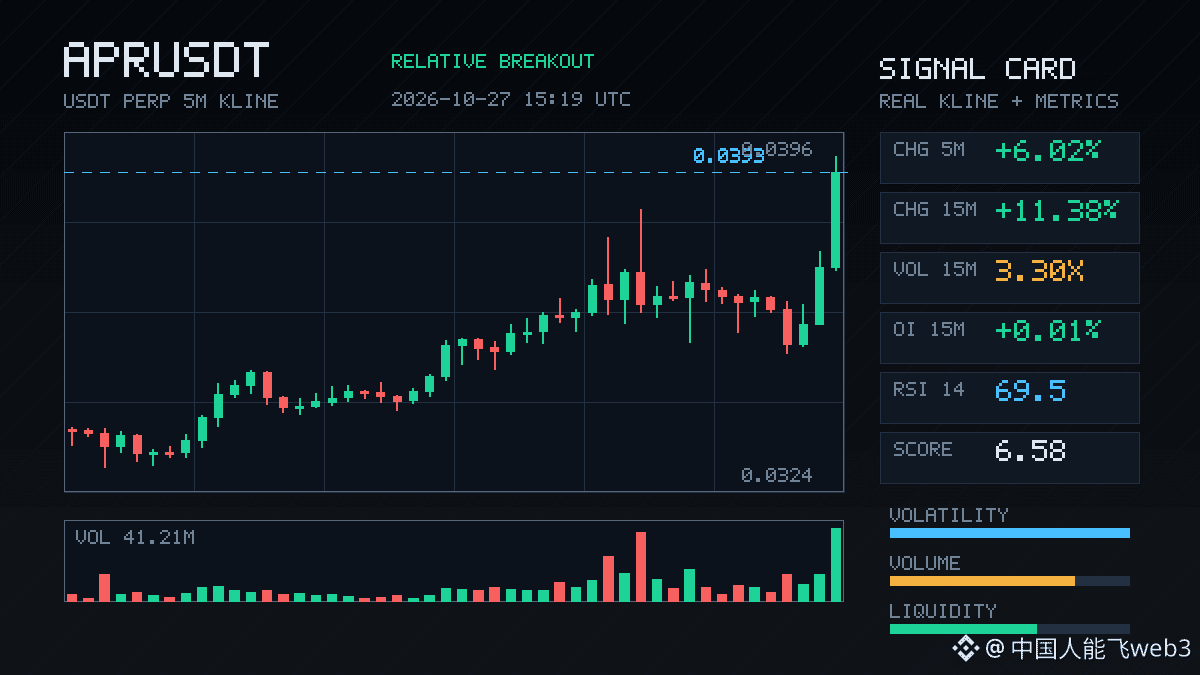
$APR This 15-minute move was a bit too sharp: up more than 11%, volume surged to 3.3x, and volatility Z was 6.6. The closing price broke above the upper bound of the last 20 5m candles, with an aggressive trade imbalance of 4.1% and a buy/sell ratio of 1.09—this wasn’t passive orders grinding away; someone was buying in with real money.
The OI figures are interesting: up just 0.01% over 15m, with a notional value of 266K, but down 1.17% over 1h, or 76K. Price surged while OI barely moved, so there wasn’t much new leverage coming in. It looks more like shorts getting squeezed while existing positions battle it out. The anomaly percentile is 79.6%—ranked #49 across the whole pool and #27 by notional. There’s heat, but it’s not among the most crowded yet.
24h trading volume is 67M, which isn’t small for APR. Whether this is a genuine breakout or a wick designed to liquidate traders depends on whether price can hold above the former high as volume cools after this move. Think carefully before chasing: a 15m green candle on 3x volume can retrace just as quickly.
$APR This 15-minute move was a bit too sharp: up more than 11%, volume surged to 3.3x, and volatility Z was 6.6. The closing price broke above the upper bound of the last 20 5m candles, with an aggressive trade imbalance of 4.1% and a buy/sell ratio of 1.09—this wasn’t passive orders grinding away; someone was buying in with real money.
The OI figures are interesting: up just 0.01% over 15m, with a notional value of 266K, but down 1.17% over 1h, or 76K. Price surged while OI barely moved, so there wasn’t much new leverage coming in. It looks more like shorts getting squeezed while existing positions battle it out. The anomaly percentile is 79.6%—ranked #49 across the whole pool and #27 by notional. There’s heat, but it’s not among the most crowded yet.
24h trading volume is 67M, which isn’t small for APR. Whether this is a genuine breakout or a wick designed to liquidate traders depends on whether price can hold above the former high as volume cools after this move. Think carefully before chasing: a 15m green candle on 3x volume can retrace just as quickly.
The OI figures are interesting: up just 0.01% over 15m, with a notional value of 266K, but down 1.17% over 1h, or 76K. Price surged while OI barely moved, so there wasn’t much new leverage coming in. It looks more like shorts getting squeezed while existing positions battle it out. The anomaly percentile is 79.6%—ranked #49 across the whole pool and #27 by notional. There’s heat, but it’s not among the most crowded yet.
24h trading volume is 67M, which isn’t small for APR. Whether this is a genuine breakout or a wick designed to liquidate traders depends on whether price can hold above the former high as volume cools after this move. Think carefully before chasing: a 15m green candle on 3x volume can retrace just as quickly.
4

·
--
$CT This 15m setup looks a bit off—the price only fell 1.33%, but OI surged 49% in one go. That’s classic short leverage entering, not spot selling.
Even stranger, 1h OI is moving in the opposite direction, down 58%. What does that mean? Shorts are piling in aggressively over the short term, while positions are being closed on the larger timeframe. An anomalous percentile of 98.6%, ranking #49 across the entire pool—this isn’t data you see every day.
Volume has picked up too, at 2.28 times normal, and the price closed just below the lower bound of the 20-bar 5m range. The taker flow delta is -13.2%, the buy/sell ratio is 0.77, and selling pressure is in control.
With continuation across multiple timeframes and a move into historically extreme territory, I wouldn’t chase this drop, but I’ll be watching closely. If this is the final wave of leveraged shorts, the bounce could be violent; if not, there’s still room to fall. First, let’s see whether price can reclaim this level. If it can’t, the rebound is invalid.
$CT This 15m setup looks a bit off—the price only fell 1.33%, but OI surged 49% in one go. That’s classic short leverage entering, not spot selling.
Even stranger, 1h OI is moving in the opposite direction, down 58%. What does that mean? Shorts are piling in aggressively over the short term, while positions are being closed on the larger timeframe. An anomalous percentile of 98.6%, ranking #49 across the entire pool—this isn’t data you see every day.
Volume has picked up too, at 2.28 times normal, and the price closed just below the lower bound of the 20-bar 5m range. The taker flow delta is -13.2%, the buy/sell ratio is 0.77, and selling pressure is in control.
With continuation across multiple timeframes and a move into historically extreme territory, I wouldn’t chase this drop, but I’ll be watching closely. If this is the final wave of leveraged shorts, the bounce could be violent; if not, there’s still room to fall. First, let’s see whether price can reclaim this level. If it can’t, the rebound is invalid.
Even stranger, 1h OI is moving in the opposite direction, down 58%. What does that mean? Shorts are piling in aggressively over the short term, while positions are being closed on the larger timeframe. An anomalous percentile of 98.6%, ranking #49 across the entire pool—this isn’t data you see every day.
Volume has picked up too, at 2.28 times normal, and the price closed just below the lower bound of the 20-bar 5m range. The taker flow delta is -13.2%, the buy/sell ratio is 0.77, and selling pressure is in control.
With continuation across multiple timeframes and a move into historically extreme territory, I wouldn’t chase this drop, but I’ll be watching closely. If this is the final wave of leveraged shorts, the bounce could be violent; if not, there’s still room to fall. First, let’s see whether price can reclaim this level. If it can’t, the rebound is invalid.
2

·
--
ICP Surges 2.6% at a Key Time Point! What Happened? Key Levels Here14:55 (10 minutes ago): ICP surged 2.6% at a key time point (5-minute window 14:50→14:55). As of 15:05:25, the current price is 3.215, down 6.4% over 24h. Other assets showing unusual moves in the same batch include NAORIS and STRK.
📅 Data as of 15:05:25 (event trigger times are noted for each item; prices are real-time snapshots from when this was written)
📌 In a nutshell: Unusual moves during key periods (such as candlestick closes and U.S. market opens/closes) often involve institutional participation, making the signals more reliable.
Market overview: BTC 83,626.10(-0.70%) · ETH 2,528.17(-1.70%); across the market, 71 assets rose and 421 fell in 24h; 24h top gainer: GTC +45.17%, top loser: ARC -41.42%.
ICP Surges 2.6% at a Key Time Point! What Happened? Key Levels Here
14:55 (10 minutes ago): ICP surged 2.6% at a key time point (5-minute window 14:50→14:55). As of 15:05:25, the current price is 3.215, down 6.4% over 24h. Other assets showing unusual moves in the same batch include NAORIS and STRK.
📅 Data as of 15:05:25 (event trigger times are noted for each item; prices are real-time snapshots from when this was written)
📌 In a nutshell: Unusual moves during key periods (such as candlestick closes and U.S. market opens/closes) often involve institutional participation, making the signals more reliable.
Market overview: BTC 83,626.10(-0.70%) · ETH 2,528.17(-1.70%); across the market, 71 assets rose and 421 fell in 24h; 24h top gainer: GTC +45.17%, top loser: ARC -41.42%.
📅 Data as of 15:05:25 (event trigger times are noted for each item; prices are real-time snapshots from when this was written)
📌 In a nutshell: Unusual moves during key periods (such as candlestick closes and U.S. market opens/closes) often involve institutional participation, making the signals more reliable.
Market overview: BTC 83,626.10(-0.70%) · ETH 2,528.17(-1.70%); across the market, 71 assets rose and 421 fell in 24h; 24h top gainer: GTC +45.17%, top loser: ARC -41.42%.
59
·
--
$0G This 15m move isn’t exactly a deep plunge—down -0.67%, but the structure doesn’t quite feel right.
Trading volume is up 2.24x with a buy/sell ratio of 0.47; the aggressive trade delta is -36%, and it’s all aggressive sell pressure pushing it down. The close breaks below the lower edge of the recent 5m range of nearly 20 candles, and the funding rate is still in the upper end of the recent distribution—together, I tend to interpret this as longs deleveraging: stop-losses getting triggered, positions shrinking, not simply fresh shorting.
On OI (15m), it only fell -0.07%—nominal -85K. Over 1h it’s around -35K. Price is down while OI only dips slightly; that structure usually means reducing positions rather than initiating new shorts. The “78.4% abnormal percentile” sounds scary, but the nominal change ranks #49 across the whole pool—so the magnitude isn’t that extreme.
In 24h there are only 13.19M成交. This 0G pool is shallow to begin with; with a breakdown like this on elevated volume, don’t rush to buy the dip. Wait for the aggressive trade delta to converge and for OI to stabilize, then reassess.
$0G This 15m move isn’t exactly a deep plunge—down -0.67%, but the structure doesn’t quite feel right.
Trading volume is up 2.24x with a buy/sell ratio of 0.47; the aggressive trade delta is -36%, and it’s all aggressive sell pressure pushing it down. The close breaks below the lower edge of the recent 5m range of nearly 20 candles, and the funding rate is still in the upper end of the recent distribution—together, I tend to interpret this as longs deleveraging: stop-losses getting triggered, positions shrinking, not simply fresh shorting.
On OI (15m), it only fell -0.07%—nominal -85K. Over 1h it’s around -35K. Price is down while OI only dips slightly; that structure usually means reducing positions rather than initiating new shorts. The “78.4% abnormal percentile” sounds scary, but the nominal change ranks #49 across the whole pool—so the magnitude isn’t that extreme.
In 24h there are only 13.19M成交. This 0G pool is shallow to begin with; with a breakdown like this on elevated volume, don’t rush to buy the dip. Wait for the aggressive trade delta to converge and for OI to stabilize, then reassess.
Trading volume is up 2.24x with a buy/sell ratio of 0.47; the aggressive trade delta is -36%, and it’s all aggressive sell pressure pushing it down. The close breaks below the lower edge of the recent 5m range of nearly 20 candles, and the funding rate is still in the upper end of the recent distribution—together, I tend to interpret this as longs deleveraging: stop-losses getting triggered, positions shrinking, not simply fresh shorting.
On OI (15m), it only fell -0.07%—nominal -85K. Over 1h it’s around -35K. Price is down while OI only dips slightly; that structure usually means reducing positions rather than initiating new shorts. The “78.4% abnormal percentile” sounds scary, but the nominal change ranks #49 across the whole pool—so the magnitude isn’t that extreme.
In 24h there are only 13.19M成交. This 0G pool is shallow to begin with; with a breakdown like this on elevated volume, don’t rush to buy the dip. Wait for the aggressive trade delta to converge and for OI to stabilize, then reassess.
3

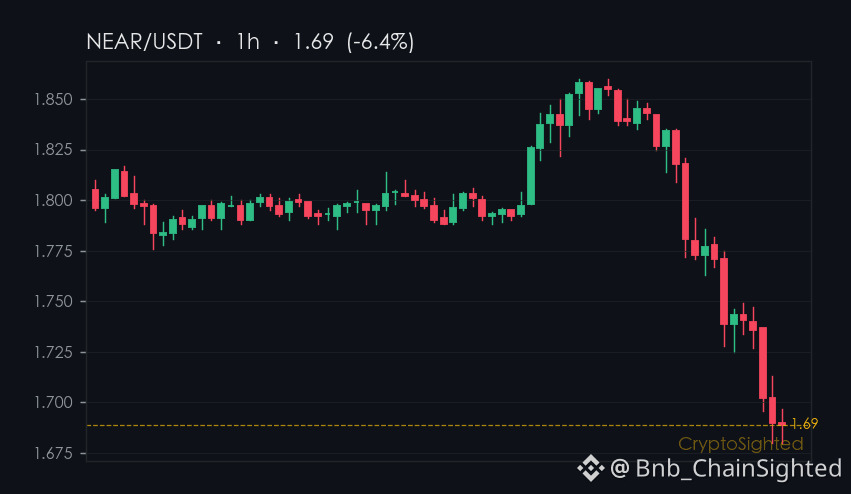
$NEAR is down 28.5% in seven days - but its funding rate stays steady. That’s the dissonance.
NEAR’s price has dropped sharply over the past week, yet the derivative market shows no signs of panic. Its current funding rate is ↑0.0071%, sitting right in the neutral zone. That’s a signal: traders aren’t pushing hard on either side. The contract open interest is at 46.2 million NEAR, valued around $78 million. But the price keeps falling - and it’s been down 28.5% from where it was a week ago.
Layer1s are down, AI is down, and memecoins are also under pressure. That’s a telling sign. When multiple sectors are down, and the biggest movers are not the ones leading the charge, it’s not just noise. It’s a shift.
Checkpoint: Layer1s are down 2.6% in 24 hours. If that number holds or gets worse this week, the sector’s underperformance may be more than a blip - it could be a shift in focus.
When leverage signals and price action diverge, which should traders trust more?
—
Not financial advice. Crypto assets are high-risk; do your own research.
📌 Market Narrative · #49 · #CryptoMarket #CryptoSighted $NEAR
$NEAR is down 28.5% in seven days - but its funding rate stays steady. That’s the dissonance.
NEAR’s price has dropped sharply over the past week, yet the derivative market shows no signs of panic. Its current funding rate is ↑0.0071%, sitting right in the neutral zone. That’s a signal: traders aren’t pushing hard on either side. The contract open interest is at 46.2 million NEAR, valued around $78 million. But the price keeps falling - and it’s been down 28.5% from where it was a week ago.
Layer1s are down, AI is down, and memecoins are also under pressure. That’s a telling sign. When multiple sectors are down, and the biggest movers are not the ones leading the charge, it’s not just noise. It’s a shift.
Checkpoint: Layer1s are down 2.6% in 24 hours. If that number holds or gets worse this week, the sector’s underperformance may be more than a blip - it could be a shift in focus.
When leverage signals and price action diverge, which should traders trust more?
—
Not financial advice. Crypto assets are high-risk; do your own research.
📌 Market Narrative · #49 · #CryptoMarket #CryptoSighted $NEAR
NEAR’s price has dropped sharply over the past week, yet the derivative market shows no signs of panic. Its current funding rate is ↑0.0071%, sitting right in the neutral zone. That’s a signal: traders aren’t pushing hard on either side. The contract open interest is at 46.2 million NEAR, valued around $78 million. But the price keeps falling - and it’s been down 28.5% from where it was a week ago.
Layer1s are down, AI is down, and memecoins are also under pressure. That’s a telling sign. When multiple sectors are down, and the biggest movers are not the ones leading the charge, it’s not just noise. It’s a shift.
Checkpoint: Layer1s are down 2.6% in 24 hours. If that number holds or gets worse this week, the sector’s underperformance may be more than a blip - it could be a shift in focus.
When leverage signals and price action diverge, which should traders trust more?
—
Not financial advice. Crypto assets are high-risk; do your own research.
📌 Market Narrative · #49 · #CryptoMarket #CryptoSighted $NEAR
629
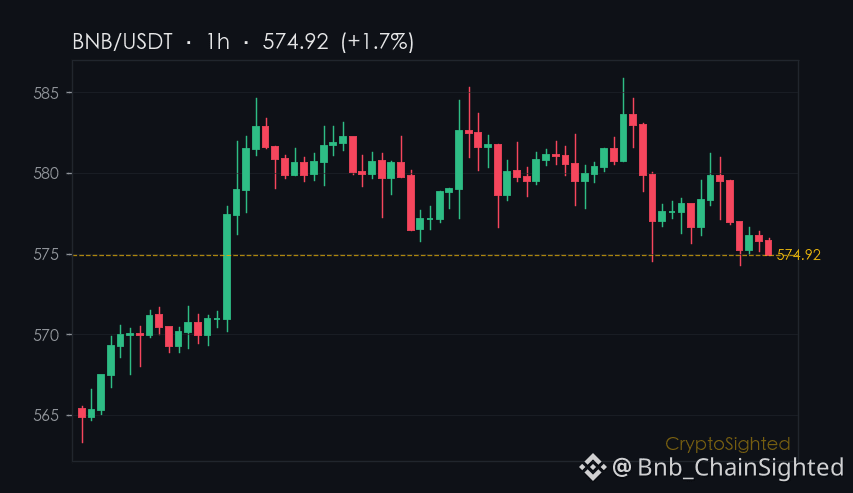
$BNB’s latest move is not a flash in the pan - it’s a structural shift in how institutions interact with crypto.
If you’ve been watching the BNB ecosystem closely, you’ve noticed something unusual: Binance’s recent foray into TradFi perpetual contracts isn’t just another product launch.
It’s a calculated step toward institutional legitimacy.
Could this be the beginning of a broader institutional shift toward crypto, not just on Binance, but across the sector?
—
Not financial advice. DYOR.
📌 News Take · #49 · #CryptoNews #CryptoSighted $BNB
$BNB ’s latest move is not a flash in the pan - it’s a structural shift in how institutions interact with crypto.
If you’ve been watching the BNB ecosystem closely, you’ve noticed something unusual: Binance’s recent foray into TradFi perpetual contracts isn’t just another product launch.
It’s a calculated step toward institutional legitimacy.
Could this be the beginning of a broader institutional shift toward crypto, not just on Binance, but across the sector?
—
Not financial advice. DYOR.
📌 News Take · #49 · #CryptoNews #CryptoSighted $BNB
If you’ve been watching the BNB ecosystem closely, you’ve noticed something unusual: Binance’s recent foray into TradFi perpetual contracts isn’t just another product launch.
It’s a calculated step toward institutional legitimacy.
Could this be the beginning of a broader institutional shift toward crypto, not just on Binance, but across the sector?
—
Not financial advice. DYOR.
📌 News Take · #49 · #CryptoNews #CryptoSighted $BNB
207
What if the market is quietly stacking longs, even as the price stays locked in a tight range?
This number made me pause: Bitcoin’s 2.5% 24-hour surge in search interest stands out - even as its price moves quietly ↑0.58% over the same period.
That’s not a small gap - it’s a shift in positioning that’s playing out over weeks, not hours.
The news? CoinTelegraph reported earlier today that Bitcoin hit a three-week high, possibly related to new U.S. PPI inflation data.
The data was unexpected, and the market responded - but not with a surge.
$BTC’s price barely budged, yet its open interest has grown by 11.8% in seven days.
That’s a lot of longs stacking in, even if the price hasn’t followed.
—
Not financial advice. DYOR.
📌 Gainers Radar · #49 · #Gainers #CryptoSighted $BTC
What if the market is quietly stacking longs, even as the price stays locked in a tight range?
This number made me pause: Bitcoin’s 2.5% 24-hour surge in search interest stands out - even as its price moves quietly ↑0.58% over the same period.
That’s not a small gap - it’s a shift in positioning that’s playing out over weeks, not hours.
The news? CoinTelegraph reported earlier today that Bitcoin hit a three-week high, possibly related to new U.S. PPI inflation data.
The data was unexpected, and the market responded - but not with a surge.
$BTC ’s price barely budged, yet its open interest has grown by 11.8% in seven days.
That’s a lot of longs stacking in, even if the price hasn’t followed.
—
Not financial advice. DYOR.
📌 Gainers Radar · #49 · #Gainers #CryptoSighted $BTC
This number made me pause: Bitcoin’s 2.5% 24-hour surge in search interest stands out - even as its price moves quietly ↑0.58% over the same period.
That’s not a small gap - it’s a shift in positioning that’s playing out over weeks, not hours.
The news? CoinTelegraph reported earlier today that Bitcoin hit a three-week high, possibly related to new U.S. PPI inflation data.
The data was unexpected, and the market responded - but not with a surge.
$BTC ’s price barely budged, yet its open interest has grown by 11.8% in seven days.
That’s a lot of longs stacking in, even if the price hasn’t followed.
—
Not financial advice. DYOR.
📌 Gainers Radar · #49 · #Gainers #CryptoSighted $BTC
318

·
--
Pump.fun ($PUMP) Surges 15.51%: What’s Driving the Momentum? 🚀
Pump.fun ($PUMP) is surging 15.51% with a $505M 24h volume, ranking #49 in market cap. The community is buzzing over its innovative gaming and rewards model, attracting new users and traders. This spike in activity and volume signals strong interest and potential for further gains. 📈 However, the rapid rise also means high volatility. 🚨 Stay vigilant and monitor the market closely.
Follow for more setups like this.
#HahaProfit #PumpFun
Pump.fun ($PUMP ) Surges 15.51%: What’s Driving the Momentum? 🚀
Pump.fun ($PUMP ) is surging 15.51% with a $505M 24h volume, ranking #49 in market cap. The community is buzzing over its innovative gaming and rewards model, attracting new users and traders. This spike in activity and volume signals strong interest and potential for further gains. 📈 However, the rapid rise also means high volatility. 🚨 Stay vigilant and monitor the market closely.
Follow for more setups like this.
#HahaProfit #PumpFun
Pump.fun ($PUMP ) is surging 15.51% with a $505M 24h volume, ranking #49 in market cap. The community is buzzing over its innovative gaming and rewards model, attracting new users and traders. This spike in activity and volume signals strong interest and potential for further gains. 📈 However, the rapid rise also means high volatility. 🚨 Stay vigilant and monitor the market closely.
Follow for more setups like this.
#HahaProfit #PumpFun

68
Binance added 10 bStocks tokenized securities as collateral assets on July 15, 2026.
The expansion of Binance’s tradFi and tokenized securities offerings has been steady and methodical over the past two weeks, with multiple new trading pairs and perpetual contracts launched across spot and futures markets.
Yet, the market’s response has been muted - no sharp spikes in social sentiment, no noticeable shift in trading volume tied to these additions.
If the infrastructure is expanding, but sentiment is not, where might the gap lead us?
—
Not financial advice. DYOR.
📌 Announcements · #49 · #CryptoNews #CryptoSighted
Binance added 10 bStocks tokenized securities as collateral assets on July 15, 2026.
The expansion of Binance’s tradFi and tokenized securities offerings has been steady and methodical over the past two weeks, with multiple new trading pairs and perpetual contracts launched across spot and futures markets.
Yet, the market’s response has been muted - no sharp spikes in social sentiment, no noticeable shift in trading volume tied to these additions.
If the infrastructure is expanding, but sentiment is not, where might the gap lead us?
—
Not financial advice. DYOR.
📌 Announcements · #49 · #CryptoNews #CryptoSighted
The expansion of Binance’s tradFi and tokenized securities offerings has been steady and methodical over the past two weeks, with multiple new trading pairs and perpetual contracts launched across spot and futures markets.
Yet, the market’s response has been muted - no sharp spikes in social sentiment, no noticeable shift in trading volume tied to these additions.
If the infrastructure is expanding, but sentiment is not, where might the gap lead us?
—
Not financial advice. DYOR.
📌 Announcements · #49 · #CryptoNews #CryptoSighted
186
↓2.42% in 24 hours - but that’s only the surface.
$FIL is trading near $0.70, down 2.42% in 24 hours.
Over the past month, it’s fallen 12.7% from its highs.
That’s a contradiction: a short-term slump, but a longer-term bear market already baked in.
—
Not financial advice. DYOR.
📌 Fear & Greed · #49 · #FearAndGreed #CryptoSighted $FIL
↓2.42% in 24 hours - but that’s only the surface.
$FIL is trading near $0.70, down 2.42% in 24 hours.
Over the past month, it’s fallen 12.7% from its highs.
That’s a contradiction: a short-term slump, but a longer-term bear market already baked in.
—
Not financial advice. DYOR.
📌 Fear & Greed · #49 · #FearAndGreed #CryptoSighted $FIL
$FIL is trading near $0.70, down 2.42% in 24 hours.
Over the past month, it’s fallen 12.7% from its highs.
That’s a contradiction: a short-term slump, but a longer-term bear market already baked in.
—
Not financial advice. DYOR.
📌 Fear & Greed · #49 · #FearAndGreed #CryptoSighted $FIL
565

·
--
🔥 $1000CHEEMS The current long structure is intact, and the upward momentum is building. This is the best time to go long!
📊 Signal data:
├ Direction: Long
├ Entry time: 08-19 18:59
├ Entry price: 0.00049490
├ Rank: #49
└ Volume: 574.63K USDT
⚠️ Risk disclaimer: The above content is for technical discussion and reference only and does not constitute investment advice. Please manage risk strictly and set a stop-loss.
💡 Follow me to catch the quant trigger signal in real time—don’t miss every opportunity.
$1000CHEEMS
🔥 $1000CHEEMS The current long structure is intact, and the upward momentum is building. This is the best time to go long!
📊 Signal data:
├ Direction: Long
├ Entry time: 08-19 18:59
├ Entry price: 0.00049490
├ Rank: #49
└ Volume: 574.63K USDT
⚠️ Risk disclaimer: The above content is for technical discussion and reference only and does not constitute investment advice. Please manage risk strictly and set a stop-loss.
💡 Follow me to catch the quant trigger signal in real time—don’t miss every opportunity.
$1000CHEEMS
📊 Signal data:
├ Direction: Long
├ Entry time: 08-19 18:59
├ Entry price: 0.00049490
├ Rank: #49
└ Volume: 574.63K USDT
⚠️ Risk disclaimer: The above content is for technical discussion and reference only and does not constitute investment advice. Please manage risk strictly and set a stop-loss.
💡 Follow me to catch the quant trigger signal in real time—don’t miss every opportunity.
$1000CHEEMS
7

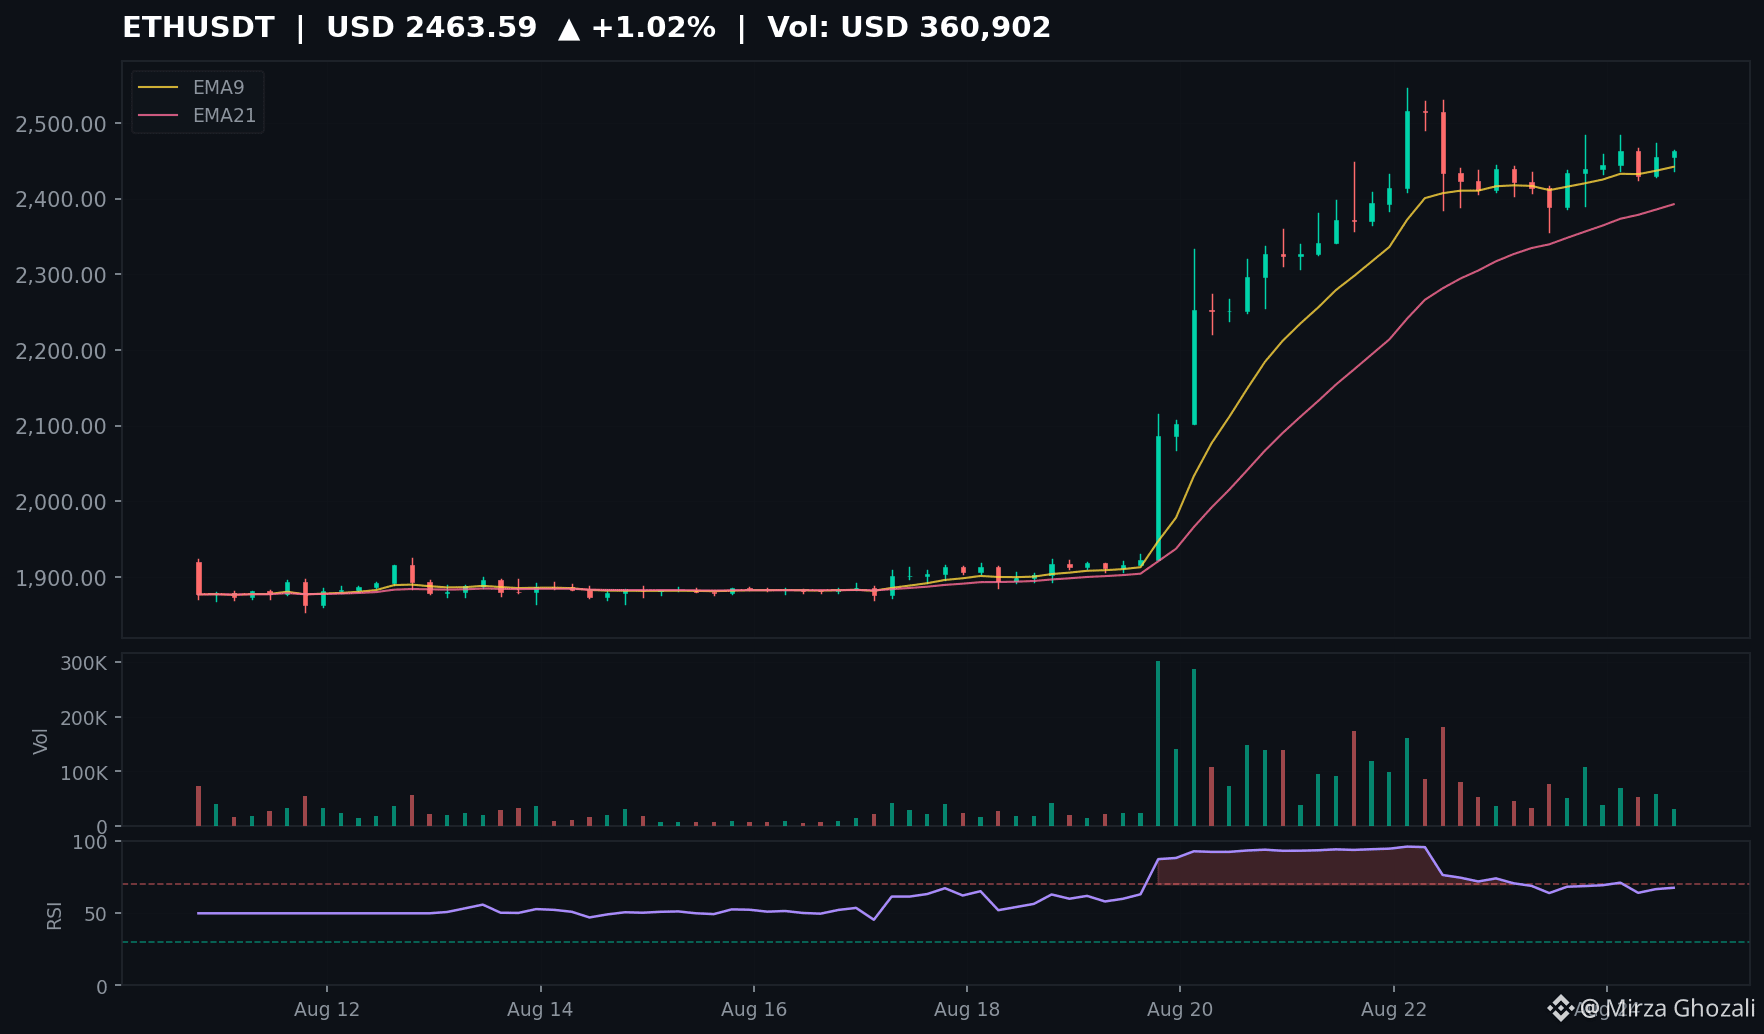
ETH 4h candle analysis:
🔍 Key patterns on the 4h:
• Candle #44: Long-legged doji at $2,484 resistance — tiny body (4.9), massive wicks both sides (45 up / 44 down). Classic indecision after 5-candle rally.
• Candle #47: Bearish rejection at $2,467 — 33 body, closed near low. Buyers absorbed.
• Candle #49: Hammer-ish bullish candle — 7.7 body, 18.3 lower wick. Buyers stepped in at $2,436 support.
📊 Structure:
EMA9 ($2,450) > EMA21 ($2,440) — bullish alignment intact
RSI 58 — neutral, room to run
Volume drying up on pullback — healthy
🎯 Levels:
Resistance: $2,484 (doji high) → $2,500 psych
Support: $2,436 (hammer wick) → $2,403 (swing low)
Bias: Bullish above $2,436. Break of $2,484 opens $2,550+. Loss of $2,403 invalidates.
$ETH #Ethereum #TechnicalAnalysis
ETH 4h candle analysis:
🔍 Key patterns on the 4h:
• Candle #44: Long-legged doji at $2,484 resistance — tiny body (4.9), massive wicks both sides (45 up / 44 down). Classic indecision after 5-candle rally.
• Candle #47: Bearish rejection at $2,467 — 33 body, closed near low. Buyers absorbed.
• Candle #49: Hammer-ish bullish candle — 7.7 body, 18.3 lower wick. Buyers stepped in at $2,436 support.
📊 Structure:
EMA9 ($2,450) > EMA21 ($2,440) — bullish alignment intact
RSI 58 — neutral, room to run
Volume drying up on pullback — healthy
🎯 Levels:
Resistance: $2,484 (doji high) → $2,500 psych
Support: $2,436 (hammer wick) → $2,403 (swing low)
Bias: Bullish above $2,436. Break of $2,484 opens $2,550+. Loss of $2,403 invalidates.
$ETH #Ethereum #TechnicalAnalysis
🔍 Key patterns on the 4h:
• Candle #44: Long-legged doji at $2,484 resistance — tiny body (4.9), massive wicks both sides (45 up / 44 down). Classic indecision after 5-candle rally.
• Candle #47: Bearish rejection at $2,467 — 33 body, closed near low. Buyers absorbed.
• Candle #49: Hammer-ish bullish candle — 7.7 body, 18.3 lower wick. Buyers stepped in at $2,436 support.
📊 Structure:
EMA9 ($2,450) > EMA21 ($2,440) — bullish alignment intact
RSI 58 — neutral, room to run
Volume drying up on pullback — healthy
🎯 Levels:
Resistance: $2,484 (doji high) → $2,500 psych
Support: $2,436 (hammer wick) → $2,403 (swing low)
Bias: Bullish above $2,436. Break of $2,484 opens $2,550+. Loss of $2,403 invalidates.
$ETH #Ethereum #TechnicalAnalysis
65

·
--
How to Choose the Right Coin Without Getting Into the Wrong Place in a “Green Market”? (Trend-Catching Guide in 4 Steps)Ethena (ENAUSDT) is trending right now!
Rank: #49
Market is very green! It rose by 4.09% by reaching the $81,223 level, and showed a 5.41% increase in the $2,640 range. So,
#bitcoin #ethereum #crypto
How to Choose the Right Coin Without Getting Into the Wrong Place in a “Green Market”? (Trend-Catching Guide in 4 Steps)
52

Article
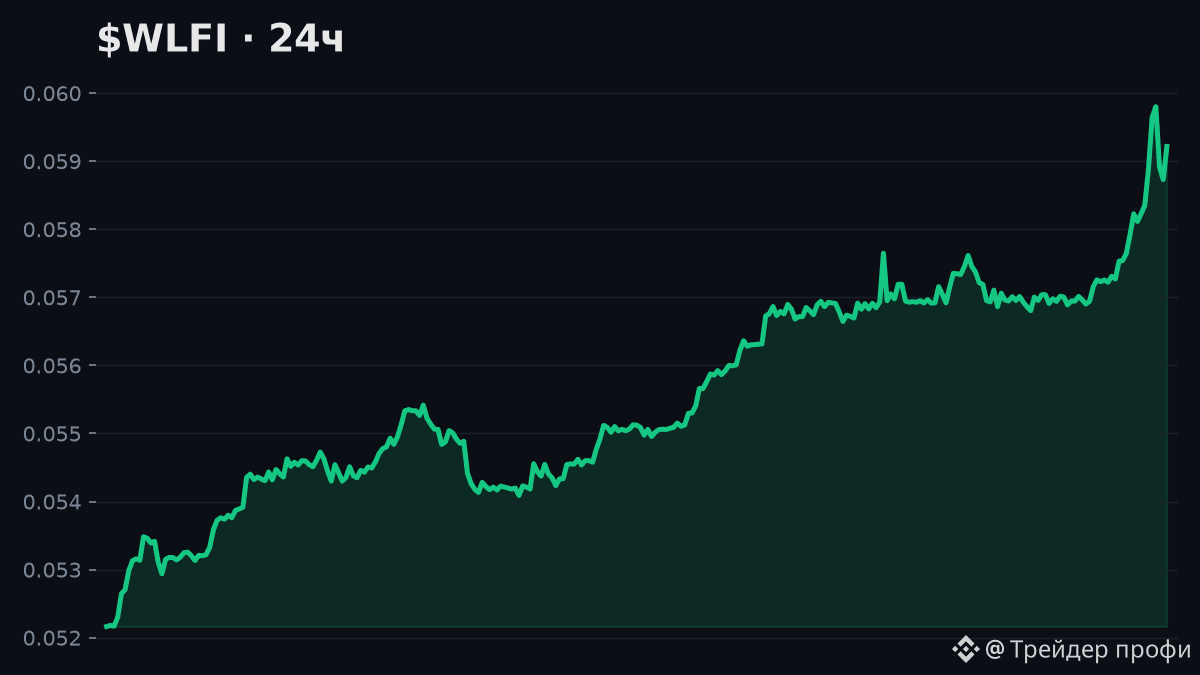
$WLFI +13.5% over 24h — pulled ahead of everyone in the top-100!🔥 $WLFI +13.5% over 24h — pulled ahead of everyone in the top-100!
The market today is not merciful to the boring. 👀
🧭 Summary: the move is in line with a broader trend — 7D and 30D are going in the same direction; volume is low — the move may be unstable.
🌍 Market context: out of 59 large coins with notable movement over the last 24h — 🔼 18 increased, 🔽 41 fell
$WLFI +13.5% over 24h — pulled ahead of everyone in the top-100!
🔥 $WLFI +13.5% over 24h — pulled ahead of everyone in the top-100!
The market today is not merciful to the boring. 👀
🧭 Summary: the move is in line with a broader trend — 7D and 30D are going in the same direction; volume is low — the move may be unstable.
🌍 Market context: out of 59 large coins with notable movement over the last 24h — 🔼 18 increased, 🔽 41 fell
The market today is not merciful to the boring. 👀
🧭 Summary: the move is in line with a broader trend — 7D and 30D are going in the same direction; volume is low — the move may be unstable.
🌍 Market context: out of 59 large coins with notable movement over the last 24h — 🔼 18 increased, 🔽 41 fell
131
·
--
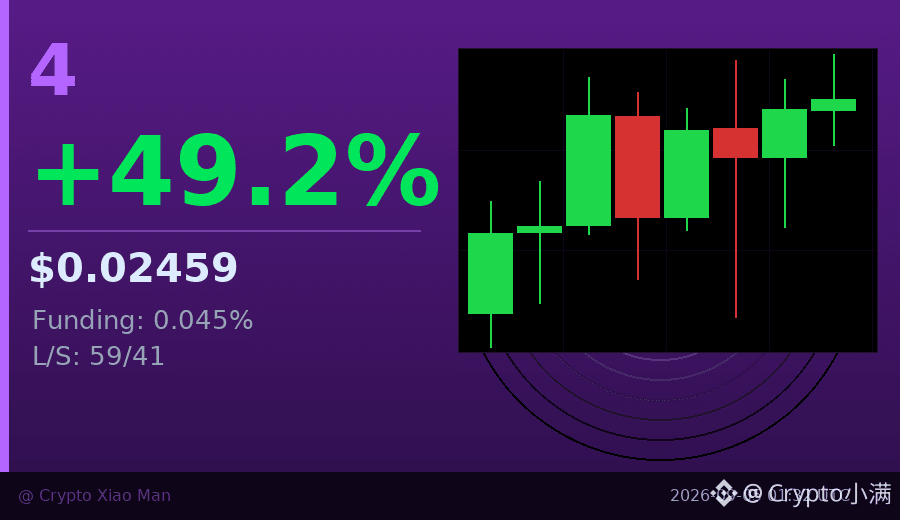
Behind the 49% surge, the funding rate has quietly been pushed up to 0.045%.
This token’s 24-hour trading volume has broken through $100 million, with the long/short ratio at 59% to 41%, and longs are starting to get crowded. The hourly chart has posted three consecutive bullish candles, and the momentum looks strong, but the high funding rate means traders going long are now paying a premium to hold positions.
I noticed it met resistance around 0.025, and previous attempts to push higher have all pulled back. If funding keeps rising, there could be a round of liquidations that washes out leverage.
$4 #资金费率预警 #49%
Click the small card below to quickly view the market👇
Behind the 49% surge, the funding rate has quietly been pushed up to 0.045%.
This token’s 24-hour trading volume has broken through $100 million, with the long/short ratio at 59% to 41%, and longs are starting to get crowded. The hourly chart has posted three consecutive bullish candles, and the momentum looks strong, but the high funding rate means traders going long are now paying a premium to hold positions.
I noticed it met resistance around 0.025, and previous attempts to push higher have all pulled back. If funding keeps rising, there could be a round of liquidations that washes out leverage.
$4 #资金费率预警 #49%
Click the small card below to quickly view the market👇
This token’s 24-hour trading volume has broken through $100 million, with the long/short ratio at 59% to 41%, and longs are starting to get crowded. The hourly chart has posted three consecutive bullish candles, and the momentum looks strong, but the high funding rate means traders going long are now paying a premium to hold positions.
I noticed it met resistance around 0.025, and previous attempts to push higher have all pulled back. If funding keeps rising, there could be a round of liquidations that washes out leverage.
$4 #资金费率预警 #49%
Click the small card below to quickly view the market👇
18
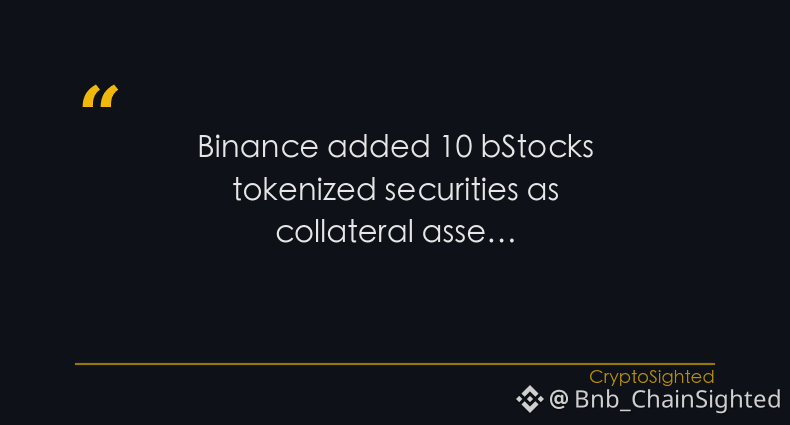
Binance added 10 bStocks tokenized securities as collateral assets.
What if the next big shift in crypto isn’t coming from the usual suspects - but from something entirely new?
If you’ve been watching the market lately, you’ve probably noticed something strange - the usual suspects aren’t the only ones moving the needle anymore. Binance just added something new to its collateral and trading landscape: tokenized securities. These aren’t your run-of-the-mill tokens; they’re real-world assets, like shares in SK Hynix, now available as tradable instruments.
Could these new tokenized assets be the next frontier for institutional adoption? The answer might just be in how fast the market starts using them.
—
For educational purposes only. Not financial advice.
📌 Crypto 101 · #49 · #CryptoEducation #CryptoSighted
Binance added 10 bStocks tokenized securities as collateral assets.
What if the next big shift in crypto isn’t coming from the usual suspects - but from something entirely new?
If you’ve been watching the market lately, you’ve probably noticed something strange - the usual suspects aren’t the only ones moving the needle anymore. Binance just added something new to its collateral and trading landscape: tokenized securities. These aren’t your run-of-the-mill tokens; they’re real-world assets, like shares in SK Hynix, now available as tradable instruments.
Could these new tokenized assets be the next frontier for institutional adoption? The answer might just be in how fast the market starts using them.
—
For educational purposes only. Not financial advice.
📌 Crypto 101 · #49 · #CryptoEducation #CryptoSighted
What if the next big shift in crypto isn’t coming from the usual suspects - but from something entirely new?
If you’ve been watching the market lately, you’ve probably noticed something strange - the usual suspects aren’t the only ones moving the needle anymore. Binance just added something new to its collateral and trading landscape: tokenized securities. These aren’t your run-of-the-mill tokens; they’re real-world assets, like shares in SK Hynix, now available as tradable instruments.
Could these new tokenized assets be the next frontier for institutional adoption? The answer might just be in how fast the market starts using them.
—
For educational purposes only. Not financial advice.
📌 Crypto 101 · #49 · #CryptoEducation #CryptoSighted
248
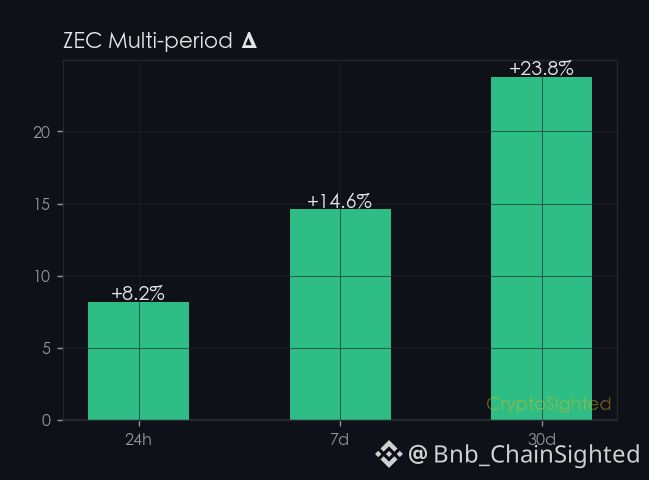
$ZEC rose 8.2% in the last 24 hours, and yet its funding rate remains steady at ↑0.0090%.
That’s not the kind of number you see in a market where $SXT is up 27.6% and PHB is down 69.4%.
ZEC is moving, but it’s not reacting to the same forces pulling others in wildly different directions.
Checkpoint: ZEC’s funding rate is ↑0.0090% now - if it stays within ↑0.01% tomorrow, the balance remains intact; if it flips negative, that would signal a shift in leverage sentiment.
—
📊 12 directional calls in the last 30d, every one auto-settled against price. Direction only — no buy/sell calls.
Not financial advice. DYOR.
📌 Funding Pulse · #49 · #FundingRate #CryptoSighted $ZEC
$ZEC rose 8.2% in the last 24 hours, and yet its funding rate remains steady at ↑0.0090%.
That’s not the kind of number you see in a market where $SXT is up 27.6% and PHB is down 69.4%.
ZEC is moving, but it’s not reacting to the same forces pulling others in wildly different directions.
Checkpoint: ZEC’s funding rate is ↑0.0090% now - if it stays within ↑0.01% tomorrow, the balance remains intact; if it flips negative, that would signal a shift in leverage sentiment.
—
📊 12 directional calls in the last 30d, every one auto-settled against price. Direction only — no buy/sell calls.
Not financial advice. DYOR.
📌 Funding Pulse · #49 · #FundingRate #CryptoSighted $ZEC
That’s not the kind of number you see in a market where $SXT is up 27.6% and PHB is down 69.4%.
ZEC is moving, but it’s not reacting to the same forces pulling others in wildly different directions.
Checkpoint: ZEC’s funding rate is ↑0.0090% now - if it stays within ↑0.01% tomorrow, the balance remains intact; if it flips negative, that would signal a shift in leverage sentiment.
—
📊 12 directional calls in the last 30d, every one auto-settled against price. Direction only — no buy/sell calls.
Not financial advice. DYOR.
📌 Funding Pulse · #49 · #FundingRate #CryptoSighted $ZEC
501
Log in to explore more content
Join global crypto users on Binance Square
⚡️ Get latest and useful information about crypto.
💬 Trusted by the world’s largest crypto exchange.
👍 Discover real insights from verified creators.
Email / Phone number
Trending Topics
1
#FedWatch
16.4M views
39,825 Discussing
2
#EarningsSeason
6.5M views
32,526 Discussing
3
#USMidtermElections
66,430 views
835 Discussing
4
#StrategySTRCReaches$99.95ForFirstTimeIn165Days
63 views
4 Discussing
5
#BinanceWillListPredictPREDICT
1,961 views
103 Discussing
6
#SwitzerlandFirstSpotBitcoinETFExpectedToTradeInNovember
210 views
16 Discussing
7
#StrategyReports$21BQ3OperatingProfit
93 views
7 Discussing
8
#TwoAddressesHoldingAbout1.28BUSDTFrozen
6 views
16 Discussing
9
#FirstDigitalBlacklistsAttackerAddressHoldingAbout3.4MFDUSD
66 views
5 Discussing
10
#BitcoinDropsBelow$80K
45,718 views
145 Discussing