

#101
101
21,745 views
43 Discussing
Hot
Latest

·
--
Looking only at the 24-hour move of +3.48%, $PENGU seems to have recovered from yesterday’s pullback. But zoom out a bit, and the 7-day figure is still -8.18%, while the 30-day figure is +13.97% — three timeframes telling three different stories.
This is actually a typical slice of market action. In mid-September, it was still hovering around $0.0068. Then on September 23, volume suddenly surged to $512M, pushing the price straight above $0.010. After that, for six days it neither broke below $0.0094 nor pushed above $0.0103, looking more like consolidation and turnover within the post-breakout high range. That 24-hour gain is just one brick on the stairway when placed in a 30-day context; the 7-day decline is merely a normal retest between steps.
What matters more to me is the pullback in daily trading volume. The kind of volume seen on September 23 was enough to lift the price, but without continued high-volume confirmation afterward, the current $0.0099 looks more like a temporary equilibrium: $0.0095 below is an area that has repeatedly held over the past week or so, while $0.0103 above is a ceiling that has been tested twice and not broken. With market cap ranked #101 and the volume-to-market-cap ratio close to one-third, it shows the float is still actively moving, not sitting dead.
The real risk also lies in the timeframes. Being 85% below ATH means there is a lot of trapped supply overhead; if $0.0095 is broken decisively, the 30-day stair-step structure would fail, not just a simple short-term stop-loss level.
So I want to ask you: which level are you watching right now? For short-term trading, the key is when this $0.0095 to $0.0103 range chooses a direction; for swing trading, the bigger question is whether the 30-day stair-step structure has been damaged. The answers to those two questions are likely to be opposite.
Looking only at the 24-hour move of +3.48%, $PENGU seems to have recovered from yesterday’s pullback. But zoom out a bit, and the 7-day figure is still -8.18%, while the 30-day figure is +13.97% — three timeframes telling three different stories.
This is actually a typical slice of market action. In mid-September, it was still hovering around $0.0068. Then on September 23, volume suddenly surged to $512M, pushing the price straight above $0.010. After that, for six days it neither broke below $0.0094 nor pushed above $0.0103, looking more like consolidation and turnover within the post-breakout high range. That 24-hour gain is just one brick on the stairway when placed in a 30-day context; the 7-day decline is merely a normal retest between steps.
What matters more to me is the pullback in daily trading volume. The kind of volume seen on September 23 was enough to lift the price, but without continued high-volume confirmation afterward, the current $0.0099 looks more like a temporary equilibrium: $0.0095 below is an area that has repeatedly held over the past week or so, while $0.0103 above is a ceiling that has been tested twice and not broken. With market cap ranked #101 and the volume-to-market-cap ratio close to one-third, it shows the float is still actively moving, not sitting dead.
The real risk also lies in the timeframes. Being 85% below ATH means there is a lot of trapped supply overhead; if $0.0095 is broken decisively, the 30-day stair-step structure would fail, not just a simple short-term stop-loss level.
So I want to ask you: which level are you watching right now? For short-term trading, the key is when this $0.0095 to $0.0103 range chooses a direction; for swing trading, the bigger question is whether the 30-day stair-step structure has been damaged. The answers to those two questions are likely to be opposite.
This is actually a typical slice of market action. In mid-September, it was still hovering around $0.0068. Then on September 23, volume suddenly surged to $512M, pushing the price straight above $0.010. After that, for six days it neither broke below $0.0094 nor pushed above $0.0103, looking more like consolidation and turnover within the post-breakout high range. That 24-hour gain is just one brick on the stairway when placed in a 30-day context; the 7-day decline is merely a normal retest between steps.
What matters more to me is the pullback in daily trading volume. The kind of volume seen on September 23 was enough to lift the price, but without continued high-volume confirmation afterward, the current $0.0099 looks more like a temporary equilibrium: $0.0095 below is an area that has repeatedly held over the past week or so, while $0.0103 above is a ceiling that has been tested twice and not broken. With market cap ranked #101 and the volume-to-market-cap ratio close to one-third, it shows the float is still actively moving, not sitting dead.
The real risk also lies in the timeframes. Being 85% below ATH means there is a lot of trapped supply overhead; if $0.0095 is broken decisively, the 30-day stair-step structure would fail, not just a simple short-term stop-loss level.
So I want to ask you: which level are you watching right now? For short-term trading, the key is when this $0.0095 to $0.0103 range chooses a direction; for swing trading, the bigger question is whether the 30-day stair-step structure has been damaged. The answers to those two questions are likely to be opposite.
32
·
--
About 0.98 US cents: $PENGU is sitting between 0.0094 and 0.0100. After being pulled back from 0.0068, it didn’t surge in one breath—it looks more like funds are consolidating before choosing a direction, rather than the endpoint of a trend. To verify this hunch, I only want to confirm three things: where exactly the rebound starts, whether the breakout near the upper level relies on volume, and whether volume can be sustained.
On the chart, the low was hit in mid-September at 0.0068. Over the following week, trading volume rose from 166M to 512M, and price lifted in tandem—buyers showed initiative. In the past five days, it has been repeatedly trading just below 0.010. The $219M in turnover isn’t small; it’s just that the “combined force” hasn’t formed yet. ATH is still down -85.68% in the books: for funds that don’t care about old stories, this leaves room for imagination; for those already in the market, every rebound has to be explained.
What I care about more is whether this round of rebound has follow-through. If it can hold steady and break through the confirmation zone of 0.0100–0.0115, then $PENGU (ranked #101 by market cap) likely has value for an upside probe. But the one-year -66.29% is a reminder: it’s still carrying the baggage of a bear-market structure. From here, it could be a reversal—or it could be a segment within a wide-ranging consolidation.
The invalidation conditions are very clear: if over the next three days the daily trading volume keeps shrinking day by day, and the price falls back and breaks below 0.0090, then this consolidation won’t be called “consolidation”—it will be called distribution, and my judgment will be void. Whether to hold or wait for a lower entry depends on your own rules; no need to pick a side—test your positions with the price action, because verifying with charts is more solid than trusting any viewpoint.
About 0.98 US cents: $PENGU is sitting between 0.0094 and 0.0100. After being pulled back from 0.0068, it didn’t surge in one breath—it looks more like funds are consolidating before choosing a direction, rather than the endpoint of a trend. To verify this hunch, I only want to confirm three things: where exactly the rebound starts, whether the breakout near the upper level relies on volume, and whether volume can be sustained.
On the chart, the low was hit in mid-September at 0.0068. Over the following week, trading volume rose from 166M to 512M, and price lifted in tandem—buyers showed initiative. In the past five days, it has been repeatedly trading just below 0.010. The $219M in turnover isn’t small; it’s just that the “combined force” hasn’t formed yet. ATH is still down -85.68% in the books: for funds that don’t care about old stories, this leaves room for imagination; for those already in the market, every rebound has to be explained.
What I care about more is whether this round of rebound has follow-through. If it can hold steady and break through the confirmation zone of 0.0100–0.0115, then $PENGU (ranked #101 by market cap) likely has value for an upside probe. But the one-year -66.29% is a reminder: it’s still carrying the baggage of a bear-market structure. From here, it could be a reversal—or it could be a segment within a wide-ranging consolidation.
The invalidation conditions are very clear: if over the next three days the daily trading volume keeps shrinking day by day, and the price falls back and breaks below 0.0090, then this consolidation won’t be called “consolidation”—it will be called distribution, and my judgment will be void. Whether to hold or wait for a lower entry depends on your own rules; no need to pick a side—test your positions with the price action, because verifying with charts is more solid than trusting any viewpoint.
On the chart, the low was hit in mid-September at 0.0068. Over the following week, trading volume rose from 166M to 512M, and price lifted in tandem—buyers showed initiative. In the past five days, it has been repeatedly trading just below 0.010. The $219M in turnover isn’t small; it’s just that the “combined force” hasn’t formed yet. ATH is still down -85.68% in the books: for funds that don’t care about old stories, this leaves room for imagination; for those already in the market, every rebound has to be explained.
What I care about more is whether this round of rebound has follow-through. If it can hold steady and break through the confirmation zone of 0.0100–0.0115, then $PENGU (ranked #101 by market cap) likely has value for an upside probe. But the one-year -66.29% is a reminder: it’s still carrying the baggage of a bear-market structure. From here, it could be a reversal—or it could be a segment within a wide-ranging consolidation.
The invalidation conditions are very clear: if over the next three days the daily trading volume keeps shrinking day by day, and the price falls back and breaks below 0.0090, then this consolidation won’t be called “consolidation”—it will be called distribution, and my judgment will be void. Whether to hold or wait for a lower entry depends on your own rules; no need to pick a side—test your positions with the price action, because verifying with charts is more solid than trusting any viewpoint.
11

·
--
** 84,399$ – Why Expecting “Moon” at This Price Is Wrong?Pudgy Penguins (PENGUUSDT) is trending right now!
Rank: #101
** When you see a number like 84,399 $, does “the apocalypse” start ringing in your head? In my view, this level isn’t a “sell” signal—instead, it’s a “pump” opportunity. In 24 hours, with a 1.259% increase, it reached a trading volume of 1.287 billion $. Liquidity is still in our hands. This isn’t an ideal bottom for a “re-entry”; it’s the setup for a “breakout.” Now let’s look at: ,741.77, with a 2.119% rise and an 800 million $ volume. Its rise is being fueled by new smart contract updates for Layer-2 solutions (Arbitrum, Optimism). This opens up an attractive window for short-term “DCA” moves by . In the altcoin space, the move you most “should be watching” is AVAX. With a 12.154% increase to the 1.959 level, and drawing attention with a 9.38 million $ quote volume. I don’t see “AVAX” just as a “pump”; the network’s staking yields and the new “subnet” launch make the price sustainable. On the other hand, NEAR is down 5.5%—a clear “dump” signal. If you opened a “short” position on NEAR, keep risk management tight; otherwise you could get “rekt.” Link (LINK) is also up 4.658%, at the 5.414 level—its Oracle ecosystem is expanding. This is another coin I’m considering for an “ape in” strategy. Meanwhile, LTC is down 4.351% at 9.25—you could consider taking profit with a “sell-the-news” tactic. Let me share one of my daily tactics: place a “limit buy” at the 0.5% level for , and set a “take-profit” target at 6K
** 84,399$ – Why Expecting “Moon” at This Price Is Wrong?
Pudgy Penguins (PENGUUSDT) is trending right now!
Rank: #101
** When you see a number like 84,399 $, does “the apocalypse” start ringing in your head? In my view, this level isn’t a “sell” signal—instead, it’s a “pump” opportunity. In 24 hours, with a 1.259% increase, it reached a trading volume of 1.287 billion $. Liquidity is still in our hands. This isn’t an ideal bottom for a “re-entry”; it’s the setup for a “breakout.” Now let’s look at: ,741.77, with a 2.119% rise and an 800 million $ volume. Its rise is being fueled by new smart contract updates for Layer-2 solutions (Arbitrum, Optimism). This opens up an attractive window for short-term “DCA” moves by . In the altcoin space, the move you most “should be watching” is AVAX. With a 12.154% increase to the 1.959 level, and drawing attention with a 9.38 million $ quote volume. I don’t see “AVAX” just as a “pump”; the network’s staking yields and the new “subnet” launch make the price sustainable. On the other hand, NEAR is down 5.5%—a clear “dump” signal. If you opened a “short” position on NEAR, keep risk management tight; otherwise you could get “rekt.” Link (LINK) is also up 4.658%, at the 5.414 level—its Oracle ecosystem is expanding. This is another coin I’m considering for an “ape in” strategy. Meanwhile, LTC is down 4.351% at 9.25—you could consider taking profit with a “sell-the-news” tactic. Let me share one of my daily tactics: place a “limit buy” at the 0.5% level for , and set a “take-profit” target at 6K
Rank: #101
** When you see a number like 84,399 $, does “the apocalypse” start ringing in your head? In my view, this level isn’t a “sell” signal—instead, it’s a “pump” opportunity. In 24 hours, with a 1.259% increase, it reached a trading volume of 1.287 billion $. Liquidity is still in our hands. This isn’t an ideal bottom for a “re-entry”; it’s the setup for a “breakout.” Now let’s look at: ,741.77, with a 2.119% rise and an 800 million $ volume. Its rise is being fueled by new smart contract updates for Layer-2 solutions (Arbitrum, Optimism). This opens up an attractive window for short-term “DCA” moves by . In the altcoin space, the move you most “should be watching” is AVAX. With a 12.154% increase to the 1.959 level, and drawing attention with a 9.38 million $ quote volume. I don’t see “AVAX” just as a “pump”; the network’s staking yields and the new “subnet” launch make the price sustainable. On the other hand, NEAR is down 5.5%—a clear “dump” signal. If you opened a “short” position on NEAR, keep risk management tight; otherwise you could get “rekt.” Link (LINK) is also up 4.658%, at the 5.414 level—its Oracle ecosystem is expanding. This is another coin I’m considering for an “ape in” strategy. Meanwhile, LTC is down 4.351% at 9.25—you could consider taking profit with a “sell-the-news” tactic. Let me share one of my daily tactics: place a “limit buy” at the 0.5% level for , and set a “take-profit” target at 6K
39
·
--
** How can you do a Daily Market Analysis and create profitable trade strategies? 📈💡Pudgy Penguins (PENGUUSDT) is trending right now!
Rank: #101
** ### Step 1 – Extract the “Daily Market SnapShot” **Why is it important?** Knowing the assets moving fastest during the day helps you capture the “high volatility + liquidity” combination. - **How to do it:** On Binance Square, go to the **Spot > Market > Top Movers** tab. According to the 2026‑09‑29 data: | Symbol | Price (USDT) | 24h % Change | Volume (USDT) | |--------|--------------|--------------|--------------| | | **15.61** | **+11.77 %** | 127.99 M | | | **4.80** | **‑9.89 %** | 230.01 M | | | **8.78** | **‑8.85 %** | 116.03 M | | | **1.73** | **‑7.73 %** | 5.90 M | | | **1.18** | **‑6.93 %** | 16.59 M | 🔎 **Tip:** Pairs with Volume > 100 M USDT indicate high “real buy-sell” activity → lower slippage and cleaner entries/exits. --- ### Step 2 – Analyze the “Price and Volume” Chart **Why is it important?** Chart patterns like “head-and-shoulders” and “cup-and-handle” can give you clues about short-term trend reversals. - **Practical example:** On the ’s 24-hour chart: - **Between High (15.617)** and **Low (13.476)** there is compression. - **Volume breakout**: 8,748,200 LINK (≈ 127.99 M USDT) → volume increases during the price rise. - **Visual cue:** The “Ascending Triangle” pattern: the upper resistance is flat, while the lower support is rising → a breakout is expected. 📊 **What should you do?** - **Buy:** From the 15.55 USDT level, get confirmation of a “breakout” above 15.60 USDT (example: 5% increasing volume
** How can you do a Daily Market Analysis and create profitable trade strategies? 📈💡
Pudgy Penguins (PENGUUSDT) is trending right now!
Rank: #101
** ### Step 1 – Extract the “Daily Market SnapShot” **Why is it important?** Knowing the assets moving fastest during the day helps you capture the “high volatility + liquidity” combination. - **How to do it:** On Binance Square, go to the **Spot > Market > Top Movers** tab. According to the 2026‑09‑29 data: | Symbol | Price (USDT) | 24h % Change | Volume (USDT) | |--------|--------------|--------------|--------------| | | **15.61** | **+11.77 %** | 127.99 M | | | **4.80** | **‑9.89 %** | 230.01 M | | | **8.78** | **‑8.85 %** | 116.03 M | | | **1.73** | **‑7.73 %** | 5.90 M | | | **1.18** | **‑6.93 %** | 16.59 M | 🔎 **Tip:** Pairs with Volume > 100 M USDT indicate high “real buy-sell” activity → lower slippage and cleaner entries/exits. --- ### Step 2 – Analyze the “Price and Volume” Chart **Why is it important?** Chart patterns like “head-and-shoulders” and “cup-and-handle” can give you clues about short-term trend reversals. - **Practical example:** On the ’s 24-hour chart: - **Between High (15.617)** and **Low (13.476)** there is compression. - **Volume breakout**: 8,748,200 LINK (≈ 127.99 M USDT) → volume increases during the price rise. - **Visual cue:** The “Ascending Triangle” pattern: the upper resistance is flat, while the lower support is rising → a breakout is expected. 📊 **What should you do?** - **Buy:** From the 15.55 USDT level, get confirmation of a “breakout” above 15.60 USDT (example: 5% increasing volume
Rank: #101
** ### Step 1 – Extract the “Daily Market SnapShot” **Why is it important?** Knowing the assets moving fastest during the day helps you capture the “high volatility + liquidity” combination. - **How to do it:** On Binance Square, go to the **Spot > Market > Top Movers** tab. According to the 2026‑09‑29 data: | Symbol | Price (USDT) | 24h % Change | Volume (USDT) | |--------|--------------|--------------|--------------| | | **15.61** | **+11.77 %** | 127.99 M | | | **4.80** | **‑9.89 %** | 230.01 M | | | **8.78** | **‑8.85 %** | 116.03 M | | | **1.73** | **‑7.73 %** | 5.90 M | | | **1.18** | **‑6.93 %** | 16.59 M | 🔎 **Tip:** Pairs with Volume > 100 M USDT indicate high “real buy-sell” activity → lower slippage and cleaner entries/exits. --- ### Step 2 – Analyze the “Price and Volume” Chart **Why is it important?** Chart patterns like “head-and-shoulders” and “cup-and-handle” can give you clues about short-term trend reversals. - **Practical example:** On the ’s 24-hour chart: - **Between High (15.617)** and **Low (13.476)** there is compression. - **Volume breakout**: 8,748,200 LINK (≈ 127.99 M USDT) → volume increases during the price rise. - **Visual cue:** The “Ascending Triangle” pattern: the upper resistance is flat, while the lower support is rising → a breakout is expected. 📊 **What should you do?** - **Buy:** From the 15.55 USDT level, get confirmation of a “breakout” above 15.60 USDT (example: 5% increasing volume
71
·
--
** How Can You Make Daily Market Analysis and Earn Profit? – Binance Square Guide 📈Pudgy Penguins (PENGUUSDT) is trending right now!
Rank: #101
** ### Step 1️⃣ – “Open the Market Overview” **Why is it important?** Real-time data becomes the basis of your decision. Opening a trade with incorrect information increases losses. - **What should you do?** Go to the “Market Overview” tab on Binance Square and open the **24-hour change** table. - **Example:** According to the data from 27 Sept 2026, the most rising asset **** (%3.33, price 1.86 USDT) while the most falling **** (%‑2.82, price 1.5219 USDT). - **Visual hint:** 📊 **Heat-map** colors: green = uptrend, red = downtrend. Scan these colors quickly to spot “hot” opportunities. --- ### Step 2️⃣ – “Check Volume and Liquidity” **Why is it important?** High volume shows the reliability of price movements; low volume carries a manipulation risk. - **What should you do?** Look at each ticker’s **“Volume (USDT)”** column. - **Example:** With a price of 5.061 USDT, the second most liquid asset has a trading volume of **129 Million USDT**. has a volume of **50 Million USDT** at a price of 0.0965 USDT—less liquid. - **Practical application:** Prefer pairs with volume above 10 Million USDT. This reduces slippage (price movement). --- ### Step 3️⃣ – “Analyze the Price Chart (Chart Patterns)” **Why is it important?** Technical formations provide clues about the likely direction of the price in the future. | Pattern | What does it mean? | Visual hint | |-----------|----------------|--------------| | **Bullish Engulfing** | Selling pressure is over; buyers take control. | 📈 Bar
** How Can You Make Daily Market Analysis and Earn Profit? – Binance Square Guide 📈
Pudgy Penguins (PENGUUSDT) is trending right now!
Rank: #101
** ### Step 1️⃣ – “Open the Market Overview” **Why is it important?** Real-time data becomes the basis of your decision. Opening a trade with incorrect information increases losses. - **What should you do?** Go to the “Market Overview” tab on Binance Square and open the **24-hour change** table. - **Example:** According to the data from 27 Sept 2026, the most rising asset **** (%3.33, price 1.86 USDT) while the most falling **** (%‑2.82, price 1.5219 USDT). - **Visual hint:** 📊 **Heat-map** colors: green = uptrend, red = downtrend. Scan these colors quickly to spot “hot” opportunities. --- ### Step 2️⃣ – “Check Volume and Liquidity” **Why is it important?** High volume shows the reliability of price movements; low volume carries a manipulation risk. - **What should you do?** Look at each ticker’s **“Volume (USDT)”** column. - **Example:** With a price of 5.061 USDT, the second most liquid asset has a trading volume of **129 Million USDT**. has a volume of **50 Million USDT** at a price of 0.0965 USDT—less liquid. - **Practical application:** Prefer pairs with volume above 10 Million USDT. This reduces slippage (price movement). --- ### Step 3️⃣ – “Analyze the Price Chart (Chart Patterns)” **Why is it important?** Technical formations provide clues about the likely direction of the price in the future. | Pattern | What does it mean? | Visual hint | |-----------|----------------|--------------| | **Bullish Engulfing** | Selling pressure is over; buyers take control. | 📈 Bar
Rank: #101
** ### Step 1️⃣ – “Open the Market Overview” **Why is it important?** Real-time data becomes the basis of your decision. Opening a trade with incorrect information increases losses. - **What should you do?** Go to the “Market Overview” tab on Binance Square and open the **24-hour change** table. - **Example:** According to the data from 27 Sept 2026, the most rising asset **** (%3.33, price 1.86 USDT) while the most falling **** (%‑2.82, price 1.5219 USDT). - **Visual hint:** 📊 **Heat-map** colors: green = uptrend, red = downtrend. Scan these colors quickly to spot “hot” opportunities. --- ### Step 2️⃣ – “Check Volume and Liquidity” **Why is it important?** High volume shows the reliability of price movements; low volume carries a manipulation risk. - **What should you do?** Look at each ticker’s **“Volume (USDT)”** column. - **Example:** With a price of 5.061 USDT, the second most liquid asset has a trading volume of **129 Million USDT**. has a volume of **50 Million USDT** at a price of 0.0965 USDT—less liquid. - **Practical application:** Prefer pairs with volume above 10 Million USDT. This reduces slippage (price movement). --- ### Step 3️⃣ – “Analyze the Price Chart (Chart Patterns)” **Why is it important?** Technical formations provide clues about the likely direction of the price in the future. | Pattern | What does it mean? | Visual hint | |-----------|----------------|--------------| | **Bullish Engulfing** | Selling pressure is over; buyers take control. | 📈 Bar
29
·
--
** NEAR Rockets 10.5% – Is This the New Alt Season?Official Trump (TRUMPUSDT) is trending right now!
Rank: #101
** 🚀 **NEAR has just exploded +10.495%**, trading at **.622** with 79M volume! Meanwhile, it pumped **+4.672%** to **/bin/sh.09814** and surged **+3.207%** to **.5381**. On the flip side, is feeling the heat, down **‑5.000%** at **0.849**. Bence, these moves are the start of an altcoin high-volatility wave. NEAR’s strong on-chain
#bitcoin #ethereum #crypto
** NEAR Rockets 10.5% – Is This the New Alt Season?
Official Trump (TRUMPUSDT) is trending right now!
Rank: #101
** 🚀 **NEAR has just exploded +10.495%**, trading at **.622** with 79M volume! Meanwhile, it pumped **+4.672%** to **/bin/sh.09814** and surged **+3.207%** to **.5381**. On the flip side, is feeling the heat, down **‑5.000%** at **0.849**. Bence, these moves are the start of an altcoin high-volatility wave. NEAR’s strong on-chain
#bitcoin #ethereum #crypto
Rank: #101
** 🚀 **NEAR has just exploded +10.495%**, trading at **.622** with 79M volume! Meanwhile, it pumped **+4.672%** to **/bin/sh.09814** and surged **+3.207%** to **.5381**. On the flip side, is feeling the heat, down **‑5.000%** at **0.849**. Bence, these moves are the start of an altcoin high-volatility wave. NEAR’s strong on-chain
#bitcoin #ethereum #crypto
27
·
--
** ,500 Level? UniSwap’s 12% Crazy Jump Might Be Misleading!Pudgy Penguins (PENGUUSDT) is trending right now!
Rank: #101
** Start the conversation with a sudden **12%** jump... UniSwap () rose to 7.03 USDT last night and gained **12.4%** in 24 hours. So, is this more attractive than ’s slight **1.7%** rise? Most people say “ will hit ,600 soon,” but I think **2,501.88** is an “exit point.” **Market breadth**: ’s volume is 455 M USDT, meaning there is liquidity flow equal to 30% of the previous day. At the same time, still stands like a shadow — even if I don’t share its price here, it’s clear that is in “tight consolidation” and the big whales have not yet shown their direction. This situation is giving **Layer‑2** projects (for example, and ) more “visibility.” **Observation 1 – UniSwap**: ’s **12.4%** increase shows that liquidity providers (LPs) are “aping in” to ease the risk of being “rekt soon.” However, the **open‑high‑low** range is 6.20-7.48 USDT, so volatility is still high. If you are considering **DCA** at lower price levels, around 6.30 USDT could be an “entry zone.” **Observation 2 – Polkadot & Near**: rose 5.9% to 0.977 USDT, and also increased 4.9% to 2.34 USDT. Both tokens are challenging ’s “upper layer” role with **DeFi infrastructure** and **cross‑chain** solutions. In particular, ’s “parachain slot” auctions could trigger short-term pumps. **Observation 3 – Solana**: rose 3.8% to 107.11 USDT, but its volume was 268 M
** ,500 Level? UniSwap’s 12% Crazy Jump Might Be Misleading!
Pudgy Penguins (PENGUUSDT) is trending right now!
Rank: #101
** Start the conversation with a sudden **12%** jump... UniSwap () rose to 7.03 USDT last night and gained **12.4%** in 24 hours. So, is this more attractive than ’s slight **1.7%** rise? Most people say “ will hit ,600 soon,” but I think **2,501.88** is an “exit point.” **Market breadth**: ’s volume is 455 M USDT, meaning there is liquidity flow equal to 30% of the previous day. At the same time, still stands like a shadow — even if I don’t share its price here, it’s clear that is in “tight consolidation” and the big whales have not yet shown their direction. This situation is giving **Layer‑2** projects (for example, and ) more “visibility.” **Observation 1 – UniSwap**: ’s **12.4%** increase shows that liquidity providers (LPs) are “aping in” to ease the risk of being “rekt soon.” However, the **open‑high‑low** range is 6.20-7.48 USDT, so volatility is still high. If you are considering **DCA** at lower price levels, around 6.30 USDT could be an “entry zone.” **Observation 2 – Polkadot & Near**: rose 5.9% to 0.977 USDT, and also increased 4.9% to 2.34 USDT. Both tokens are challenging ’s “upper layer” role with **DeFi infrastructure** and **cross‑chain** solutions. In particular, ’s “parachain slot” auctions could trigger short-term pumps. **Observation 3 – Solana**: rose 3.8% to 107.11 USDT, but its volume was 268 M
Rank: #101
** Start the conversation with a sudden **12%** jump... UniSwap () rose to 7.03 USDT last night and gained **12.4%** in 24 hours. So, is this more attractive than ’s slight **1.7%** rise? Most people say “ will hit ,600 soon,” but I think **2,501.88** is an “exit point.” **Market breadth**: ’s volume is 455 M USDT, meaning there is liquidity flow equal to 30% of the previous day. At the same time, still stands like a shadow — even if I don’t share its price here, it’s clear that is in “tight consolidation” and the big whales have not yet shown their direction. This situation is giving **Layer‑2** projects (for example, and ) more “visibility.” **Observation 1 – UniSwap**: ’s **12.4%** increase shows that liquidity providers (LPs) are “aping in” to ease the risk of being “rekt soon.” However, the **open‑high‑low** range is 6.20-7.48 USDT, so volatility is still high. If you are considering **DCA** at lower price levels, around 6.30 USDT could be an “entry zone.” **Observation 2 – Polkadot & Near**: rose 5.9% to 0.977 USDT, and also increased 4.9% to 2.34 USDT. Both tokens are challenging ’s “upper layer” role with **DeFi infrastructure** and **cross‑chain** solutions. In particular, ’s “parachain slot” auctions could trigger short-term pumps. **Observation 3 – Solana**: rose 3.8% to 107.11 USDT, but its volume was 268 M
102


·
--
I’ve been tracking the latest CoinGecko buzz and Uniswap (UNI) jumped +8.2%, while Arbitrum (ARB) surged +12.5%—both cracking the top‑30 ranks. 🚀
Pond (PONS) rallied +5.4% at rank #132, Ramses (RAM) climbed +7.1% to #354, and up (UP) ticked up +3.9% around #704. 🌊
I also spotted Pump.fun (PUMP) gaining +9.0% at #50 and Pudgy Penguins (PENGU) up +4.6% near #101. I’m keeping an eye on these movers for my next trade. 🎯
$SC, $ARB, $USELESS
I’ve been tracking the latest CoinGecko buzz and Uniswap (UNI) jumped +8.2%, while Arbitrum (ARB) surged +12.5%—both cracking the top‑30 ranks. 🚀
Pond (PONS) rallied +5.4% at rank #132, Ramses (RAM) climbed +7.1% to #354, and up (UP) ticked up +3.9% around #704. 🌊
I also spotted Pump.fun (PUMP) gaining +9.0% at #50 and Pudgy Penguins (PENGU) up +4.6% near #101. I’m keeping an eye on these movers for my next trade. 🎯
$SC , $ARB , $USELESS
Pond (PONS) rallied +5.4% at rank #132, Ramses (RAM) climbed +7.1% to #354, and up (UP) ticked up +3.9% around #704. 🌊
I also spotted Pump.fun (PUMP) gaining +9.0% at #50 and Pudgy Penguins (PENGU) up +4.6% near #101. I’m keeping an eye on these movers for my next trade. 🎯
$SC , $ARB , $USELESS
340
·
--
Trending: Curve DAO (CRVUSDT)Curve DAO (CRVUSDT) is trending on CoinGecko!
Rank: #101
On September 1, 2026, the crypto market showed a mixed but generally upbeat picture. Ethereum (ETH) held steady around the ,460 mark, posting a modest 1.90% gain over the past 24 hours with a robust trading volume of roughly 87.6 million. While ETH’s price movement was relatively subdued compared to some of its peers, the underlying volume indicates continued active participation from traders and investors.
The day’s standout performers came from the altcoin sector. NEAR Protocol (NEARUSDT) led the charge, climbing 5.45% to .935. The token’s rise was supported by a noticeable uptick in trading activity—quote volume exceeded 5.8 million—and a price range that stretched from a low of .807 to a high of .956. This momentum suggests renewed interest in NEAR’s ecosystem, possibly driven by recent upgrades or developer activity.
Polkadot (DOTUSDT) followed with a 3.67% increase to /bin/sh.848, while Uniswap (UNIUSDT) and Cardano (ADAUSDT) posted gains of 3.47% and 3.26%, respectively. Both UNI and ADA displayed healthy bid‑ask spreads and substantial volumes, underscoring liquidity in these markets. Notably, ADA’s trading volume reached over 90 million tokens, reflecting broad market participation.
Other notable movers included Avalanche (AVAX) up 1.84%, Chainlink (LINK) up 1.66%, XRP up 1.58%, Cosmos (ATOM) up 1.31%, and Solana (SOL) up 1.13%. Although these percentages are smaller than the leaders, they still indicate a broadly positive sentiment across multiple blockchain platforms.
The absence of any significant losers in the data set points to a generally risk‑on environment, where buying pressure outweighs selling pressure across the sampled assets. Such conditions often coincide with macro‑economic factors—such as stabilizing fiat markets or positive news around blockchain infrastructure—that encourage investors to allocate capital to higher‑beta assets like altcoins.
From an educational perspective, today’s snapshot highlights how Bitcoin’s largest smart‑contract platform, Ethereum, can serve as a market anchor while altcoins experience more pronounced short‑term swings. Traders often watch the relative strength of ETH versus altcoins to gauge market rotation: when ETH shows modest gains but altcoins outperform, it may signal a shift toward risk‑appetite and speculative interest in emerging projects.
As always, market participants should consider a range of factors—including on‑chain metrics, upcoming protocol updates, and broader economic indicators—before forming any outlook. The data presented here is a snapshot intended to inform, not to prescribe any specific action.
#crv #crypto #trending #CoinGecko
Trending: Curve DAO (CRVUSDT)
Curve DAO (CRVUSDT) is trending on CoinGecko!
Rank: #101
On September 1, 2026, the crypto market showed a mixed but generally upbeat picture. Ethereum (ETH) held steady around the ,460 mark, posting a modest 1.90% gain over the past 24 hours with a robust trading volume of roughly 87.6 million. While ETH’s price movement was relatively subdued compared to some of its peers, the underlying volume indicates continued active participation from traders and investors.
The day’s standout performers came from the altcoin sector. NEAR Protocol (NEARUSDT) led the charge, climbing 5.45% to .935. The token’s rise was supported by a noticeable uptick in trading activity—quote volume exceeded 5.8 million—and a price range that stretched from a low of .807 to a high of .956. This momentum suggests renewed interest in NEAR’s ecosystem, possibly driven by recent upgrades or developer activity.
Polkadot (DOTUSDT) followed with a 3.67% increase to /bin/sh.848, while Uniswap (UNIUSDT) and Cardano (ADAUSDT) posted gains of 3.47% and 3.26%, respectively. Both UNI and ADA displayed healthy bid‑ask spreads and substantial volumes, underscoring liquidity in these markets. Notably, ADA’s trading volume reached over 90 million tokens, reflecting broad market participation.
Other notable movers included Avalanche (AVAX) up 1.84%, Chainlink (LINK) up 1.66%, XRP up 1.58%, Cosmos (ATOM) up 1.31%, and Solana (SOL) up 1.13%. Although these percentages are smaller than the leaders, they still indicate a broadly positive sentiment across multiple blockchain platforms.
The absence of any significant losers in the data set points to a generally risk‑on environment, where buying pressure outweighs selling pressure across the sampled assets. Such conditions often coincide with macro‑economic factors—such as stabilizing fiat markets or positive news around blockchain infrastructure—that encourage investors to allocate capital to higher‑beta assets like altcoins.
From an educational perspective, today’s snapshot highlights how Bitcoin’s largest smart‑contract platform, Ethereum, can serve as a market anchor while altcoins experience more pronounced short‑term swings. Traders often watch the relative strength of ETH versus altcoins to gauge market rotation: when ETH shows modest gains but altcoins outperform, it may signal a shift toward risk‑appetite and speculative interest in emerging projects.
As always, market participants should consider a range of factors—including on‑chain metrics, upcoming protocol updates, and broader economic indicators—before forming any outlook. The data presented here is a snapshot intended to inform, not to prescribe any specific action.
#crv #crypto #trending #CoinGecko
Rank: #101
On September 1, 2026, the crypto market showed a mixed but generally upbeat picture. Ethereum (ETH) held steady around the ,460 mark, posting a modest 1.90% gain over the past 24 hours with a robust trading volume of roughly 87.6 million. While ETH’s price movement was relatively subdued compared to some of its peers, the underlying volume indicates continued active participation from traders and investors.
The day’s standout performers came from the altcoin sector. NEAR Protocol (NEARUSDT) led the charge, climbing 5.45% to .935. The token’s rise was supported by a noticeable uptick in trading activity—quote volume exceeded 5.8 million—and a price range that stretched from a low of .807 to a high of .956. This momentum suggests renewed interest in NEAR’s ecosystem, possibly driven by recent upgrades or developer activity.
Polkadot (DOTUSDT) followed with a 3.67% increase to /bin/sh.848, while Uniswap (UNIUSDT) and Cardano (ADAUSDT) posted gains of 3.47% and 3.26%, respectively. Both UNI and ADA displayed healthy bid‑ask spreads and substantial volumes, underscoring liquidity in these markets. Notably, ADA’s trading volume reached over 90 million tokens, reflecting broad market participation.
Other notable movers included Avalanche (AVAX) up 1.84%, Chainlink (LINK) up 1.66%, XRP up 1.58%, Cosmos (ATOM) up 1.31%, and Solana (SOL) up 1.13%. Although these percentages are smaller than the leaders, they still indicate a broadly positive sentiment across multiple blockchain platforms.
The absence of any significant losers in the data set points to a generally risk‑on environment, where buying pressure outweighs selling pressure across the sampled assets. Such conditions often coincide with macro‑economic factors—such as stabilizing fiat markets or positive news around blockchain infrastructure—that encourage investors to allocate capital to higher‑beta assets like altcoins.
From an educational perspective, today’s snapshot highlights how Bitcoin’s largest smart‑contract platform, Ethereum, can serve as a market anchor while altcoins experience more pronounced short‑term swings. Traders often watch the relative strength of ETH versus altcoins to gauge market rotation: when ETH shows modest gains but altcoins outperform, it may signal a shift toward risk‑appetite and speculative interest in emerging projects.
As always, market participants should consider a range of factors—including on‑chain metrics, upcoming protocol updates, and broader economic indicators—before forming any outlook. The data presented here is a snapshot intended to inform, not to prescribe any specific action.
#crv #crypto #trending #CoinGecko
38

·
--
Contract Quant Brief #101|Disagreement still remains—don’t chase the strongest candle; I’d rather wait for a pullback to confirm
Market status:
The market is still more of a wait-and-see. There are strong moves, but they’ve already stretched to some extent. This isn’t a phase to race the market and chase the highs. It’s more like waiting for a pullback, waiting for confirmation, and waiting for a second push.
Top candidates:
1) ARXUSDT
After a short-term breakout through a range, it started to catch its breath. The 1-hour and 6-hour charts are both showing minor pullbacks, but open interest is still rising. This suggests it isn’t just a pure impulse. It looks more like a pullback for observation rather than a breakout-chase phase.
Observation level: Around 0.238. First, see whether it can hold steady near this area.
Trigger condition: After the pullback, it reclaims the short-term moving average area, and open interest continues to increase.
Invalidation condition: If it falls back below the observation level and the rebound strength can’t push back up.
2) BTWUSDT
The rhythm is smoother than ARX. The 1-hour timeframe is still positive, and the 6-hour trend is continuing as well. The funding rate isn’t high, indicating sentiment hasn’t overheated to the point of absurdity. It fits the type of setup: “still watchable, but don’t chase too urgently.”
Observation level: Around 0.076. Wait for it to pull back, then assess the follow-through.
Trigger condition: After the pullback holds without breaking, it moves upward again—ideally it can return above the short-term moving average.
Invalidation condition: After the pullback, it immediately turns weaker, or open interest increases can’t keep up with the price.
Watchlist (secondary) / Not chasing for now:
TRBUSDT has already surged rather quickly on the 6-hour timeframe. The open-interest increase over 1 hour is also noticeable, which looks more like an acceleration leg—so watch it first and don’t expand into a chase.
Risk warning:
All of these assets have already had some rise and stretch. The biggest risk is chasing in and then turning into the one buying the very last leg. My preference is simple: wait for confirmation first, then decide when to act.
One-sentence summary:
Today is more suitable for making a second choice after a pullback, not for hard-charging when sentiment is at its hottest.
Contract Quant Brief #101|Disagreement still remains—don’t chase the strongest candle; I’d rather wait for a pullback to confirm
Market status:
The market is still more of a wait-and-see. There are strong moves, but they’ve already stretched to some extent. This isn’t a phase to race the market and chase the highs. It’s more like waiting for a pullback, waiting for confirmation, and waiting for a second push.
Top candidates:
1) ARXUSDT
After a short-term breakout through a range, it started to catch its breath. The 1-hour and 6-hour charts are both showing minor pullbacks, but open interest is still rising. This suggests it isn’t just a pure impulse. It looks more like a pullback for observation rather than a breakout-chase phase.
Observation level: Around 0.238. First, see whether it can hold steady near this area.
Trigger condition: After the pullback, it reclaims the short-term moving average area, and open interest continues to increase.
Invalidation condition: If it falls back below the observation level and the rebound strength can’t push back up.
2) BTWUSDT
The rhythm is smoother than ARX. The 1-hour timeframe is still positive, and the 6-hour trend is continuing as well. The funding rate isn’t high, indicating sentiment hasn’t overheated to the point of absurdity. It fits the type of setup: “still watchable, but don’t chase too urgently.”
Observation level: Around 0.076. Wait for it to pull back, then assess the follow-through.
Trigger condition: After the pullback holds without breaking, it moves upward again—ideally it can return above the short-term moving average.
Invalidation condition: After the pullback, it immediately turns weaker, or open interest increases can’t keep up with the price.
Watchlist (secondary) / Not chasing for now:
TRBUSDT has already surged rather quickly on the 6-hour timeframe. The open-interest increase over 1 hour is also noticeable, which looks more like an acceleration leg—so watch it first and don’t expand into a chase.
Risk warning:
All of these assets have already had some rise and stretch. The biggest risk is chasing in and then turning into the one buying the very last leg. My preference is simple: wait for confirmation first, then decide when to act.
One-sentence summary:
Today is more suitable for making a second choice after a pullback, not for hard-charging when sentiment is at its hottest.
Market status:
The market is still more of a wait-and-see. There are strong moves, but they’ve already stretched to some extent. This isn’t a phase to race the market and chase the highs. It’s more like waiting for a pullback, waiting for confirmation, and waiting for a second push.
Top candidates:
1) ARXUSDT
After a short-term breakout through a range, it started to catch its breath. The 1-hour and 6-hour charts are both showing minor pullbacks, but open interest is still rising. This suggests it isn’t just a pure impulse. It looks more like a pullback for observation rather than a breakout-chase phase.
Observation level: Around 0.238. First, see whether it can hold steady near this area.
Trigger condition: After the pullback, it reclaims the short-term moving average area, and open interest continues to increase.
Invalidation condition: If it falls back below the observation level and the rebound strength can’t push back up.
2) BTWUSDT
The rhythm is smoother than ARX. The 1-hour timeframe is still positive, and the 6-hour trend is continuing as well. The funding rate isn’t high, indicating sentiment hasn’t overheated to the point of absurdity. It fits the type of setup: “still watchable, but don’t chase too urgently.”
Observation level: Around 0.076. Wait for it to pull back, then assess the follow-through.
Trigger condition: After the pullback holds without breaking, it moves upward again—ideally it can return above the short-term moving average.
Invalidation condition: After the pullback, it immediately turns weaker, or open interest increases can’t keep up with the price.
Watchlist (secondary) / Not chasing for now:
TRBUSDT has already surged rather quickly on the 6-hour timeframe. The open-interest increase over 1 hour is also noticeable, which looks more like an acceleration leg—so watch it first and don’t expand into a chase.
Risk warning:
All of these assets have already had some rise and stretch. The biggest risk is chasing in and then turning into the one buying the very last leg. My preference is simple: wait for confirmation first, then decide when to act.
One-sentence summary:
Today is more suitable for making a second choice after a pullback, not for hard-charging when sentiment is at its hottest.
1
902

·
--
🤖 $FET / ASI Alliance — Price Prediction 2026 & Beyond 🔥
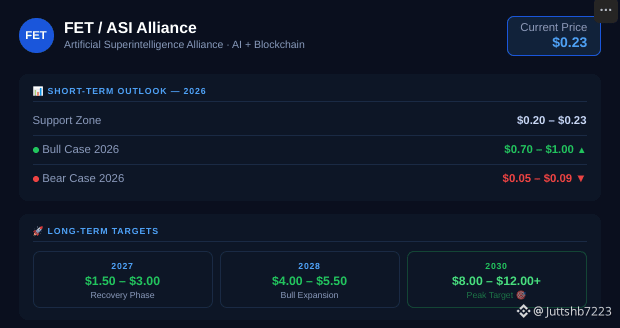
Current Price: ~$0.23
ATH: $3.47 (March 2024)
Market Cap: ~$525M | Rank: #101
⚡ Why $FET Has Potential?
✅ AI + Blockchain = Fastest Growing Combo
✅ ASI Alliance = Fetch.ai + SingularityNET + CUDOS
✅ Agentic AI Era — Jensen Huang (NVIDIA) confirmed this trend
✅ Token Unlock: 2.66M $FET on April 28, 2026
✅ RSI: 54.77 — Neutral Zone (Not Overbought)
✅ Ben Goertzel (CEO) says ASI can rebuild Google's Quantum Circuit
🧠 ASI is building:
→ Decentralized AI Compute
→ AI Agent Marketplace
→ Autonomous Economic Agents
⚠️ Risk: Bearish descending channel since 2024. Recovery needs strong volume.
#FetchAI #ASIAlliance #AIcrypto #BinanceSquare
{spot}(FETUSDT)
💬 Do YOU think FET can 10x from here?
🤖 $FET / ASI Alliance — Price Prediction 2026 & Beyond 🔥
Current Price: ~$0.23
ATH: $3.47 (March 2024)
Market Cap: ~$525M | Rank: #101
⚡ Why $FET Has Potential?
✅ AI + Blockchain = Fastest Growing Combo
✅ ASI Alliance = Fetch.ai + SingularityNET + CUDOS
✅ Agentic AI Era — Jensen Huang (NVIDIA) confirmed this trend
✅ Token Unlock: 2.66M $FET on April 28, 2026
✅ RSI: 54.77 — Neutral Zone (Not Overbought)
✅ Ben Goertzel (CEO) says ASI can rebuild Google's Quantum Circuit
🧠 ASI is building:
→ Decentralized AI Compute
→ AI Agent Marketplace
→ Autonomous Economic Agents
⚠️ Risk: Bearish descending channel since 2024. Recovery needs strong volume.
#FetchAI #ASIAlliance #AIcrypto #BinanceSquare
💬 Do YOU think FET can 10x from here?
Current Price: ~$0.23
ATH: $3.47 (March 2024)
Market Cap: ~$525M | Rank: #101
⚡ Why $FET Has Potential?
✅ AI + Blockchain = Fastest Growing Combo
✅ ASI Alliance = Fetch.ai + SingularityNET + CUDOS
✅ Agentic AI Era — Jensen Huang (NVIDIA) confirmed this trend
✅ Token Unlock: 2.66M $FET on April 28, 2026
✅ RSI: 54.77 — Neutral Zone (Not Overbought)
✅ Ben Goertzel (CEO) says ASI can rebuild Google's Quantum Circuit
🧠 ASI is building:
→ Decentralized AI Compute
→ AI Agent Marketplace
→ Autonomous Economic Agents
⚠️ Risk: Bearish descending channel since 2024. Recovery needs strong volume.
#FetchAI #ASIAlliance #AIcrypto #BinanceSquare
💬 Do YOU think FET can 10x from here?
8
2
25
17.8k

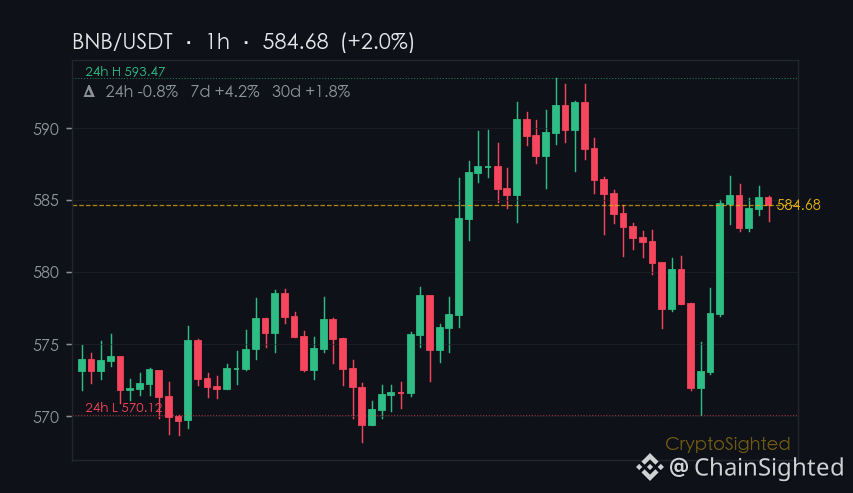
$BNB is down 0.98% in the past 24 hours - a drop that might not be noise.
Binance’s recent additions, like USDⓈ-margin futures for DATAIP, are big moves.
But BNB’s 7-day gain of 5.7% hasn’t translated into much momentum - it’s still lagging by 3.4% over the past 30 days.
$DOGE, meanwhile, is down 0.83% in the same period, but its 7-day gain of 6.1% is already outpacing its 30-day loss of 11.0%.
That’s a strange time frame - like it’s still falling but already moving past the pain.
Not financial advice. DYOR.
📌 Hotspot Watch · #101 · #CryptoTrends #CryptoSighted $BNB
$BNB is down 0.98% in the past 24 hours - a drop that might not be noise.
Binance’s recent additions, like USDⓈ-margin futures for DATAIP, are big moves.
But BNB’s 7-day gain of 5.7% hasn’t translated into much momentum - it’s still lagging by 3.4% over the past 30 days.
$DOGE , meanwhile, is down 0.83% in the same period, but its 7-day gain of 6.1% is already outpacing its 30-day loss of 11.0%.
That’s a strange time frame - like it’s still falling but already moving past the pain.
Not financial advice. DYOR.
📌 Hotspot Watch · #101 · #CryptoTrends #CryptoSighted $BNB
Binance’s recent additions, like USDⓈ-margin futures for DATAIP, are big moves.
But BNB’s 7-day gain of 5.7% hasn’t translated into much momentum - it’s still lagging by 3.4% over the past 30 days.
$DOGE , meanwhile, is down 0.83% in the same period, but its 7-day gain of 6.1% is already outpacing its 30-day loss of 11.0%.
That’s a strange time frame - like it’s still falling but already moving past the pain.
Not financial advice. DYOR.
📌 Hotspot Watch · #101 · #CryptoTrends #CryptoSighted $BNB
336
"Binance’s 2026 listing roadmap is already shaping up - and it’s not even close to balanced."
A stark time gap emerges when comparing token announcements across major ecosystems.
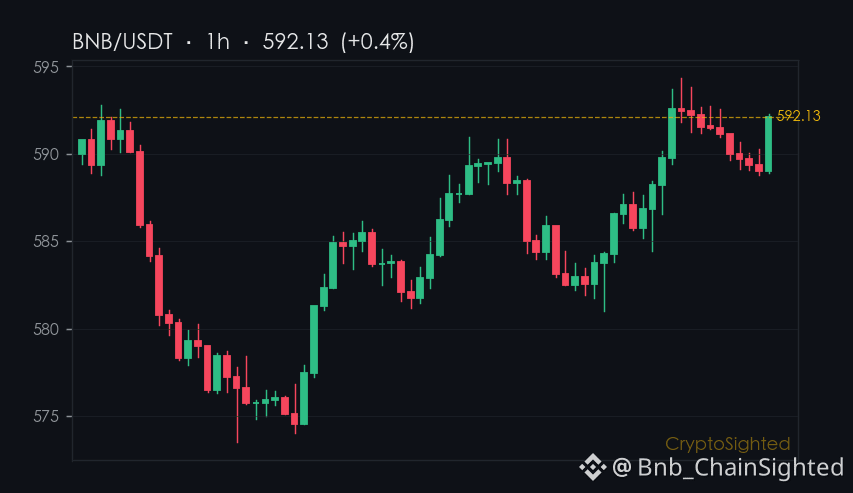
While Bitcoin and Ethereum have multiple futures contracts and tokenized assets set for launch between July and August 2026, other major coins like Solana and $BNB show no similar clustering of future events in the same timeframe.
This divergence hints at a shift in institutional focus - or at least, a delayed one.
It’s not just about timing - it’s about what’s being built.
The question is: is this a temporary misalignment, or is the broader market shifting its attention toward $BTC and $ETH as the primary on-ramps for institutional capital?
Was this a strategic delay - or a signal of where the next wave of adoption is heading?
—
Not financial advice. DYOR.
📌 News Take · #101 · #CryptoNews #CryptoSighted
"Binance’s 2026 listing roadmap is already shaping up - and it’s not even close to balanced."
A stark time gap emerges when comparing token announcements across major ecosystems.
While Bitcoin and Ethereum have multiple futures contracts and tokenized assets set for launch between July and August 2026, other major coins like Solana and $BNB show no similar clustering of future events in the same timeframe.
This divergence hints at a shift in institutional focus - or at least, a delayed one.
It’s not just about timing - it’s about what’s being built.
The question is: is this a temporary misalignment, or is the broader market shifting its attention toward $BTC and $ETH as the primary on-ramps for institutional capital?
Was this a strategic delay - or a signal of where the next wave of adoption is heading?
—
Not financial advice. DYOR.
📌 News Take · #101 · #CryptoNews #CryptoSighted
A stark time gap emerges when comparing token announcements across major ecosystems.
While Bitcoin and Ethereum have multiple futures contracts and tokenized assets set for launch between July and August 2026, other major coins like Solana and $BNB show no similar clustering of future events in the same timeframe.
This divergence hints at a shift in institutional focus - or at least, a delayed one.
It’s not just about timing - it’s about what’s being built.
The question is: is this a temporary misalignment, or is the broader market shifting its attention toward $BTC and $ETH as the primary on-ramps for institutional capital?
Was this a strategic delay - or a signal of where the next wave of adoption is heading?
—
Not financial advice. DYOR.
📌 News Take · #101 · #CryptoNews #CryptoSighted
71
$ZEC is up 5.1% in 24 hours - and its 30-day gain (↑10.9%) outpaces its 7-day move (↑9.6%) .
That’s not just a short-term bounce. It’s a sign of something deeper.
ZEC is trading near $505, with a 24-hour range of $478 to $512.
Volume is 77,589 ZEC - not massive, but enough to suggest real movement.
Its futures position is 479,006 ZEC, worth about $242M.
That’s a chunk of capital committed, and it’s sitting at a near-neutral funding rate of ↑0.0100%.
—
Not financial advice. DYOR.
📌 Gainers Radar · #101 · #Gainers #CryptoSighted $ZEC
$ZEC is up 5.1% in 24 hours - and its 30-day gain (↑10.9%) outpaces its 7-day move (↑9.6%) .
That’s not just a short-term bounce. It’s a sign of something deeper.
ZEC is trading near $505, with a 24-hour range of $478 to $512.
Volume is 77,589 ZEC - not massive, but enough to suggest real movement.
Its futures position is 479,006 ZEC, worth about $242M.
That’s a chunk of capital committed, and it’s sitting at a near-neutral funding rate of ↑0.0100%.
—
Not financial advice. DYOR.
📌 Gainers Radar · #101 · #Gainers #CryptoSighted $ZEC
That’s not just a short-term bounce. It’s a sign of something deeper.
ZEC is trading near $505, with a 24-hour range of $478 to $512.
Volume is 77,589 ZEC - not massive, but enough to suggest real movement.
Its futures position is 479,006 ZEC, worth about $242M.
That’s a chunk of capital committed, and it’s sitting at a near-neutral funding rate of ↑0.0100%.
—
Not financial advice. DYOR.
📌 Gainers Radar · #101 · #Gainers #CryptoSighted $ZEC
301
📈 Binance just added 10 new bStocks trading pairs - but does this mean more attention, or just another wave of noise?
Let’s start with a contrast: $BNB’s 30-day price movement has been up, while its 7-day movement is flat. That’s a longer-term trend that’s held, but a recent week that’s barely moved. And the funding rate for BNB perpetuals has flipped negative, a sign of short-term pressure.
Risk Reminder: Funding hasn’t cooled, and leveraged positions are still open. That means volatility could return - and quickly. Holders should be aware of that.
—
For educational purposes only. Not financial advice.
📌 Crypto 101 · #101 · #CryptoEducation #CryptoSighted $BNB
📈 Binance just added 10 new bStocks trading pairs - but does this mean more attention, or just another wave of noise?
Let’s start with a contrast: $BNB ’s 30-day price movement has been up, while its 7-day movement is flat. That’s a longer-term trend that’s held, but a recent week that’s barely moved. And the funding rate for BNB perpetuals has flipped negative, a sign of short-term pressure.
Risk Reminder: Funding hasn’t cooled, and leveraged positions are still open. That means volatility could return - and quickly. Holders should be aware of that.
—
For educational purposes only. Not financial advice.
📌 Crypto 101 · #101 · #CryptoEducation #CryptoSighted $BNB
Let’s start with a contrast: $BNB ’s 30-day price movement has been up, while its 7-day movement is flat. That’s a longer-term trend that’s held, but a recent week that’s barely moved. And the funding rate for BNB perpetuals has flipped negative, a sign of short-term pressure.
Risk Reminder: Funding hasn’t cooled, and leveraged positions are still open. That means volatility could return - and quickly. Holders should be aware of that.
—
For educational purposes only. Not financial advice.
📌 Crypto 101 · #101 · #CryptoEducation #CryptoSighted $BNB
185

·
--
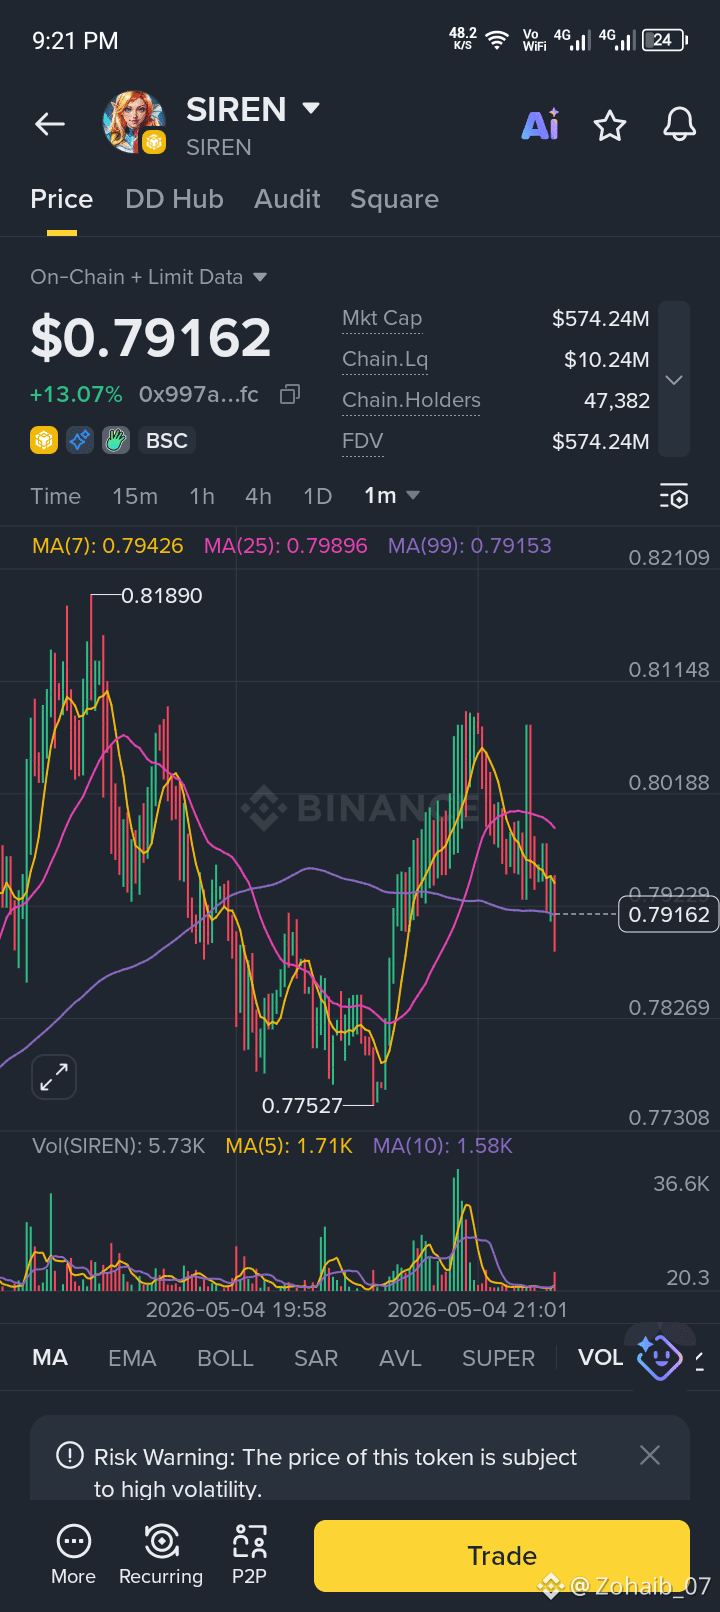
$SIREN
{alpha}(560x997a58129890bbda032231a52ed1ddc845fc18e1)
Live Price Alert & Market Stats
Current Price: ~$0.71 (Average across major exchanges)
24h Range: $0.68 – $0.73
24h Change: ~+0.50% (Slightly trailing the broader market)
Volume: ~$13.3M (57% increase, indicating rising interest)
Market Cap Rank: #97 - #101
Action,Entry/Level,Target (TP),Stop Loss (SL)
Long Entry,$0.69 – $0.70,$0.74 – $0.78,Below $0.67
Short Scalp,$0.73 – $0.74,$0.70,Above $0.76
Technical Analysis (Next 24 Hours)
The price is currently hovering near its short-term Moving Averages (EMA 20/50), signaling a neutral to cautiously bullish setup.
Resistance Levels: The immediate hurdle is at $0.73 – $0.75. A clean break above $0.75 with sustained volume is needed to confirm a move toward $0.79 or higher.
Support Levels: The most critical floor is $0.68. If this fails, expect a retest of the $0.65 zone, which acted as a strong demand base in previous sessions.
RSI: Currently around 40-47, indicating the asset is neither overbought nor deeply oversold. This suggests "range compression" where a breakout could happen in either direction.
Watch the Leaders: Siren is currently tracking with privacy sector leaders like Zcash (ZEC) and Dash (DASH). If they continue to pump, SIREN is likely to follow as a "beta play."
Bitcoin Correlation: Ensure Bitcoin remains stable above $78,000. A BTC dip will likely force SIREN to break its $0.68 support.
Volume Confirmation: Do not "front-run" the $0.73 resistance. Wait for a 15-minute candle to close above $0.73 with an expansion in volume before entering a momentum long.
Risk Warning: SIREN has shown the ability to swing 100%+ in a single day. Ensure you use a hard stop-loss and limit your position size to 1-3% of your total trading capital.
#Write2Earn
$SIREN
Live Price Alert & Market Stats
Current Price: ~$0.71 (Average across major exchanges)
24h Range: $0.68 – $0.73
24h Change: ~+0.50% (Slightly trailing the broader market)
Volume: ~$13.3M (57% increase, indicating rising interest)
Market Cap Rank: #97 - #101
Action,Entry/Level,Target (TP),Stop Loss (SL)
Long Entry,$0.69 – $0.70,$0.74 – $0.78,Below $0.67
Short Scalp,$0.73 – $0.74,$0.70,Above $0.76
Technical Analysis (Next 24 Hours)
The price is currently hovering near its short-term Moving Averages (EMA 20/50), signaling a neutral to cautiously bullish setup.
Resistance Levels: The immediate hurdle is at $0.73 – $0.75. A clean break above $0.75 with sustained volume is needed to confirm a move toward $0.79 or higher.
Support Levels: The most critical floor is $0.68. If this fails, expect a retest of the $0.65 zone, which acted as a strong demand base in previous sessions.
RSI: Currently around 40-47, indicating the asset is neither overbought nor deeply oversold. This suggests "range compression" where a breakout could happen in either direction.
Watch the Leaders: Siren is currently tracking with privacy sector leaders like Zcash (ZEC) and Dash (DASH). If they continue to pump, SIREN is likely to follow as a "beta play."
Bitcoin Correlation: Ensure Bitcoin remains stable above $78,000. A BTC dip will likely force SIREN to break its $0.68 support.
Volume Confirmation: Do not "front-run" the $0.73 resistance. Wait for a 15-minute candle to close above $0.73 with an expansion in volume before entering a momentum long.
Risk Warning: SIREN has shown the ability to swing 100%+ in a single day. Ensure you use a hard stop-loss and limit your position size to 1-3% of your total trading capital.
#Write2Earn
Live Price Alert & Market Stats
Current Price: ~$0.71 (Average across major exchanges)
24h Range: $0.68 – $0.73
24h Change: ~+0.50% (Slightly trailing the broader market)
Volume: ~$13.3M (57% increase, indicating rising interest)
Market Cap Rank: #97 - #101
Action,Entry/Level,Target (TP),Stop Loss (SL)
Long Entry,$0.69 – $0.70,$0.74 – $0.78,Below $0.67
Short Scalp,$0.73 – $0.74,$0.70,Above $0.76
Technical Analysis (Next 24 Hours)
The price is currently hovering near its short-term Moving Averages (EMA 20/50), signaling a neutral to cautiously bullish setup.
Resistance Levels: The immediate hurdle is at $0.73 – $0.75. A clean break above $0.75 with sustained volume is needed to confirm a move toward $0.79 or higher.
Support Levels: The most critical floor is $0.68. If this fails, expect a retest of the $0.65 zone, which acted as a strong demand base in previous sessions.
RSI: Currently around 40-47, indicating the asset is neither overbought nor deeply oversold. This suggests "range compression" where a breakout could happen in either direction.
Watch the Leaders: Siren is currently tracking with privacy sector leaders like Zcash (ZEC) and Dash (DASH). If they continue to pump, SIREN is likely to follow as a "beta play."
Bitcoin Correlation: Ensure Bitcoin remains stable above $78,000. A BTC dip will likely force SIREN to break its $0.68 support.
Volume Confirmation: Do not "front-run" the $0.73 resistance. Wait for a 15-minute candle to close above $0.73 with an expansion in volume before entering a momentum long.
Risk Warning: SIREN has shown the ability to swing 100%+ in a single day. Ensure you use a hard stop-loss and limit your position size to 1-3% of your total trading capital.
#Write2Earn
93
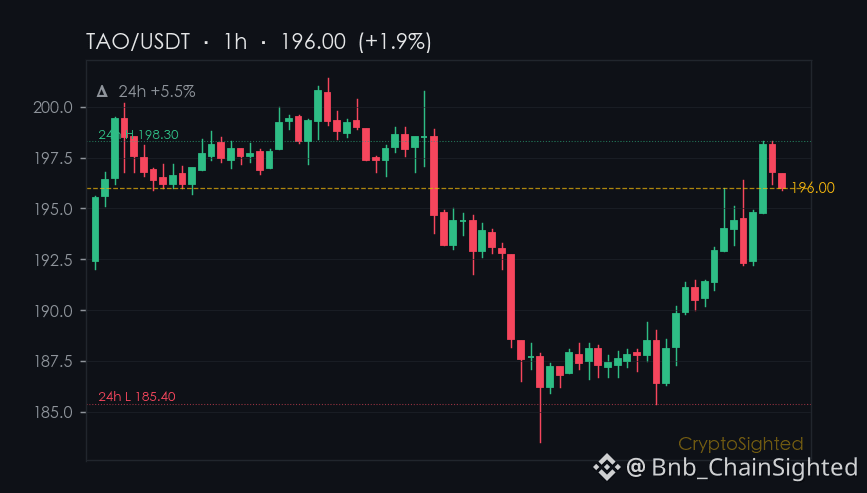
A 5.5% surge in 24 hours, but a 2.3% decline over seven days - $TAO is splitting its signals.
TAO is trading at $196.60, up 5.5% in the last day, but that move is masking a deeper trend: a 2.3% drop in the past week.
The price is rallying, but not enough to reverse the bearish momentum that’s been building over longer timeframes.
The funding rate is flat - ↑0.0050% - suggesting no clear bias from leveraged traders.
That’s not a sign of a squeeze, nor of a stampede.
It’s a signal of balance, of indecision. The market isn’t leaning one way or the other, and that’s telling.
Checkpoint: TAO’s 7-day price change is ↓2.3% - if that trend continues, the short-term bounce may not hold.
If the 30-day position growth keeps rising, the market could still be building something.
But if the price drops further, the gap between the two could widen - and that’s a risk.
—
📊 12 directional calls in the last 30d, every one auto-settled against price. Direction only — no buy/sell calls.
Not financial advice. DYOR.
📌 Funding Pulse · #101 · #FundingRate #CryptoSighted $TAO
A 5.5% surge in 24 hours, but a 2.3% decline over seven days - $TAO is splitting its signals.
TAO is trading at $196.60, up 5.5% in the last day, but that move is masking a deeper trend: a 2.3% drop in the past week.
The price is rallying, but not enough to reverse the bearish momentum that’s been building over longer timeframes.
The funding rate is flat - ↑0.0050% - suggesting no clear bias from leveraged traders.
That’s not a sign of a squeeze, nor of a stampede.
It’s a signal of balance, of indecision. The market isn’t leaning one way or the other, and that’s telling.
Checkpoint: TAO’s 7-day price change is ↓2.3% - if that trend continues, the short-term bounce may not hold.
If the 30-day position growth keeps rising, the market could still be building something.
But if the price drops further, the gap between the two could widen - and that’s a risk.
—
📊 12 directional calls in the last 30d, every one auto-settled against price. Direction only — no buy/sell calls.
Not financial advice. DYOR.
📌 Funding Pulse · #101 · #FundingRate #CryptoSighted $TAO
TAO is trading at $196.60, up 5.5% in the last day, but that move is masking a deeper trend: a 2.3% drop in the past week.
The price is rallying, but not enough to reverse the bearish momentum that’s been building over longer timeframes.
The funding rate is flat - ↑0.0050% - suggesting no clear bias from leveraged traders.
That’s not a sign of a squeeze, nor of a stampede.
It’s a signal of balance, of indecision. The market isn’t leaning one way or the other, and that’s telling.
Checkpoint: TAO’s 7-day price change is ↓2.3% - if that trend continues, the short-term bounce may not hold.
If the 30-day position growth keeps rising, the market could still be building something.
But if the price drops further, the gap between the two could widen - and that’s a risk.
—
📊 12 directional calls in the last 30d, every one auto-settled against price. Direction only — no buy/sell calls.
Not financial advice. DYOR.
📌 Funding Pulse · #101 · #FundingRate #CryptoSighted $TAO
1
392
10 new perpetual contracts launched in 7 days.
Binance has added 10 bStocks tokenized securities as collateral and expanded its TradFi perpetual offerings rapidly, yet funding rates remain unusually steady - a puzzle in a market that’s usually quick to react.
The expansion of USDⓈ-Margined TradFi perpetuals and bStocks trading pairs suggests a push to bring institutional-grade assets closer to crypto traders.
But the calm in funding rates raises a question: is this just another layer of infrastructure, or is capital actually moving in a new direction?
What does the silence in funding rates say about the real impact of these new instruments?
—
Not financial advice. DYOR.
📌 Announcements · #101 · #CryptoNews #CryptoSighted
10 new perpetual contracts launched in 7 days.
Binance has added 10 bStocks tokenized securities as collateral and expanded its TradFi perpetual offerings rapidly, yet funding rates remain unusually steady - a puzzle in a market that’s usually quick to react.
The expansion of USDⓈ-Margined TradFi perpetuals and bStocks trading pairs suggests a push to bring institutional-grade assets closer to crypto traders.
But the calm in funding rates raises a question: is this just another layer of infrastructure, or is capital actually moving in a new direction?
What does the silence in funding rates say about the real impact of these new instruments?
—
Not financial advice. DYOR.
📌 Announcements · #101 · #CryptoNews #CryptoSighted
Binance has added 10 bStocks tokenized securities as collateral and expanded its TradFi perpetual offerings rapidly, yet funding rates remain unusually steady - a puzzle in a market that’s usually quick to react.
The expansion of USDⓈ-Margined TradFi perpetuals and bStocks trading pairs suggests a push to bring institutional-grade assets closer to crypto traders.
But the calm in funding rates raises a question: is this just another layer of infrastructure, or is capital actually moving in a new direction?
What does the silence in funding rates say about the real impact of these new instruments?
—
Not financial advice. DYOR.
📌 Announcements · #101 · #CryptoNews #CryptoSighted
40

·
--
We're excited to share the latest trending tokens with our community 🚀. Our source, CoinGecko, has provided us with a list of popular tokens.
We're seeing significant interest in tokens like Bonk (BONK), NEAR Protocol (NEAR), and Ondo (ONDO), with market cap ranks of #101, #33, and #46 respectively.
We're wrapping up with a conclusion that these tokens, including Pudgy Penguins (PENGU) and Venice Token (VVV), are worth keeping an eye on, and we're looking forward to seeing their future performance 💡, with some even experiencing % changes, and overall growth 📈, as we move forward 👍.
$POND, $PHA, $PLAY
We're excited to share the latest trending tokens with our community 🚀. Our source, CoinGecko, has provided us with a list of popular tokens.
We're seeing significant interest in tokens like Bonk (BONK), NEAR Protocol (NEAR), and Ondo (ONDO), with market cap ranks of #101, #33, and #46 respectively.
We're wrapping up with a conclusion that these tokens, including Pudgy Penguins (PENGU) and Venice Token (VVV), are worth keeping an eye on, and we're looking forward to seeing their future performance 💡, with some even experiencing % changes, and overall growth 📈, as we move forward 👍.
$POND, $PHA , $PLAY
We're seeing significant interest in tokens like Bonk (BONK), NEAR Protocol (NEAR), and Ondo (ONDO), with market cap ranks of #101, #33, and #46 respectively.
We're wrapping up with a conclusion that these tokens, including Pudgy Penguins (PENGU) and Venice Token (VVV), are worth keeping an eye on, and we're looking forward to seeing their future performance 💡, with some even experiencing % changes, and overall growth 📈, as we move forward 👍.
$POND, $PHA , $PLAY
272
·
--
We're excited to share the latest trending tokens with our community, sourced from CoinGecko. Our list features a mix of established and newer tokens, showcasing the diversity of the crypto market. We're seeing a lot of interest in tokens like Biconomy (BICO) and Cash Cat (CASHCAT), which are gaining traction.
We're highlighting the top trending tokens, including Bitway (BTW) with a market cap rank of #101, Pudgy Penguins (PENGU) at #109, and Pi Network (PI) at #65. Other notable tokens on the list are Stellar (XLM) at #20 and Kaspa (KAS) at #79. These tokens are making waves in the crypto space, with some experiencing significant % changes in their market value 🚀.
We're committed to keeping our community informed about the latest developments in the crypto market. As we continue to monitor the trends, we're seeing a lot of potential for growth and innovation 📈. We're excited to see how these tokens will perform in the future, and we're looking forward to sharing more updates with our community 💡👍.
$BICO, $TUT, $BICO
We're excited to share the latest trending tokens with our community, sourced from CoinGecko. Our list features a mix of established and newer tokens, showcasing the diversity of the crypto market. We're seeing a lot of interest in tokens like Biconomy (BICO) and Cash Cat (CASHCAT), which are gaining traction.
We're highlighting the top trending tokens, including Bitway (BTW) with a market cap rank of #101, Pudgy Penguins (PENGU) at #109, and Pi Network (PI) at #65. Other notable tokens on the list are Stellar (XLM) at #20 and Kaspa (KAS) at #79. These tokens are making waves in the crypto space, with some experiencing significant % changes in their market value 🚀.
We're committed to keeping our community informed about the latest developments in the crypto market. As we continue to monitor the trends, we're seeing a lot of potential for growth and innovation 📈. We're excited to see how these tokens will perform in the future, and we're looking forward to sharing more updates with our community 💡👍.
$BICO , $TUT , $BICO
We're highlighting the top trending tokens, including Bitway (BTW) with a market cap rank of #101, Pudgy Penguins (PENGU) at #109, and Pi Network (PI) at #65. Other notable tokens on the list are Stellar (XLM) at #20 and Kaspa (KAS) at #79. These tokens are making waves in the crypto space, with some experiencing significant % changes in their market value 🚀.
We're committed to keeping our community informed about the latest developments in the crypto market. As we continue to monitor the trends, we're seeing a lot of potential for growth and innovation 📈. We're excited to see how these tokens will perform in the future, and we're looking forward to sharing more updates with our community 💡👍.
$BICO , $TUT , $BICO
Log in to explore more content
Join global crypto users on Binance Square
⚡️ Get latest and useful information about crypto.
💬 Trusted by the world’s largest crypto exchange.
👍 Discover real insights from verified creators.
Email / Phone number
Trending Topics
1
#MetaMaskExitsLidoValidatorsAfterSecurityIncident
22,904 views
518 Discussing
2
#MicronBeatsEarningsLiftsGuidance
17,813 views
445 Discussing
3
#CFTCSubmitsTwoEventContractRulesToWhiteHouse
15,014 views
401 Discussing
4
#BitcoinClears$85200
29,803 views
322 Discussing
5
#AltcoinSeasonIndexHoldsAbove60For5Days
147,858 views
1,920 Discussing
6
#USADPAdds90000JobsInSeptember
69,693 views
1,086 Discussing
7
#USCorePCEEasesTo3%InAugust
46,562 views
729 Discussing
8
#KospiPostsWorstQuarterSince2020
26,016 views
603 Discussing
9
#SECToClarifyOnChainFundraisingRules
65,067 views
808 Discussing
10
#UKFCAOpensCryptoFirmAuthorization
60,923 views
673 Discussing