

#$1.5binleveragedcryptobetsliquidated
$1.5binleveragedcryptobetsliquidated
Hot
Latest

Article
$1.53–1.57B Leveraged Liquidations#$1.5BInLeveragedCryptoBetsLiquidated
👉 $1.53–1.57B Leveraged Liquidations (≈83–87% Longs) Following Binance Hot-Wallet Incident
24h liquidations: $1.53–1.57B (figures vary slightly by refresh window). Longs ≈ $1.29–1.34B (83.8–86.8%), shorts ≈ $200–250M.Concentration: BTC ≈ $499–530M, ETH ≈ $358–364M → together >55% of total. SOL ≈ $83M, XRP ≈ $38–39M, DOGE ≈ $19M.Venue: Binance alone ≈ $755M (≈49%). Largest single print: ≈ $11.09M BTC long on Binance.Timing: ≈ $1.33–1.37B (nearly 90%) occurred in the final 12h window after the security announcement.Price action: BTC briefly printed ≈ $76,400–76,460 (six-week low), then recovered toward $77.5–78.5k, flipping the liquidation flow toward shorts ($57M+ in a 4h window, peaking at 95% shorts in one hour).
Trigger Mechanics
Binance reported a security incident affecting ≈ $6.3–6.36B across ten chains (bulk moved in ≈20 minutes from 20:05 UTC 29 Oct). TRM Labs attributes the attack with high confidence to North Korea-linked TraderTraitor (on-chain + off-chain indicators, method consistent with prior Bybit exploit). ≈ $2.7–3B frozen (mainly stablecoins by Tether, Circle and others).
👉 Binance states: compromised DevOps laptop → unauthorized withdrawals; no private-key leakage found; all user losses to be covered from SAFU + company funds; withdrawals temporarily suspended.
This is a confidence shock + forced deleveraging, not a pure directional regime change.
💻 Technical Cascade Dynamics
Elevated long open interest + positive funding into the event.Confidence drop → spot selling + voluntary deleveraging.Price breach of clustered long liquidation levels → exchange auto-sells collateral → additional downside pressure (classic long-squeeze amplification).Rebound from oversold conditions + short covering → short-squeeze feedback loop (exchange buys to close shorts).
Critical distinction: Liquidation notional ≠ cash loss. A $100k notional position on $10k margin records the full $100k when liquidated; actual capital destroyed is limited to the posted margin (plus fees). Aggregate $1.5B+ is therefore a measure of leverage flushed, not net capital exited from the ecosystem.
🚂 Market-Structure Implications
Open interest declined modestly while volume spiked → net position reduction rather than aggressive new short building.Funding remains positive on BTC (still tilted long, though less aggressively).Exchange netflows and spot CVD will determine whether the rebound is pure covering or genuine demand.Altcoins with thinner books experienced amplified moves and higher long liquidation ratios, as expected in a correlated risk-off cascade.
Forward Indicators to Watch (next 24–72h)
👉 Indicator -> Bullish confirmation -> Bearish risk
👉 Open Interest
-> Rebuilds with rising price + spot buy
-> Rebuilds into further price decline
👉 Funding rates
-> Normalize near zero
-> Stay elevated positive or flip hard negative
👉 Spot CVD
-> Persistent positive
-> Persistent negative
👉 Exchange netflows
-> Sustained outflows
-> Large inflows (selling pressure)
👉 Liquidation heatmap -> Short clusters above price consumed
-> New long clusters below price form
Bottom Line
This was a high-leverage long flush triggered by a major exchange-security event. It reset excessive positioning and temporarily amplified volatility via forced selling, followed by a short-covering bounce. It does not by itself confirm a structural bear-market regime. Sustainability of any recovery hinges on:
(1) transparent resolution and restoration of normal operations at Binance,
(2) return of genuine spot demand, and
(3) whether leverage rebuilds symmetrically or remains skewed.
$BTC $TSLA $MSFT
{spot}(BTCUSDT)
{future}(MSFTUSDT)
{future}(TSLAUSDT)
#KOSPIFalls3.53%BackBelow6000 #AmazonSharesFallAbout7%InPremarketTrading #USMidtermElections #StrategySTRCReaches$99.95ForFirstTimeIn165Days
$1.53–1.57B Leveraged Liquidations
#$1.5BInLeveragedCryptoBetsLiquidated
👉 $1.53–1.57B Leveraged Liquidations (≈83–87% Longs) Following Binance Hot-Wallet Incident
24h liquidations: $1.53–1.57B (figures vary slightly by refresh window). Longs ≈ $1.29–1.34B (83.8–86.8%), shorts ≈ $200–250M.Concentration: BTC ≈ $499–530M, ETH ≈ $358–364M → together >55% of total. SOL ≈ $83M, XRP ≈ $38–39M, DOGE ≈ $19M.Venue: Binance alone ≈ $755M (≈49%). Largest single print: ≈ $11.09M BTC long on Binance.Timing: ≈ $1.33–1.37B (nearly 90%) occurred in the final 12h window after the security announcement.Price action: BTC briefly printed ≈ $76,400–76,460 (six-week low), then recovered toward $77.5–78.5k, flipping the liquidation flow toward shorts ($57M+ in a 4h window, peaking at 95% shorts in one hour).
Trigger Mechanics
Binance reported a security incident affecting ≈ $6.3–6.36B across ten chains (bulk moved in ≈20 minutes from 20:05 UTC 29 Oct). TRM Labs attributes the attack with high confidence to North Korea-linked TraderTraitor (on-chain + off-chain indicators, method consistent with prior Bybit exploit). ≈ $2.7–3B frozen (mainly stablecoins by Tether, Circle and others).
👉 Binance states: compromised DevOps laptop → unauthorized withdrawals; no private-key leakage found; all user losses to be covered from SAFU + company funds; withdrawals temporarily suspended.
This is a confidence shock + forced deleveraging, not a pure directional regime change.
💻 Technical Cascade Dynamics
Elevated long open interest + positive funding into the event.Confidence drop → spot selling + voluntary deleveraging.Price breach of clustered long liquidation levels → exchange auto-sells collateral → additional downside pressure (classic long-squeeze amplification).Rebound from oversold conditions + short covering → short-squeeze feedback loop (exchange buys to close shorts).
Critical distinction: Liquidation notional ≠ cash loss. A $100k notional position on $10k margin records the full $100k when liquidated; actual capital destroyed is limited to the posted margin (plus fees). Aggregate $1.5B+ is therefore a measure of leverage flushed, not net capital exited from the ecosystem.
🚂 Market-Structure Implications
Open interest declined modestly while volume spiked → net position reduction rather than aggressive new short building.Funding remains positive on BTC (still tilted long, though less aggressively).Exchange netflows and spot CVD will determine whether the rebound is pure covering or genuine demand.Altcoins with thinner books experienced amplified moves and higher long liquidation ratios, as expected in a correlated risk-off cascade.
Forward Indicators to Watch (next 24–72h)
👉 Indicator -> Bullish confirmation -> Bearish risk
👉 Open Interest
-> Rebuilds with rising price + spot buy
-> Rebuilds into further price decline
👉 Funding rates
-> Normalize near zero
-> Stay elevated positive or flip hard negative
👉 Spot CVD
-> Persistent positive
-> Persistent negative
👉 Exchange netflows
-> Sustained outflows
-> Large inflows (selling pressure)
👉 Liquidation heatmap -> Short clusters above price consumed
-> New long clusters below price form
Bottom Line
This was a high-leverage long flush triggered by a major exchange-security event. It reset excessive positioning and temporarily amplified volatility via forced selling, followed by a short-covering bounce. It does not by itself confirm a structural bear-market regime. Sustainability of any recovery hinges on:
(1) transparent resolution and restoration of normal operations at Binance,
(2) return of genuine spot demand, and
(3) whether leverage rebuilds symmetrically or remains skewed.
$BTC $TSLA $MSFT
#KOSPIFalls3.53%BackBelow6000 #AmazonSharesFallAbout7%InPremarketTrading #USMidtermElections #StrategySTRCReaches$99.95ForFirstTimeIn165Days
Ghoststroke:
Solid distinction on notional versus margin, but notice the reload rate: open interest barely budged because dip buyers immediately re-leveraged the flush. Funding stayed positive with positioning skewed two-to-one on the long side. Spot cumulative volume delta never confirmed; that bounce was mechanical short covering rather than real demand. Until passive supply clears, the tape is just coiling to revisit 76,400.
1
2
335

·
--
#$1.5BInLeveragedCryptoBetsLiquidated
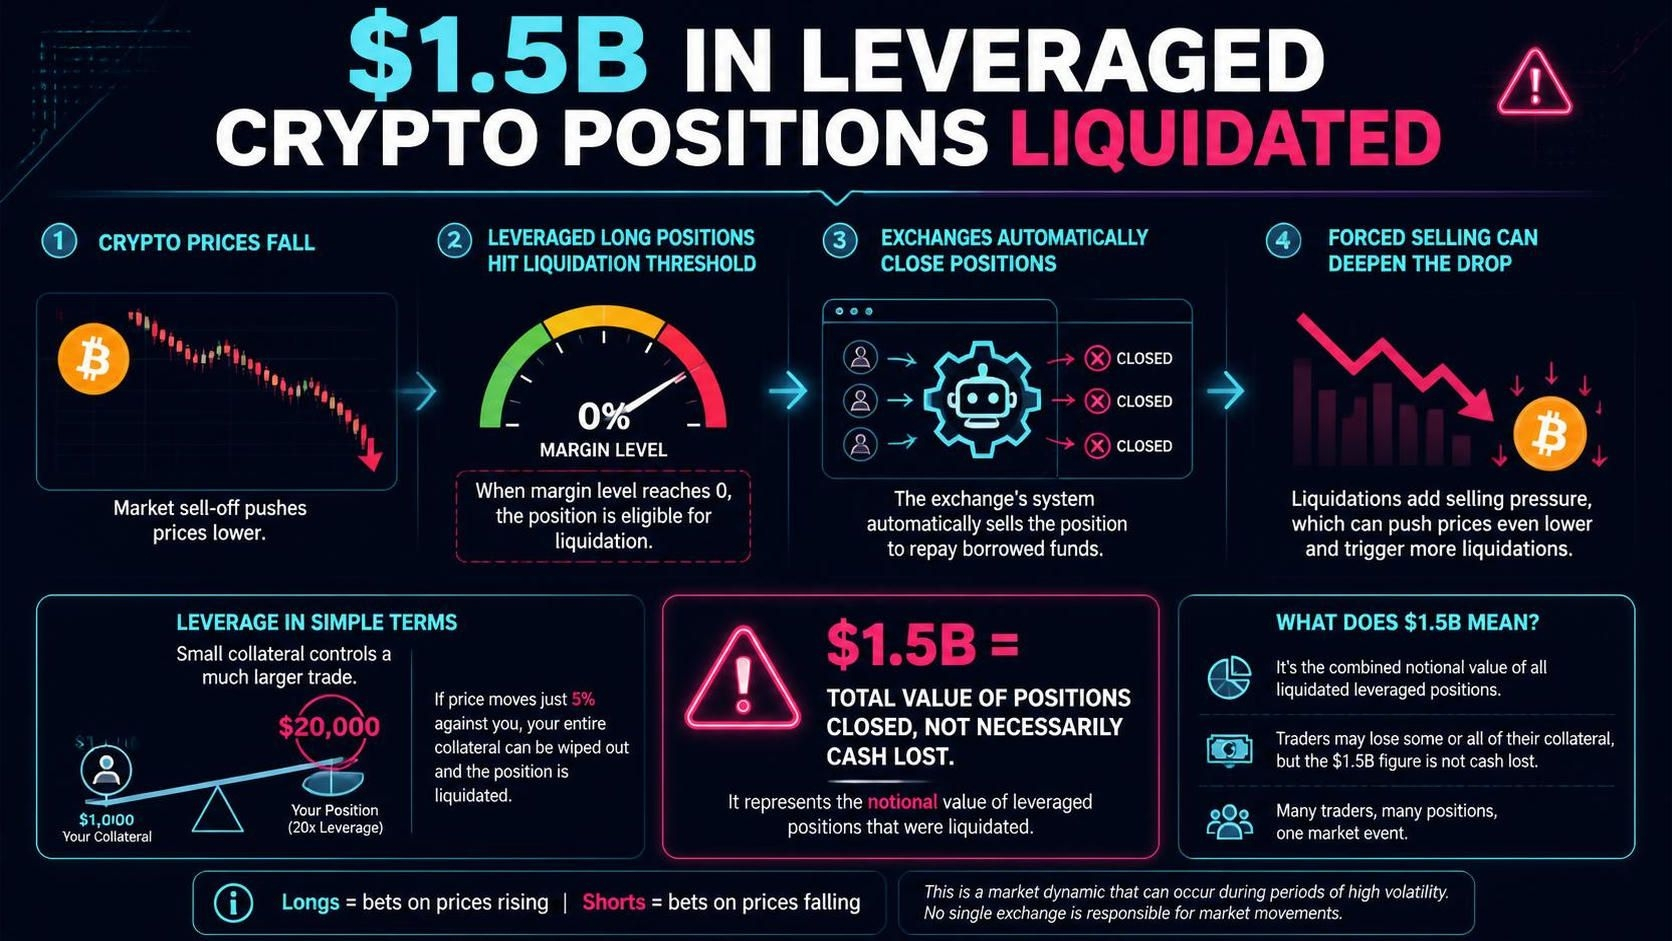
📉 When crypto prices fell, positions of those betting on a rise with leverage were automatically closed. A total of $1.53 billion in trades was liquidated in 24 hours; about 83.8% of these were “long” positions betting that prices would rise. This figure measures the total value of closed positions, not the cash taken out of investors’ pockets. 💸
⚙️ Leverage is like opening a larger trade with a small amount of money. When the price moves far enough in the opposite direction, the collateral is no longer sufficient and the exchange forcibly closes the position. These sales can accelerate the decline further. The report links the wave of selling to the aftermath of a security breach at Binance
🔄 When prices recovered, some “short” positions betting on a decline were liquidated in turn; buying to close them can fuel the rise.$LSK $IDOL $Q
{alpha}(560xc07e1300dc138601fa6b0b59f8d0fa477e690589)
{alpha}(560x3b4de3c7855c03bb9f50ea252cd2c9fa1125ab07)
{future}(LSKUSDT)
#$1.5BInLeveragedCryptoBetsLiquidated
📉 When crypto prices fell, positions of those betting on a rise with leverage were automatically closed. A total of $1.53 billion in trades was liquidated in 24 hours; about 83.8% of these were “long” positions betting that prices would rise. This figure measures the total value of closed positions, not the cash taken out of investors’ pockets. 💸
⚙️ Leverage is like opening a larger trade with a small amount of money. When the price moves far enough in the opposite direction, the collateral is no longer sufficient and the exchange forcibly closes the position. These sales can accelerate the decline further. The report links the wave of selling to the aftermath of a security breach at Binance
🔄 When prices recovered, some “short” positions betting on a decline were liquidated in turn; buying to close them can fuel the rise.$LSK $IDOL $Q
FEDAT - sport digital assets marketplace:
Каскад ликвидаций — это самый мощный двигатель волатильности. Когда маржин-коллы срабатывают как домино, любой теханализ временно перестает работать. Хорошо, что и шорты получили свою порцию "возмездия" на отскоке. Рынок всегда забирает деньги у тех, кто слишком уверен в своем плече 20x🧠💎🤝👍😀
2
2
1.4k


·
--
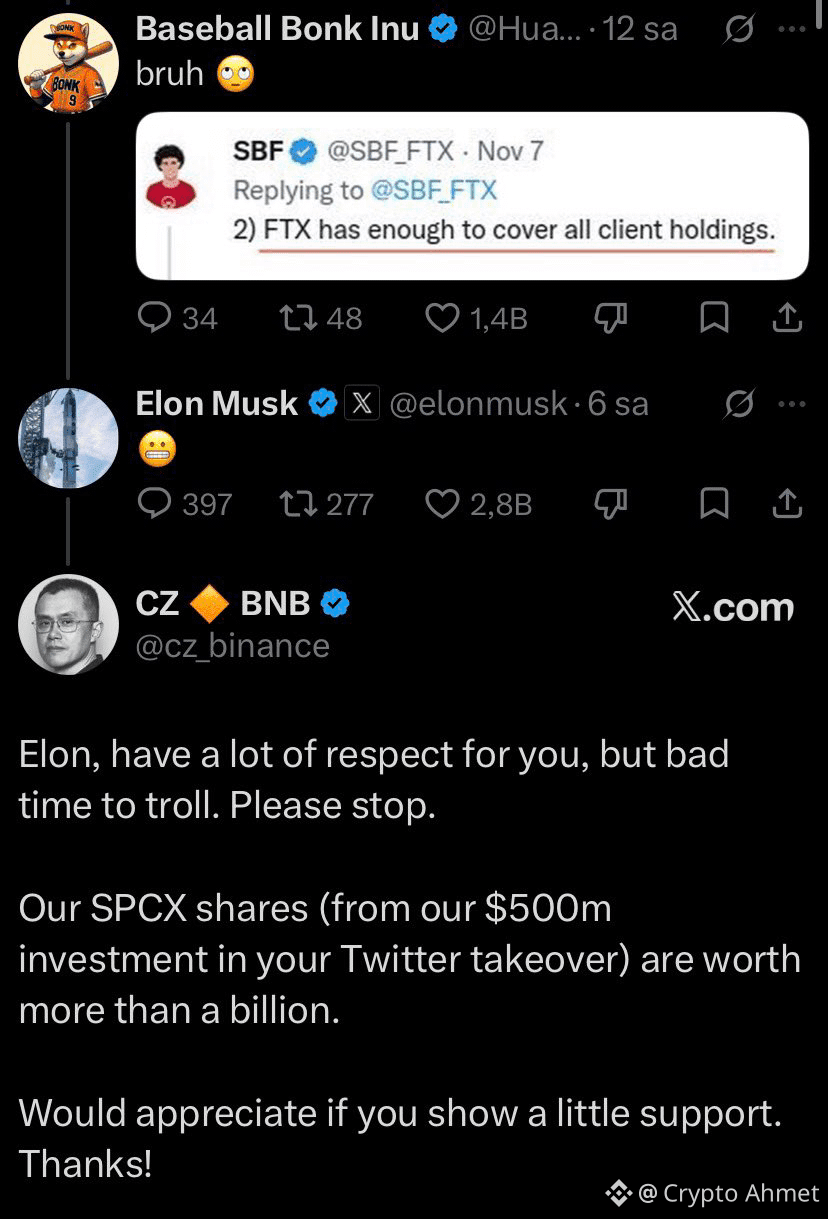
🚨 CZ SENDS A STRONG MESSAGE TO ELON MUSK!
#Binance founder Changpeng Zhao (CZ) has responded to Elon Musk’s post mocking him:
“Elon, I have great respect for you, but this is not the time for trolling. Please stop.
We invested $500 million to help you acquire Twitter, and that investment is now worth over $1 billion.
I would have expected a little support. Thank you!”
$DOGE $BNB $TRUMP
#CZ #USMidtermElections #$1.5BInLeveragedCryptoBetsLiquidated #StrategySTRCReaches$99.95ForFirstTimeIn165Days
M Younas Crypto:
You are doing great! Let's be friends.
7
26
19.5k

·
--
Article
The Breakout Trading Strategy I Use to Catch Big MovesI’ve longed resistance and shorted support for 9 years… This is the exact opposite of what every trader tries to do.
In this article, I will share my entire strategy so you can skip years of testing and losses.
This is something you will want to bookmark, take notes on, and set time aside to think about.
Lesson 1: The Only 2 Trading Strategies
Before you can identify good momentum setups, you need to understand what momentum trading actually is.
Momentum and mean reversion are opposite strategies based on opposite assumptions.
The Two Trading Styles
Momentum (where you take a trade betting on a continuation of the current trend)Mean Reversion (where you take a trade betting on a reversal of the current trend)
One assumes strength continues; the other assumes strength exhausts.
Let’s consider this through a visual example.
Suppose price is approaching a resistance level (in other words, a level where there was previously selling pressure, preventing the price from moving higher).
Momentum assumes the level will break.
You’re betting on continuation.Price approaches resistance, you buy, expecting it to push through and keep running.The level becomes support once broken.
Mean reversion assumes the level will hold.
You’re betting on rejection.Price approaches resistance, you short, expecting it to bounce back down.The level acts as a ceiling.
Same chart. Same resistance level. Opposite strategies.
There is no right or wrong. The key is to understand when you are in a momentum trade environment, such that momentum strategies are highly aligned.
The next section shows you exactly how to identify when the environment favours momentum (my best strategy).
Lesson 1 Summary
There are 2 trading styles: momentum and mean reversionMean reversion bets levels will hold; momentum bets levels will breakOne is not better than the other; it depends entirely on the trade environment
Lesson 2: Optimal Trade Environment
Just opening a long every time price hits resistance won't make us any money.
Without the right conditions, momentum dies immediately after the breakout.
You enter. It reverses. You're stopped out.
That's not bad luck, that's a bad trading environment.
The Rowing Analogy
Imagine you’re rowing a boat.
You either row against or with the current.
One makes it easier to row while the other takes a lot more effort.
Your boat, or rowing technique, didn’t change… Only your environment did.
Trading is the same.
Your strategy is your boat.
Your optimal trade environment is the current.
Now use this 3-filter checklist to ensure you only take trades where a breakout is likely (with the current).
Filter 1: How Did Price Approach the Level?
What you WANT:
A slow, grinding staircase pattern approaching resistance.Each candle makes incremental progress.Higher lows are stacking up.Controlled, deliberate movement.
What you DON’T want:
A fast vertical spike into resistance.Price shoots up in one or two large candles.After a spike, buyers' strength is depleted and price typically consolidates or reverses.This is exhaustion, not momentum.
The staircase pattern shows sustained buying pressure building gradually. When this breaks through resistance, buyers are still engaged and ready to push further.
Common mistake: Traders see a strong candle break resistance and assume momentum is strong. But these fast moves often reverse quickly.
→ Do this instead: Take momentum trades when price approaches resistance in a slow, grinding staircase over multiple candles.
Real Trade Example:
Slow clear grind into resistance showing an optimal ‘price approach to level’ for momentum.
Filter 1: slow grindy staircase ✅
Filter 2: What Did Volume Look Like?
Volume confirms whether the price movement has conviction behind it.
What you WANT:
Gradual increase in volume as price approaches resistanceThis pattern shows controlled, sustainable momentum.
What you DON’T want:
Flat volume (no conviction) or sudden volume spikes (exhaustion).Flat volume means the move lacks participation.Volume spikes often mark climax points where momentum exhausts.Decreasing volume (why would price break out of resistance now, if volume was lower than before?)
Volume should mirror the price pattern, steady and building, not erratic.
This strategy works because momentum continuation is most likely when participation is sustained, supply is absorbed gradually, and structure remains intact.
Real Trade Example:
Around the time the grindy staircase begins to emerge, we see a slow, consistent increase in volume.
Filter 1: slow grindy staircase ✅Filter 2: clearly increasing volume ✅
Lastly,
Filter 3: Moving Average Crossovers
This filter distinguishes trending markets (good for momentum) from choppy, indecisive markets (bad for momentum).
What you WANT to see: Moving averages with minimal crossovers. This indicates a directional trend.
What you DON’T want to see: Frequent crossovers. This signals chop and indecision.
Fewer crossovers = cleaner trend or range = better momentum continuation.
Use the 30SMMA (Smoothed Moving Average).
✍️Quick Actionable Step:
To add the 30SMMA on your charts:
Search for the Smoothed Moving Average Indicator in TradingViewAdd it to your chartGo into settings and change the "Length" to "30"
Real Trade Example:
Filter 1 (Price Action): slow grindy staircase ✅
Filter 2 (Volume): clearly increasing volume ✅
Filter 3 (Crossovers): minimal MA crossovers ✅
🎓Lesson 2 Summary
Slow grinding staircase approaches have better follow-through than fast spikesVolume should be gradual (increasing or decreasing), not flat or spikingFewer MA crossovers indicate cleaner directional conditions for momentum
Lesson 3: Identifying Setups
Now you know what momentum is.
You also know the optimal conditions for it.
Next, you need to know where to execute these trades.
Step 1: Draw Support and Resistance Levels
Momentum trades happen at these key levels. You need to identify them consistently.
I've already written an in-depth masterclass on how to set these levels. I'll link it at the end of this article.
Common mistake: Traders draw levels randomly or inconsistently, leading to missed setups or false signals.
Do this instead: Use my step-by-step approach at the end of this article.
Step 2: Await Your Entry Trigger on the 1-Minute Chart
Once you’ve identified a resistance level on your primary timeframe, switch to the 1-minute chart for precise entry timing.
Why 1-minute chart?
You learn faster.
More trades, more chart exposure and more oppurtunities to practice psychology.
I’ve added a bonus guide on why you should be trading the 1-minute chart at the end of this article.
Real Trade Example:
Step 3: Three Filters
Before entering, check the three filters from Section 2:
Is price approaching resistance in a slow staircase pattern?Is volume gradually increasing or decreasing (not flat or spiking)?Are there minimal MA crossovers (not choppy)?
If any filter fails, reduce your risk on the trade. Only take full risk on A-grade setups, not forcing trades in poor conditions.
🎓Lesson 3 Summary
Draw levels using the ZCT masterclass approach at the end of this articleUse your entry trigger on the 1-minute timeframe: 2 candle closes above for confirmationCheck all three filters before entering, allocate risk and size accordingly
Lesson 4: Strategy Logic: Stop Loss, and Take Profit
You've drawn your levels. You've confirmed the setup aligns with optimal momentum conditions.
Now you need precise execution.
Entry timing, stop placement, and profit targets determine whether you capture the momentum move or get stopped out on a good setup.
This is where most traders lose, not in analysis, but in execution.
Step 4: Entry Trigger
We have established to wait for two consecutive 1-minute candles to close fully above the resistance level. This confirms the level broke and momentum is continuing.
Critical execution detail: After the second candle closes above resistance, place a limit order AT the resistance level (now acting as support), not above it. Price often pulls back slightly after breaking out. Your limit order gets filled on the pullback without chasing.
Common mistake: Traders wait for confirmation, then market-buy above resistance as price runs away. They enter late with a wider stop and worse risk/reward.
→ Do this instead: Preset your limit order AT resistance after the second candle closes. Let price come back to you.
Real Trade Example:
Step 5: Stop Loss
A swing low is:
the lowest wick in a pullback.
Your stop loss goes at the most recent swing low before the breakout.
Common mistake: Traders place stops at the nearest swing low, even if it’s only 0.3% away, leading to frequent stop-outs from normal volatility
Do this instead: Always measure the distance of your stop loss using the ruler tool on TradingView. If it’s less than 1%, use the next swing low down.
Step 6: Take Profit 1R (Equal Distance to Stop)
Your take profit target is 1R, the same distance as your stop loss, but in the profit direction
If your stop loss is 1.982% away from entry, your target is also 1.982% away, but on the upside. This gives you a 1:1 risk/reward ratio.
Why 1R? It’s conservative and achievable. Momentum trades often hit 1R quickly because the breakout has follow-through. You’re not trying to catch the entire move, you’re taking a high-probability piece of it.
Over time, as you get data in your journal, you can start extending your profit targets when you see how far your average winning trades go beyond 1R. This way, you’re not guessing where to take profits, but following a systematic approach.
Real Trade Example:
🎓Lesson 4 summary
Enter after two 1-minute candle closes above resistance, using a limit order at prior resistance (now support) to avoid chasing price.Place stop losses at the most recent valid swing low, ensuring enough distance to avoid normal volatility and minor stop hunts.Set initial profit targets at 1R to capture high-probability momentum continuation in a repeatable, systematic way.
Immediate Next Steps✍️:
Read the Support and Resistance Masterclass to learn how to draw levels (shared at end of article)Look at 3 charts using the 3 filter checklist to identify a momentum trade environmentUse the strategy steps to enter your tradeGather 30 trades using this method, journalled and reviewed against the criteria
🎓 Final Summary
Lesson 1: Momentum vs Mean Reversion
Momentum trades bet that price will continue through a level, while mean reversion trades bet that a level will hold and reject price.Both strategies are valid, but performance depends entirely on matching the strategy to the correct trade environment.
Understanding this distinction prevents applying breakout logic in conditions where it has no edge.
Lesson 2: Optimal Trade Environment
High-quality breakouts form when price approaches resistance in a slow, grinding staircase rather than fast vertical spikes.Volume should build gradually to confirm sustained participation, not remain flat or spike from exhaustion.Minimal moving average crossovers indicate cleaner directional conditions where momentum continuation is more likely.
Lesson 3: Identifying Setups
Momentum trades should be executed at consistently drawn support and resistance levels.Entries are triggered on the 1-minute chart using two consecutive candle closes above resistance for confirmation.All three environment filters must align before taking full risk; weaker conditions require reduced sizing or passing the trade.
Lesson 4: Stop Loss and Take Profit
Enter using a limit order at prior resistance (now support) after two confirmed 1-minute candle closes to avoid chasing price.Stop losses should be placed at the most recent valid swing low with enough distance to avoid normal volatility and minor stop hunts.Initial profit targets are set at 1R to capture high-probability momentum continuation in a repeatable way.
🎓What Changes From Here
The next time price approaches resistance, you won’t have to guess if it will break out.
You’ll know when a breakout has real momentum, when volume confirms it, and when conditions support follow-through.
You’ll also execute with defined entries, stops, and targets.
#CryptoZeno #$1.5BInLeveragedCryptoBetsLiquidated
The Breakout Trading Strategy I Use to Catch Big Moves
I’ve longed resistance and shorted support for 9 years… This is the exact opposite of what every trader tries to do.
In this article, I will share my entire strategy so you can skip years of testing and losses.
This is something you will want to bookmark, take notes on, and set time aside to think about.
Lesson 1: The Only 2 Trading Strategies
Before you can identify good momentum setups, you need to understand what momentum trading actually is.
Momentum and mean reversion are opposite strategies based on opposite assumptions.
The Two Trading Styles
Momentum (where you take a trade betting on a continuation of the current trend)Mean Reversion (where you take a trade betting on a reversal of the current trend)
One assumes strength continues; the other assumes strength exhausts.
Let’s consider this through a visual example.
Suppose price is approaching a resistance level (in other words, a level where there was previously selling pressure, preventing the price from moving higher).
Momentum assumes the level will break.
You’re betting on continuation.Price approaches resistance, you buy, expecting it to push through and keep running.The level becomes support once broken.
Mean reversion assumes the level will hold.
You’re betting on rejection.Price approaches resistance, you short, expecting it to bounce back down.The level acts as a ceiling.
Same chart. Same resistance level. Opposite strategies.
There is no right or wrong. The key is to understand when you are in a momentum trade environment, such that momentum strategies are highly aligned.
The next section shows you exactly how to identify when the environment favours momentum (my best strategy).
Lesson 1 Summary
There are 2 trading styles: momentum and mean reversionMean reversion bets levels will hold; momentum bets levels will breakOne is not better than the other; it depends entirely on the trade environment
Lesson 2: Optimal Trade Environment
Just opening a long every time price hits resistance won't make us any money.
Without the right conditions, momentum dies immediately after the breakout.
You enter. It reverses. You're stopped out.
That's not bad luck, that's a bad trading environment.
The Rowing Analogy
Imagine you’re rowing a boat.
You either row against or with the current.
One makes it easier to row while the other takes a lot more effort.
Your boat, or rowing technique, didn’t change… Only your environment did.
Trading is the same.
Your strategy is your boat.
Your optimal trade environment is the current.
Now use this 3-filter checklist to ensure you only take trades where a breakout is likely (with the current).
Filter 1: How Did Price Approach the Level?
What you WANT:
A slow, grinding staircase pattern approaching resistance.Each candle makes incremental progress.Higher lows are stacking up.Controlled, deliberate movement.
What you DON’T want:
A fast vertical spike into resistance.Price shoots up in one or two large candles.After a spike, buyers' strength is depleted and price typically consolidates or reverses.This is exhaustion, not momentum.
The staircase pattern shows sustained buying pressure building gradually. When this breaks through resistance, buyers are still engaged and ready to push further.
Common mistake: Traders see a strong candle break resistance and assume momentum is strong. But these fast moves often reverse quickly.
→ Do this instead: Take momentum trades when price approaches resistance in a slow, grinding staircase over multiple candles.
Real Trade Example:
Slow clear grind into resistance showing an optimal ‘price approach to level’ for momentum.
Filter 1: slow grindy staircase ✅
Filter 2: What Did Volume Look Like?
Volume confirms whether the price movement has conviction behind it.
What you WANT:
Gradual increase in volume as price approaches resistanceThis pattern shows controlled, sustainable momentum.
What you DON’T want:
Flat volume (no conviction) or sudden volume spikes (exhaustion).Flat volume means the move lacks participation.Volume spikes often mark climax points where momentum exhausts.Decreasing volume (why would price break out of resistance now, if volume was lower than before?)
Volume should mirror the price pattern, steady and building, not erratic.
This strategy works because momentum continuation is most likely when participation is sustained, supply is absorbed gradually, and structure remains intact.
Real Trade Example:
Around the time the grindy staircase begins to emerge, we see a slow, consistent increase in volume.
Filter 1: slow grindy staircase ✅Filter 2: clearly increasing volume ✅
Lastly,
Filter 3: Moving Average Crossovers
This filter distinguishes trending markets (good for momentum) from choppy, indecisive markets (bad for momentum).
What you WANT to see: Moving averages with minimal crossovers. This indicates a directional trend.
What you DON’T want to see: Frequent crossovers. This signals chop and indecision.
Fewer crossovers = cleaner trend or range = better momentum continuation.
Use the 30SMMA (Smoothed Moving Average).
✍️Quick Actionable Step:
To add the 30SMMA on your charts:
Search for the Smoothed Moving Average Indicator in TradingViewAdd it to your chartGo into settings and change the "Length" to "30"
Real Trade Example:
Filter 1 (Price Action): slow grindy staircase ✅
Filter 2 (Volume): clearly increasing volume ✅
Filter 3 (Crossovers): minimal MA crossovers ✅
🎓Lesson 2 Summary
Slow grinding staircase approaches have better follow-through than fast spikesVolume should be gradual (increasing or decreasing), not flat or spikingFewer MA crossovers indicate cleaner directional conditions for momentum
Lesson 3: Identifying Setups
Now you know what momentum is.
You also know the optimal conditions for it.
Next, you need to know where to execute these trades.
Step 1: Draw Support and Resistance Levels
Momentum trades happen at these key levels. You need to identify them consistently.
I've already written an in-depth masterclass on how to set these levels. I'll link it at the end of this article.
Common mistake: Traders draw levels randomly or inconsistently, leading to missed setups or false signals.
Do this instead: Use my step-by-step approach at the end of this article.
Step 2: Await Your Entry Trigger on the 1-Minute Chart
Once you’ve identified a resistance level on your primary timeframe, switch to the 1-minute chart for precise entry timing.
Why 1-minute chart?
You learn faster.
More trades, more chart exposure and more oppurtunities to practice psychology.
I’ve added a bonus guide on why you should be trading the 1-minute chart at the end of this article.
Real Trade Example:
Step 3: Three Filters
Before entering, check the three filters from Section 2:
Is price approaching resistance in a slow staircase pattern?Is volume gradually increasing or decreasing (not flat or spiking)?Are there minimal MA crossovers (not choppy)?
If any filter fails, reduce your risk on the trade. Only take full risk on A-grade setups, not forcing trades in poor conditions.
🎓Lesson 3 Summary
Draw levels using the ZCT masterclass approach at the end of this articleUse your entry trigger on the 1-minute timeframe: 2 candle closes above for confirmationCheck all three filters before entering, allocate risk and size accordingly
Lesson 4: Strategy Logic: Stop Loss, and Take Profit
You've drawn your levels. You've confirmed the setup aligns with optimal momentum conditions.
Now you need precise execution.
Entry timing, stop placement, and profit targets determine whether you capture the momentum move or get stopped out on a good setup.
This is where most traders lose, not in analysis, but in execution.
Step 4: Entry Trigger
We have established to wait for two consecutive 1-minute candles to close fully above the resistance level. This confirms the level broke and momentum is continuing.
Critical execution detail: After the second candle closes above resistance, place a limit order AT the resistance level (now acting as support), not above it. Price often pulls back slightly after breaking out. Your limit order gets filled on the pullback without chasing.
Common mistake: Traders wait for confirmation, then market-buy above resistance as price runs away. They enter late with a wider stop and worse risk/reward.
→ Do this instead: Preset your limit order AT resistance after the second candle closes. Let price come back to you.
Real Trade Example:
Step 5: Stop Loss
A swing low is:
the lowest wick in a pullback.
Your stop loss goes at the most recent swing low before the breakout.
Common mistake: Traders place stops at the nearest swing low, even if it’s only 0.3% away, leading to frequent stop-outs from normal volatility
Do this instead: Always measure the distance of your stop loss using the ruler tool on TradingView. If it’s less than 1%, use the next swing low down.
Step 6: Take Profit 1R (Equal Distance to Stop)
Your take profit target is 1R, the same distance as your stop loss, but in the profit direction
If your stop loss is 1.982% away from entry, your target is also 1.982% away, but on the upside. This gives you a 1:1 risk/reward ratio.
Why 1R? It’s conservative and achievable. Momentum trades often hit 1R quickly because the breakout has follow-through. You’re not trying to catch the entire move, you’re taking a high-probability piece of it.
Over time, as you get data in your journal, you can start extending your profit targets when you see how far your average winning trades go beyond 1R. This way, you’re not guessing where to take profits, but following a systematic approach.
Real Trade Example:
🎓Lesson 4 summary
Enter after two 1-minute candle closes above resistance, using a limit order at prior resistance (now support) to avoid chasing price.Place stop losses at the most recent valid swing low, ensuring enough distance to avoid normal volatility and minor stop hunts.Set initial profit targets at 1R to capture high-probability momentum continuation in a repeatable, systematic way.
Immediate Next Steps✍️:
Read the Support and Resistance Masterclass to learn how to draw levels (shared at end of article)Look at 3 charts using the 3 filter checklist to identify a momentum trade environmentUse the strategy steps to enter your tradeGather 30 trades using this method, journalled and reviewed against the criteria
🎓 Final Summary
Lesson 1: Momentum vs Mean Reversion
Momentum trades bet that price will continue through a level, while mean reversion trades bet that a level will hold and reject price.Both strategies are valid, but performance depends entirely on matching the strategy to the correct trade environment.
Understanding this distinction prevents applying breakout logic in conditions where it has no edge.
Lesson 2: Optimal Trade Environment
High-quality breakouts form when price approaches resistance in a slow, grinding staircase rather than fast vertical spikes.Volume should build gradually to confirm sustained participation, not remain flat or spike from exhaustion.Minimal moving average crossovers indicate cleaner directional conditions where momentum continuation is more likely.
Lesson 3: Identifying Setups
Momentum trades should be executed at consistently drawn support and resistance levels.Entries are triggered on the 1-minute chart using two consecutive candle closes above resistance for confirmation.All three environment filters must align before taking full risk; weaker conditions require reduced sizing or passing the trade.
Lesson 4: Stop Loss and Take Profit
Enter using a limit order at prior resistance (now support) after two confirmed 1-minute candle closes to avoid chasing price.Stop losses should be placed at the most recent valid swing low with enough distance to avoid normal volatility and minor stop hunts.Initial profit targets are set at 1R to capture high-probability momentum continuation in a repeatable way.
🎓What Changes From Here
The next time price approaches resistance, you won’t have to guess if it will break out.
You’ll know when a breakout has real momentum, when volume confirms it, and when conditions support follow-through.
You’ll also execute with defined entries, stops, and targets.
#CryptoZeno #$1.5BInLeveragedCryptoBetsLiquidated
4
2k
·
--
@CZ warned users not to click links in emails or download attachments, even from people they trust, as they could contain viruses. #ElonMusk reacted to CZ’s post with fire and laughing emojis.
$DOGE $BNB $BTC
#$1.5BInLeveragedCryptoBetsLiquidated #USMidtermElections #BinanceWillListPredictPREDICT #CZ
$DOGE $BNB $BTC
#$1.5BInLeveragedCryptoBetsLiquidated #USMidtermElections #BinanceWillListPredictPREDICT #CZ

Amin505:
do you think binance can cover and stand again?
9
10
6.7k

·
--

Article
The Biggest Crypto Hack Ever Just Happened. Here’s What History Says Happens Next.The Biggest Crypto Hack in History Just Happened: Here Is What the Data Says Happens Next
Friday, October 30, 2026
My analysis is normally reserved strictly for private subscribers. Today, I am opening this piece to the public because the events of the past 24 hours carry direct implications for anyone holding capital on a centralized exchange.
On Thursday evening, Binance suffered a catastrophic security breach.
Current internal estimates from Binance put the total theft at approximately $6.3 billion. If that figure is finalized, it will officially mark the largest exploit in cryptocurrency history—dwarfing the previous record of roughly $1.5 billion set during the Bybit breach in February 2025.
Before emotion dictates your next move, let’s unpack the verified facts, the underlying technical failure, and what historical precedent tells us about Bitcoin's medium-term trajectory.
The Anatomy of the Breach: Key Facts
Rapid Asset Freezes: Centralized stablecoin issuers (including Tether and Circle) coordinated immediately with Binance to blacklist exploiter addresses, successfully freezing roughly $3 billion of the stolen capital before it could be routed through privacy protocols or decentralized liquidity pools. Attack Vector: Contrary to initial panic regarding compromised multi-sig master keys or cold storage failures, Binance confirmed the initial entry point was a compromised developer laptop. This allowed the attackers to exploit internal deployment pipelines rather than cracking core cryptographic wallets directly. Solvency & Restitution: Binance leadership publicly committed to making all affected users whole via company reserves and internal insurance funds. Operational Pause: Both deposits and withdrawals are temporarily halted across the platform. Engineering teams are auditing access controls, with phased withdrawals scheduled to resume within 48 hours.
Collateral Exploits: Compounding market anxiety, prediction platform Polymarket faced a concurrent, unrelated breach on Thursday—a third-party script exploit that drained an estimated $2–$3 million from user accounts.
Predictably, the market reacted with acute risk-off selling. Bitcoin immediately surrendered the $80,000 baseline on Thursday evening, dropping roughly 4.6% to touch an intraday low near $76,300 early this morning.
Parsing the Signal from the Noise: The Historical Data
Social feeds are flooded with doomsday narratives claiming this is an existential blow to digital assets. When panic peaks, the only reliable anchor is data.
Major exchange exploits and insolvencies are not unprecedented. Below is the historical performance of Bitcoin following every major centralized exchange crisis, measured from the daily close immediately preceding the announcement:
| Event & Date | Immediate 7-Day Drawdown | 90-Day Post-Event Performance |
|---|---|---|
| Mt. Gox Halts Withdrawals (Feb 2014) | -30% | -43% |
| Bitfinex Exploit (~120K BTC) (Aug 2016) | -23% | +15% |
| Coincheck Exploit (~$530M) (Jan 2018) | -32% | -17% |
| Binance Hot Wallet Breach (7K BTC) (May 2019) | -0.5% | +108% |
| KuCoin Breach (~$280M) (Sep 2020) | -3% | +131% |
| FTX Insolvency & Collapse (Nov 2022) | -24% | +11% |
| Bybit Exploit (~$1.5B) (Feb 2025) | -20% | +14% |
What History Tells Us About the Next 90 Days
A granular look at the numbers reveals three distinct structural patterns:
Short-Term Knee-Jerk Liquidity Drains (Days 1–7): In almost every major incident, Bitcoin experiences a sharp initial flush between -20% and -32%. This is driven by leveraged long liquidations and reactive panic selling rather than structural changes to Bitcoin's underlying network fundamentals. Structural Bear vs. Bull Regimes: The long-term impact is entirely dictated by the prevailing macro cycle, not the hack itself:In Bear Markets (2014, 2018): Exploits triggered sustained multi-month downturns because the market was already structurally fragile and lacking organic bid support.
* In Expansionary/Mature Regimes (2016, 2019, 2020, 2022, 2025): The initial shock was fully absorbed within 30 to 60 days, with Bitcoin trading higher after 90 days in 5 out of 7 historical cases (averaging strong double- to triple-digit gains).
* Insolvency vs. Exploits: The market severely punishes systemic fraud and fractional reserves (Mt. Gox, FTX) longer than operational security breaches where customer backing remains intact and issuers intervene rapidly (Bitfinex, KuCoin, Bybit). With Binance committing to full reimbursement and roughly half the funds already frozen on-chain, the structural risk leans toward operational disruption rather than complete insolvency.
How I Am Approaching This
* Exchange Exposure: The first rule of counterparty risk is simple: centralized exchanges are execution venues, not custodians. If capital is not actively being deployed in open orders, it should reside in self-custody hardware wallets.
* Avoiding Panic Sells at Liquidity Wicks: Historical data shows that selling into the initial 7-day panic wick typically results in selling the local bottom of the event.
* Watching Key Levels: Rather than front-running the bounce, monitor order-book stabilization around the mid-$70K support zone until exchange withdrawal channels are verifiably back online.
$BTC
{future}(BTCUSDT)
$BNB
#breach #binanceissafe #$1.5BInLeveragedCryptoBetsLiquidated #USMidtermElections
$ETH
{future}(ETHUSDT)
{future}(BNBUSDT)
The Biggest Crypto Hack Ever Just Happened. Here’s What History Says Happens Next.
The Biggest Crypto Hack in History Just Happened: Here Is What the Data Says Happens Next
Friday, October 30, 2026
My analysis is normally reserved strictly for private subscribers. Today, I am opening this piece to the public because the events of the past 24 hours carry direct implications for anyone holding capital on a centralized exchange.
On Thursday evening, Binance suffered a catastrophic security breach.
Current internal estimates from Binance put the total theft at approximately $6.3 billion. If that figure is finalized, it will officially mark the largest exploit in cryptocurrency history—dwarfing the previous record of roughly $1.5 billion set during the Bybit breach in February 2025.
Before emotion dictates your next move, let’s unpack the verified facts, the underlying technical failure, and what historical precedent tells us about Bitcoin's medium-term trajectory.
The Anatomy of the Breach: Key Facts
Rapid Asset Freezes: Centralized stablecoin issuers (including Tether and Circle) coordinated immediately with Binance to blacklist exploiter addresses, successfully freezing roughly $3 billion of the stolen capital before it could be routed through privacy protocols or decentralized liquidity pools. Attack Vector: Contrary to initial panic regarding compromised multi-sig master keys or cold storage failures, Binance confirmed the initial entry point was a compromised developer laptop. This allowed the attackers to exploit internal deployment pipelines rather than cracking core cryptographic wallets directly. Solvency & Restitution: Binance leadership publicly committed to making all affected users whole via company reserves and internal insurance funds. Operational Pause: Both deposits and withdrawals are temporarily halted across the platform. Engineering teams are auditing access controls, with phased withdrawals scheduled to resume within 48 hours.
Collateral Exploits: Compounding market anxiety, prediction platform Polymarket faced a concurrent, unrelated breach on Thursday—a third-party script exploit that drained an estimated $2–$3 million from user accounts.
Predictably, the market reacted with acute risk-off selling. Bitcoin immediately surrendered the $80,000 baseline on Thursday evening, dropping roughly 4.6% to touch an intraday low near $76,300 early this morning.
Parsing the Signal from the Noise: The Historical Data
Social feeds are flooded with doomsday narratives claiming this is an existential blow to digital assets. When panic peaks, the only reliable anchor is data.
Major exchange exploits and insolvencies are not unprecedented. Below is the historical performance of Bitcoin following every major centralized exchange crisis, measured from the daily close immediately preceding the announcement:
| Event & Date | Immediate 7-Day Drawdown | 90-Day Post-Event Performance |
|---|---|---|
| Mt. Gox Halts Withdrawals (Feb 2014) | -30% | -43% |
| Bitfinex Exploit (~120K BTC) (Aug 2016) | -23% | +15% |
| Coincheck Exploit (~$530M) (Jan 2018) | -32% | -17% |
| Binance Hot Wallet Breach (7K BTC) (May 2019) | -0.5% | +108% |
| KuCoin Breach (~$280M) (Sep 2020) | -3% | +131% |
| FTX Insolvency & Collapse (Nov 2022) | -24% | +11% |
| Bybit Exploit (~$1.5B) (Feb 2025) | -20% | +14% |
What History Tells Us About the Next 90 Days
A granular look at the numbers reveals three distinct structural patterns:
Short-Term Knee-Jerk Liquidity Drains (Days 1–7): In almost every major incident, Bitcoin experiences a sharp initial flush between -20% and -32%. This is driven by leveraged long liquidations and reactive panic selling rather than structural changes to Bitcoin's underlying network fundamentals. Structural Bear vs. Bull Regimes: The long-term impact is entirely dictated by the prevailing macro cycle, not the hack itself:In Bear Markets (2014, 2018): Exploits triggered sustained multi-month downturns because the market was already structurally fragile and lacking organic bid support.
* In Expansionary/Mature Regimes (2016, 2019, 2020, 2022, 2025): The initial shock was fully absorbed within 30 to 60 days, with Bitcoin trading higher after 90 days in 5 out of 7 historical cases (averaging strong double- to triple-digit gains).
* Insolvency vs. Exploits: The market severely punishes systemic fraud and fractional reserves (Mt. Gox, FTX) longer than operational security breaches where customer backing remains intact and issuers intervene rapidly (Bitfinex, KuCoin, Bybit). With Binance committing to full reimbursement and roughly half the funds already frozen on-chain, the structural risk leans toward operational disruption rather than complete insolvency.
How I Am Approaching This
* Exchange Exposure: The first rule of counterparty risk is simple: centralized exchanges are execution venues, not custodians. If capital is not actively being deployed in open orders, it should reside in self-custody hardware wallets.
* Avoiding Panic Sells at Liquidity Wicks: Historical data shows that selling into the initial 7-day panic wick typically results in selling the local bottom of the event.
* Watching Key Levels: Rather than front-running the bounce, monitor order-book stabilization around the mid-$70K support zone until exchange withdrawal channels are verifiably back online.
$BTC
$BNB
#breach #binanceissafe #$1.5BInLeveragedCryptoBetsLiquidated #USMidtermElections
$ETH
3
848

·
--
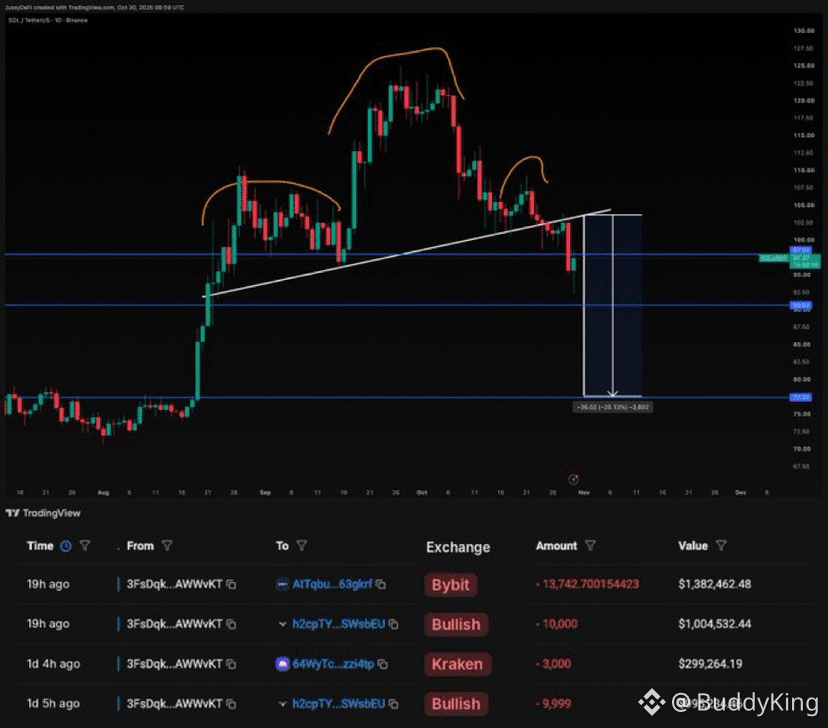
$SOL is facing some serious pressure, and the charts aren't looking encouraging.
Here's what's raising concerns:
1️⃣ A major anonymous whale reportedly sold over 1M SOL worth $100M+ in just six days.
2️⃣ The Binance hacker reportedly moved another 970K SOL, valued at around $96M.
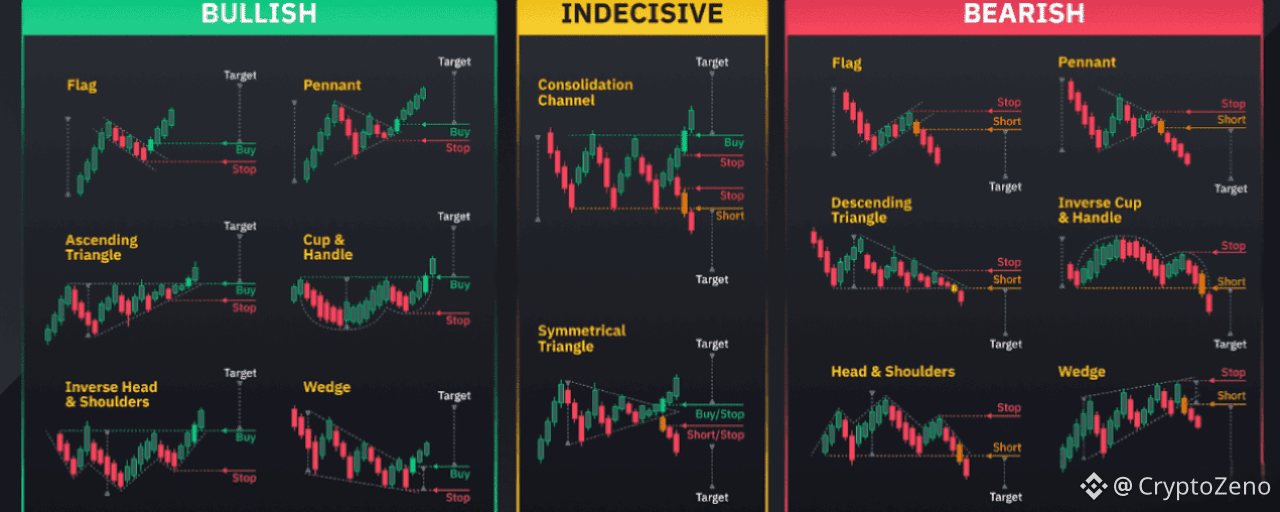
3️⃣ SOL has confirmed a bearish head-and-shoulders breakdown. The $97 target has already been reached, with $90 and $77 now in focus.
Despite upcoming ecosystem upgrades and Breakpoint just 16 days away, the selling pressure shouldn't be ignored.
For now, caution is key. The market needs to prove its strength before bulls can regain control.
Could SOL see another leg down before its next major recovery?
$BEAMX #$1.5BInLeveragedCryptoBetsLiquidated
$SOPH #AmazonSharesFallAbout7%InPremarketTrading
1
1.6k

·
--
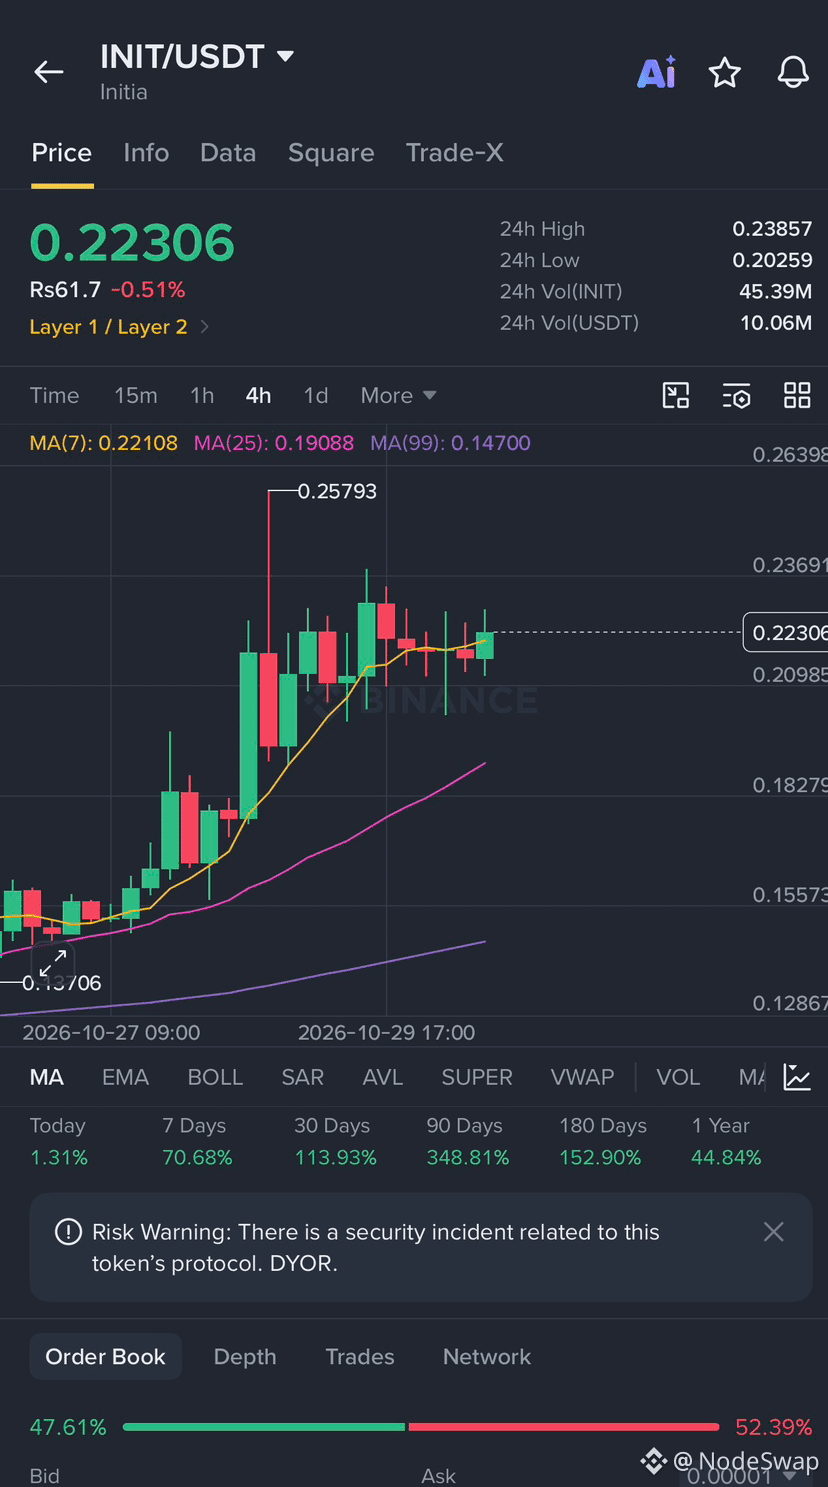
$INIT is up over +35% to +38% today, bouncing strongly off its $0.16–$0.17 support zone and testing key overhead levels.
🎯 Key Levels to Watch: A clean breakout and hold above $0.22–$0.25 could push the price toward $0.30+, while failure to hold momentum risks a retest of $0.18.
{future}(INITUSDT)
#KOSPIFalls3.53%BackBelow6000
#$1.5BInLeveragedCryptoBetsLiquidated
$INIT is up over +35% to +38% today, bouncing strongly off its $0.16–$0.17 support zone and testing key overhead levels.
🎯 Key Levels to Watch: A clean breakout and hold above $0.22–$0.25 could push the price toward $0.30+, while failure to hold momentum risks a retest of $0.18.
#KOSPIFalls3.53%BackBelow6000
#$1.5BInLeveragedCryptoBetsLiquidated
🎯 Key Levels to Watch: A clean breakout and hold above $0.22–$0.25 could push the price toward $0.30+, while failure to hold momentum risks a retest of $0.18.
#KOSPIFalls3.53%BackBelow6000
#$1.5BInLeveragedCryptoBetsLiquidated
1
1
428

$WLD
{future}(WLDUSDT)
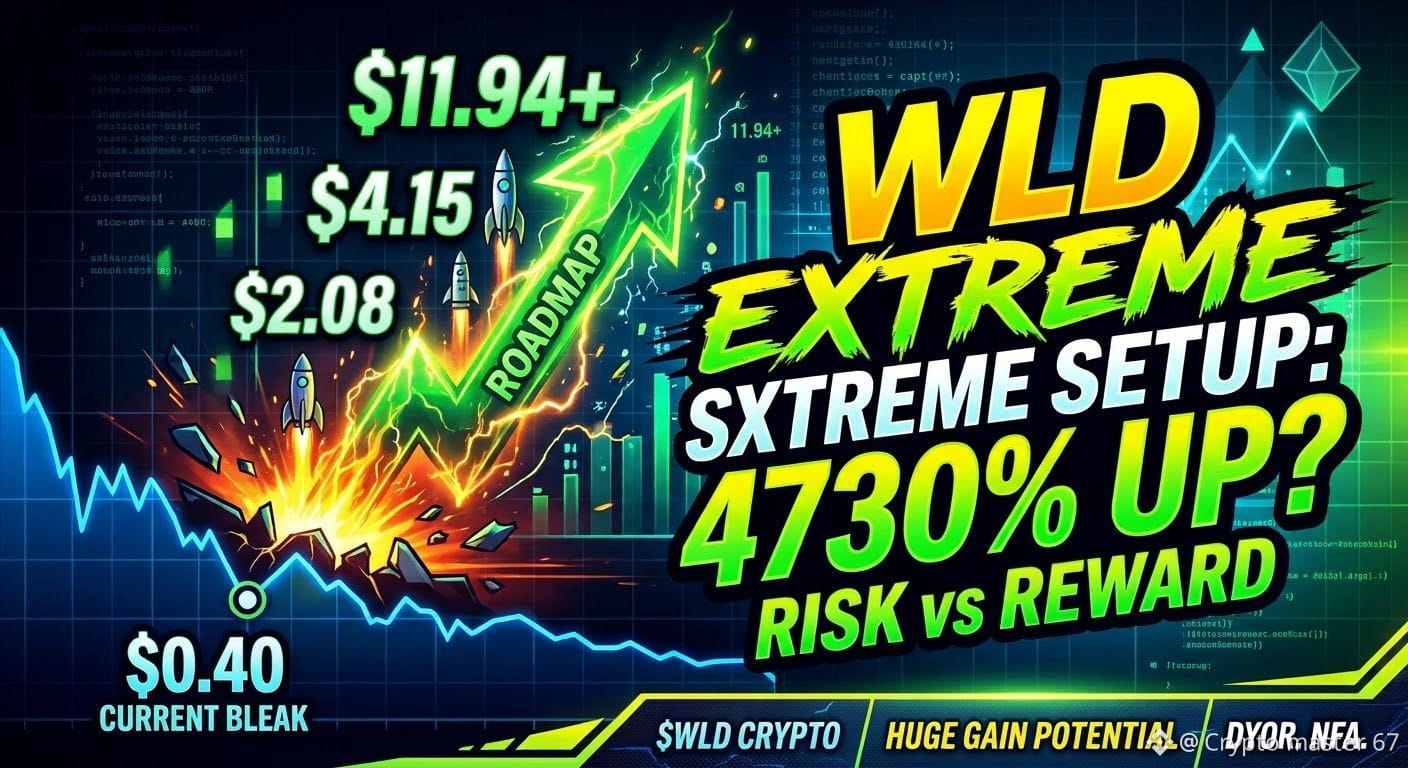
THIS STRIKING $WLD SETUP COULD BE ONE OF THE MOST EXTREME IN RATIO TO RISK ON THE MARKET.
Worldcoin has turned in a bleak performance that it is now trading at around $0.40, but the weekly time frame shows enough of a roadmap that not following it is impossible.
📈 Potential upside targets:
* $2.08
* $4.15
* $11.94
The potential upside, to hit the target, would be around 4730%.
Sounds ridiculous? Absolutely. LMAO.
As always, though, this doesn’t constitute a bottom call and these are not targets that are assured to be achieved; in fact, there is still potential for further declines below the current levels in $WLD.
But as the market continues to rally in the future, the current chart may seem remarkable in retrospect.
Well, the question is, is it $WLD's turn to come back for one of the largest comebacks during this cycle?
DYOR. NFA.#wld #UniswapA16zSeekDeFiExemptionFromIllinoisCryptoTax #$1.5BInLeveragedCryptoBetsLiquidated #KOSPIFalls3.53%BackBelow6000
$WLD
THIS STRIKING $WLD SETUP COULD BE ONE OF THE MOST EXTREME IN RATIO TO RISK ON THE MARKET.
Worldcoin has turned in a bleak performance that it is now trading at around $0.40, but the weekly time frame shows enough of a roadmap that not following it is impossible.
📈 Potential upside targets:
* $2.08
* $4.15
* $11.94
The potential upside, to hit the target, would be around 4730%.
Sounds ridiculous? Absolutely. LMAO.
As always, though, this doesn’t constitute a bottom call and these are not targets that are assured to be achieved; in fact, there is still potential for further declines below the current levels in $WLD .
But as the market continues to rally in the future, the current chart may seem remarkable in retrospect.
Well, the question is, is it $WLD 's turn to come back for one of the largest comebacks during this cycle?
DYOR. NFA.#wld #UniswapA16zSeekDeFiExemptionFromIllinoisCryptoTax #$1.5BInLeveragedCryptoBetsLiquidated #KOSPIFalls3.53%BackBelow6000
Virgina Cofield Nfud:
周线确实非常明确,只是短线也确实糟心
1
3
317
·
--
Article
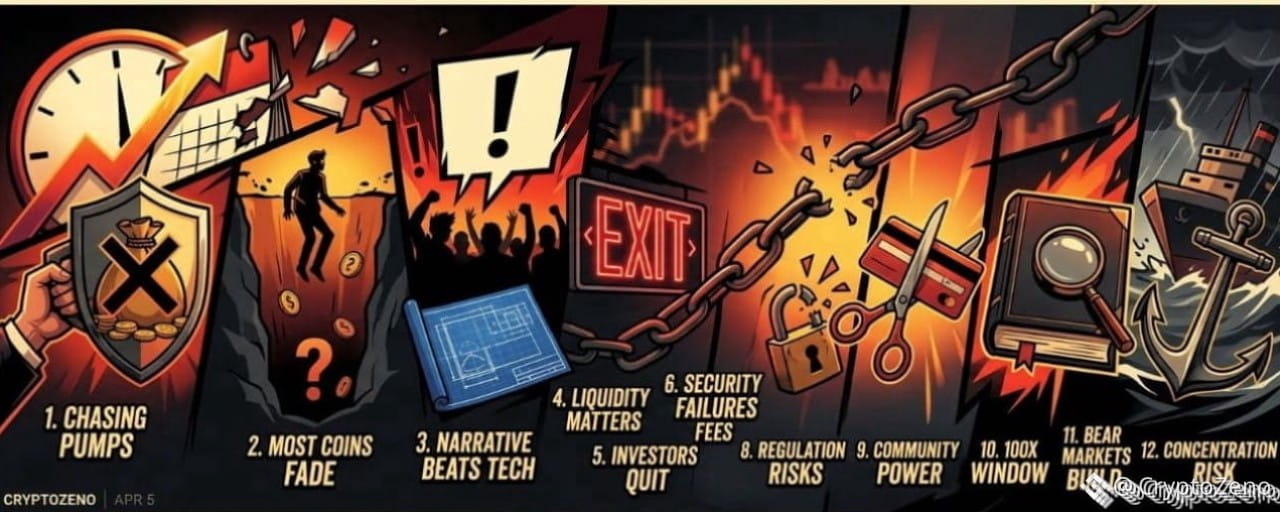
12 Brutal Mistakes I Made in 12 Years of CryptoSo You Don’t Have To Learn Them the Hard WayI’ve survived twelve years in crypto. I’ve made millions. I’ve lost millions. The gains teach you confidence. The losses teach you truth. These are the mistakes that cost me the most.
Chasing Pumps Is Just Providing Exit Liquidity Every time I bought into a coin already exploding, I convinced myself momentum would continue. Most of the time, I was simply late. When something is trending everywhere, you are rarely early. You are often the liquidity for someone smarter who entered before you.Most Coins Don’t Collapse. They Fade The majority of projects don’t die in dramatic crashes. They slowly lose volume, updates stop, the community shrinks, and attention disappears. One day you realize liquidity is gone and so is your capital.Narrative Often Beats Technology I backed technically superior projects that went nowhere. Meanwhile, tokens with powerful stories, branding, and community momentum outperformed. Markets reward belief and attention before they reward engineering.Liquidity Is More Important Than Paper Gains An unrealized gain means nothing if you cannot exit efficiently. Thin order books trap capital. Always assess depth, not just price.Most Investors Quit at the Worst Time Cycles are emotional weapons. People buy during euphoria and sell during despair. Many who left in bear markets watched prices recover without them. Longevity alone is an edge.Security Failures Hurt More Than Bad Trades I have been hacked, phished, and SIM-swapped. Poor operational security erased profits faster than volatility ever did. Capital without protection is temporary.Overtrading Transfers Wealth to Exchanges Constant activity feels productive. It rarely is. The more I traded, the more I paid in fees and mistakes. Holding strong assets through noise often outperformed aggressive trading.Regulation Changes the Game Overnight Governments move slowly until they don’t. Tokens built on regulatory gray zones can disappear quickly. Long-term survival requires anticipating policy risk.Community Is an Asset Class I underestimated culture. Memes, loyalty, and shared identity drive liquidity and resilience. A loud, committed community can sustain a project longer than strong fundamentals alone.The 100x Window Is Brief Life-changing returns happen early, quietly, and without consensus. Once everyone agrees something is a great opportunity, the asymmetric upside is usually gone.Bear Markets Build Real Advantage The quiet phases are when knowledge compounds. Reading, building, accumulating quality assets at depressed valuations created my largest long-term returns. Bull markets reward positioning built in silence.Concentration Without Risk Control Is Gambling I have seen fortunes disappear from a single oversized bet. Conviction must be balanced with survival. You cannot compound if you are wiped out.
Twelve years taught me this: crypto does not reward intelligence alone. It rewards discipline, patience, adaptability, and survival.
If even one of these lessons saves you from repeating my mistakes, you are already ahead of where I once was.
In crypto, staying in the game is often the biggest advantage of all.
#CryptoZeno #$1.5BInLeveragedCryptoBetsLiquidated
12 Brutal Mistakes I Made in 12 Years of CryptoSo You Don’t Have To Learn Them the Hard Way
I’ve survived twelve years in crypto. I’ve made millions. I’ve lost millions. The gains teach you confidence. The losses teach you truth. These are the mistakes that cost me the most.
Chasing Pumps Is Just Providing Exit Liquidity Every time I bought into a coin already exploding, I convinced myself momentum would continue. Most of the time, I was simply late. When something is trending everywhere, you are rarely early. You are often the liquidity for someone smarter who entered before you.Most Coins Don’t Collapse. They Fade The majority of projects don’t die in dramatic crashes. They slowly lose volume, updates stop, the community shrinks, and attention disappears. One day you realize liquidity is gone and so is your capital.Narrative Often Beats Technology I backed technically superior projects that went nowhere. Meanwhile, tokens with powerful stories, branding, and community momentum outperformed. Markets reward belief and attention before they reward engineering.Liquidity Is More Important Than Paper Gains An unrealized gain means nothing if you cannot exit efficiently. Thin order books trap capital. Always assess depth, not just price.Most Investors Quit at the Worst Time Cycles are emotional weapons. People buy during euphoria and sell during despair. Many who left in bear markets watched prices recover without them. Longevity alone is an edge.Security Failures Hurt More Than Bad Trades I have been hacked, phished, and SIM-swapped. Poor operational security erased profits faster than volatility ever did. Capital without protection is temporary.Overtrading Transfers Wealth to Exchanges Constant activity feels productive. It rarely is. The more I traded, the more I paid in fees and mistakes. Holding strong assets through noise often outperformed aggressive trading.Regulation Changes the Game Overnight Governments move slowly until they don’t. Tokens built on regulatory gray zones can disappear quickly. Long-term survival requires anticipating policy risk.Community Is an Asset Class I underestimated culture. Memes, loyalty, and shared identity drive liquidity and resilience. A loud, committed community can sustain a project longer than strong fundamentals alone.The 100x Window Is Brief Life-changing returns happen early, quietly, and without consensus. Once everyone agrees something is a great opportunity, the asymmetric upside is usually gone.Bear Markets Build Real Advantage The quiet phases are when knowledge compounds. Reading, building, accumulating quality assets at depressed valuations created my largest long-term returns. Bull markets reward positioning built in silence.Concentration Without Risk Control Is Gambling I have seen fortunes disappear from a single oversized bet. Conviction must be balanced with survival. You cannot compound if you are wiped out.
Twelve years taught me this: crypto does not reward intelligence alone. It rewards discipline, patience, adaptability, and survival.
If even one of these lessons saves you from repeating my mistakes, you are already ahead of where I once was.
In crypto, staying in the game is often the biggest advantage of all.
#CryptoZeno #$1.5BInLeveragedCryptoBetsLiquidated
8
3.8k
·
--
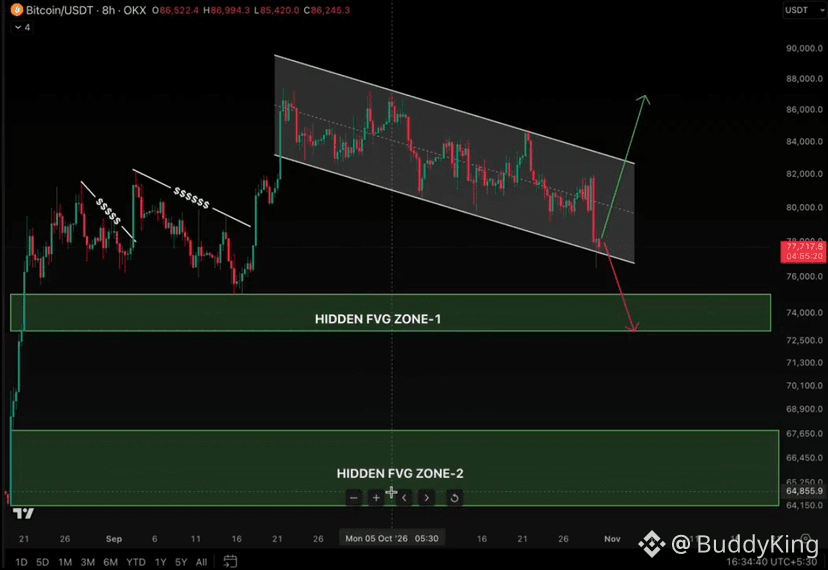
$BTC continues grinding lower within its channel, and I still believe the real move is yet to come.
Those hidden FVGs remain interesting, and the $73K–$74K zone is becoming harder to ignore.
Wouldn’t be surprised by one final liquidity sweep into that area before BTC decides its next direction.
Everyone wants to catch the bottom, but patience is what separates good setups from emotional trades.
Don't chase. Don't rush. Let the market come to you.
The real opportunity belongs to those willing to wait.
$LSK #$1.5BInLeveragedCryptoBetsLiquidated
$PARTI #AmazonSharesFallAbout7%InPremarketTrading
1k
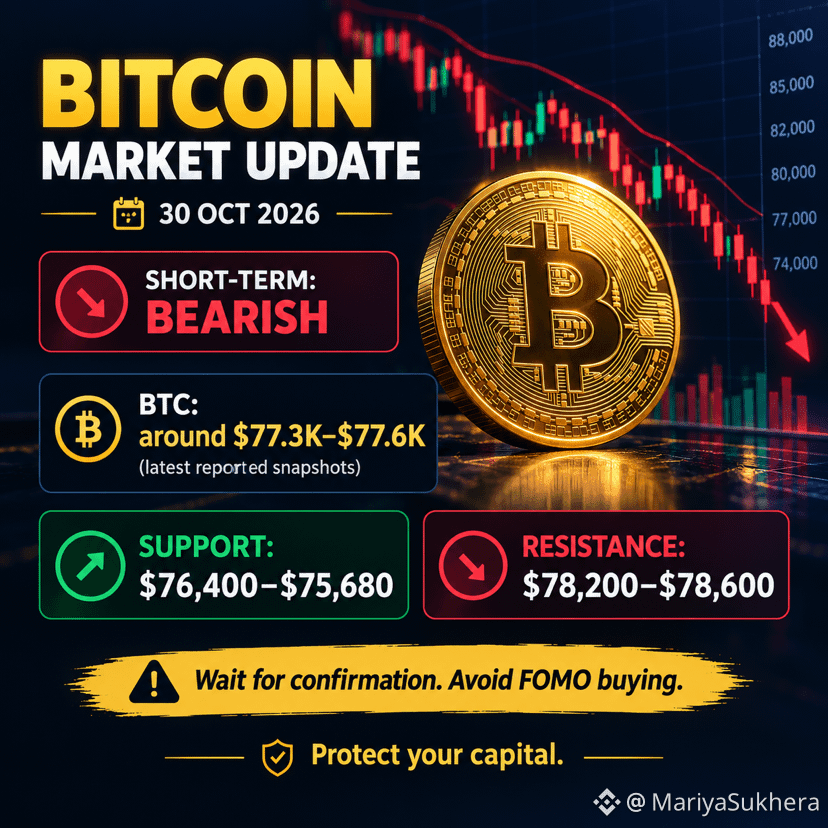
$BTC is under selling pressure!
Bitcoin is trading around $77,300–$77,600 in the latest reported market snapshots, after falling below $80,000. 
Key levels to watch:
🟢 Support: $76,400 – $75,680
🔴 Resistance: $78,200 – $78,600
📉 Below support: Further downside risk.
📈 Above resistance: Possible recovery.
My Analysis: $BTC currently shows bearish short-term momentum. Traders should avoid FOMO buying and wait for confirmation before entering a trade.
Trade carefully. Protect your capital!
#bitcoin #BitcoinDropsBelow$80K #BTCUSD
#cryptouniverseofficial #$1.5BInLeveragedCryptoBetsLiquidated
{spot}(BTCUSDT)
$BTC is under selling pressure!
Bitcoin is trading around $77,300–$77,600 in the latest reported market snapshots, after falling below $80,000. 
Key levels to watch:
🟢 Support: $76,400 – $75,680
🔴 Resistance: $78,200 – $78,600
📉 Below support: Further downside risk.
📈 Above resistance: Possible recovery.
My Analysis: $BTC currently shows bearish short-term momentum. Traders should avoid FOMO buying and wait for confirmation before entering a trade.
Trade carefully. Protect your capital!
#bitcoin #BitcoinDropsBelow$80K #BTCUSD
#cryptouniverseofficial #$1.5BInLeveragedCryptoBetsLiquidated
Ghoststroke:
Take away the colored boxes and look at order book depth. That 78,200 resistance is simply trapped inventory from traders who longed above eighty thousand placing break-even exit orders. Meanwhile, resting bids down to 76,400 have compressed to an 0.87 ratio while retail accounts remain heavily crowded on the buy side. Automated execution algorithms hunt resting liquidity clusters, not neat horizontal milestones.
1
1
205

·
--
Bullish
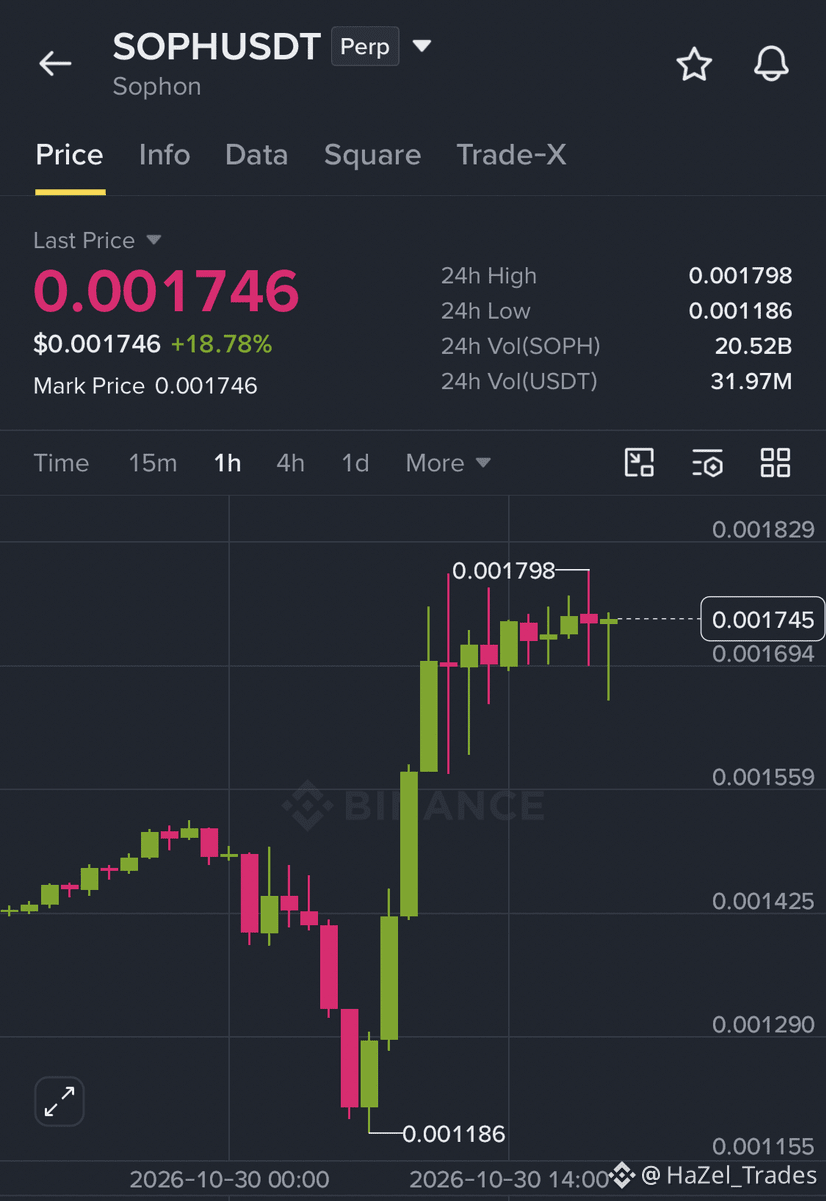
$SOPH LONG SETUP🟢
Entry: $0.00172–$0.00174
TP1: $0.00180
TP2: $0.00185
TP3: $0.00190
SL: $0.00168
SOPH has made a strong move up and is now consolidating around $0.00174. I’m watching the $0.00180 level closely. If price breaks above it with good momentum, we could see another move higher. I’d wait for confirmation before entering.
{future}(SOPHUSDT)
#UniswapA16zSeekDeFiExemptionFromIllinoisCryptoTax #$1.5BInLeveragedCryptoBetsLiquidated #TrezorSaysCryptoBilisSoldWalletMayContainMaliciousComponents #KOSPIFalls3.53%BackBelow6000
$SOPH LONG SETUP🟢
Entry: $0.00172–$0.00174
TP1: $0.00180
TP2: $0.00185
TP3: $0.00190
SL: $0.00168
SOPH has made a strong move up and is now consolidating around $0.00174. I’m watching the $0.00180 level closely. If price breaks above it with good momentum, we could see another move higher. I’d wait for confirmation before entering.
#UniswapA16zSeekDeFiExemptionFromIllinoisCryptoTax #$1.5BInLeveragedCryptoBetsLiquidated #TrezorSaysCryptoBilisSoldWalletMayContainMaliciousComponents #KOSPIFalls3.53%BackBelow6000
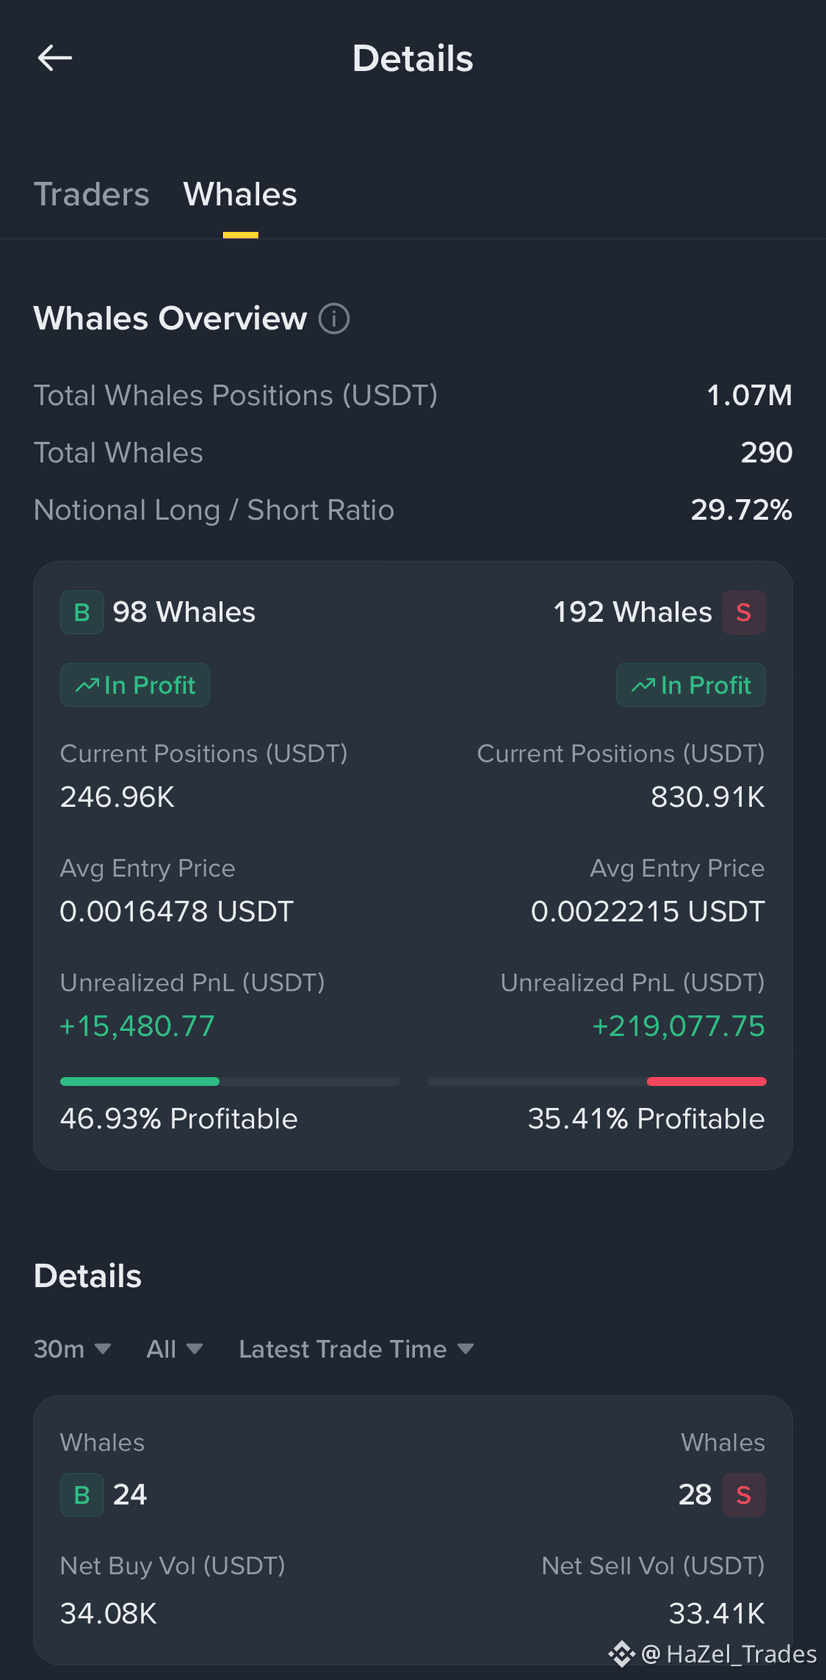
5
1
2
117
·
--
Bearish
$IDOL THE RALLY IS SHOWING SIGNS OF EXHAUSTION!
After a massive 26% surge, IDOL is approaching the $0.01885 resistance zone. RSI is heavily overbought, while recent whale activity shows stronger selling pressure. A rejection could trigger profit-taking.
🚨 SHORT $IDOL
Entry: 0.01870 – 0.01890
TP1: 0.01755
TP2: 0.01612
TP3: 0.01464
SL: 0.01955
SELLING PRESSURE IS BUILDING — WATCH THIS RESISTANCE 👇🏻🌸
Wait for rejection confirmation. Whales still hold significantly larger long positions, so a squeeze remains possible.
{future}(IDOLUSDT)
#UniswapA16zSeekDeFiExemptionFromIllinoisCryptoTax #$1.5BInLeveragedCryptoBetsLiquidated #TrezorSaysCryptoBilisSoldWalletMayContainMaliciousComponents
$IDOL THE RALLY IS SHOWING SIGNS OF EXHAUSTION!
After a massive 26% surge, IDOL is approaching the $0.01885 resistance zone. RSI is heavily overbought, while recent whale activity shows stronger selling pressure. A rejection could trigger profit-taking.
🚨 SHORT $IDOL
Entry: 0.01870 – 0.01890
TP1: 0.01755
TP2: 0.01612
TP3: 0.01464
SL: 0.01955
SELLING PRESSURE IS BUILDING — WATCH THIS RESISTANCE 👇🏻🌸
Wait for rejection confirmation. Whales still hold significantly larger long positions, so a squeeze remains possible.
#UniswapA16zSeekDeFiExemptionFromIllinoisCryptoTax #$1.5BInLeveragedCryptoBetsLiquidated #TrezorSaysCryptoBilisSoldWalletMayContainMaliciousComponents
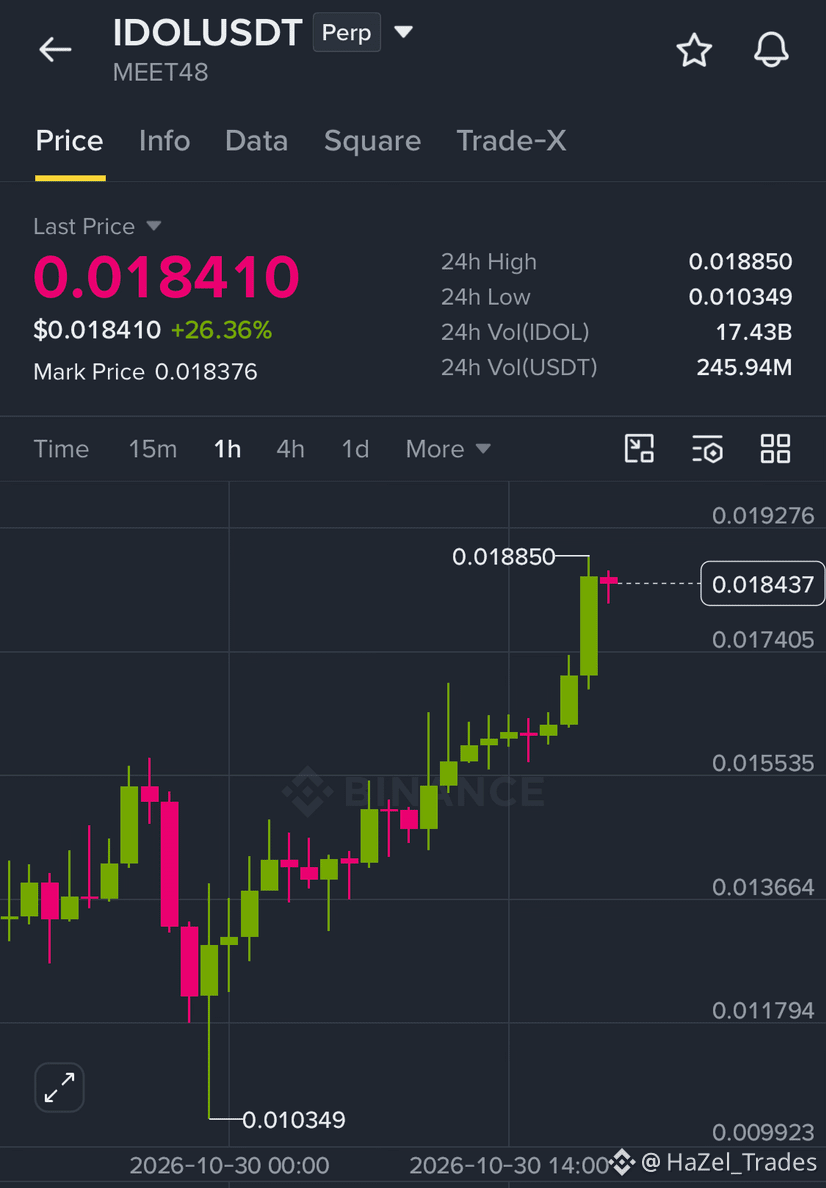
5
2
1
124
$XRP
{future}(XRPUSDT)
$IDOL
{future}(IDOLUSDT)
$BEAMX
{future}(BEAMXUSDT)
🚨 RIPPLE REPORTEDLY FREEZES $200 MILLION TIE TO THE POTENTIAL BINANCE HACKER
Binance co-founder @Yi He reports that Ripple has only frozen around $200 million which is allegedly tied to this alleged Binance hack.
It comes after reports that Tether's and Circle's assets have been also frozen in relation to the incident.
This underscores the potential for substantial stablecoin issuers and blockchain businesses to take action and block and curtail illicit transactions as well as the transfer of stolen assets.
More information about the funds being frozen and the investigation will be equally important to follow.
In your opinion, can these coordinated actions help to retrieve the lost money?
DYOR. NFA.
#xrp #$1.5BInLeveragedCryptoBetsLiquidated #KOSPIFalls3.53%BackBelow6000 #AmazonSharesFallAbout7%InPremarketTrading #USMidtermElections
$XRP
$IDOL
$BEAMX
🚨 RIPPLE REPORTEDLY FREEZES $200 MILLION TIE TO THE POTENTIAL BINANCE HACKER
Binance co-founder @Yi He reports that Ripple has only frozen around $200 million which is allegedly tied to this alleged Binance hack.
It comes after reports that Tether's and Circle's assets have been also frozen in relation to the incident.
This underscores the potential for substantial stablecoin issuers and blockchain businesses to take action and block and curtail illicit transactions as well as the transfer of stolen assets.
More information about the funds being frozen and the investigation will be equally important to follow.
In your opinion, can these coordinated actions help to retrieve the lost money?
DYOR. NFA.
#xrp #$1.5BInLeveragedCryptoBetsLiquidated #KOSPIFalls3.53%BackBelow6000 #AmazonSharesFallAbout7%InPremarketTrading #USMidtermElections

657
·
--
Bullish
$Q Long Setup🟢
Entry: 0.0470–0.0480
SL: 0.0450
TP1: 0.0510
TP2: 0.0535
TP3: 0.0560
QUSDT is showing a recovery from the lower levels. Looking for a move towards 0.0510 and above, but I’ll wait for confirmation before entering. If price breaks below 0.0450, the setup is invalid.
{future}(QUSDT)
#UniswapA16zSeekDeFiExemptionFromIllinoisCryptoTax #HKDollarStablecoinHKDAPToLaunchOnSolana #$1.5BInLeveragedCryptoBetsLiquidated #TrezorSaysCryptoBilisSoldWalletMayContainMaliciousComponents
$Q Long Setup🟢
Entry: 0.0470–0.0480
SL: 0.0450
TP1: 0.0510
TP2: 0.0535
TP3: 0.0560
QUSDT is showing a recovery from the lower levels. Looking for a move towards 0.0510 and above, but I’ll wait for confirmation before entering. If price breaks below 0.0450, the setup is invalid.
#UniswapA16zSeekDeFiExemptionFromIllinoisCryptoTax #HKDollarStablecoinHKDAPToLaunchOnSolana #$1.5BInLeveragedCryptoBetsLiquidated #TrezorSaysCryptoBilisSoldWalletMayContainMaliciousComponents
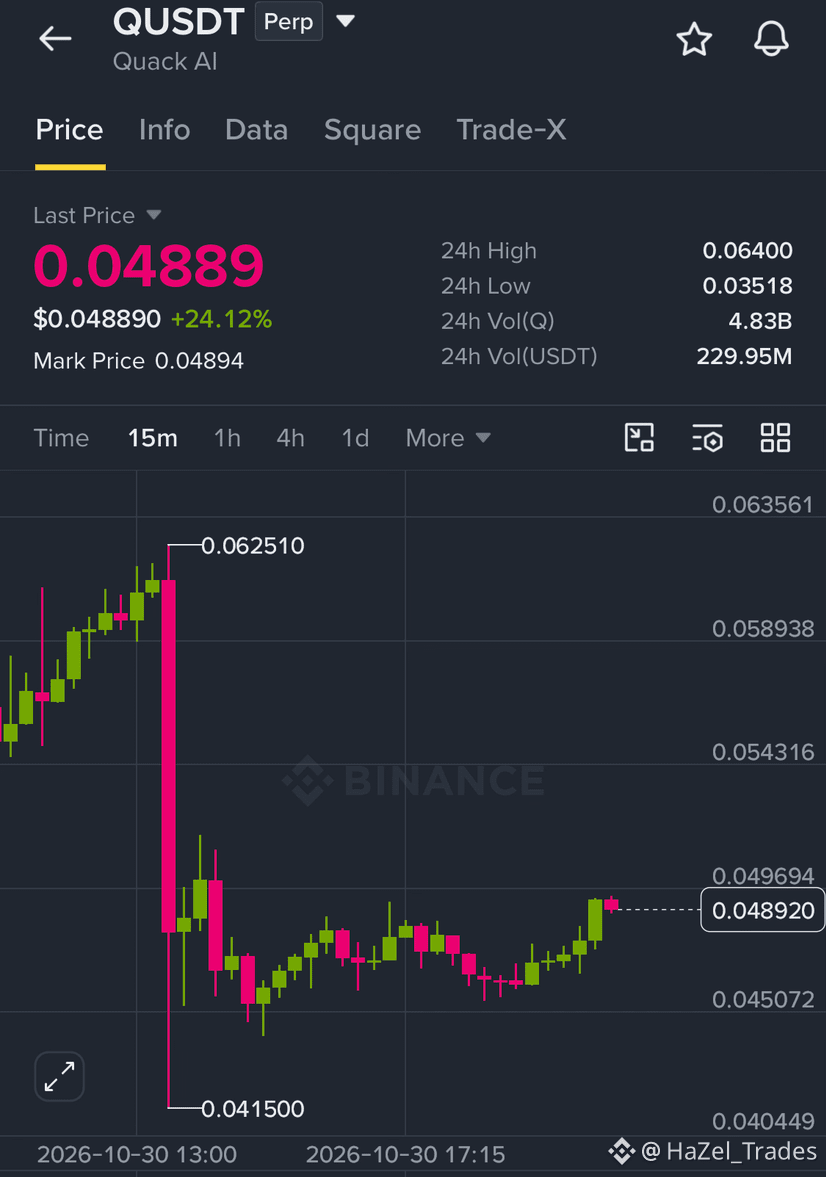
4
164

·
--
$APT is a promising Layer-1 blockchain coin designed to offer fast transactions, low fees, high scalability and secure smart contracts through its Move programming language. Its ecosystem supports DeFi, NFTs, gaming and Web3 applications. Recent network improvements, including Block-STM v2 and Encrypted Mempool, strengthen its technology and transaction efficiency. Aptos also introduced a 2.1 billion APT supply cap to improve long-term tokenomics. Overall, $APT has strong technological potential, but its future price depends on market demand, ecosystem growth and investor confidence. It remains a high-risk cryptocurrency with potential for long-term growth.
{spot}(APTUSDT)
#BinanceWillListPredictPREDICT #AmazonSharesFallAbout7%InPremarketTrading #SwitzerlandFirstSpotBitcoinETFExpectedToTradeInNovember #$1.5BInLeveragedCryptoBetsLiquidated
$APT is a promising Layer-1 blockchain coin designed to offer fast transactions, low fees, high scalability and secure smart contracts through its Move programming language. Its ecosystem supports DeFi, NFTs, gaming and Web3 applications. Recent network improvements, including Block-STM v2 and Encrypted Mempool, strengthen its technology and transaction efficiency. Aptos also introduced a 2.1 billion APT supply cap to improve long-term tokenomics. Overall, $APT has strong technological potential, but its future price depends on market demand, ecosystem growth and investor confidence. It remains a high-risk cryptocurrency with potential for long-term growth.
#BinanceWillListPredictPREDICT #AmazonSharesFallAbout7%InPremarketTrading #SwitzerlandFirstSpotBitcoinETFExpectedToTradeInNovember #$1.5BInLeveragedCryptoBetsLiquidated
#BinanceWillListPredictPREDICT #AmazonSharesFallAbout7%InPremarketTrading #SwitzerlandFirstSpotBitcoinETFExpectedToTradeInNovember #$1.5BInLeveragedCryptoBetsLiquidated
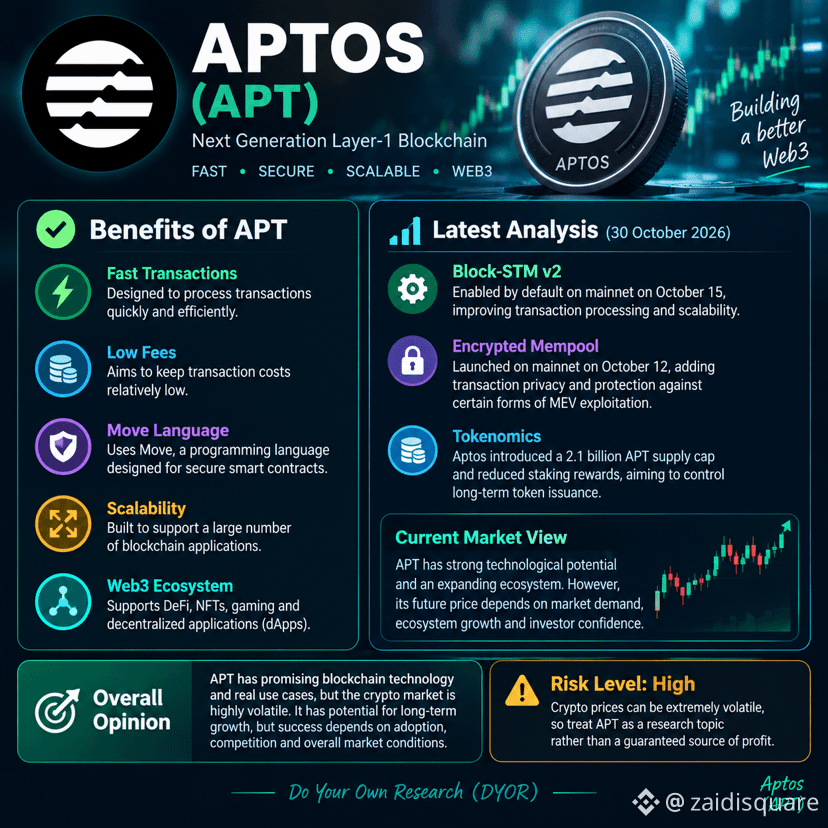
1
222

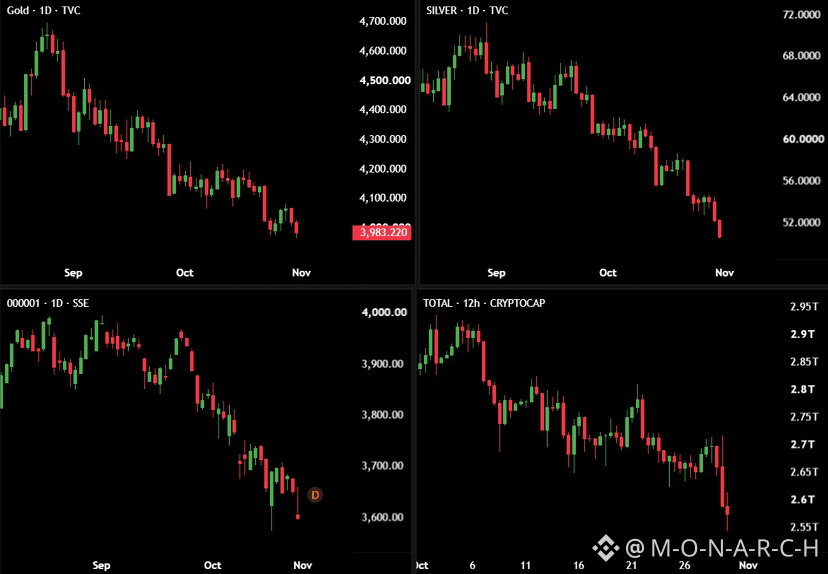
🚨 BLACK FRIDAY IS HERE.
Friday isn’t Over Yet.
$700 Billion has been wiped out from Gold and Silver today.
$500 Billion has been wiped out from the Asian stock market today.
$150 Billion has been wiped out from the crypto market following Binance's hack.
$800 Billion will be wiped out from the US stock market at open based on the current pre-market drop.
This is almost $2.2 Trillion wiped out from global markets, and Friday isn't over yet.
#$1.5BInLeveragedCryptoBetsLiquidated #KOSPIFalls3.53%BackBelow6000 #USMidtermElections #StrategySTRCReaches$99.95ForFirstTimeIn165Days #BinanceWillListPredictPREDICT
964
·
--
Bullish
$SKDD Long Setup🟢
Entry: 8.75–8.85
SL: 8.55
TP1: 9.10
TP2: 9.35
TP3: 9.60
SKDD is holding strong after a solid pump, with buyers still supporting the price. A breakout above 9.09 could push it towards the next liquidity zones, but I’ll wait for confirmation before entering. Avoid chasing the move at current levels.
{future}(SKDDUSDT)
#UniswapA16zSeekDeFiExemptionFromIllinoisCryptoTax #HKDollarStablecoinHKDAPToLaunchOnSolana #$1.5BInLeveragedCryptoBetsLiquidated
$SKDD Long Setup🟢
Entry: 8.75–8.85
SL: 8.55
TP1: 9.10
TP2: 9.35
TP3: 9.60
SKDD is holding strong after a solid pump, with buyers still supporting the price. A breakout above 9.09 could push it towards the next liquidity zones, but I’ll wait for confirmation before entering. Avoid chasing the move at current levels.
#UniswapA16zSeekDeFiExemptionFromIllinoisCryptoTax #HKDollarStablecoinHKDAPToLaunchOnSolana #$1.5BInLeveragedCryptoBetsLiquidated


140
Log in to explore more content
Join global crypto users on Binance Square
⚡️ Get latest and useful information about crypto.
💬 Trusted by the world’s largest crypto exchange.
👍 Discover real insights from verified creators.
Email / Phone number
Trending Topics
1
#UniswapA16zSeekDeFiExemptionFromIllinoisCryptoTax
6,559 views
392 Discussing
2
#HKDollarStablecoinHKDAPToLaunchOnSolana
4,022 views
222 Discussing
3
#$1.5BInLeveragedCryptoBetsLiquidated
18,265 views
193 Discussing
4
#TrezorSaysCryptoBilisSoldWalletMayContainMaliciousComponents
742 views
36 Discussing
5
#KOSPIFalls3.53%BackBelow6000
42,424 views
886 Discussing
6
#AmazonSharesFallAbout7%InPremarketTrading
18,237 views
465 Discussing
7
#USMidtermElections
189,360 views
2,148 Discussing
8
#StrategySTRCReaches$99.95ForFirstTimeIn165Days
9,583 views
90 Discussing
9
#BinanceWillListPredictPREDICT
64,684 views
1,211 Discussing
10
#SwitzerlandFirstSpotBitcoinETFExpectedToTradeInNovember
2,198 views
99 Discussing