

james kargo
153 Жариялаулар

james kargo
Хабарлау
Пайдаланушыны блоктау
BP-FE500BCD669C
Ашық сауда
Кездейсоқ трейдер
4.4 жыл
243 Жазылым
108 Жазылушылар
19 лайк басылған
Жазбалар
Портфолио
Барлығы
Баға ұсыныстары
·
--
Расталды
FLOKI: From Meme Coin to a Growing Crypto EcosystemOctober 3, 2026
FLOKI is one of the better-known meme coins in the cryptocurrency market, but its story has increasingly moved beyond the traditional meme-coin narrative.
The project has been building an ecosystem around gaming, DeFi, trading tools, education, and other blockchain-based products. Recent developments have also kept FLOKI on the radar of crypto-market participants.
From Meme to Ecosystem
FLOKI originally gained attention from the meme-coin movement surrounding Elon Musk's Shiba Inu-themed references in 2021. Since then, the project has attempted to build utility around the FLOKI token rather than relying solely on social-media attention.
Its ecosystem includes products such as Valhalla, FlokiFi, the Floki Trading Bot, and educational initiatives.
This creates an interesting distinction between simply holding a meme narrative and developing actual products around a token.
FLOKI Trading Bot and Token Burns
One recent development worth watching is the FLOKI Trading Bot's buy-and-burn mechanism.
According to a Floki announcement, the bot charges a 1% trading fee, with 50% of those fees allocated to buying and burning FLOKI, while the other 50% goes to the Floki Treasury. The project also announced that 50% of more than $1 million in previously accumulated fees would be used for buy-and-burn activity.
Token burns are designed to reduce the amount of tokens in circulation. However, burns alone do not guarantee an increase in token price.
Other Burn Mechanisms
FLOKI's documentation describes several mechanisms connected to token burns.
These include a portion of FlokiFi service fees, a portion of prepaid debit-card top-up fees, and penalties associated with early unstaking.
The important point for researchers is to distinguish between a burn mechanism and its actual economic impact. The amount burned, the rate of token usage, circulating supply, and market demand all matter.
RICE AI Airdrop
Another recent development is the RICE AI airdrop.
According to Coindar's event tracking, FLOKI completed its fourth of eight RICE AI airdrop rounds on October 2, 2026, distributing 20 million RICE to eligible Floki and TokenFi holders and stakers.
Airdrops can increase ecosystem engagement, but users should always check eligibility requirements, token utility, and distribution mechanics before participating.
What I'm Watching on October 3
For FLOKI, I would focus on several data points rather than looking at price alone:
1. Trading volume
Increasing volume can provide additional context around price movements.
2. Token burns
Monitor actual burn activity rather than relying only on announcements.
3. Ecosystem usage
Products such as Valhalla, FlokiFi and the Trading Bot are important to watch for adoption and activity.
4. Market sentiment
FLOKI remains a meme coin, so broader market sentiment can have a significant effect on its price.
5. Supply and liquidity
Market capitalization, circulating supply and liquidity are important when evaluating a high-volatility asset.
The Bigger Picture
FLOKI represents an interesting evolution within the meme-coin sector.
The project started with a strong meme-driven identity, but its development strategy now includes multiple products and ecosystem initiatives. The official Floki news archive shows continued activity across areas including marketing, education, gaming and exchange listings.
That doesn't remove the risks associated with meme coins. Market sentiment can change quickly, and cryptocurrency prices can experience significant volatility.
For anyone researching FLOKI, the most useful approach is to look beyond social-media hype and examine product development, tokenomics, on-chain activity, liquidity, volume and ecosystem usage.
Final Thoughts
FLOKI is no longer simply a meme narrative.
Its ecosystem strategy gives the project several areas to monitor, from gaming and DeFi to trading tools and token-burn mechanisms.
But the key question for researchers isn't simply:
“Can FLOKI go up?”
A better question is:
“Is the ecosystem generating sustainable usage and demand over time?”
That is the data I would continue watching.
What are you watching with FLOKI — price action, token burns, ecosystem growth, or RICE AI?
Disclaimer: This article is for educational purposes only and is not financial advice. Meme coins and other crypto assets can be highly volatile. Always conduct your own research before making financial decisions.#ICBASuesOCCOverCryptoBankCharters #NFPWatch #BlastToGraduallyShutDownItsL2Network $FLOKI
{spot}(FLOKIUSDT)
FLOKI: From Meme Coin to a Growing Crypto Ecosystem
October 3, 2026
FLOKI is one of the better-known meme coins in the cryptocurrency market, but its story has increasingly moved beyond the traditional meme-coin narrative.
The project has been building an ecosystem around gaming, DeFi, trading tools, education, and other blockchain-based products. Recent developments have also kept FLOKI on the radar of crypto-market participants.
From Meme to Ecosystem
FLOKI originally gained attention from the meme-coin movement surrounding Elon Musk's Shiba Inu-themed references in 2021. Since then, the project has attempted to build utility around the FLOKI token rather than relying solely on social-media attention.
Its ecosystem includes products such as Valhalla, FlokiFi, the Floki Trading Bot, and educational initiatives.
This creates an interesting distinction between simply holding a meme narrative and developing actual products around a token.
FLOKI Trading Bot and Token Burns
One recent development worth watching is the FLOKI Trading Bot's buy-and-burn mechanism.
According to a Floki announcement, the bot charges a 1% trading fee, with 50% of those fees allocated to buying and burning FLOKI, while the other 50% goes to the Floki Treasury. The project also announced that 50% of more than $1 million in previously accumulated fees would be used for buy-and-burn activity.
Token burns are designed to reduce the amount of tokens in circulation. However, burns alone do not guarantee an increase in token price.
Other Burn Mechanisms
FLOKI's documentation describes several mechanisms connected to token burns.
These include a portion of FlokiFi service fees, a portion of prepaid debit-card top-up fees, and penalties associated with early unstaking.
The important point for researchers is to distinguish between a burn mechanism and its actual economic impact. The amount burned, the rate of token usage, circulating supply, and market demand all matter.
RICE AI Airdrop
Another recent development is the RICE AI airdrop.
According to Coindar's event tracking, FLOKI completed its fourth of eight RICE AI airdrop rounds on October 2, 2026, distributing 20 million RICE to eligible Floki and TokenFi holders and stakers.
Airdrops can increase ecosystem engagement, but users should always check eligibility requirements, token utility, and distribution mechanics before participating.
What I'm Watching on October 3
For FLOKI, I would focus on several data points rather than looking at price alone:
1. Trading volume
Increasing volume can provide additional context around price movements.
2. Token burns
Monitor actual burn activity rather than relying only on announcements.
3. Ecosystem usage
Products such as Valhalla, FlokiFi and the Trading Bot are important to watch for adoption and activity.
4. Market sentiment
FLOKI remains a meme coin, so broader market sentiment can have a significant effect on its price.
5. Supply and liquidity
Market capitalization, circulating supply and liquidity are important when evaluating a high-volatility asset.
The Bigger Picture
FLOKI represents an interesting evolution within the meme-coin sector.
The project started with a strong meme-driven identity, but its development strategy now includes multiple products and ecosystem initiatives. The official Floki news archive shows continued activity across areas including marketing, education, gaming and exchange listings.
That doesn't remove the risks associated with meme coins. Market sentiment can change quickly, and cryptocurrency prices can experience significant volatility.
For anyone researching FLOKI, the most useful approach is to look beyond social-media hype and examine product development, tokenomics, on-chain activity, liquidity, volume and ecosystem usage.
Final Thoughts
FLOKI is no longer simply a meme narrative.
Its ecosystem strategy gives the project several areas to monitor, from gaming and DeFi to trading tools and token-burn mechanisms.
But the key question for researchers isn't simply:
“Can FLOKI go up?”
A better question is:
“Is the ecosystem generating sustainable usage and demand over time?”
That is the data I would continue watching.
What are you watching with FLOKI — price action, token burns, ecosystem growth, or RICE AI?
Disclaimer: This article is for educational purposes only and is not financial advice. Meme coins and other crypto assets can be highly volatile. Always conduct your own research before making financial decisions.#ICBASuesOCCOverCryptoBankCharters #NFPWatch #BlastToGraduallyShutDownItsL2Network $FLOKI
FLOKI is one of the better-known meme coins in the cryptocurrency market, but its story has increasingly moved beyond the traditional meme-coin narrative.
The project has been building an ecosystem around gaming, DeFi, trading tools, education, and other blockchain-based products. Recent developments have also kept FLOKI on the radar of crypto-market participants.
From Meme to Ecosystem
FLOKI originally gained attention from the meme-coin movement surrounding Elon Musk's Shiba Inu-themed references in 2021. Since then, the project has attempted to build utility around the FLOKI token rather than relying solely on social-media attention.
Its ecosystem includes products such as Valhalla, FlokiFi, the Floki Trading Bot, and educational initiatives.
This creates an interesting distinction between simply holding a meme narrative and developing actual products around a token.
FLOKI Trading Bot and Token Burns
One recent development worth watching is the FLOKI Trading Bot's buy-and-burn mechanism.
According to a Floki announcement, the bot charges a 1% trading fee, with 50% of those fees allocated to buying and burning FLOKI, while the other 50% goes to the Floki Treasury. The project also announced that 50% of more than $1 million in previously accumulated fees would be used for buy-and-burn activity.
Token burns are designed to reduce the amount of tokens in circulation. However, burns alone do not guarantee an increase in token price.
Other Burn Mechanisms
FLOKI's documentation describes several mechanisms connected to token burns.
These include a portion of FlokiFi service fees, a portion of prepaid debit-card top-up fees, and penalties associated with early unstaking.
The important point for researchers is to distinguish between a burn mechanism and its actual economic impact. The amount burned, the rate of token usage, circulating supply, and market demand all matter.
RICE AI Airdrop
Another recent development is the RICE AI airdrop.
According to Coindar's event tracking, FLOKI completed its fourth of eight RICE AI airdrop rounds on October 2, 2026, distributing 20 million RICE to eligible Floki and TokenFi holders and stakers.
Airdrops can increase ecosystem engagement, but users should always check eligibility requirements, token utility, and distribution mechanics before participating.
What I'm Watching on October 3
For FLOKI, I would focus on several data points rather than looking at price alone:
1. Trading volume
Increasing volume can provide additional context around price movements.
2. Token burns
Monitor actual burn activity rather than relying only on announcements.
3. Ecosystem usage
Products such as Valhalla, FlokiFi and the Trading Bot are important to watch for adoption and activity.
4. Market sentiment
FLOKI remains a meme coin, so broader market sentiment can have a significant effect on its price.
5. Supply and liquidity
Market capitalization, circulating supply and liquidity are important when evaluating a high-volatility asset.
The Bigger Picture
FLOKI represents an interesting evolution within the meme-coin sector.
The project started with a strong meme-driven identity, but its development strategy now includes multiple products and ecosystem initiatives. The official Floki news archive shows continued activity across areas including marketing, education, gaming and exchange listings.
That doesn't remove the risks associated with meme coins. Market sentiment can change quickly, and cryptocurrency prices can experience significant volatility.
For anyone researching FLOKI, the most useful approach is to look beyond social-media hype and examine product development, tokenomics, on-chain activity, liquidity, volume and ecosystem usage.
Final Thoughts
FLOKI is no longer simply a meme narrative.
Its ecosystem strategy gives the project several areas to monitor, from gaming and DeFi to trading tools and token-burn mechanisms.
But the key question for researchers isn't simply:
“Can FLOKI go up?”
A better question is:
“Is the ecosystem generating sustainable usage and demand over time?”
That is the data I would continue watching.
What are you watching with FLOKI — price action, token burns, ecosystem growth, or RICE AI?
Disclaimer: This article is for educational purposes only and is not financial advice. Meme coins and other crypto assets can be highly volatile. Always conduct your own research before making financial decisions.#ICBASuesOCCOverCryptoBankCharters #NFPWatch #BlastToGraduallyShutDownItsL2Network $FLOKI
1
127
·
--
Мақала
The Importance of Technology in Modern LifeChainlink Oracle Ecosystem: How It Connects Blockchain to the Real World
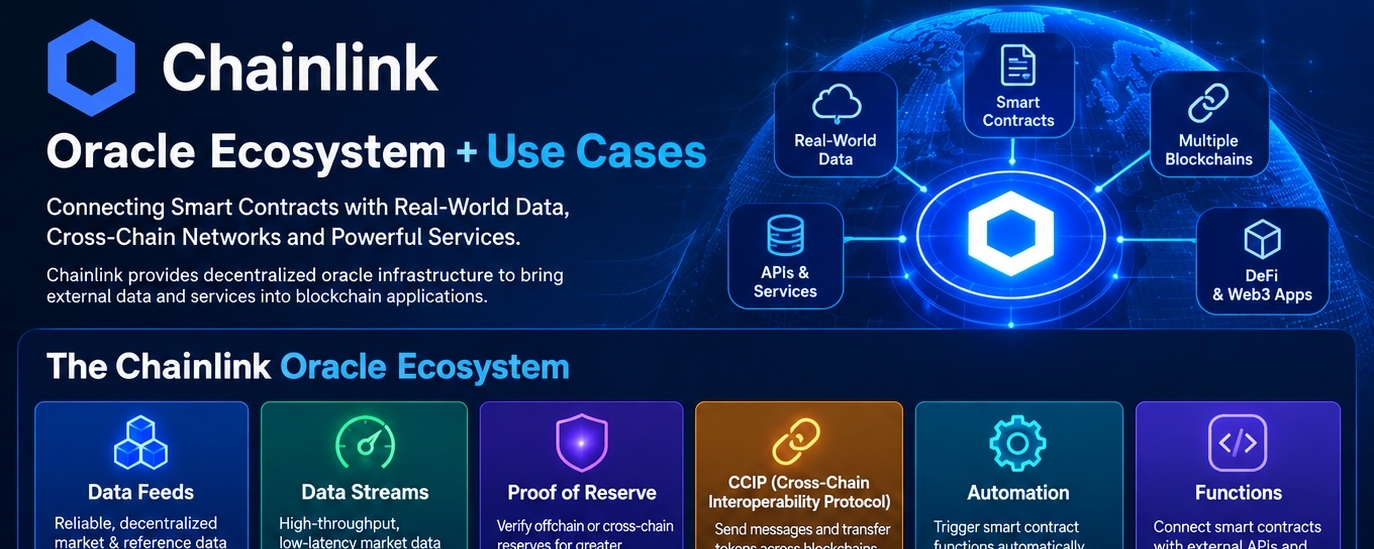
Blockchain networks are excellent at executing rules through smart contracts, but they have a major limitation: smart contracts cannot natively access reliable external data. This is where Chainlink comes in.
Chainlink provides decentralized oracle infrastructure that can bring external data and services into blockchain applications and also help applications communicate across different blockchains. Its ecosystem now includes Data Feeds, Data Streams, Proof of Reserve, Automation, Functions, CCIP, and other infrastructure.
What Is a Blockchain Oracle?
An oracle acts as a bridge between a blockchain and information outside the blockchain.
For example, imagine a DeFi lending protocol needs the current ETH/USD price:
External market data → Chainlink oracle network → verified data → smart contract → lending protocol
Without an oracle, a smart contract cannot simply ask a traditional exchange or website for the latest price.
Chainlink Data Feeds aggregate data from multiple sources and make the resulting information available onchain. They are used for asset prices, reserve information, L2 sequencer health, and other data types.
Key Parts of the Chainlink Ecosystem
1. Chainlink Data Feeds
Data Feeds provide reference data to smart contracts.
A major use case is DeFi. Lending protocols can use price feeds to determine the value of collateral, while derivatives platforms can use market data to help calculate positions and settlements. Chainlink specifically cites applications such as Aave and GMX as users of its data infrastructure.
Common uses:
Crypto prices
Forex and financial reference data
Commodity and other market data
RWA pricing
Lending and borrowing
Derivatives
Stablecoin applications
2. Chainlink Data Streams
Data Streams are designed for applications requiring high-throughput and low-latency market data.
This can be particularly relevant to perpetuals, options, and other time-sensitive DeFi markets where rapidly updated information can matter.
3. Proof of Reserve
Proof of Reserve helps smart contracts verify information about offchain or cross-chain reserves backing onchain assets.
For example, a tokenized asset or stablecoin can use reserve information to provide greater transparency around its backing.
Potential applications include:
Stablecoins
Tokenized commodities
Tokenized funds
Cross-chain assets
Other reserve-backed assets
4. Chainlink CCIP
CCIP (Cross-Chain Interoperability Protocol) allows applications to send messages and transfer tokens across supported blockchains.
Developers can use it for:
Cross-chain token transfers
Cross-chain lending
Cross-chain DeFi
Moving liquidity between networks
Cross-chain application workflows
CCIP can transfer data, tokens, or both together, allowing more complex cross-chain applications.
5. Chainlink Automation
Smart contracts sometimes need transactions to be triggered automatically.
Chainlink Automation can help execute predefined functions without requiring a user to manually initiate every transaction.
Examples include:
Automated liquidations
Interest accrual
Reward distribution
Protocol maintenance
Recurring smart-contract functions
6. Chainlink Functions
Chainlink Functions allows smart contracts to connect with external APIs and offchain computation.
This opens possibilities beyond simple price feeds, allowing developers to bring information from external systems into blockchain applications.
Major Chainlink Use Cases
Sector Example Use
DeFi Prices, lending, borrowing, derivatives
Stablecoins Reserve verification and pricing
RWA NAV, reserves, asset data
Gaming Verifiable randomness
Insurance Weather and real-world event data
Cross-chain Token and message transfers
Payments Blockchain-based settlement
Capital markets Tokenized securities and funds
Automation Automated protocol operations
Chainlink also identifies insurance, gaming, tokenized assets, payments, banking, and capital markets among the broader areas enabled by its infrastructure.
Why the Oracle Ecosystem Matters
The importance of Chainlink is not limited to providing cryptocurrency prices.
As blockchain applications become more sophisticated, they need access to accurate external information, cross-chain communication, automation, and verification mechanisms.
For example, a tokenized fund could require:
Market data → NAV information → reserve verification → cross-chain transfer → automated settlement
Different Chainlink services can support different parts of such workflows. Chainlink describes this broader direction as infrastructure for tokenization and institutional blockchain applications.
Final Thoughts
Chainlink's oracle ecosystem addresses one of blockchain's fundamental challenges: connecting deterministic smart contracts with external information and other blockchain networks.
Its ecosystem extends beyond traditional price oracles into Data Feeds, Data Streams, Proof of Reserve, Automation, Functions, and CCIP. These services can support applications ranging from DeFi and stablecoins to tokenized real-world assets and cross-chain systems.
As more financial assets and real-world processes move onchain, oracle and interoperability infrastructure cae an increasingly important part of the blockchain ecosystem.#Chainlink #Web3
The Importance of Technology in Modern Life
Chainlink Oracle Ecosystem: How It Connects Blockchain to the Real World
Blockchain networks are excellent at executing rules through smart contracts, but they have a major limitation: smart contracts cannot natively access reliable external data. This is where Chainlink comes in.
Chainlink provides decentralized oracle infrastructure that can bring external data and services into blockchain applications and also help applications communicate across different blockchains. Its ecosystem now includes Data Feeds, Data Streams, Proof of Reserve, Automation, Functions, CCIP, and other infrastructure.
What Is a Blockchain Oracle?
An oracle acts as a bridge between a blockchain and information outside the blockchain.
For example, imagine a DeFi lending protocol needs the current ETH/USD price:
External market data → Chainlink oracle network → verified data → smart contract → lending protocol
Without an oracle, a smart contract cannot simply ask a traditional exchange or website for the latest price.
Chainlink Data Feeds aggregate data from multiple sources and make the resulting information available onchain. They are used for asset prices, reserve information, L2 sequencer health, and other data types.
Key Parts of the Chainlink Ecosystem
1. Chainlink Data Feeds
Data Feeds provide reference data to smart contracts.
A major use case is DeFi. Lending protocols can use price feeds to determine the value of collateral, while derivatives platforms can use market data to help calculate positions and settlements. Chainlink specifically cites applications such as Aave and GMX as users of its data infrastructure.
Common uses:
Crypto prices
Forex and financial reference data
Commodity and other market data
RWA pricing
Lending and borrowing
Derivatives
Stablecoin applications
2. Chainlink Data Streams
Data Streams are designed for applications requiring high-throughput and low-latency market data.
This can be particularly relevant to perpetuals, options, and other time-sensitive DeFi markets where rapidly updated information can matter.
3. Proof of Reserve
Proof of Reserve helps smart contracts verify information about offchain or cross-chain reserves backing onchain assets.
For example, a tokenized asset or stablecoin can use reserve information to provide greater transparency around its backing.
Potential applications include:
Stablecoins
Tokenized commodities
Tokenized funds
Cross-chain assets
Other reserve-backed assets
4. Chainlink CCIP
CCIP (Cross-Chain Interoperability Protocol) allows applications to send messages and transfer tokens across supported blockchains.
Developers can use it for:
Cross-chain token transfers
Cross-chain lending
Cross-chain DeFi
Moving liquidity between networks
Cross-chain application workflows
CCIP can transfer data, tokens, or both together, allowing more complex cross-chain applications.
5. Chainlink Automation
Smart contracts sometimes need transactions to be triggered automatically.
Chainlink Automation can help execute predefined functions without requiring a user to manually initiate every transaction.
Examples include:
Automated liquidations
Interest accrual
Reward distribution
Protocol maintenance
Recurring smart-contract functions
6. Chainlink Functions
Chainlink Functions allows smart contracts to connect with external APIs and offchain computation.
This opens possibilities beyond simple price feeds, allowing developers to bring information from external systems into blockchain applications.
Major Chainlink Use Cases
Sector Example Use
DeFi Prices, lending, borrowing, derivatives
Stablecoins Reserve verification and pricing
RWA NAV, reserves, asset data
Gaming Verifiable randomness
Insurance Weather and real-world event data
Cross-chain Token and message transfers
Payments Blockchain-based settlement
Capital markets Tokenized securities and funds
Automation Automated protocol operations
Chainlink also identifies insurance, gaming, tokenized assets, payments, banking, and capital markets among the broader areas enabled by its infrastructure.
Why the Oracle Ecosystem Matters
The importance of Chainlink is not limited to providing cryptocurrency prices.
As blockchain applications become more sophisticated, they need access to accurate external information, cross-chain communication, automation, and verification mechanisms.
For example, a tokenized fund could require:
Market data → NAV information → reserve verification → cross-chain transfer → automated settlement
Different Chainlink services can support different parts of such workflows. Chainlink describes this broader direction as infrastructure for tokenization and institutional blockchain applications.
Final Thoughts
Chainlink's oracle ecosystem addresses one of blockchain's fundamental challenges: connecting deterministic smart contracts with external information and other blockchain networks.
Its ecosystem extends beyond traditional price oracles into Data Feeds, Data Streams, Proof of Reserve, Automation, Functions, and CCIP. These services can support applications ranging from DeFi and stablecoins to tokenized real-world assets and cross-chain systems.
As more financial assets and real-world processes move onchain, oracle and interoperability infrastructure cae an increasingly important part of the blockchain ecosystem.#Chainlink #Web3
Blockchain networks are excellent at executing rules through smart contracts, but they have a major limitation: smart contracts cannot natively access reliable external data. This is where Chainlink comes in.
Chainlink provides decentralized oracle infrastructure that can bring external data and services into blockchain applications and also help applications communicate across different blockchains. Its ecosystem now includes Data Feeds, Data Streams, Proof of Reserve, Automation, Functions, CCIP, and other infrastructure.
What Is a Blockchain Oracle?
An oracle acts as a bridge between a blockchain and information outside the blockchain.
For example, imagine a DeFi lending protocol needs the current ETH/USD price:
External market data → Chainlink oracle network → verified data → smart contract → lending protocol
Without an oracle, a smart contract cannot simply ask a traditional exchange or website for the latest price.
Chainlink Data Feeds aggregate data from multiple sources and make the resulting information available onchain. They are used for asset prices, reserve information, L2 sequencer health, and other data types.
Key Parts of the Chainlink Ecosystem
1. Chainlink Data Feeds
Data Feeds provide reference data to smart contracts.
A major use case is DeFi. Lending protocols can use price feeds to determine the value of collateral, while derivatives platforms can use market data to help calculate positions and settlements. Chainlink specifically cites applications such as Aave and GMX as users of its data infrastructure.
Common uses:
Crypto prices
Forex and financial reference data
Commodity and other market data
RWA pricing
Lending and borrowing
Derivatives
Stablecoin applications
2. Chainlink Data Streams
Data Streams are designed for applications requiring high-throughput and low-latency market data.
This can be particularly relevant to perpetuals, options, and other time-sensitive DeFi markets where rapidly updated information can matter.
3. Proof of Reserve
Proof of Reserve helps smart contracts verify information about offchain or cross-chain reserves backing onchain assets.
For example, a tokenized asset or stablecoin can use reserve information to provide greater transparency around its backing.
Potential applications include:
Stablecoins
Tokenized commodities
Tokenized funds
Cross-chain assets
Other reserve-backed assets
4. Chainlink CCIP
CCIP (Cross-Chain Interoperability Protocol) allows applications to send messages and transfer tokens across supported blockchains.
Developers can use it for:
Cross-chain token transfers
Cross-chain lending
Cross-chain DeFi
Moving liquidity between networks
Cross-chain application workflows
CCIP can transfer data, tokens, or both together, allowing more complex cross-chain applications.
5. Chainlink Automation
Smart contracts sometimes need transactions to be triggered automatically.
Chainlink Automation can help execute predefined functions without requiring a user to manually initiate every transaction.
Examples include:
Automated liquidations
Interest accrual
Reward distribution
Protocol maintenance
Recurring smart-contract functions
6. Chainlink Functions
Chainlink Functions allows smart contracts to connect with external APIs and offchain computation.
This opens possibilities beyond simple price feeds, allowing developers to bring information from external systems into blockchain applications.
Major Chainlink Use Cases
Sector Example Use
DeFi Prices, lending, borrowing, derivatives
Stablecoins Reserve verification and pricing
RWA NAV, reserves, asset data
Gaming Verifiable randomness
Insurance Weather and real-world event data
Cross-chain Token and message transfers
Payments Blockchain-based settlement
Capital markets Tokenized securities and funds
Automation Automated protocol operations
Chainlink also identifies insurance, gaming, tokenized assets, payments, banking, and capital markets among the broader areas enabled by its infrastructure.
Why the Oracle Ecosystem Matters
The importance of Chainlink is not limited to providing cryptocurrency prices.
As blockchain applications become more sophisticated, they need access to accurate external information, cross-chain communication, automation, and verification mechanisms.
For example, a tokenized fund could require:
Market data → NAV information → reserve verification → cross-chain transfer → automated settlement
Different Chainlink services can support different parts of such workflows. Chainlink describes this broader direction as infrastructure for tokenization and institutional blockchain applications.
Final Thoughts
Chainlink's oracle ecosystem addresses one of blockchain's fundamental challenges: connecting deterministic smart contracts with external information and other blockchain networks.
Its ecosystem extends beyond traditional price oracles into Data Feeds, Data Streams, Proof of Reserve, Automation, Functions, and CCIP. These services can support applications ranging from DeFi and stablecoins to tokenized real-world assets and cross-chain systems.
As more financial assets and real-world processes move onchain, oracle and interoperability infrastructure cae an increasingly important part of the blockchain ecosystem.#Chainlink #Web3
55
·
--
Week 1 Crypto Learning Recap
This week, I focused on four major crypto assets and the lessons they can teach:
₿ BTC — Bitcoin
The original cryptocurrency and a key example of scarcity, decentralization, and long-term market adoption.
♦️ ETH — Ethereum
More than a cryptocurrency—Ethereum provides infrastructure for smart contracts and decentralized applications.
🐕 DOGE — Dogecoin
A strong example of how community, culture, and attention can influence a crypto asset’s popularity.
🐸 PEPE — Pepe
A meme-coin case study showing how narratives, social attention, liquidity, and market sentiment can drive price movements.
🔑 Biggest Lessons From Week 1
1️⃣ Understand the narrative behind an asset.
2️⃣ Check volume and liquidity before trading.
3️⃣ Don't rely on price movement alone—study market context.
4️⃣ Risk management is more important than chasing quick profits.
5️⃣ Always do your own research (DYOR).
📌 Week 1 takeaway:
Crypto isn't just about finding the next coin that could move. It's about understanding technology, narrative, market behavior, and risk.
What crypto topic should I study in Week 2? 👇
#bitcoin #Ethereum✅ #Dogecoin #RiskManagement
Week 1 Crypto Learning Recap
This week, I focused on four major crypto assets and the lessons they can teach:
₿ BTC — Bitcoin
The original cryptocurrency and a key example of scarcity, decentralization, and long-term market adoption.
♦️ ETH — Ethereum
More than a cryptocurrency—Ethereum provides infrastructure for smart contracts and decentralized applications.
🐕 DOGE — Dogecoin
A strong example of how community, culture, and attention can influence a crypto asset’s popularity.
🐸 PEPE — Pepe
A meme-coin case study showing how narratives, social attention, liquidity, and market sentiment can drive price movements.
🔑 Biggest Lessons From Week 1
1️⃣ Understand the narrative behind an asset.
2️⃣ Check volume and liquidity before trading.
3️⃣ Don't rely on price movement alone—study market context.
4️⃣ Risk management is more important than chasing quick profits.
5️⃣ Always do your own research (DYOR).
📌 Week 1 takeaway:
Crypto isn't just about finding the next coin that could move. It's about understanding technology, narrative, market behavior, and risk.
What crypto topic should I study in Week 2? 👇
#bitcoin #Ethereum✅ #Dogecoin #RiskManagement
This week, I focused on four major crypto assets and the lessons they can teach:
₿ BTC — Bitcoin
The original cryptocurrency and a key example of scarcity, decentralization, and long-term market adoption.
♦️ ETH — Ethereum
More than a cryptocurrency—Ethereum provides infrastructure for smart contracts and decentralized applications.
🐕 DOGE — Dogecoin
A strong example of how community, culture, and attention can influence a crypto asset’s popularity.
🐸 PEPE — Pepe
A meme-coin case study showing how narratives, social attention, liquidity, and market sentiment can drive price movements.
🔑 Biggest Lessons From Week 1
1️⃣ Understand the narrative behind an asset.
2️⃣ Check volume and liquidity before trading.
3️⃣ Don't rely on price movement alone—study market context.
4️⃣ Risk management is more important than chasing quick profits.
5️⃣ Always do your own research (DYOR).
📌 Week 1 takeaway:
Crypto isn't just about finding the next coin that could move. It's about understanding technology, narrative, market behavior, and risk.
What crypto topic should I study in Week 2? 👇
#bitcoin #Ethereum✅ #Dogecoin #RiskManagement
108
·
--
Risk Management: The Most Important Trading Skill
Making profits is important—but protecting your capital comes first.
Here are 5 simple risk-management rules for crypto trading:
1️⃣ Risk only 1–2% per trade
Don’t put your entire portfolio at risk on one position.
2️⃣ Always use a Stop-Loss
Know your maximum acceptable loss before entering a trade.
3️⃣ Use proper position sizing
Adjust your position size according to your stop-loss distance and risk level.
4️⃣ Avoid emotional trading
After a losing trade, don’t immediately increase your position to recover the loss.
5️⃣ Have a clear trading plan
Define your entry, stop-loss, take-profit, and maximum daily loss before trading.
💡 Remember: A good trader focuses not only on how much they can make, but also on how much they can afford to lose.
What’s your #1 risk-management rule? 👇
#RiskManagement #CryptoTrading #TradingTips
#MicronBeatsEarningsLiftsGuidance #AltcoinSeasonIndexHoldsAbove60For5Days #USADPAdds90000JobsInSeptember
Risk Management: The Most Important Trading Skill
Making profits is important—but protecting your capital comes first.
Here are 5 simple risk-management rules for crypto trading:
1️⃣ Risk only 1–2% per trade
Don’t put your entire portfolio at risk on one position.
2️⃣ Always use a Stop-Loss
Know your maximum acceptable loss before entering a trade.
3️⃣ Use proper position sizing
Adjust your position size according to your stop-loss distance and risk level.
4️⃣ Avoid emotional trading
After a losing trade, don’t immediately increase your position to recover the loss.
5️⃣ Have a clear trading plan
Define your entry, stop-loss, take-profit, and maximum daily loss before trading.
💡 Remember: A good trader focuses not only on how much they can make, but also on how much they can afford to lose.
What’s your #1 risk-management rule? 👇
#RiskManagement #CryptoTrading #TradingTips
#MicronBeatsEarningsLiftsGuidance #AltcoinSeasonIndexHoldsAbove60For5Days #USADPAdds90000JobsInSeptember
Making profits is important—but protecting your capital comes first.
Here are 5 simple risk-management rules for crypto trading:
1️⃣ Risk only 1–2% per trade
Don’t put your entire portfolio at risk on one position.
2️⃣ Always use a Stop-Loss
Know your maximum acceptable loss before entering a trade.
3️⃣ Use proper position sizing
Adjust your position size according to your stop-loss distance and risk level.
4️⃣ Avoid emotional trading
After a losing trade, don’t immediately increase your position to recover the loss.
5️⃣ Have a clear trading plan
Define your entry, stop-loss, take-profit, and maximum daily loss before trading.
💡 Remember: A good trader focuses not only on how much they can make, but also on how much they can afford to lose.
What’s your #1 risk-management rule? 👇
#RiskManagement #CryptoTrading #TradingTips
#MicronBeatsEarningsLiftsGuidance #AltcoinSeasonIndexHoldsAbove60For5Days #USADPAdds90000JobsInSeptember
75
·
--
Мақала
On-Chain Analysis: How Blockchain Data Helps You Understand the Crypto MarketCrypto Education • Blockchain • Market Analysis
Introduction
The cryptocurrency market moves quickly. Bitcoin, Ethereum, and other digital assets can experience significant price changes within a short period. Many traders rely on price charts, technical indicators, and market news to understand these movements. However, another valuable source of information is available directly on the blockchain: on-chain analysis.
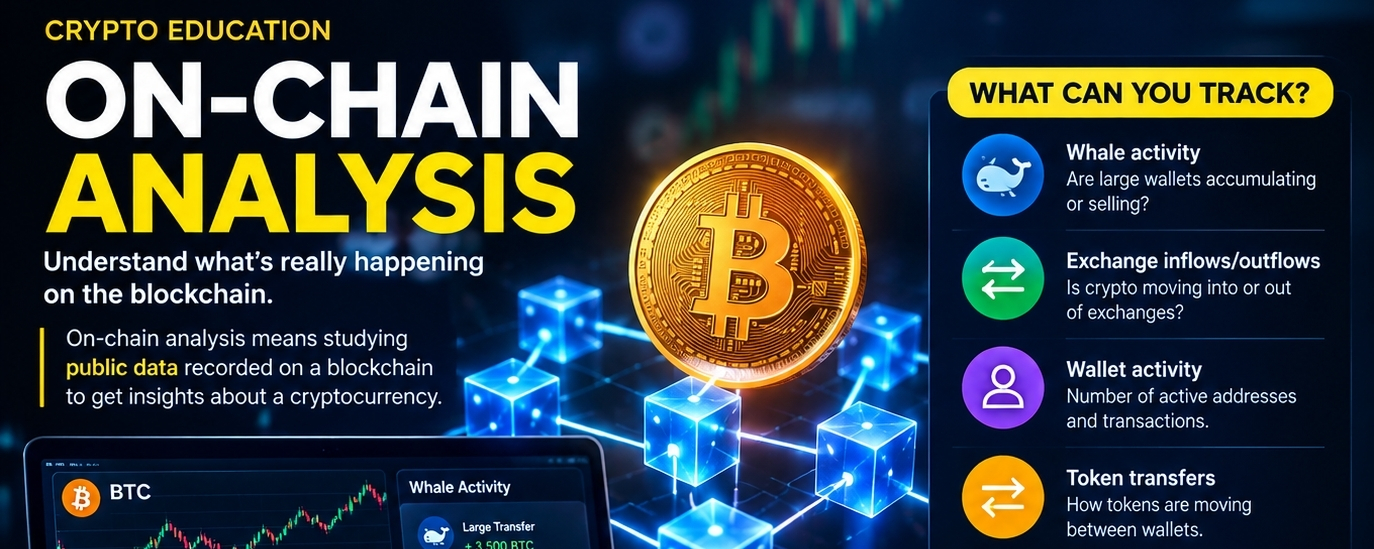
On-chain analysis involves examining publicly available blockchain data to understand how cryptocurrencies are being transferred, held, and used. It can help investors and researchers identify market activity, monitor large transactions, and study changes in network usage.
Unlike traditional technical analysis, which primarily focuses on price and trading volume, on-chain analysis examines activity recorded on the blockchain itself.
In this article, we will explore how on-chain analysis works, which metrics matter, and how beginners can use blockchain data to understand the cryptocurrency market.
1. What Is On-Chain Analysis?
On-chain analysis is the process of studying data recorded on a blockchain to identify patterns and understand network activity.
Every blockchain transaction creates a record. Depending on the blockchain, publicly accessible information may include:
Transaction amounts and timestamps
Wallet addresses involved in transactions
Transfers between wallets
Network transaction fees
Active addresses and transaction counts
Token supply and distribution information
By analyzing this information over time, researchers can develop a clearer picture of how a blockchain is being used.
For example, if a large amount of Bitcoin moves from an exchange to a private wallet, an analyst may investigate whether the movement is part of a broader trend in exchange balances.
However, a transaction alone does not reveal the owner's intentions. On-chain data provides evidence of activity, not a guaranteed prediction of future prices.
2. Key On-Chain Metrics to Understand
A. Whale Activity
Whales are individuals or entities that hold or control large amounts of a cryptocurrency.
Monitoring large transactions can help analysts understand how significant holders are moving their assets.
For example, a large Bitcoin transfer may involve:
Moving funds between personal wallets
Depositing cryptocurrency into an exchange
Withdrawing cryptocurrency from an exchange
Transferring assets between institutional accounts
The context matters. A large transaction should not automatically be interpreted as buying or selling pressure.
B. Exchange Inflows and Outflows
Exchange flow data tracks cryptocurrency moving into and out of centralized exchanges.
Exchange inflows: Cryptocurrency is transferred to exchange addresses. This may indicate that assets are being positioned for trading, selling, or other exchange-related activity.
Exchange outflows: Cryptocurrency is transferred away from exchange addresses. This may reflect withdrawals to private wallets, custody services, or other destinations.
For example, sustained Bitcoin outflows may indicate that some holders are moving their assets away from exchanges. However, outflows do not necessarily mean that investors intend to hold for the long term.
C. Active Addresses
Active addresses measure the number of blockchain addresses participating in transactions during a specific period.
An increase in active addresses may indicate greater network participation.
Analysts can compare active addresses with transaction counts, fees, and price movements to investigate whether network usage is changing.
One important limitation is that a single person or organization can control multiple addresses. Therefore, active addresses should not be treated as a direct count of individual users.
D. Transaction Volume
Transaction volume measures the amount of cryptocurrency transferred across a network during a given period.
Higher transaction activity may reflect increased usage, trading-related transfers, or other economic activity.
However, raw transaction volume can be affected by exchange operations, automated transfers, and internal wallet movements. Adjusted metrics and contextual analysis can help make the data more meaningful.
E. Supply Distribution
Supply distribution examines how cryptocurrency holdings are spread across addresses or groups of holders.
This can help analysts investigate concentration, changes in large-holder balances, and the distribution of tokens across a network.
For example, if a small number of addresses control a substantial portion of a token's supply, the asset may have greater concentration risk.
Address balances must be interpreted carefully because exchange wallets and custodial addresses can represent assets belonging to many different customers.
3. How On-Chain Analysis Can Help Bitcoin Investors
Bitcoin is one of the most widely analyzed blockchain networks.
Investors and researchers can use Bitcoin on-chain data to investigate several market questions.
Are exchange balances changing?
Changes in exchange-held Bitcoin can provide insight into the amount of BTC held at identified exchange addresses.
Are large holders changing their positions?
Wallet balance changes may reveal accumulation or distribution patterns, although wallet ownership and intentions are not always known.
Is network activity increasing?
Transaction counts, active addresses, and fees can help show whether Bitcoin's on-chain usage is changing.
Does network activity support the current market narrative?
Analysts can compare on-chain indicators with price action and trading volume to identify agreement or disagreement between different data sources.
The goal is not to predict every price movement. It is to develop a more complete understanding of market conditions.
4. On-Chain Analysis vs. Technical Analysis
Feature
On-Chain Analysis
Technical Analysis
Primary data
Blockchain activity
Price and trading data
Common metrics
Exchange flows, active addresses, wallet balances
RSI, MACD, support and resistance
Main purpose
Understand network and wallet activity
Study price patterns and momentum
Key limitation
Wallet ownership and intent may be unclear
Historical patterns may not repeat
These approaches can complement each other.
For example, a trader might identify a Bitcoin support level on a price chart and then examine exchange flows, network activity, and large-wallet movements for additional context.
Neither method guarantees a profitable trade.
5. Useful Tools for On-Chain Research
Beginners can explore blockchain data through several analytics platforms.
Glassnode
— Provides on-chain metrics and cryptocurrency market research.
CryptoQuant
— Offers exchange-flow data, market indicators, and blockchain analytics.
Dune
— Enables users to explore blockchain data through dashboards and queries.
Etherscan
— Allows users to inspect Ethereum transactions, addresses, tokens, and smart contracts.
Blockchain.com Explorer
— Provides tools to explore Bitcoin transactions and blockchain records.
Some platforms offer free features, while advanced metrics and historical datasets may require a paid subscription.
6. A Simple On-Chain Analysis Workflow
Beginners can follow a structured process before forming a market view.
Step 1: Select a cryptocurrency. Start with Bitcoin or Ethereum.
Step 2: Check network activity. Review transaction counts, active addresses, and transaction fees.
Step 3: Examine exchange flows. Look for meaningful changes over time rather than relying on a single transaction.
Step 4: Investigate large-wallet movements. Check whether transfers involve exchanges, known custodians, or other identified entities.
Step 5: Compare the data with price action. Review price trends, trading volume, and important support and resistance levels.
Step 6: Consider alternative explanations. A transfer may reflect routine wallet management rather than a market decision.
Step 7: Manage risk. Treat the analysis as one input into a broader decision-making process.
7. Limitations and Risks of On-Chain Analysis
Although on-chain analysis is valuable, it has important limitations.
First, blockchain addresses do not always reveal the real-world identity of their owners. Attributing a wallet to an individual or organization can be difficult.
Second, large transfers can be misleading. Exchanges frequently move assets between their own wallets, and custodians may manage funds for many clients.
Third, blockchain data does not capture every aspect of the market. Centralized exchange order books, derivatives, macroeconomic developments, and investor sentiment can also influence cryptocurrency prices.
Finally, different analytics providers may use different methodologies to classify wallets, estimate exchange balances, or calculate metrics.
For these reasons, analysts should compare multiple data sources and avoid making decisions based on a single indicator.
Conclusion
On-chain analysis offers a way to look beyond cryptocurrency price charts and investigate the activity taking place directly on a blockchain.
By studying whale movements, exchange inflows and outflows, active addresses, transaction volume, and supply distribution, investors can develop a deeper understanding of crypto market behavior.
The most useful approach combines on-chain data with technical analysis, market news, and risk management.
Remember: blockchain data can reveal what happened, but it cannot always explain why it happened or predict what comes next.
As the cryptocurrency ecosystem evolves, learning to interpret on-chain metrics can be a valuable skill for anyone interested in blockchain technology and digital asset research.
Key Takeaway
On-chain analysis transforms blockchain records into useful insights. The objective is to understand network activity, evaluate market behavior, and make informed decisions—not to treat individual transactions as guaranteed trading signals.
Disclaimer: This article is for educational and informational purposes only. It is not financial or investment advice. Cryptocurrency markets are volatile, and on-chain indicators do not guarantee future price movements.
Suggested tags: On-Chain Analysis · Bitcoin · Blockchain · Crypto Education · Cryptocurrency · Web3#Web3 #bitcoin #altcoin
On-Chain Analysis: How Blockchain Data Helps You Understand the Crypto Market
Crypto Education • Blockchain • Market Analysis
Introduction
The cryptocurrency market moves quickly. Bitcoin, Ethereum, and other digital assets can experience significant price changes within a short period. Many traders rely on price charts, technical indicators, and market news to understand these movements. However, another valuable source of information is available directly on the blockchain: on-chain analysis.
On-chain analysis involves examining publicly available blockchain data to understand how cryptocurrencies are being transferred, held, and used. It can help investors and researchers identify market activity, monitor large transactions, and study changes in network usage.
Unlike traditional technical analysis, which primarily focuses on price and trading volume, on-chain analysis examines activity recorded on the blockchain itself.
In this article, we will explore how on-chain analysis works, which metrics matter, and how beginners can use blockchain data to understand the cryptocurrency market.
1. What Is On-Chain Analysis?
On-chain analysis is the process of studying data recorded on a blockchain to identify patterns and understand network activity.
Every blockchain transaction creates a record. Depending on the blockchain, publicly accessible information may include:
Transaction amounts and timestamps
Wallet addresses involved in transactions
Transfers between wallets
Network transaction fees
Active addresses and transaction counts
Token supply and distribution information
By analyzing this information over time, researchers can develop a clearer picture of how a blockchain is being used.
For example, if a large amount of Bitcoin moves from an exchange to a private wallet, an analyst may investigate whether the movement is part of a broader trend in exchange balances.
However, a transaction alone does not reveal the owner's intentions. On-chain data provides evidence of activity, not a guaranteed prediction of future prices.
2. Key On-Chain Metrics to Understand
A. Whale Activity
Whales are individuals or entities that hold or control large amounts of a cryptocurrency.
Monitoring large transactions can help analysts understand how significant holders are moving their assets.
For example, a large Bitcoin transfer may involve:
Moving funds between personal wallets
Depositing cryptocurrency into an exchange
Withdrawing cryptocurrency from an exchange
Transferring assets between institutional accounts
The context matters. A large transaction should not automatically be interpreted as buying or selling pressure.
B. Exchange Inflows and Outflows
Exchange flow data tracks cryptocurrency moving into and out of centralized exchanges.
Exchange inflows: Cryptocurrency is transferred to exchange addresses. This may indicate that assets are being positioned for trading, selling, or other exchange-related activity.
Exchange outflows: Cryptocurrency is transferred away from exchange addresses. This may reflect withdrawals to private wallets, custody services, or other destinations.
For example, sustained Bitcoin outflows may indicate that some holders are moving their assets away from exchanges. However, outflows do not necessarily mean that investors intend to hold for the long term.
C. Active Addresses
Active addresses measure the number of blockchain addresses participating in transactions during a specific period.
An increase in active addresses may indicate greater network participation.
Analysts can compare active addresses with transaction counts, fees, and price movements to investigate whether network usage is changing.
One important limitation is that a single person or organization can control multiple addresses. Therefore, active addresses should not be treated as a direct count of individual users.
D. Transaction Volume
Transaction volume measures the amount of cryptocurrency transferred across a network during a given period.
Higher transaction activity may reflect increased usage, trading-related transfers, or other economic activity.
However, raw transaction volume can be affected by exchange operations, automated transfers, and internal wallet movements. Adjusted metrics and contextual analysis can help make the data more meaningful.
E. Supply Distribution
Supply distribution examines how cryptocurrency holdings are spread across addresses or groups of holders.
This can help analysts investigate concentration, changes in large-holder balances, and the distribution of tokens across a network.
For example, if a small number of addresses control a substantial portion of a token's supply, the asset may have greater concentration risk.
Address balances must be interpreted carefully because exchange wallets and custodial addresses can represent assets belonging to many different customers.
3. How On-Chain Analysis Can Help Bitcoin Investors
Bitcoin is one of the most widely analyzed blockchain networks.
Investors and researchers can use Bitcoin on-chain data to investigate several market questions.
Are exchange balances changing?
Changes in exchange-held Bitcoin can provide insight into the amount of BTC held at identified exchange addresses.
Are large holders changing their positions?
Wallet balance changes may reveal accumulation or distribution patterns, although wallet ownership and intentions are not always known.
Is network activity increasing?
Transaction counts, active addresses, and fees can help show whether Bitcoin's on-chain usage is changing.
Does network activity support the current market narrative?
Analysts can compare on-chain indicators with price action and trading volume to identify agreement or disagreement between different data sources.
The goal is not to predict every price movement. It is to develop a more complete understanding of market conditions.
4. On-Chain Analysis vs. Technical Analysis
Feature
On-Chain Analysis
Technical Analysis
Primary data
Blockchain activity
Price and trading data
Common metrics
Exchange flows, active addresses, wallet balances
RSI, MACD, support and resistance
Main purpose
Understand network and wallet activity
Study price patterns and momentum
Key limitation
Wallet ownership and intent may be unclear
Historical patterns may not repeat
These approaches can complement each other.
For example, a trader might identify a Bitcoin support level on a price chart and then examine exchange flows, network activity, and large-wallet movements for additional context.
Neither method guarantees a profitable trade.
5. Useful Tools for On-Chain Research
Beginners can explore blockchain data through several analytics platforms.
Glassnode
— Provides on-chain metrics and cryptocurrency market research.
CryptoQuant
— Offers exchange-flow data, market indicators, and blockchain analytics.
Dune
— Enables users to explore blockchain data through dashboards and queries.
Etherscan
— Allows users to inspect Ethereum transactions, addresses, tokens, and smart contracts.
Blockchain.com Explorer
— Provides tools to explore Bitcoin transactions and blockchain records.
Some platforms offer free features, while advanced metrics and historical datasets may require a paid subscription.
6. A Simple On-Chain Analysis Workflow
Beginners can follow a structured process before forming a market view.
Step 1: Select a cryptocurrency. Start with Bitcoin or Ethereum.
Step 2: Check network activity. Review transaction counts, active addresses, and transaction fees.
Step 3: Examine exchange flows. Look for meaningful changes over time rather than relying on a single transaction.
Step 4: Investigate large-wallet movements. Check whether transfers involve exchanges, known custodians, or other identified entities.
Step 5: Compare the data with price action. Review price trends, trading volume, and important support and resistance levels.
Step 6: Consider alternative explanations. A transfer may reflect routine wallet management rather than a market decision.
Step 7: Manage risk. Treat the analysis as one input into a broader decision-making process.
7. Limitations and Risks of On-Chain Analysis
Although on-chain analysis is valuable, it has important limitations.
First, blockchain addresses do not always reveal the real-world identity of their owners. Attributing a wallet to an individual or organization can be difficult.
Second, large transfers can be misleading. Exchanges frequently move assets between their own wallets, and custodians may manage funds for many clients.
Third, blockchain data does not capture every aspect of the market. Centralized exchange order books, derivatives, macroeconomic developments, and investor sentiment can also influence cryptocurrency prices.
Finally, different analytics providers may use different methodologies to classify wallets, estimate exchange balances, or calculate metrics.
For these reasons, analysts should compare multiple data sources and avoid making decisions based on a single indicator.
Conclusion
On-chain analysis offers a way to look beyond cryptocurrency price charts and investigate the activity taking place directly on a blockchain.
By studying whale movements, exchange inflows and outflows, active addresses, transaction volume, and supply distribution, investors can develop a deeper understanding of crypto market behavior.
The most useful approach combines on-chain data with technical analysis, market news, and risk management.
Remember: blockchain data can reveal what happened, but it cannot always explain why it happened or predict what comes next.
As the cryptocurrency ecosystem evolves, learning to interpret on-chain metrics can be a valuable skill for anyone interested in blockchain technology and digital asset research.
Key Takeaway
On-chain analysis transforms blockchain records into useful insights. The objective is to understand network activity, evaluate market behavior, and make informed decisions—not to treat individual transactions as guaranteed trading signals.
Disclaimer: This article is for educational and informational purposes only. It is not financial or investment advice. Cryptocurrency markets are volatile, and on-chain indicators do not guarantee future price movements.
Suggested tags: On-Chain Analysis · Bitcoin · Blockchain · Crypto Education · Cryptocurrency · Web3#Web3 #bitcoin #altcoin
Introduction
The cryptocurrency market moves quickly. Bitcoin, Ethereum, and other digital assets can experience significant price changes within a short period. Many traders rely on price charts, technical indicators, and market news to understand these movements. However, another valuable source of information is available directly on the blockchain: on-chain analysis.
On-chain analysis involves examining publicly available blockchain data to understand how cryptocurrencies are being transferred, held, and used. It can help investors and researchers identify market activity, monitor large transactions, and study changes in network usage.
Unlike traditional technical analysis, which primarily focuses on price and trading volume, on-chain analysis examines activity recorded on the blockchain itself.
In this article, we will explore how on-chain analysis works, which metrics matter, and how beginners can use blockchain data to understand the cryptocurrency market.
1. What Is On-Chain Analysis?
On-chain analysis is the process of studying data recorded on a blockchain to identify patterns and understand network activity.
Every blockchain transaction creates a record. Depending on the blockchain, publicly accessible information may include:
Transaction amounts and timestamps
Wallet addresses involved in transactions
Transfers between wallets
Network transaction fees
Active addresses and transaction counts
Token supply and distribution information
By analyzing this information over time, researchers can develop a clearer picture of how a blockchain is being used.
For example, if a large amount of Bitcoin moves from an exchange to a private wallet, an analyst may investigate whether the movement is part of a broader trend in exchange balances.
However, a transaction alone does not reveal the owner's intentions. On-chain data provides evidence of activity, not a guaranteed prediction of future prices.
2. Key On-Chain Metrics to Understand
A. Whale Activity
Whales are individuals or entities that hold or control large amounts of a cryptocurrency.
Monitoring large transactions can help analysts understand how significant holders are moving their assets.
For example, a large Bitcoin transfer may involve:
Moving funds between personal wallets
Depositing cryptocurrency into an exchange
Withdrawing cryptocurrency from an exchange
Transferring assets between institutional accounts
The context matters. A large transaction should not automatically be interpreted as buying or selling pressure.
B. Exchange Inflows and Outflows
Exchange flow data tracks cryptocurrency moving into and out of centralized exchanges.
Exchange inflows: Cryptocurrency is transferred to exchange addresses. This may indicate that assets are being positioned for trading, selling, or other exchange-related activity.
Exchange outflows: Cryptocurrency is transferred away from exchange addresses. This may reflect withdrawals to private wallets, custody services, or other destinations.
For example, sustained Bitcoin outflows may indicate that some holders are moving their assets away from exchanges. However, outflows do not necessarily mean that investors intend to hold for the long term.
C. Active Addresses
Active addresses measure the number of blockchain addresses participating in transactions during a specific period.
An increase in active addresses may indicate greater network participation.
Analysts can compare active addresses with transaction counts, fees, and price movements to investigate whether network usage is changing.
One important limitation is that a single person or organization can control multiple addresses. Therefore, active addresses should not be treated as a direct count of individual users.
D. Transaction Volume
Transaction volume measures the amount of cryptocurrency transferred across a network during a given period.
Higher transaction activity may reflect increased usage, trading-related transfers, or other economic activity.
However, raw transaction volume can be affected by exchange operations, automated transfers, and internal wallet movements. Adjusted metrics and contextual analysis can help make the data more meaningful.
E. Supply Distribution
Supply distribution examines how cryptocurrency holdings are spread across addresses or groups of holders.
This can help analysts investigate concentration, changes in large-holder balances, and the distribution of tokens across a network.
For example, if a small number of addresses control a substantial portion of a token's supply, the asset may have greater concentration risk.
Address balances must be interpreted carefully because exchange wallets and custodial addresses can represent assets belonging to many different customers.
3. How On-Chain Analysis Can Help Bitcoin Investors
Bitcoin is one of the most widely analyzed blockchain networks.
Investors and researchers can use Bitcoin on-chain data to investigate several market questions.
Are exchange balances changing?
Changes in exchange-held Bitcoin can provide insight into the amount of BTC held at identified exchange addresses.
Are large holders changing their positions?
Wallet balance changes may reveal accumulation or distribution patterns, although wallet ownership and intentions are not always known.
Is network activity increasing?
Transaction counts, active addresses, and fees can help show whether Bitcoin's on-chain usage is changing.
Does network activity support the current market narrative?
Analysts can compare on-chain indicators with price action and trading volume to identify agreement or disagreement between different data sources.
The goal is not to predict every price movement. It is to develop a more complete understanding of market conditions.
4. On-Chain Analysis vs. Technical Analysis
Feature
On-Chain Analysis
Technical Analysis
Primary data
Blockchain activity
Price and trading data
Common metrics
Exchange flows, active addresses, wallet balances
RSI, MACD, support and resistance
Main purpose
Understand network and wallet activity
Study price patterns and momentum
Key limitation
Wallet ownership and intent may be unclear
Historical patterns may not repeat
These approaches can complement each other.
For example, a trader might identify a Bitcoin support level on a price chart and then examine exchange flows, network activity, and large-wallet movements for additional context.
Neither method guarantees a profitable trade.
5. Useful Tools for On-Chain Research
Beginners can explore blockchain data through several analytics platforms.
Glassnode
— Provides on-chain metrics and cryptocurrency market research.
CryptoQuant
— Offers exchange-flow data, market indicators, and blockchain analytics.
Dune
— Enables users to explore blockchain data through dashboards and queries.
Etherscan
— Allows users to inspect Ethereum transactions, addresses, tokens, and smart contracts.
Blockchain.com Explorer
— Provides tools to explore Bitcoin transactions and blockchain records.
Some platforms offer free features, while advanced metrics and historical datasets may require a paid subscription.
6. A Simple On-Chain Analysis Workflow
Beginners can follow a structured process before forming a market view.
Step 1: Select a cryptocurrency. Start with Bitcoin or Ethereum.
Step 2: Check network activity. Review transaction counts, active addresses, and transaction fees.
Step 3: Examine exchange flows. Look for meaningful changes over time rather than relying on a single transaction.
Step 4: Investigate large-wallet movements. Check whether transfers involve exchanges, known custodians, or other identified entities.
Step 5: Compare the data with price action. Review price trends, trading volume, and important support and resistance levels.
Step 6: Consider alternative explanations. A transfer may reflect routine wallet management rather than a market decision.
Step 7: Manage risk. Treat the analysis as one input into a broader decision-making process.
7. Limitations and Risks of On-Chain Analysis
Although on-chain analysis is valuable, it has important limitations.
First, blockchain addresses do not always reveal the real-world identity of their owners. Attributing a wallet to an individual or organization can be difficult.
Second, large transfers can be misleading. Exchanges frequently move assets between their own wallets, and custodians may manage funds for many clients.
Third, blockchain data does not capture every aspect of the market. Centralized exchange order books, derivatives, macroeconomic developments, and investor sentiment can also influence cryptocurrency prices.
Finally, different analytics providers may use different methodologies to classify wallets, estimate exchange balances, or calculate metrics.
For these reasons, analysts should compare multiple data sources and avoid making decisions based on a single indicator.
Conclusion
On-chain analysis offers a way to look beyond cryptocurrency price charts and investigate the activity taking place directly on a blockchain.
By studying whale movements, exchange inflows and outflows, active addresses, transaction volume, and supply distribution, investors can develop a deeper understanding of crypto market behavior.
The most useful approach combines on-chain data with technical analysis, market news, and risk management.
Remember: blockchain data can reveal what happened, but it cannot always explain why it happened or predict what comes next.
As the cryptocurrency ecosystem evolves, learning to interpret on-chain metrics can be a valuable skill for anyone interested in blockchain technology and digital asset research.
Key Takeaway
On-chain analysis transforms blockchain records into useful insights. The objective is to understand network activity, evaluate market behavior, and make informed decisions—not to treat individual transactions as guaranteed trading signals.
Disclaimer: This article is for educational and informational purposes only. It is not financial or investment advice. Cryptocurrency markets are volatile, and on-chain indicators do not guarantee future price movements.
Suggested tags: On-Chain Analysis · Bitcoin · Blockchain · Crypto Education · Cryptocurrency · Web3#Web3 #bitcoin #altcoin
73
·
--
Мақала
On-Chain Analysis Explained Simply: How to Read Blockchain DataCrypto markets can be confusing.
Prices move quickly, social media is full of opinions, and news can change market sentiment within minutes.
But there is another source of information that can help crypto learners understand what is happening beneath the surface:
**On-chain data.**
So, what exactly is on-chain analysis?
## What Is On-Chain Analysis?
**On-chain analysis** means studying data that is recorded directly on a blockchain.
Unlike traditional financial markets, many public blockchains make transaction activity publicly visible.
Researchers can examine information such as:
* Wallet activity
* Transaction volume
* Exchange inflows and outflows
* Token transfers
* Whale activity
* Active addresses
* Network activity
* Supply movements
In simple terms:
> **On-chain analysis = studying blockchain activity to understand market behavior.**
## A Simple Example
Imagine Bitcoin's price is moving sideways.
Instead of looking only at the price chart, you might examine blockchain data.
You could ask:
**Are large wallets accumulating BTC?**
**Are more coins moving toward exchanges?**
**Is network activity increasing or decreasing?**
These observations don't automatically tell you what the price will do.
However, they can provide additional context.
## What Is Whale Activity?
A **whale** generally refers to an entity or wallet holding a large amount of cryptocurrency.
On-chain analysts monitor large transfers because significant movements can sometimes provide useful information about how large holders are moving their assets.
For example:
**Large wallet → Exchange**
This may indicate that the holder is preparing to sell, although it does **not** prove that a sale will happen.
Similarly:
**Exchange → Private wallet**
This may indicate that coins are being withdrawn from an exchange, but the reason for the transfer can vary.
That's why on-chain data should be interpreted carefully.
## Exchange Inflows and Outflows
One commonly discussed metric is exchange flow.
### Exchange Inflow
Coins move **into an exchange**.
Possible reasons include:
* Preparing to trade
* Selling
* Moving assets between accounts
* Other operational reasons
### Exchange Outflow
Coins move **away from an exchange**.
Possible reasons include:
* Long-term holding
* Self-custody
* Transfers to another platform
* Other operational reasons
Therefore, an inflow or outflow should not automatically be interpreted as bullish or bearish.
## Active Addresses
Another useful metric is **active addresses**.
It measures blockchain addresses involved in transactions during a particular period, depending on the methodology used by the data provider.
Increasing activity can indicate that more addresses are interacting with the network.
But more active addresses don't automatically mean the cryptocurrency's price will increase.
Context matters.
## Transaction Volume
On-chain analysts can also examine transaction activity.
For example, unusually high transaction volume may indicate increased network activity.
But transaction volume alone doesn't tell us whether buyers or sellers are in control.
It needs to be combined with other information.
## Why On-Chain Analysis Matters
Traditional market analysis often focuses on:
**Price + Volume + Technical Indicators**
On-chain analysis adds another layer:
**Blockchain Activity + Wallet Behavior + Network Data**
This can help traders, researchers, and investors understand how assets are moving across a blockchain.
## On-Chain Analysis vs Technical Analysis
These two approaches are different.
### Technical Analysis
Technical analysis primarily studies market data such as:
* Price
* Volume
* Candlestick patterns
* Support and resistance
* Moving averages
* Momentum indicators
### On-Chain Analysis
On-chain analysis focuses on blockchain data such as:
* Wallet movements
* Transactions
* Exchange flows
* Token supply
* Network activity
* Holder behavior
Some crypto analysts use both approaches together.
## Important Limitations
On-chain analysis is useful, but it isn't a crystal ball.
A wallet address doesn't always reveal the identity or intention of its owner.
One entity may control multiple addresses, while exchanges and other services may use many addresses.
Transfers can also happen for reasons unrelated to buying or selling.
Therefore:
**On-chain data provides clues, not guaranteed predictions.**
## Beginner On-Chain Checklist
When studying a cryptocurrency, start with a few simple questions:
1. Is network activity increasing or decreasing?
2. Are large wallets moving significant amounts?
3. Are tokens moving toward or away from exchanges?
4. Is transaction activity changing?
5. Is the circulating supply changing?
6. What is happening with price and volume at the same time?
7. Is there a fundamental or news event that explains the movement?
This approach can help you avoid relying on a single metric.
## Final Takeaway
On-chain analysis is essentially about **looking inside the blockchain**.
Instead of watching only the price chart, you can study how wallets, tokens, and transactions are moving across the network.
Remember:
**Price tells you what happened in the market.**
**On-chain data can provide additional context about what is happening on the network.**
The key is not to treat one metric as a guaranteed signal.
**Learn the data. Check the context. Do your own research.**
### Disclaimer
This article is for **educational and informational pu
rposes only**. It is not financial, investment, or trading advice. Cryptocurrency markets are highly volatile and involve significant risk. Always conduct your own research before making financial decisions.
On-Chain Analysis Explained Simply: How to Read Blockchain Data
Crypto markets can be confusing.
Prices move quickly, social media is full of opinions, and news can change market sentiment within minutes.
But there is another source of information that can help crypto learners understand what is happening beneath the surface:
**On-chain data.**
So, what exactly is on-chain analysis?
## What Is On-Chain Analysis?
**On-chain analysis** means studying data that is recorded directly on a blockchain.
Unlike traditional financial markets, many public blockchains make transaction activity publicly visible.
Researchers can examine information such as:
* Wallet activity
* Transaction volume
* Exchange inflows and outflows
* Token transfers
* Whale activity
* Active addresses
* Network activity
* Supply movements
In simple terms:
> **On-chain analysis = studying blockchain activity to understand market behavior.**
## A Simple Example
Imagine Bitcoin's price is moving sideways.
Instead of looking only at the price chart, you might examine blockchain data.
You could ask:
**Are large wallets accumulating BTC?**
**Are more coins moving toward exchanges?**
**Is network activity increasing or decreasing?**
These observations don't automatically tell you what the price will do.
However, they can provide additional context.
## What Is Whale Activity?
A **whale** generally refers to an entity or wallet holding a large amount of cryptocurrency.
On-chain analysts monitor large transfers because significant movements can sometimes provide useful information about how large holders are moving their assets.
For example:
**Large wallet → Exchange**
This may indicate that the holder is preparing to sell, although it does **not** prove that a sale will happen.
Similarly:
**Exchange → Private wallet**
This may indicate that coins are being withdrawn from an exchange, but the reason for the transfer can vary.
That's why on-chain data should be interpreted carefully.
## Exchange Inflows and Outflows
One commonly discussed metric is exchange flow.
### Exchange Inflow
Coins move **into an exchange**.
Possible reasons include:
* Preparing to trade
* Selling
* Moving assets between accounts
* Other operational reasons
### Exchange Outflow
Coins move **away from an exchange**.
Possible reasons include:
* Long-term holding
* Self-custody
* Transfers to another platform
* Other operational reasons
Therefore, an inflow or outflow should not automatically be interpreted as bullish or bearish.
## Active Addresses
Another useful metric is **active addresses**.
It measures blockchain addresses involved in transactions during a particular period, depending on the methodology used by the data provider.
Increasing activity can indicate that more addresses are interacting with the network.
But more active addresses don't automatically mean the cryptocurrency's price will increase.
Context matters.
## Transaction Volume
On-chain analysts can also examine transaction activity.
For example, unusually high transaction volume may indicate increased network activity.
But transaction volume alone doesn't tell us whether buyers or sellers are in control.
It needs to be combined with other information.
## Why On-Chain Analysis Matters
Traditional market analysis often focuses on:
**Price + Volume + Technical Indicators**
On-chain analysis adds another layer:
**Blockchain Activity + Wallet Behavior + Network Data**
This can help traders, researchers, and investors understand how assets are moving across a blockchain.
## On-Chain Analysis vs Technical Analysis
These two approaches are different.
### Technical Analysis
Technical analysis primarily studies market data such as:
* Price
* Volume
* Candlestick patterns
* Support and resistance
* Moving averages
* Momentum indicators
### On-Chain Analysis
On-chain analysis focuses on blockchain data such as:
* Wallet movements
* Transactions
* Exchange flows
* Token supply
* Network activity
* Holder behavior
Some crypto analysts use both approaches together.
## Important Limitations
On-chain analysis is useful, but it isn't a crystal ball.
A wallet address doesn't always reveal the identity or intention of its owner.
One entity may control multiple addresses, while exchanges and other services may use many addresses.
Transfers can also happen for reasons unrelated to buying or selling.
Therefore:
**On-chain data provides clues, not guaranteed predictions.**
## Beginner On-Chain Checklist
When studying a cryptocurrency, start with a few simple questions:
1. Is network activity increasing or decreasing?
2. Are large wallets moving significant amounts?
3. Are tokens moving toward or away from exchanges?
4. Is transaction activity changing?
5. Is the circulating supply changing?
6. What is happening with price and volume at the same time?
7. Is there a fundamental or news event that explains the movement?
This approach can help you avoid relying on a single metric.
## Final Takeaway
On-chain analysis is essentially about **looking inside the blockchain**.
Instead of watching only the price chart, you can study how wallets, tokens, and transactions are moving across the network.
Remember:
**Price tells you what happened in the market.**
**On-chain data can provide additional context about what is happening on the network.**
The key is not to treat one metric as a guaranteed signal.
**Learn the data. Check the context. Do your own research.**
### Disclaimer
This article is for **educational and informational pu
rposes only**. It is not financial, investment, or trading advice. Cryptocurrency markets are highly volatile and involve significant risk. Always conduct your own research before making financial decisions.
Prices move quickly, social media is full of opinions, and news can change market sentiment within minutes.
But there is another source of information that can help crypto learners understand what is happening beneath the surface:
**On-chain data.**
So, what exactly is on-chain analysis?
## What Is On-Chain Analysis?
**On-chain analysis** means studying data that is recorded directly on a blockchain.
Unlike traditional financial markets, many public blockchains make transaction activity publicly visible.
Researchers can examine information such as:
* Wallet activity
* Transaction volume
* Exchange inflows and outflows
* Token transfers
* Whale activity
* Active addresses
* Network activity
* Supply movements
In simple terms:
> **On-chain analysis = studying blockchain activity to understand market behavior.**
## A Simple Example
Imagine Bitcoin's price is moving sideways.
Instead of looking only at the price chart, you might examine blockchain data.
You could ask:
**Are large wallets accumulating BTC?**
**Are more coins moving toward exchanges?**
**Is network activity increasing or decreasing?**
These observations don't automatically tell you what the price will do.
However, they can provide additional context.
## What Is Whale Activity?
A **whale** generally refers to an entity or wallet holding a large amount of cryptocurrency.
On-chain analysts monitor large transfers because significant movements can sometimes provide useful information about how large holders are moving their assets.
For example:
**Large wallet → Exchange**
This may indicate that the holder is preparing to sell, although it does **not** prove that a sale will happen.
Similarly:
**Exchange → Private wallet**
This may indicate that coins are being withdrawn from an exchange, but the reason for the transfer can vary.
That's why on-chain data should be interpreted carefully.
## Exchange Inflows and Outflows
One commonly discussed metric is exchange flow.
### Exchange Inflow
Coins move **into an exchange**.
Possible reasons include:
* Preparing to trade
* Selling
* Moving assets between accounts
* Other operational reasons
### Exchange Outflow
Coins move **away from an exchange**.
Possible reasons include:
* Long-term holding
* Self-custody
* Transfers to another platform
* Other operational reasons
Therefore, an inflow or outflow should not automatically be interpreted as bullish or bearish.
## Active Addresses
Another useful metric is **active addresses**.
It measures blockchain addresses involved in transactions during a particular period, depending on the methodology used by the data provider.
Increasing activity can indicate that more addresses are interacting with the network.
But more active addresses don't automatically mean the cryptocurrency's price will increase.
Context matters.
## Transaction Volume
On-chain analysts can also examine transaction activity.
For example, unusually high transaction volume may indicate increased network activity.
But transaction volume alone doesn't tell us whether buyers or sellers are in control.
It needs to be combined with other information.
## Why On-Chain Analysis Matters
Traditional market analysis often focuses on:
**Price + Volume + Technical Indicators**
On-chain analysis adds another layer:
**Blockchain Activity + Wallet Behavior + Network Data**
This can help traders, researchers, and investors understand how assets are moving across a blockchain.
## On-Chain Analysis vs Technical Analysis
These two approaches are different.
### Technical Analysis
Technical analysis primarily studies market data such as:
* Price
* Volume
* Candlestick patterns
* Support and resistance
* Moving averages
* Momentum indicators
### On-Chain Analysis
On-chain analysis focuses on blockchain data such as:
* Wallet movements
* Transactions
* Exchange flows
* Token supply
* Network activity
* Holder behavior
Some crypto analysts use both approaches together.
## Important Limitations
On-chain analysis is useful, but it isn't a crystal ball.
A wallet address doesn't always reveal the identity or intention of its owner.
One entity may control multiple addresses, while exchanges and other services may use many addresses.
Transfers can also happen for reasons unrelated to buying or selling.
Therefore:
**On-chain data provides clues, not guaranteed predictions.**
## Beginner On-Chain Checklist
When studying a cryptocurrency, start with a few simple questions:
1. Is network activity increasing or decreasing?
2. Are large wallets moving significant amounts?
3. Are tokens moving toward or away from exchanges?
4. Is transaction activity changing?
5. Is the circulating supply changing?
6. What is happening with price and volume at the same time?
7. Is there a fundamental or news event that explains the movement?
This approach can help you avoid relying on a single metric.
## Final Takeaway
On-chain analysis is essentially about **looking inside the blockchain**.
Instead of watching only the price chart, you can study how wallets, tokens, and transactions are moving across the network.
Remember:
**Price tells you what happened in the market.**
**On-chain data can provide additional context about what is happening on the network.**
The key is not to treat one metric as a guaranteed signal.
**Learn the data. Check the context. Do your own research.**
### Disclaimer
This article is for **educational and informational pu
rposes only**. It is not financial, investment, or trading advice. Cryptocurrency markets are highly volatile and involve significant risk. Always conduct your own research before making financial decisions.
66
·
--
Bitcoin guide meWhen people hear the word **crypto**, they often think about Bitcoin, Ethereum, trading, or prices.
But behind most cryptocurrencies is a technology that makes everything work: **blockchain**.
So, what exactly is a blockchain?
Let’s explain it in the simplest way possible.
## What Is a Blockchain?
A blockchain is a **digital record book** that stores information, especially cryptocurrency transactions.
Imagine a notebook that is shared with thousands of people around the world.
Whenever a new transaction happens, it can be recorded in this shared notebook. Instead of one company controlling the notebook, a network of computers helps maintain and verify it.
That is the basic idea behind blockchain.
## Why Is It Called a “Blockchain”?
The word has two parts:
**Block** → A collection of transactions or other data.
**Chain** → Blocks are connected to previous blocks, creating a chronological chain.
So:
**Block + Block + Block = Blockchain**
Each new block is connected to the previous one, helping create a permanent history of activity.
## How Does a Blockchain Transaction Work?
Let's use Bitcoin as a simple example.
Suppose Alice wants to send **0.01 BTC** to Bob.
The basic process looks like this:
1. Alice creates the transaction.
2. The transaction is broadcast to the Bitcoin network.
3. Network participants verify the transaction.
4. Valid transactions are grouped into a block.
5. The block is added to the blockchain.
6. The transaction becomes part of Bitcoin's public transaction history.
The exact technical process depends on the blockchain, but this gives beginners a useful mental model.
## What Makes Blockchain Different?
Traditional systems often depend on a central organization.
For example, a bank maintains its own database of account balances and transactions.
A public blockchain can work differently.
The network itself helps maintain and verify the record according to its protocol rules.
This can provide several important characteristics:
* **Transparency:** Many public blockchains allow anyone to inspect transaction data.
* **Decentralization:** Control and verification can be distributed across a network.
* **Immutability:** Confirmed blockchain data is generally difficult to alter.
* **Global access:** Public blockchains can be accessed from anywhere with the required technology.
## Is Blockchain Completely Anonymous?
Not necessarily.
Many people describe crypto as anonymous, but **pseudonymous** is often a better description for public blockchains such as Bitcoin.
Transactions can be visible on the blockchain, while the real-world identity behind an address may not be directly displayed.
However, blockchain addresses can sometimes be linked to real identities through exchanges, investigations, or other information.
So:
**Public ≠ completely anonymous.**
## Blockchain Is More Than Cryptocurrency
Blockchain technology is not limited to Bitcoin.
Different blockchain networks can support different applications, including:
* Smart contracts
* Decentralized finance (DeFi)
* NFTs
* Tokenized assets
* Decentralized applications
* On-chain governance
* Digital identity experiments
Ethereum, for example, helped popularize programmable blockchain applications through smart contracts.
## A Simple Analogy
Think of blockchain like a **shared spreadsheet**.
Imagine thousands of computers have copies of the same spreadsheet.
When a valid update happens, the network agrees on the update and the record is synchronized according to the blockchain's rules.
Instead of one person keeping the only copy, the network maintains the ledger.
This analogy isn't technically perfect, but it makes the core concept easier to understand.
## Why Does Blockchain Matter?
Blockchain introduces a different way of maintaining digital records.
Instead of always relying on a central database controlled by one organization, blockchain networks can allow multiple participants to verify and maintain a shared ledger.
This idea has opened the door to new experiments in finance, digital ownership, applications, and online coordination.
At the same time, blockchain technology has limitations, including scalability, transaction costs, security risks, regulatory uncertainty, and usability challenges.
Understanding both the possibilities and limitations is important before investing in or using crypto.
## Final Takeaway
You don't need to understand complex code to understand the basic idea of blockchain.
Remember these four words:
**Blocks → Connected → Verified → Recorded**
That's the foundation.
Once you understand blockchain, concepts like Bitcoin, Ethereum, smart contracts, DeFi, and NFTs become much easier to understand.
**Keep learning. Don't just follow crypto prices—understand the technology behind them.**
---
### Disclaimer
This article is for **educational and informational purposes only**. It is not financial, investment, or trading advice
. Cryptocurrency involves significant risks, and you should conduct your own research before making any financial decision.On-chain analysis
Bitcoin guide me
When people hear the word **crypto**, they often think about Bitcoin, Ethereum, trading, or prices.
But behind most cryptocurrencies is a technology that makes everything work: **blockchain**.
So, what exactly is a blockchain?
Let’s explain it in the simplest way possible.
## What Is a Blockchain?
A blockchain is a **digital record book** that stores information, especially cryptocurrency transactions.
Imagine a notebook that is shared with thousands of people around the world.
Whenever a new transaction happens, it can be recorded in this shared notebook. Instead of one company controlling the notebook, a network of computers helps maintain and verify it.
That is the basic idea behind blockchain.
## Why Is It Called a “Blockchain”?
The word has two parts:
**Block** → A collection of transactions or other data.
**Chain** → Blocks are connected to previous blocks, creating a chronological chain.
So:
**Block + Block + Block = Blockchain**
Each new block is connected to the previous one, helping create a permanent history of activity.
## How Does a Blockchain Transaction Work?
Let's use Bitcoin as a simple example.
Suppose Alice wants to send **0.01 BTC** to Bob.
The basic process looks like this:
1. Alice creates the transaction.
2. The transaction is broadcast to the Bitcoin network.
3. Network participants verify the transaction.
4. Valid transactions are grouped into a block.
5. The block is added to the blockchain.
6. The transaction becomes part of Bitcoin's public transaction history.
The exact technical process depends on the blockchain, but this gives beginners a useful mental model.
## What Makes Blockchain Different?
Traditional systems often depend on a central organization.
For example, a bank maintains its own database of account balances and transactions.
A public blockchain can work differently.
The network itself helps maintain and verify the record according to its protocol rules.
This can provide several important characteristics:
* **Transparency:** Many public blockchains allow anyone to inspect transaction data.
* **Decentralization:** Control and verification can be distributed across a network.
* **Immutability:** Confirmed blockchain data is generally difficult to alter.
* **Global access:** Public blockchains can be accessed from anywhere with the required technology.
## Is Blockchain Completely Anonymous?
Not necessarily.
Many people describe crypto as anonymous, but **pseudonymous** is often a better description for public blockchains such as Bitcoin.
Transactions can be visible on the blockchain, while the real-world identity behind an address may not be directly displayed.
However, blockchain addresses can sometimes be linked to real identities through exchanges, investigations, or other information.
So:
**Public ≠ completely anonymous.**
## Blockchain Is More Than Cryptocurrency
Blockchain technology is not limited to Bitcoin.
Different blockchain networks can support different applications, including:
* Smart contracts
* Decentralized finance (DeFi)
* NFTs
* Tokenized assets
* Decentralized applications
* On-chain governance
* Digital identity experiments
Ethereum, for example, helped popularize programmable blockchain applications through smart contracts.
## A Simple Analogy
Think of blockchain like a **shared spreadsheet**.
Imagine thousands of computers have copies of the same spreadsheet.
When a valid update happens, the network agrees on the update and the record is synchronized according to the blockchain's rules.
Instead of one person keeping the only copy, the network maintains the ledger.
This analogy isn't technically perfect, but it makes the core concept easier to understand.
## Why Does Blockchain Matter?
Blockchain introduces a different way of maintaining digital records.
Instead of always relying on a central database controlled by one organization, blockchain networks can allow multiple participants to verify and maintain a shared ledger.
This idea has opened the door to new experiments in finance, digital ownership, applications, and online coordination.
At the same time, blockchain technology has limitations, including scalability, transaction costs, security risks, regulatory uncertainty, and usability challenges.
Understanding both the possibilities and limitations is important before investing in or using crypto.
## Final Takeaway
You don't need to understand complex code to understand the basic idea of blockchain.
Remember these four words:
**Blocks → Connected → Verified → Recorded**
That's the foundation.
Once you understand blockchain, concepts like Bitcoin, Ethereum, smart contracts, DeFi, and NFTs become much easier to understand.
**Keep learning. Don't just follow crypto prices—understand the technology behind them.**
---
### Disclaimer
This article is for **educational and informational purposes only**. It is not financial, investment, or trading advice
. Cryptocurrency involves significant risks, and you should conduct your own research before making any financial decision.On-chain analysis
But behind most cryptocurrencies is a technology that makes everything work: **blockchain**.
So, what exactly is a blockchain?
Let’s explain it in the simplest way possible.
## What Is a Blockchain?
A blockchain is a **digital record book** that stores information, especially cryptocurrency transactions.
Imagine a notebook that is shared with thousands of people around the world.
Whenever a new transaction happens, it can be recorded in this shared notebook. Instead of one company controlling the notebook, a network of computers helps maintain and verify it.
That is the basic idea behind blockchain.
## Why Is It Called a “Blockchain”?
The word has two parts:
**Block** → A collection of transactions or other data.
**Chain** → Blocks are connected to previous blocks, creating a chronological chain.
So:
**Block + Block + Block = Blockchain**
Each new block is connected to the previous one, helping create a permanent history of activity.
## How Does a Blockchain Transaction Work?
Let's use Bitcoin as a simple example.
Suppose Alice wants to send **0.01 BTC** to Bob.
The basic process looks like this:
1. Alice creates the transaction.
2. The transaction is broadcast to the Bitcoin network.
3. Network participants verify the transaction.
4. Valid transactions are grouped into a block.
5. The block is added to the blockchain.
6. The transaction becomes part of Bitcoin's public transaction history.
The exact technical process depends on the blockchain, but this gives beginners a useful mental model.
## What Makes Blockchain Different?
Traditional systems often depend on a central organization.
For example, a bank maintains its own database of account balances and transactions.
A public blockchain can work differently.
The network itself helps maintain and verify the record according to its protocol rules.
This can provide several important characteristics:
* **Transparency:** Many public blockchains allow anyone to inspect transaction data.
* **Decentralization:** Control and verification can be distributed across a network.
* **Immutability:** Confirmed blockchain data is generally difficult to alter.
* **Global access:** Public blockchains can be accessed from anywhere with the required technology.
## Is Blockchain Completely Anonymous?
Not necessarily.
Many people describe crypto as anonymous, but **pseudonymous** is often a better description for public blockchains such as Bitcoin.
Transactions can be visible on the blockchain, while the real-world identity behind an address may not be directly displayed.
However, blockchain addresses can sometimes be linked to real identities through exchanges, investigations, or other information.
So:
**Public ≠ completely anonymous.**
## Blockchain Is More Than Cryptocurrency
Blockchain technology is not limited to Bitcoin.
Different blockchain networks can support different applications, including:
* Smart contracts
* Decentralized finance (DeFi)
* NFTs
* Tokenized assets
* Decentralized applications
* On-chain governance
* Digital identity experiments
Ethereum, for example, helped popularize programmable blockchain applications through smart contracts.
## A Simple Analogy
Think of blockchain like a **shared spreadsheet**.
Imagine thousands of computers have copies of the same spreadsheet.
When a valid update happens, the network agrees on the update and the record is synchronized according to the blockchain's rules.
Instead of one person keeping the only copy, the network maintains the ledger.
This analogy isn't technically perfect, but it makes the core concept easier to understand.
## Why Does Blockchain Matter?
Blockchain introduces a different way of maintaining digital records.
Instead of always relying on a central database controlled by one organization, blockchain networks can allow multiple participants to verify and maintain a shared ledger.
This idea has opened the door to new experiments in finance, digital ownership, applications, and online coordination.
At the same time, blockchain technology has limitations, including scalability, transaction costs, security risks, regulatory uncertainty, and usability challenges.
Understanding both the possibilities and limitations is important before investing in or using crypto.
## Final Takeaway
You don't need to understand complex code to understand the basic idea of blockchain.
Remember these four words:
**Blocks → Connected → Verified → Recorded**
That's the foundation.
Once you understand blockchain, concepts like Bitcoin, Ethereum, smart contracts, DeFi, and NFTs become much easier to understand.
**Keep learning. Don't just follow crypto prices—understand the technology behind them.**
---
### Disclaimer
This article is for **educational and informational purposes only**. It is not financial, investment, or trading advice
. Cryptocurrency involves significant risks, and you should conduct your own research before making any financial decision.On-chain analysis
91
·
--
Мақала
TON (Gram) Latest News: Telegram’s Wallet and the Next Phase of The Open NetworkThe Open Network (TON) ecosystem is going through a major transition in 2026, with Telegram increasing its role in the network and the blockchain’s native token returning to its original **Gram** name.
Here are the key developments crypto users should know.
## 1. TON’s Native Token Is Now Gram
One of the biggest changes this year is the rebranding of the network’s native cryptocurrency.
The token previously known as **Toncoin (TON)** is now called **Gram (GRAM)**. The blockchain itself continues to be known as **The Open Network (TON)**.
The change was approved through a community vote, with Binance News reporting that 81.22% of participating voters supported the rebrand.
The move brings back the name “Gram,” which was used in Telegram’s original blockchain plans.
## 2. Telegram’s Gram Wallet Is Rolling Out
Telegram has also started rolling out its native **Gram Wallet**.
According to TON Strategy Company, Telegram founder Pavel Durov announced on August 31 that the wallet had become available to a select group of Telegram users, with a gradual expansion planned.
This is important because Telegram has a massive global user base, giving blockchain-based payments and applications a potentially large distribution channel.
The wallet uses network-level smart-contract infrastructure designed to allow wallet functionality to be updated through validator governance without requiring individual wallet migrations.
## 3. TON Is Focusing on Network Performance
TON's infrastructure has also been undergoing upgrades.
One of the recently highlighted upgrades, **Config 30**, is designed to improve validator efficiency and network throughput. TON Strategy Company said the upgrade is expected to increase throughput by up to 30%.
For a blockchain connected to Telegram's consumer ecosystem, scalability is an important factor because applications may need to handle large numbers of transactions.
## 4. Tonkeeper Becomes Keeper
Another notable ecosystem development came in September.
Tonkeeper has rebranded as **Keeper** and expanded from TON-only support to seven blockchain networks:
* TON
* Bitcoin
* Ethereum
* TRON
* BNB Smart Chain
* Arbitrum
* Base
The Block reported that Keeper also includes its Battery infrastructure for gasless transactions.
The change represents a move from a TON-focused wallet toward a broader multichain product.
## 5. Why the Telegram Connection Matters
Telegram's relationship with TON remains one of the ecosystem's most important characteristics.
The network was originally developed around Telegram's blockchain ambitions, and independent developers later continued the project after Telegram exited its original blockchain initiative.
In 2026, Telegram has again taken a more direct role in the ecosystem, while TON continues developing infrastructure for payments, wallets, Mini Apps and other consumer-facing applications.
## What Should Crypto Users Watch Next?
The key areas to monitor include:
**🔹 Gram Wallet adoption**
How widely Telegram's native wallet becomes available and how users interact with it.
**🔹 Network activity**
Transaction activity, wallet usage and application growth can provide clues about real ecosystem adoption.
**🔹 Developer activity**
New Mini Apps and blockchain applications could influence TON's long-term ecosystem development.
**🔹 GRAM market activity**
The token's liquidity, trading volume and price structure remain important for market participants.
**🔹 Telegram ecosystem integration**
Further integration between Telegram and blockchain-based services could remain a major theme.
## Final Takeaway
The TON ecosystem is entering a new phase.
The blockchain remains **The Open Network (TON)**, while its native token has returned to the **Gram (GRAM)** name. At the same time, Telegram is rolling out its native Gram Wallet and the network is implementing infrastructure upgrades aimed at supporting broader consumer usage.
For crypto observers, the important question is no longer simply what TON is called.
The bigger story is how effectively **Telegram + Gram + TON infrastructure** can translate a large user base into sustained blockchain activity.
**What do you think will matter most for the TON ecosystem next: Gram Wallet adoption, network activity, or Telegram Mini Apps?**
#TON #Gram #GRAM #Telegram #CryptoNews #Crypto #Blockchain #Web3 #TheOpenNetwork #CryptoEducation
### Disclaimer
This article is for educational and informational purposes only and is not financial or investment advice. Cryptocurrency
markets are highly volatile. Always conduct your own research before making financial decisions.
TON (Gram) Latest News: Telegram’s Wallet and the Next Phase of The Open Network
The Open Network (TON) ecosystem is going through a major transition in 2026, with Telegram increasing its role in the network and the blockchain’s native token returning to its original **Gram** name.
Here are the key developments crypto users should know.
## 1. TON’s Native Token Is Now Gram
One of the biggest changes this year is the rebranding of the network’s native cryptocurrency.
The token previously known as **Toncoin (TON)** is now called **Gram (GRAM)**. The blockchain itself continues to be known as **The Open Network (TON)**.
The change was approved through a community vote, with Binance News reporting that 81.22% of participating voters supported the rebrand.
The move brings back the name “Gram,” which was used in Telegram’s original blockchain plans.
## 2. Telegram’s Gram Wallet Is Rolling Out
Telegram has also started rolling out its native **Gram Wallet**.
According to TON Strategy Company, Telegram founder Pavel Durov announced on August 31 that the wallet had become available to a select group of Telegram users, with a gradual expansion planned.
This is important because Telegram has a massive global user base, giving blockchain-based payments and applications a potentially large distribution channel.
The wallet uses network-level smart-contract infrastructure designed to allow wallet functionality to be updated through validator governance without requiring individual wallet migrations.
## 3. TON Is Focusing on Network Performance
TON's infrastructure has also been undergoing upgrades.
One of the recently highlighted upgrades, **Config 30**, is designed to improve validator efficiency and network throughput. TON Strategy Company said the upgrade is expected to increase throughput by up to 30%.
For a blockchain connected to Telegram's consumer ecosystem, scalability is an important factor because applications may need to handle large numbers of transactions.
## 4. Tonkeeper Becomes Keeper
Another notable ecosystem development came in September.
Tonkeeper has rebranded as **Keeper** and expanded from TON-only support to seven blockchain networks:
* TON
* Bitcoin
* Ethereum
* TRON
* BNB Smart Chain
* Arbitrum
* Base
The Block reported that Keeper also includes its Battery infrastructure for gasless transactions.
The change represents a move from a TON-focused wallet toward a broader multichain product.
## 5. Why the Telegram Connection Matters
Telegram's relationship with TON remains one of the ecosystem's most important characteristics.
The network was originally developed around Telegram's blockchain ambitions, and independent developers later continued the project after Telegram exited its original blockchain initiative.
In 2026, Telegram has again taken a more direct role in the ecosystem, while TON continues developing infrastructure for payments, wallets, Mini Apps and other consumer-facing applications.
## What Should Crypto Users Watch Next?
The key areas to monitor include:
**🔹 Gram Wallet adoption**
How widely Telegram's native wallet becomes available and how users interact with it.
**🔹 Network activity**
Transaction activity, wallet usage and application growth can provide clues about real ecosystem adoption.
**🔹 Developer activity**
New Mini Apps and blockchain applications could influence TON's long-term ecosystem development.
**🔹 GRAM market activity**
The token's liquidity, trading volume and price structure remain important for market participants.
**🔹 Telegram ecosystem integration**
Further integration between Telegram and blockchain-based services could remain a major theme.
## Final Takeaway
The TON ecosystem is entering a new phase.
The blockchain remains **The Open Network (TON)**, while its native token has returned to the **Gram (GRAM)** name. At the same time, Telegram is rolling out its native Gram Wallet and the network is implementing infrastructure upgrades aimed at supporting broader consumer usage.
For crypto observers, the important question is no longer simply what TON is called.
The bigger story is how effectively **Telegram + Gram + TON infrastructure** can translate a large user base into sustained blockchain activity.
**What do you think will matter most for the TON ecosystem next: Gram Wallet adoption, network activity, or Telegram Mini Apps?**
#TON #Gram #GRAM #Telegram #CryptoNews #Crypto #Blockchain #Web3 #TheOpenNetwork #CryptoEducation
### Disclaimer
This article is for educational and informational purposes only and is not financial or investment advice. Cryptocurrency
markets are highly volatile. Always conduct your own research before making financial decisions.
Here are the key developments crypto users should know.
## 1. TON’s Native Token Is Now Gram
One of the biggest changes this year is the rebranding of the network’s native cryptocurrency.
The token previously known as **Toncoin (TON)** is now called **Gram (GRAM)**. The blockchain itself continues to be known as **The Open Network (TON)**.
The change was approved through a community vote, with Binance News reporting that 81.22% of participating voters supported the rebrand.
The move brings back the name “Gram,” which was used in Telegram’s original blockchain plans.
## 2. Telegram’s Gram Wallet Is Rolling Out
Telegram has also started rolling out its native **Gram Wallet**.
According to TON Strategy Company, Telegram founder Pavel Durov announced on August 31 that the wallet had become available to a select group of Telegram users, with a gradual expansion planned.
This is important because Telegram has a massive global user base, giving blockchain-based payments and applications a potentially large distribution channel.
The wallet uses network-level smart-contract infrastructure designed to allow wallet functionality to be updated through validator governance without requiring individual wallet migrations.
## 3. TON Is Focusing on Network Performance
TON's infrastructure has also been undergoing upgrades.
One of the recently highlighted upgrades, **Config 30**, is designed to improve validator efficiency and network throughput. TON Strategy Company said the upgrade is expected to increase throughput by up to 30%.
For a blockchain connected to Telegram's consumer ecosystem, scalability is an important factor because applications may need to handle large numbers of transactions.
## 4. Tonkeeper Becomes Keeper
Another notable ecosystem development came in September.
Tonkeeper has rebranded as **Keeper** and expanded from TON-only support to seven blockchain networks:
* TON
* Bitcoin
* Ethereum
* TRON
* BNB Smart Chain
* Arbitrum
* Base
The Block reported that Keeper also includes its Battery infrastructure for gasless transactions.
The change represents a move from a TON-focused wallet toward a broader multichain product.
## 5. Why the Telegram Connection Matters
Telegram's relationship with TON remains one of the ecosystem's most important characteristics.
The network was originally developed around Telegram's blockchain ambitions, and independent developers later continued the project after Telegram exited its original blockchain initiative.
In 2026, Telegram has again taken a more direct role in the ecosystem, while TON continues developing infrastructure for payments, wallets, Mini Apps and other consumer-facing applications.
## What Should Crypto Users Watch Next?
The key areas to monitor include:
**🔹 Gram Wallet adoption**
How widely Telegram's native wallet becomes available and how users interact with it.
**🔹 Network activity**
Transaction activity, wallet usage and application growth can provide clues about real ecosystem adoption.
**🔹 Developer activity**
New Mini Apps and blockchain applications could influence TON's long-term ecosystem development.
**🔹 GRAM market activity**
The token's liquidity, trading volume and price structure remain important for market participants.
**🔹 Telegram ecosystem integration**
Further integration between Telegram and blockchain-based services could remain a major theme.
## Final Takeaway
The TON ecosystem is entering a new phase.
The blockchain remains **The Open Network (TON)**, while its native token has returned to the **Gram (GRAM)** name. At the same time, Telegram is rolling out its native Gram Wallet and the network is implementing infrastructure upgrades aimed at supporting broader consumer usage.
For crypto observers, the important question is no longer simply what TON is called.
The bigger story is how effectively **Telegram + Gram + TON infrastructure** can translate a large user base into sustained blockchain activity.
**What do you think will matter most for the TON ecosystem next: Gram Wallet adoption, network activity, or Telegram Mini Apps?**
#TON #Gram #GRAM #Telegram #CryptoNews #Crypto #Blockchain #Web3 #TheOpenNetwork #CryptoEducation
### Disclaimer
This article is for educational and informational purposes only and is not financial or investment advice. Cryptocurrency
markets are highly volatile. Always conduct your own research before making financial decisions.
251
·
--
BTC educational post — support/resistance
₿ BTC Educational Post — Support & Resistance
BTC Support & Resistance: A Simple Guide 📊
🔹 Support
A price zone where buying interest may appear and selling pressure can slow down. Traders often watch previous lows and high-volume areas.
🔹 Resistance
A price zone where selling pressure may increase. Previous highs and areas of strong rejection can become resistance.
📌 Important: Support and resistance are zones, not exact prices. They can break, fail, or switch roles.
Example:
If BTC repeatedly finds buyers around a certain area, that zone may act as support. If BTC repeatedly gets rejected near another area, that zone may act as resistance.
🧠 Key lesson: Don't rely on one level alone. Consider volume, market structure, trend, and confirmation.
💬 Question:
Which BTC level are you watching right now — support or resistance?
#bitcoin #BTC #cryptoeducation $BTC
{spot}(BTCUSDT)
#TradingEducation #CryptoTrading
BTC educational post — support/resistance
₿ BTC Educational Post — Support & Resistance
BTC Support & Resistance: A Simple Guide 📊
🔹 Support
A price zone where buying interest may appear and selling pressure can slow down. Traders often watch previous lows and high-volume areas.
🔹 Resistance
A price zone where selling pressure may increase. Previous highs and areas of strong rejection can become resistance.
📌 Important: Support and resistance are zones, not exact prices. They can break, fail, or switch roles.
Example:
If BTC repeatedly finds buyers around a certain area, that zone may act as support. If BTC repeatedly gets rejected near another area, that zone may act as resistance.
🧠 Key lesson: Don't rely on one level alone. Consider volume, market structure, trend, and confirmation.
💬 Question:
Which BTC level are you watching right now — support or resistance?
#bitcoin #BTC #cryptoeducation $BTC
#TradingEducation #CryptoTrading
₿ BTC Educational Post — Support & Resistance
BTC Support & Resistance: A Simple Guide 📊
🔹 Support
A price zone where buying interest may appear and selling pressure can slow down. Traders often watch previous lows and high-volume areas.
🔹 Resistance
A price zone where selling pressure may increase. Previous highs and areas of strong rejection can become resistance.
📌 Important: Support and resistance are zones, not exact prices. They can break, fail, or switch roles.
Example:
If BTC repeatedly finds buyers around a certain area, that zone may act as support. If BTC repeatedly gets rejected near another area, that zone may act as resistance.
🧠 Key lesson: Don't rely on one level alone. Consider volume, market structure, trend, and confirmation.
💬 Question:
Which BTC level are you watching right now — support or resistance?
#bitcoin #BTC #cryptoeducation $BTC
#TradingEducation #CryptoTrading
100
·
--
Crypto Term: Tokenomics 🪙
Simple meaning:
Tokenomics = how a crypto token’s economy works.
It explains things like:
Total Supply — How many tokens can exist?
Circulating Supply — How many are currently available?
Token Distribution — Who owns the tokens? Team, investors, community, etc.
Vesting/Unlocks — When will locked tokens become available?
Utility — What can the token actually be used for?
Burning — Are tokens permanently removed from supply?
Example:
A project has 1 billion tokens:
40% community
20% team
15% investors
15% ecosystem
10% treasury
If a large amount of team/investor tokens unlocks soon, it can increase the amount of tokens available for trading.
👉 Remember: Tokenomics = Supply + Distribution + Utility + Unlocks.$TON #StrategyStriveAdd2305BitcoinThisWeek #StrategyStriveAdd2305BitcoinThisWeek #TrumpRejectsIranHormuzReopening
Crypto Term: Tokenomics 🪙
Simple meaning:
Tokenomics = how a crypto token’s economy works.
It explains things like:
Total Supply — How many tokens can exist?
Circulating Supply — How many are currently available?
Token Distribution — Who owns the tokens? Team, investors, community, etc.
Vesting/Unlocks — When will locked tokens become available?
Utility — What can the token actually be used for?
Burning — Are tokens permanently removed from supply?
Example:
A project has 1 billion tokens:
40% community
20% team
15% investors
15% ecosystem
10% treasury
If a large amount of team/investor tokens unlocks soon, it can increase the amount of tokens available for trading.
👉 Remember: Tokenomics = Supply + Distribution + Utility + Unlocks.$TON #StrategyStriveAdd2305BitcoinThisWeek #StrategyStriveAdd2305BitcoinThisWeek #TrumpRejectsIranHormuzReopening
Simple meaning:
Tokenomics = how a crypto token’s economy works.
It explains things like:
Total Supply — How many tokens can exist?
Circulating Supply — How many are currently available?
Token Distribution — Who owns the tokens? Team, investors, community, etc.
Vesting/Unlocks — When will locked tokens become available?
Utility — What can the token actually be used for?
Burning — Are tokens permanently removed from supply?
Example:
A project has 1 billion tokens:
40% community
20% team
15% investors
15% ecosystem
10% treasury
If a large amount of team/investor tokens unlocks soon, it can increase the amount of tokens available for trading.
👉 Remember: Tokenomics = Supply + Distribution + Utility + Unlocks.$TON #StrategyStriveAdd2305BitcoinThisWeek #StrategyStriveAdd2305BitcoinThisWeek #TrumpRejectsIranHormuzReopening
58
·
--
Web3 (Web 3.0) is the idea of a more decentralized internet built around blockchain, crypto, smart contracts, and user-owned digital assets.
Key areas of Web3
🔗 Blockchain — decentralized networks such as Ethereum, Solana, and BNB Chain
💰 Cryptocurrency — BTC, ETH, stablecoins, and other tokens
🤝 DeFi — decentralized lending, trading, staking, and financial applications
🎨 NFTs — blockchain-based ownership of digital assets
🏗️ DAOs — community-governed organizations
🎮 Web3 Gaming — blockchain-based games and digital assets
🧠 AI + Web3 — decentralized AI infrastructure, agents, and data ownership
🪪 Decentralized Identity — identity and credentials controlled by users
Simple example:
Web2 → You use a platform and the platform controls your account/data.
Web3 → A wallet can act as your identity, and blockchain networks can record ownership and transactions without relying entirely on one central platform.
If you're learning Web3 for crypto/content creation, a useful roadmap is:
Blockchain → Wallets → Smart Contracts → DeFi → NFTs → DAOs → Web3 projects → On-chain research.
Web3 (Web 3.0) is the idea of a more decentralized internet built around blockchain, crypto, smart contracts, and user-owned digital assets.
Key areas of Web3
🔗 Blockchain — decentralized networks such as Ethereum, Solana, and BNB Chain
💰 Cryptocurrency — BTC, ETH, stablecoins, and other tokens
🤝 DeFi — decentralized lending, trading, staking, and financial applications
🎨 NFTs — blockchain-based ownership of digital assets
🏗️ DAOs — community-governed organizations
🎮 Web3 Gaming — blockchain-based games and digital assets
🧠 AI + Web3 — decentralized AI infrastructure, agents, and data ownership
🪪 Decentralized Identity — identity and credentials controlled by users
Simple example:
Web2 → You use a platform and the platform controls your account/data.
Web3 → A wallet can act as your identity, and blockchain networks can record ownership and transactions without relying entirely on one central platform.
If you're learning Web3 for crypto/content creation, a useful roadmap is:
Blockchain → Wallets → Smart Contracts → DeFi → NFTs → DAOs → Web3 projects → On-chain research.
Key areas of Web3
🔗 Blockchain — decentralized networks such as Ethereum, Solana, and BNB Chain
💰 Cryptocurrency — BTC, ETH, stablecoins, and other tokens
🤝 DeFi — decentralized lending, trading, staking, and financial applications
🎨 NFTs — blockchain-based ownership of digital assets
🏗️ DAOs — community-governed organizations
🎮 Web3 Gaming — blockchain-based games and digital assets
🧠 AI + Web3 — decentralized AI infrastructure, agents, and data ownership
🪪 Decentralized Identity — identity and credentials controlled by users
Simple example:
Web2 → You use a platform and the platform controls your account/data.
Web3 → A wallet can act as your identity, and blockchain networks can record ownership and transactions without relying entirely on one central platform.
If you're learning Web3 for crypto/content creation, a useful roadmap is:
Blockchain → Wallets → Smart Contracts → DeFi → NFTs → DAOs → Web3 projects → On-chain research.
108
·
--
NFTs — Simple Explanation
NFT stands for Non-Fungible Token. It is a unique digital asset recorded on a blockchain. Unlike cryptocurrencies such as Bitcoin, which are generally interchangeable, each NFT can have unique properties and ownership records.
NFTs can represent:
🎨 Digital artwork
🎮 In-game items
🎵 Music and collectibles
🖼️ Digital collectibles
🎟️ Tickets or memberships
🌐 Digital assets and identities
Example: An artist can create a digital artwork and issue an NFT linked to it. The blockchain can record the token's ownership and transaction history.
NFTs can provide a way to establish verifiable digital ownership, but owning an NFT does not automatically mean owning the copyright or commercial rights to the underlying artwork. The rights depend on the specific terms provided by the creator or project.
Key terms: Blockchain → Token → Wallet → Minting →
NFTs — Simple Explanation
NFT stands for Non-Fungible Token. It is a unique digital asset recorded on a blockchain. Unlike cryptocurrencies such as Bitcoin, which are generally interchangeable, each NFT can have unique properties and ownership records.
NFTs can represent:
🎨 Digital artwork
🎮 In-game items
🎵 Music and collectibles
🖼️ Digital collectibles
🎟️ Tickets or memberships
🌐 Digital assets and identities
Example: An artist can create a digital artwork and issue an NFT linked to it. The blockchain can record the token's ownership and transaction history.
NFTs can provide a way to establish verifiable digital ownership, but owning an NFT does not automatically mean owning the copyright or commercial rights to the underlying artwork. The rights depend on the specific terms provided by the creator or project.
Key terms: Blockchain → Token → Wallet → Minting →
NFT stands for Non-Fungible Token. It is a unique digital asset recorded on a blockchain. Unlike cryptocurrencies such as Bitcoin, which are generally interchangeable, each NFT can have unique properties and ownership records.
NFTs can represent:
🎨 Digital artwork
🎮 In-game items
🎵 Music and collectibles
🖼️ Digital collectibles
🎟️ Tickets or memberships
🌐 Digital assets and identities
Example: An artist can create a digital artwork and issue an NFT linked to it. The blockchain can record the token's ownership and transaction history.
NFTs can provide a way to establish verifiable digital ownership, but owning an NFT does not automatically mean owning the copyright or commercial rights to the underlying artwork. The rights depend on the specific terms provided by the creator or project.
Key terms: Blockchain → Token → Wallet → Minting →
73
·
--
DeFi
🔥 DeFi — Decentralized Finance
DeFi (Decentralized Finance) is a blockchain-based financial ecosystem that allows people to access financial services—such as trading, lending, borrowing, and earning yield—without relying entirely on traditional banks or centralized intermediaries.
Key Areas of DeFi
🔄 DEXs — Decentralized exchanges for swapping tokens.
💰 Lending & Borrowing — Users can lend assets or borrow against collateral.
💧 Liquidity Pools — Users provide liquidity to protocols and may earn fees.
🌾 Yield Farming — Strategies designed to earn returns from DeFi activities.
🪙 Stablecoins — Crypto assets designed to track currencies such as the U.S. dollar.
🏦 Liquid Staking — Allows users to maintain liquidity while participating in staking.
📊 DeFi Analysis Framework
When researching a DeFi project, look at:
TVL + Volume + Tokenomics + Revenue + Users + Security + Narrative
Also check:
Smart-contract audits
Protocol history and exploits
Token supply/unlocks
Governance structure
Liquidity
Developer activity
⚠️ DeFi carries significant risks, including smart-contract vulnerabilities, exploits, liquidation, token volatility, and protocol failure. DYOR.
Content idea for Binance Square
“DeFi Explained: How Decentralized Finance Is Changing Crypto”
💬 What part of DeFi should I cover next—DEXs, lending, staking, liquidity pools, or yield farming?
Stablecoins
🪙 Stablecoins
Stablecoins are cryptocurrencies designed to maintain a relatively stable value, often by tracking an asset such as the U.S. dollar.
🔹 Main Types
1. Fiat-backed stablecoins
Backed by reserves such as cash or short-term government securities.
Examples include USDT and USDC.
2. Crypto-backed stablecoins
Use other crypto assets as collateral. They generally rely on overcollateralization and smart contracts.
3. Algorithmic stablecoins
Attempt to maintain their target value through algorithms and market mechanisms rather than straightforward reserve back
DeFi
🔥 DeFi — Decentralized Finance
DeFi (Decentralized Finance) is a blockchain-based financial ecosystem that allows people to access financial services—such as trading, lending, borrowing, and earning yield—without relying entirely on traditional banks or centralized intermediaries.
Key Areas of DeFi
🔄 DEXs — Decentralized exchanges for swapping tokens.
💰 Lending & Borrowing — Users can lend assets or borrow against collateral.
💧 Liquidity Pools — Users provide liquidity to protocols and may earn fees.
🌾 Yield Farming — Strategies designed to earn returns from DeFi activities.
🪙 Stablecoins — Crypto assets designed to track currencies such as the U.S. dollar.
🏦 Liquid Staking — Allows users to maintain liquidity while participating in staking.
📊 DeFi Analysis Framework
When researching a DeFi project, look at:
TVL + Volume + Tokenomics + Revenue + Users + Security + Narrative
Also check:
Smart-contract audits
Protocol history and exploits
Token supply/unlocks
Governance structure
Liquidity
Developer activity
⚠️ DeFi carries significant risks, including smart-contract vulnerabilities, exploits, liquidation, token volatility, and protocol failure. DYOR.
Content idea for Binance Square
“DeFi Explained: How Decentralized Finance Is Changing Crypto”
💬 What part of DeFi should I cover next—DEXs, lending, staking, liquidity pools, or yield farming?
Stablecoins
🪙 Stablecoins
Stablecoins are cryptocurrencies designed to maintain a relatively stable value, often by tracking an asset such as the U.S. dollar.
🔹 Main Types
1. Fiat-backed stablecoins
Backed by reserves such as cash or short-term government securities.
Examples include USDT and USDC.
2. Crypto-backed stablecoins
Use other crypto assets as collateral. They generally rely on overcollateralization and smart contracts.
3. Algorithmic stablecoins
Attempt to maintain their target value through algorithms and market mechanisms rather than straightforward reserve back
🔥 DeFi — Decentralized Finance
DeFi (Decentralized Finance) is a blockchain-based financial ecosystem that allows people to access financial services—such as trading, lending, borrowing, and earning yield—without relying entirely on traditional banks or centralized intermediaries.
Key Areas of DeFi
🔄 DEXs — Decentralized exchanges for swapping tokens.
💰 Lending & Borrowing — Users can lend assets or borrow against collateral.
💧 Liquidity Pools — Users provide liquidity to protocols and may earn fees.
🌾 Yield Farming — Strategies designed to earn returns from DeFi activities.
🪙 Stablecoins — Crypto assets designed to track currencies such as the U.S. dollar.
🏦 Liquid Staking — Allows users to maintain liquidity while participating in staking.
📊 DeFi Analysis Framework
When researching a DeFi project, look at:
TVL + Volume + Tokenomics + Revenue + Users + Security + Narrative
Also check:
Smart-contract audits
Protocol history and exploits
Token supply/unlocks
Governance structure
Liquidity
Developer activity
⚠️ DeFi carries significant risks, including smart-contract vulnerabilities, exploits, liquidation, token volatility, and protocol failure. DYOR.
Content idea for Binance Square
“DeFi Explained: How Decentralized Finance Is Changing Crypto”
💬 What part of DeFi should I cover next—DEXs, lending, staking, liquidity pools, or yield farming?
Stablecoins
🪙 Stablecoins
Stablecoins are cryptocurrencies designed to maintain a relatively stable value, often by tracking an asset such as the U.S. dollar.
🔹 Main Types
1. Fiat-backed stablecoins
Backed by reserves such as cash or short-term government securities.
Examples include USDT and USDC.
2. Crypto-backed stablecoins
Use other crypto assets as collateral. They generally rely on overcollateralization and smart contracts.
3. Algorithmic stablecoins
Attempt to maintain their target value through algorithms and market mechanisms rather than straightforward reserve back
65
·
--
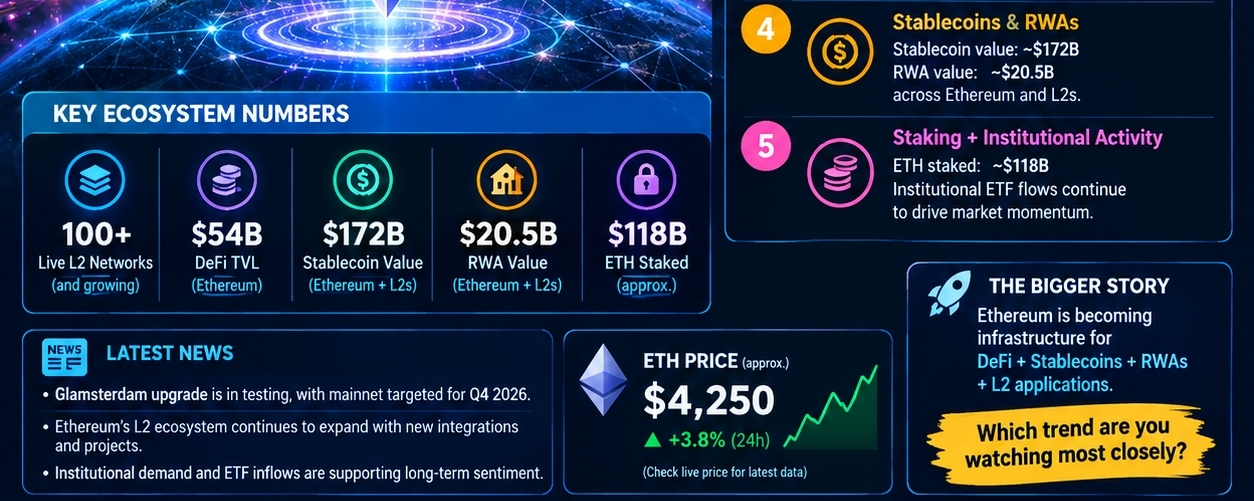
Мақала
Crypto TopicsTopics:
🔥 Bitcoin Market Update
Ethereum Ecosystem TrendsMeme Coin News & AnalysisAI + CryptoDeFi TrendsAltcoin Market AnalysisBitcoin Support & ResistanceOn-Chain Data ExplainedNew Crypto ProjectsCrypto Airdrops & Rewards
🤖 AI Topics
Latest AI ToolsAI for Content CreationAI for Affiliate MarketingAI AutomationAI AgentsAI + Digital MarketingAI Productivity ToolsBest AI Tools for CreatorsAI Video GenerationAI Graphic Design
💰 Affiliate Marketing Topics
Faceless Affiliate MarketingAI Affiliate MarketingAffiliate FunnelPinterest Affiliate MarketingX Affiliate MarketingSEO + Affiliate MarketingCPA MarketingDigital ProductsPassive Income StrategiesAI Tools for Affiliate Marketers
Ethereum Ecosystem Trends
Ethereum Ecosystem Trends — September 2026
Ethereum’s ecosystem is increasingly being shaped by L2 scaling, DeFi, stablecoins, tokenized real-world assets, staking, and protocol upgrades.
🔥 5 Key Trends
1. Layer-2 scaling
Ethereum now has 100+ live L2 networks, with L2s becoming a major part of the Ethereum execution environment.
2. Glamsterdam upgrade
Ethereum’s next major upgrade, Glamsterdam, is currently being tested on devnets and is expected on mainnet in Q4 2026, with the exact date still unconfirmed. Its focus includes improving L1 scaling and transaction processing.
3. DeFi remains a core sector
Ethereum continues to host a large share of DeFi activity. Ethereum's institutional data hub currently reports roughly $54B in DeFi TVL.
4. Stablecoins & RWAs
Stablecoins and tokenized real-world assets are becoming increasingly important Ethereum use cases. The Ethereum data hub reports about $172B in stablecoin value and $20.5B in RWAs across Ethereum and its L2 ecosystem.
5. Staking + institutional activity
Ethereum staking remains a major part of the ecosystem, with the institutional data hub showing roughly $118B in ETH staked. Institutional Ethereum ETF flows have also been an important market theme in September.
📱 X / Binance Square Post
🚀 Ethereum Ecosystem Trends — September 2026
Ethereum is evolving beyond just ETH.
Here are 5 trends shaping the ecosystem:
🔹 L2 scaling is expanding rapidly
🔹 DeFi remains a major Ethereum use case
🔹 Stablecoins are becoming a key on-chain financial layer
🔹 Tokenized RWAs are growing
🔹 Staking and institutional adoption remain important narratives
Meanwhile, Ethereum’s next major upgrade, Glamsterdam, is moving through testing, with mainnet targeted for Q4 2026.
The bigger story:
Ethereum is increasingly becoming infrastructure for DeFi + stablecoins + RWAs + L2 applications.
Which Ethereum trend are you watching most closely?
#Ethereum #ETH #DeFi #Layer2
Crypto Topics
Topics:
🔥 Bitcoin Market Update
Ethereum Ecosystem TrendsMeme Coin News & AnalysisAI + CryptoDeFi TrendsAltcoin Market AnalysisBitcoin Support & ResistanceOn-Chain Data ExplainedNew Crypto ProjectsCrypto Airdrops & Rewards
🤖 AI Topics
Latest AI ToolsAI for Content CreationAI for Affiliate MarketingAI AutomationAI AgentsAI + Digital MarketingAI Productivity ToolsBest AI Tools for CreatorsAI Video GenerationAI Graphic Design
💰 Affiliate Marketing Topics
Faceless Affiliate MarketingAI Affiliate MarketingAffiliate FunnelPinterest Affiliate MarketingX Affiliate MarketingSEO + Affiliate MarketingCPA MarketingDigital ProductsPassive Income StrategiesAI Tools for Affiliate Marketers
Ethereum Ecosystem Trends
Ethereum Ecosystem Trends — September 2026
Ethereum’s ecosystem is increasingly being shaped by L2 scaling, DeFi, stablecoins, tokenized real-world assets, staking, and protocol upgrades.
🔥 5 Key Trends
1. Layer-2 scaling
Ethereum now has 100+ live L2 networks, with L2s becoming a major part of the Ethereum execution environment.
2. Glamsterdam upgrade
Ethereum’s next major upgrade, Glamsterdam, is currently being tested on devnets and is expected on mainnet in Q4 2026, with the exact date still unconfirmed. Its focus includes improving L1 scaling and transaction processing.
3. DeFi remains a core sector
Ethereum continues to host a large share of DeFi activity. Ethereum's institutional data hub currently reports roughly $54B in DeFi TVL.
4. Stablecoins & RWAs
Stablecoins and tokenized real-world assets are becoming increasingly important Ethereum use cases. The Ethereum data hub reports about $172B in stablecoin value and $20.5B in RWAs across Ethereum and its L2 ecosystem.
5. Staking + institutional activity
Ethereum staking remains a major part of the ecosystem, with the institutional data hub showing roughly $118B in ETH staked. Institutional Ethereum ETF flows have also been an important market theme in September.
📱 X / Binance Square Post
🚀 Ethereum Ecosystem Trends — September 2026
Ethereum is evolving beyond just ETH.
Here are 5 trends shaping the ecosystem:
🔹 L2 scaling is expanding rapidly
🔹 DeFi remains a major Ethereum use case
🔹 Stablecoins are becoming a key on-chain financial layer
🔹 Tokenized RWAs are growing
🔹 Staking and institutional adoption remain important narratives
Meanwhile, Ethereum’s next major upgrade, Glamsterdam, is moving through testing, with mainnet targeted for Q4 2026.
The bigger story:
Ethereum is increasingly becoming infrastructure for DeFi + stablecoins + RWAs + L2 applications.
Which Ethereum trend are you watching most closely?
#Ethereum #ETH #DeFi #Layer2
🔥 Bitcoin Market Update
Ethereum Ecosystem TrendsMeme Coin News & AnalysisAI + CryptoDeFi TrendsAltcoin Market AnalysisBitcoin Support & ResistanceOn-Chain Data ExplainedNew Crypto ProjectsCrypto Airdrops & Rewards
🤖 AI Topics
Latest AI ToolsAI for Content CreationAI for Affiliate MarketingAI AutomationAI AgentsAI + Digital MarketingAI Productivity ToolsBest AI Tools for CreatorsAI Video GenerationAI Graphic Design
💰 Affiliate Marketing Topics
Faceless Affiliate MarketingAI Affiliate MarketingAffiliate FunnelPinterest Affiliate MarketingX Affiliate MarketingSEO + Affiliate MarketingCPA MarketingDigital ProductsPassive Income StrategiesAI Tools for Affiliate Marketers
Ethereum Ecosystem Trends
Ethereum Ecosystem Trends — September 2026
Ethereum’s ecosystem is increasingly being shaped by L2 scaling, DeFi, stablecoins, tokenized real-world assets, staking, and protocol upgrades.
🔥 5 Key Trends
1. Layer-2 scaling
Ethereum now has 100+ live L2 networks, with L2s becoming a major part of the Ethereum execution environment.
2. Glamsterdam upgrade
Ethereum’s next major upgrade, Glamsterdam, is currently being tested on devnets and is expected on mainnet in Q4 2026, with the exact date still unconfirmed. Its focus includes improving L1 scaling and transaction processing.
3. DeFi remains a core sector
Ethereum continues to host a large share of DeFi activity. Ethereum's institutional data hub currently reports roughly $54B in DeFi TVL.
4. Stablecoins & RWAs
Stablecoins and tokenized real-world assets are becoming increasingly important Ethereum use cases. The Ethereum data hub reports about $172B in stablecoin value and $20.5B in RWAs across Ethereum and its L2 ecosystem.
5. Staking + institutional activity
Ethereum staking remains a major part of the ecosystem, with the institutional data hub showing roughly $118B in ETH staked. Institutional Ethereum ETF flows have also been an important market theme in September.
📱 X / Binance Square Post
🚀 Ethereum Ecosystem Trends — September 2026
Ethereum is evolving beyond just ETH.
Here are 5 trends shaping the ecosystem:
🔹 L2 scaling is expanding rapidly
🔹 DeFi remains a major Ethereum use case
🔹 Stablecoins are becoming a key on-chain financial layer
🔹 Tokenized RWAs are growing
🔹 Staking and institutional adoption remain important narratives
Meanwhile, Ethereum’s next major upgrade, Glamsterdam, is moving through testing, with mainnet targeted for Q4 2026.
The bigger story:
Ethereum is increasingly becoming infrastructure for DeFi + stablecoins + RWAs + L2 applications.
Which Ethereum trend are you watching most closely?
#Ethereum #ETH #DeFi #Layer2
90
·
--
What is Blockchain?
Blockchain is a decentralized digital ledger that records transactions in a secure and transparent way. Transactions are grouped into blocks, and each block is connected to the previous one, creating a chain.
In simple words:
Blockchain is like a shared digital record book that many computers maintain together, making the stored information difficult to change or manipulate.#AIStocksWhatNext #DogecoinRises15% #BNBMarketCapPassesBNYMellon #blockchain
What is Blockchain?
Blockchain is a decentralized digital ledger that records transactions in a secure and transparent way. Transactions are grouped into blocks, and each block is connected to the previous one, creating a chain.
In simple words:
Blockchain is like a shared digital record book that many computers maintain together, making the stored information difficult to change or manipulate.#AIStocksWhatNext #DogecoinRises15% #BNBMarketCapPassesBNYMellon #blockchain
Blockchain is a decentralized digital ledger that records transactions in a secure and transparent way. Transactions are grouped into blocks, and each block is connected to the previous one, creating a chain.
In simple words:
Blockchain is like a shared digital record book that many computers maintain together, making the stored information difficult to change or manipulate.#AIStocksWhatNext #DogecoinRises15% #BNBMarketCapPassesBNYMellon #blockchain
22
·
--
Goal: Understand the basic concepts of Bitcoin and blockchain technology and learn why they are important in the crypto ecosystem.
📅 Day 2 — Bitcoin & Blockchain
1. Learn What Bitcoin Is
Understand:
What Bitcoin (BTC) is
Who created Bitcoin
Why Bitcoin was created
How Bitcoin transactions work
Why Bitcoin has a limited supply
2. Learn What Blockchain Is
Understand:
What a blockchain is
How transactions are recorded
What decentralization means
What miners/validators do
Why blockchain records are difficult to change
3. Understand Key Terms
Learn these basic terms:
Bitcoin (BTC)
Blockchain
Wallet
Public Address
Private Key
Transaction
Block
Mining
Validator
Decentralization
📝 Task
Write a short explanation in your own words:
“What is Bitcoin, how does blockchain work, and why is Bitcoin different from traditional money?”
🔍 Research Exercise
Choose BTC and note down:
Current price
Market cap
24-hour trading volume
Circulating supply
Maximum supply
One recent Bitcoin development#AIStocksWhatNext #TokenizedStockPlatformsCouldLaunchNextQuarter #BNBMarketCapPassesBNYMellon $DOGE
Goal: Understand the basic concepts of Bitcoin and blockchain technology and learn why they are important in the crypto ecosystem.
📅 Day 2 — Bitcoin & Blockchain
1. Learn What Bitcoin Is
Understand:
What Bitcoin (BTC) is
Who created Bitcoin
Why Bitcoin was created
How Bitcoin transactions work
Why Bitcoin has a limited supply
2. Learn What Blockchain Is
Understand:
What a blockchain is
How transactions are recorded
What decentralization means
What miners/validators do
Why blockchain records are difficult to change
3. Understand Key Terms
Learn these basic terms:
Bitcoin (BTC)
Blockchain
Wallet
Public Address
Private Key
Transaction
Block
Mining
Validator
Decentralization
📝 Task
Write a short explanation in your own words:
“What is Bitcoin, how does blockchain work, and why is Bitcoin different from traditional money?”
🔍 Research Exercise
Choose BTC and note down:
Current price
Market cap
24-hour trading volume
Circulating supply
Maximum supply
One recent Bitcoin development#AIStocksWhatNext #TokenizedStockPlatformsCouldLaunchNextQuarter #BNBMarketCapPassesBNYMellon $DOGE
📅 Day 2 — Bitcoin & Blockchain
1. Learn What Bitcoin Is
Understand:
What Bitcoin (BTC) is
Who created Bitcoin
Why Bitcoin was created
How Bitcoin transactions work
Why Bitcoin has a limited supply
2. Learn What Blockchain Is
Understand:
What a blockchain is
How transactions are recorded
What decentralization means
What miners/validators do
Why blockchain records are difficult to change
3. Understand Key Terms
Learn these basic terms:
Bitcoin (BTC)
Blockchain
Wallet
Public Address
Private Key
Transaction
Block
Mining
Validator
Decentralization
📝 Task
Write a short explanation in your own words:
“What is Bitcoin, how does blockchain work, and why is Bitcoin different from traditional money?”
🔍 Research Exercise
Choose BTC and note down:
Current price
Market cap
24-hour trading volume
Circulating supply
Maximum supply
One recent Bitcoin development#AIStocksWhatNext #TokenizedStockPlatformsCouldLaunchNextQuarter #BNBMarketCapPassesBNYMellon $DOGE
52
·
--
AI tools useful for crypto researchFor crypto research, AI is most useful when you combine it with live market and on-chain data rather than relying on AI alone. CoinGecko now provides an MCP that can connect AI tools such as Claude to real-time prices, market caps, historical data and trends.
🔎 Useful AI + Crypto Research Tools
Tool Best use
ChatGPT Summarizing news, comparing projects, creating research checklists and explaining crypto concepts
Claude + CoinGecko MCP AI research using live crypto market data
Nansen AI Smart-money wallets, token flows, address research and on-chain analysis
Arkham Investigating wallets, entities, transactions and fund flows; its platform uses AI for blockchain-data synthesis
Dune Custom on-chain dashboards and SQL-based blockchain research
DeFiLlama TVL, protocols, chains, stablecoins and DeFi activity
Messari Project research, fundamentals, reports and protocol intelligence
TradingView Price charts, indicators and technical analysis
CoinGlass Futures, open interest, funding rates and liquidation data
CoinGecko Price, market cap, volume, supply and token information
🧠 Simple AI Crypto Research Workflow
1. Market data → CoinGecko
Check:
Price
Market cap
24h volume
Circulating supply
7D/30D performance
2. Chart → TradingView
Check:
Trend
Support/resistance
Volume
RSI
Moving averages
3. On-chain → Nansen / Arkham
Check:
Whale activity
Smart-money wallets
Exchange inflows/outflows
Large transactions
4. DeFi → DeFiLlama
Check:
TVL
Protocol growth
Chain activity
Stablecoin flows
5. AI analysis → ChatGPT/Claude
Use a prompt like:
“Analyze [TOKEN] using the latest available market, on-chain and fundamental data. Check price trend, volume, market cap, supply, whale activity, exchange flows, upcoming catalysts, risks and recent news. Separate verified facts from interpretation and identify what data still needs confirmation.”
⭐ For your Binance Square research
A practical stack would be:
CoinGecko → TradingView → Nansen/Arkham → DeFiLlama → ChatGPT/Claude → Binance Square $BTC
{spot}(BTCUSDT)
AI tools useful for crypto research
For crypto research, AI is most useful when you combine it with live market and on-chain data rather than relying on AI alone. CoinGecko now provides an MCP that can connect AI tools such as Claude to real-time prices, market caps, historical data and trends.
🔎 Useful AI + Crypto Research Tools
Tool Best use
ChatGPT Summarizing news, comparing projects, creating research checklists and explaining crypto concepts
Claude + CoinGecko MCP AI research using live crypto market data
Nansen AI Smart-money wallets, token flows, address research and on-chain analysis
Arkham Investigating wallets, entities, transactions and fund flows; its platform uses AI for blockchain-data synthesis
Dune Custom on-chain dashboards and SQL-based blockchain research
DeFiLlama TVL, protocols, chains, stablecoins and DeFi activity
Messari Project research, fundamentals, reports and protocol intelligence
TradingView Price charts, indicators and technical analysis
CoinGlass Futures, open interest, funding rates and liquidation data
CoinGecko Price, market cap, volume, supply and token information
🧠 Simple AI Crypto Research Workflow
1. Market data → CoinGecko
Check:
Price
Market cap
24h volume
Circulating supply
7D/30D performance
2. Chart → TradingView
Check:
Trend
Support/resistance
Volume
RSI
Moving averages
3. On-chain → Nansen / Arkham
Check:
Whale activity
Smart-money wallets
Exchange inflows/outflows
Large transactions
4. DeFi → DeFiLlama
Check:
TVL
Protocol growth
Chain activity
Stablecoin flows
5. AI analysis → ChatGPT/Claude
Use a prompt like:
“Analyze [TOKEN] using the latest available market, on-chain and fundamental data. Check price trend, volume, market cap, supply, whale activity, exchange flows, upcoming catalysts, risks and recent news. Separate verified facts from interpretation and identify what data still needs confirmation.”
⭐ For your Binance Square research
A practical stack would be:
CoinGecko → TradingView → Nansen/Arkham → DeFiLlama → ChatGPT/Claude → Binance Square $BTC
🔎 Useful AI + Crypto Research Tools
Tool Best use
ChatGPT Summarizing news, comparing projects, creating research checklists and explaining crypto concepts
Claude + CoinGecko MCP AI research using live crypto market data
Nansen AI Smart-money wallets, token flows, address research and on-chain analysis
Arkham Investigating wallets, entities, transactions and fund flows; its platform uses AI for blockchain-data synthesis
Dune Custom on-chain dashboards and SQL-based blockchain research
DeFiLlama TVL, protocols, chains, stablecoins and DeFi activity
Messari Project research, fundamentals, reports and protocol intelligence
TradingView Price charts, indicators and technical analysis
CoinGlass Futures, open interest, funding rates and liquidation data
CoinGecko Price, market cap, volume, supply and token information
🧠 Simple AI Crypto Research Workflow
1. Market data → CoinGecko
Check:
Price
Market cap
24h volume
Circulating supply
7D/30D performance
2. Chart → TradingView
Check:
Trend
Support/resistance
Volume
RSI
Moving averages
3. On-chain → Nansen / Arkham
Check:
Whale activity
Smart-money wallets
Exchange inflows/outflows
Large transactions
4. DeFi → DeFiLlama
Check:
TVL
Protocol growth
Chain activity
Stablecoin flows
5. AI analysis → ChatGPT/Claude
Use a prompt like:
“Analyze [TOKEN] using the latest available market, on-chain and fundamental data. Check price trend, volume, market cap, supply, whale activity, exchange flows, upcoming catalysts, risks and recent news. Separate verified facts from interpretation and identify what data still needs confirmation.”
⭐ For your Binance Square research
A practical stack would be:
CoinGecko → TradingView → Nansen/Arkham → DeFiLlama → ChatGPT/Claude → Binance Square $BTC
75
·
--
Ethereum Ecosystem + Latest Market Trend
$ETH is back in focus as the crypto market shows renewed momentum.
📈 ETH: ~$2,727
🔥 24H: +2.56%
📊 7D: +8.93%
🎯 Key zone: $2,700
🚧 Resistance to watch: ~$2,800
Beyond price, the Ethereum ecosystem continues to expand:
🔹 Layer-2 scaling
🔹 DeFi growth
🔹 Stablecoins & tokenization
🔹 Institutional Ethereum adoption
🔹 Upcoming network upgrades
Ethereum's story is increasingly about more than ETH price — it's about the infrastructure being built around the network.
👀 Question:
Do you think Ethereum's ecosystem growth can become a stronger market catalyst for $ETH?
#Ethereum #crypto #DeFi #Web3
Ethereum Ecosystem + Latest Market Trend
$ETH is back in focus as the crypto market shows renewed momentum.
📈 ETH: ~$2,727
🔥 24H: +2.56%
📊 7D: +8.93%
🎯 Key zone: $2,700
🚧 Resistance to watch: ~$2,800
Beyond price, the Ethereum ecosystem continues to expand:
🔹 Layer-2 scaling
🔹 DeFi growth
🔹 Stablecoins & tokenization
🔹 Institutional Ethereum adoption
🔹 Upcoming network upgrades
Ethereum's story is increasingly about more than ETH price — it's about the infrastructure being built around the network.
👀 Question:
Do you think Ethereum's ecosystem growth can become a stronger market catalyst for $ETH?
#Ethereum #crypto #DeFi #Web3
$ETH is back in focus as the crypto market shows renewed momentum.
📈 ETH: ~$2,727
🔥 24H: +2.56%
📊 7D: +8.93%
🎯 Key zone: $2,700
🚧 Resistance to watch: ~$2,800
Beyond price, the Ethereum ecosystem continues to expand:
🔹 Layer-2 scaling
🔹 DeFi growth
🔹 Stablecoins & tokenization
🔹 Institutional Ethereum adoption
🔹 Upcoming network upgrades
Ethereum's story is increasingly about more than ETH price — it's about the infrastructure being built around the network.
👀 Question:
Do you think Ethereum's ecosystem growth can become a stronger market catalyst for $ETH?
#Ethereum #crypto #DeFi #Web3
48
·
--
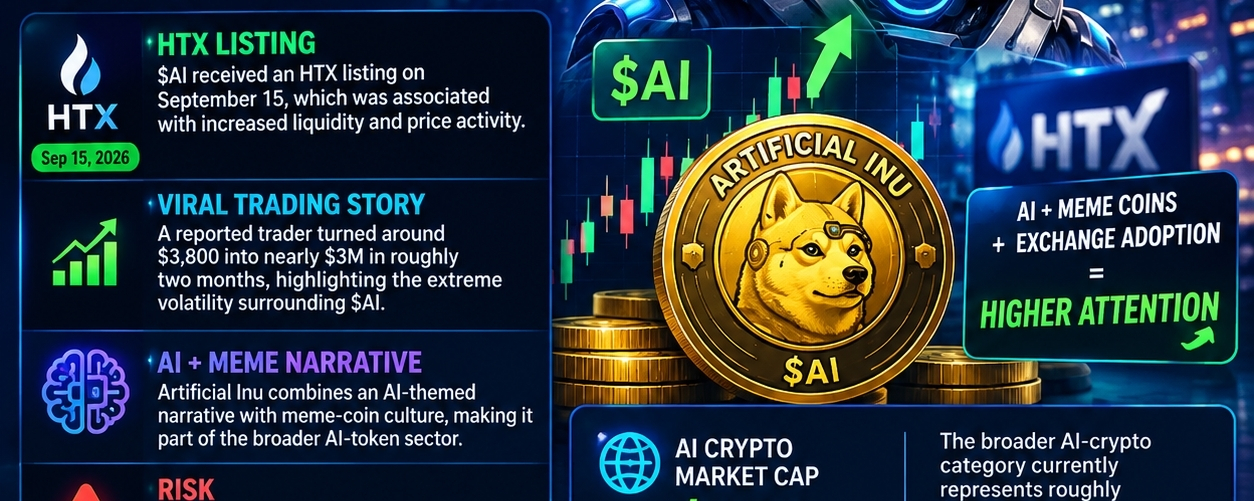
Мақала
🤖🐕 Artificial Inu ($AI) — Latest News & Market Narrative🤖🐕 Artificial Inu ($AI) — Latest Crypto Update
Artificial Inu ($AI) is back in the AI + meme-coin spotlight. 🔥
📈 Latest developments:
🏦 HTX listing: $AI received an HTX listing on September 15, which was associated with increased liquidity and price activity.🚀 Viral trading story: A reported trader turned about $3,800 into nearly $3M in roughly two months, highlighting the extreme volatility surrounding $AI.🤖 AI + meme narrative: Artificial Inu combines an AI-themed narrative with meme-coin culture, making it part of the broader AI-token sector.⚠️ Risk: The token remains highly speculative, so viral gains or exchange listings should not be treated as guarantees of future performance.
🔥 Narrative to Watch
AI + Meme Coins + Exchange Adoption = Higher Attention
The broader AI-crypto category currently represents roughly $22B in market capitalization, showing that AI remains a significant crypto narrative.
Question:
Do you think $AI can maintain its momentum, or will meme-coin hype cool down? 👇
#AI #ArtificialInu #Crypto #MemeCoin #AICrypto Artificial Inu ($AI) is getting renewed attention as an AI-themed meme coin linked to the Robinhood Chain ecosystem. Its current narrative is unusual: $AI is paired with a tokenized NVIDIA ($NVDA) asset, while the project says trading activity contributes to its on-chain vault and fees are burned or locked.
🔥 Latest Developments
🏦 HTX Listing
HTX announced AINVDA/USDT spot trading on September 14, 2026. The listing increased accessibility for traders and became an important catalyst in the recent $AI narrative.
📈 Strong Volatility
CoinMarketCap reported that $AI had recently experienced a major rally followed by profit-taking. Its September 19 analysis described support around $0.30 and a possible lower area around $0.28 if that support failed. These levels are market observations, not guarantees.
💰 Viral Trading Story
A reported trader turned roughly $3,800 into nearly $3 million during a rapid rise in the token. Such individual results are exceptional and shouldn't be interpreted as typical returns.
🧠 Why $AI Is Interesting
The narrative combines:
AI branding + Meme Culture + Tokenized NVDA + Robinhood Chain + Community Trading
That combination has helped Artificial Inu stand out among newer Robinhood Chain memecoins.
⚠️ Risk Reminder: $AI remains a highly speculative memecoin. Exchange listings, viral gains and strong volume can increase attention, but they don't guarantee future performance.
What do you think? 👇
Is Artificial Inu's AI + NVDA + meme narrative sustainable, or is this mainly short-term speculation?
#ArtificialInu #AI #AICrypto #MemeCoin
🤖🐕 Artificial Inu ($AI) — Latest News & Market Narrative
🤖🐕 Artificial Inu ($AI) — Latest Crypto Update
Artificial Inu ($AI) is back in the AI + meme-coin spotlight. 🔥
📈 Latest developments:
🏦 HTX listing: $AI received an HTX listing on September 15, which was associated with increased liquidity and price activity.🚀 Viral trading story: A reported trader turned about $3,800 into nearly $3M in roughly two months, highlighting the extreme volatility surrounding $AI.🤖 AI + meme narrative: Artificial Inu combines an AI-themed narrative with meme-coin culture, making it part of the broader AI-token sector.⚠️ Risk: The token remains highly speculative, so viral gains or exchange listings should not be treated as guarantees of future performance.
🔥 Narrative to Watch
AI + Meme Coins + Exchange Adoption = Higher Attention
The broader AI-crypto category currently represents roughly $22B in market capitalization, showing that AI remains a significant crypto narrative.
Question:
Do you think $AI can maintain its momentum, or will meme-coin hype cool down? 👇
#AI #ArtificialInu #Crypto #MemeCoin #AICrypto Artificial Inu ($AI) is getting renewed attention as an AI-themed meme coin linked to the Robinhood Chain ecosystem. Its current narrative is unusual: $AI is paired with a tokenized NVIDIA ($NVDA) asset, while the project says trading activity contributes to its on-chain vault and fees are burned or locked.
🔥 Latest Developments
🏦 HTX Listing
HTX announced AINVDA/USDT spot trading on September 14, 2026. The listing increased accessibility for traders and became an important catalyst in the recent $AI narrative.
📈 Strong Volatility
CoinMarketCap reported that $AI had recently experienced a major rally followed by profit-taking. Its September 19 analysis described support around $0.30 and a possible lower area around $0.28 if that support failed. These levels are market observations, not guarantees.
💰 Viral Trading Story
A reported trader turned roughly $3,800 into nearly $3 million during a rapid rise in the token. Such individual results are exceptional and shouldn't be interpreted as typical returns.
🧠 Why $AI Is Interesting
The narrative combines:
AI branding + Meme Culture + Tokenized NVDA + Robinhood Chain + Community Trading
That combination has helped Artificial Inu stand out among newer Robinhood Chain memecoins.
⚠️ Risk Reminder: $AI remains a highly speculative memecoin. Exchange listings, viral gains and strong volume can increase attention, but they don't guarantee future performance.
What do you think? 👇
Is Artificial Inu's AI + NVDA + meme narrative sustainable, or is this mainly short-term speculation?
#ArtificialInu #AI #AICrypto #MemeCoin
Artificial Inu ($AI) is back in the AI + meme-coin spotlight. 🔥
📈 Latest developments:
🏦 HTX listing: $AI received an HTX listing on September 15, which was associated with increased liquidity and price activity.🚀 Viral trading story: A reported trader turned about $3,800 into nearly $3M in roughly two months, highlighting the extreme volatility surrounding $AI.🤖 AI + meme narrative: Artificial Inu combines an AI-themed narrative with meme-coin culture, making it part of the broader AI-token sector.⚠️ Risk: The token remains highly speculative, so viral gains or exchange listings should not be treated as guarantees of future performance.
🔥 Narrative to Watch
AI + Meme Coins + Exchange Adoption = Higher Attention
The broader AI-crypto category currently represents roughly $22B in market capitalization, showing that AI remains a significant crypto narrative.
Question:
Do you think $AI can maintain its momentum, or will meme-coin hype cool down? 👇
#AI #ArtificialInu #Crypto #MemeCoin #AICrypto Artificial Inu ($AI) is getting renewed attention as an AI-themed meme coin linked to the Robinhood Chain ecosystem. Its current narrative is unusual: $AI is paired with a tokenized NVIDIA ($NVDA) asset, while the project says trading activity contributes to its on-chain vault and fees are burned or locked.
🔥 Latest Developments
🏦 HTX Listing
HTX announced AINVDA/USDT spot trading on September 14, 2026. The listing increased accessibility for traders and became an important catalyst in the recent $AI narrative.
📈 Strong Volatility
CoinMarketCap reported that $AI had recently experienced a major rally followed by profit-taking. Its September 19 analysis described support around $0.30 and a possible lower area around $0.28 if that support failed. These levels are market observations, not guarantees.
💰 Viral Trading Story
A reported trader turned roughly $3,800 into nearly $3 million during a rapid rise in the token. Such individual results are exceptional and shouldn't be interpreted as typical returns.
🧠 Why $AI Is Interesting
The narrative combines:
AI branding + Meme Culture + Tokenized NVDA + Robinhood Chain + Community Trading
That combination has helped Artificial Inu stand out among newer Robinhood Chain memecoins.
⚠️ Risk Reminder: $AI remains a highly speculative memecoin. Exchange listings, viral gains and strong volume can increase attention, but they don't guarantee future performance.
What do you think? 👇
Is Artificial Inu's AI + NVDA + meme narrative sustainable, or is this mainly short-term speculation?
#ArtificialInu #AI #AICrypto #MemeCoin
227
·
--
🎭 🐸 PEPE Price Action + Meme-Coin Narrative
PEPE is back in focus as meme-coin momentum returns. 🔥
📊 Price Action: PEPE is trading around $0.000004, with recent data showing strong weekly momentum and elevated trading volume. CoinMarketCap reported PEPE up about 15% over 7 days, while 24-hour volume was around $539M.
🎯 Key Levels to Watch
🟢 Support: ~$0.00000380
🔴 Resistance: ~$0.00000420
📈 A sustained move above resistance with strong volume could signal continued momentum.
⚠️ A loss of support could bring a deeper pullback into focus.
🐸 Meme-Coin Narrative:
PEPE's recent move is happening alongside renewed strength across major meme coins such as DOGE, WIF and BONK. The current narrative is being driven largely by sector rotation, trading activity and social sentiment, rather than a single confirmed PEPE-specific catalyst.
My Take:
For PEPE, watch price + volume + meme-sector momentum together. A strong price move without sustained volume can be less convincing.
Do you think PEPE can break $0.00000420? 🐸👇
#PEPE #MemeCoin #crypto #altcoins $PEPE
{spot}(PEPEUSDT)
🎭 🐸 PEPE Price Action + Meme-Coin Narrative
PEPE is back in focus as meme-coin momentum returns. 🔥
📊 Price Action: PEPE is trading around $0.000004, with recent data showing strong weekly momentum and elevated trading volume. CoinMarketCap reported PEPE up about 15% over 7 days, while 24-hour volume was around $539M.
🎯 Key Levels to Watch
🟢 Support: ~$0.00000380
🔴 Resistance: ~$0.00000420
📈 A sustained move above resistance with strong volume could signal continued momentum.
⚠️ A loss of support could bring a deeper pullback into focus.
🐸 Meme-Coin Narrative:
PEPE's recent move is happening alongside renewed strength across major meme coins such as DOGE, WIF and BONK. The current narrative is being driven largely by sector rotation, trading activity and social sentiment, rather than a single confirmed PEPE-specific catalyst.
My Take:
For PEPE, watch price + volume + meme-sector momentum together. A strong price move without sustained volume can be less convincing.
Do you think PEPE can break $0.00000420? 🐸👇
#PEPE #MemeCoin #crypto #altcoins $PEPE
PEPE is back in focus as meme-coin momentum returns. 🔥
📊 Price Action: PEPE is trading around $0.000004, with recent data showing strong weekly momentum and elevated trading volume. CoinMarketCap reported PEPE up about 15% over 7 days, while 24-hour volume was around $539M.
🎯 Key Levels to Watch
🟢 Support: ~$0.00000380
🔴 Resistance: ~$0.00000420
📈 A sustained move above resistance with strong volume could signal continued momentum.
⚠️ A loss of support could bring a deeper pullback into focus.
🐸 Meme-Coin Narrative:
PEPE's recent move is happening alongside renewed strength across major meme coins such as DOGE, WIF and BONK. The current narrative is being driven largely by sector rotation, trading activity and social sentiment, rather than a single confirmed PEPE-specific catalyst.
My Take:
For PEPE, watch price + volume + meme-sector momentum together. A strong price move without sustained volume can be less convincing.
Do you think PEPE can break $0.00000420? 🐸👇
#PEPE #MemeCoin #crypto #altcoins $PEPE
123
Көбірек контент көру үшін кіріңіз
Binance Square платформасында әлемдік криптоқоғамдастыққа қосылыңыз
⚡️ Криптовалюта туралы ең соңғы және пайдалы ақпаратты алыңыз.
💬 Әлемдегі ең ірі криптобиржаның сеніміне ие.
👍 Расталған авторлардың нақты пікірлерін табыңыз.
Электрондық пошта/телефон нөмірі
Трендтегі тақырыптар
BitcoinParesGainsAfterRallyTo$86.5K
8,684 рет көрілді
55 адам талқылап жатыр
🔥 $BTC on the Edge: $86K Showdown!
Nurul Hasnat Samir
·0 лайк
·136 рет көрілді
CerebrasSinksNearly20%OnReportNvidiaToPowerOpenAI
18,231 рет көрілді
254 адам талқылап жатыр
SECProposesCryptoCustodyRules
43,581 рет көрілді
425 адам талқылап жатыр