
#tradingeducation
tradingeducation
149,763 views
1,099 Discussing
Hot
Latest

Liquidity and price action · Lesson 13
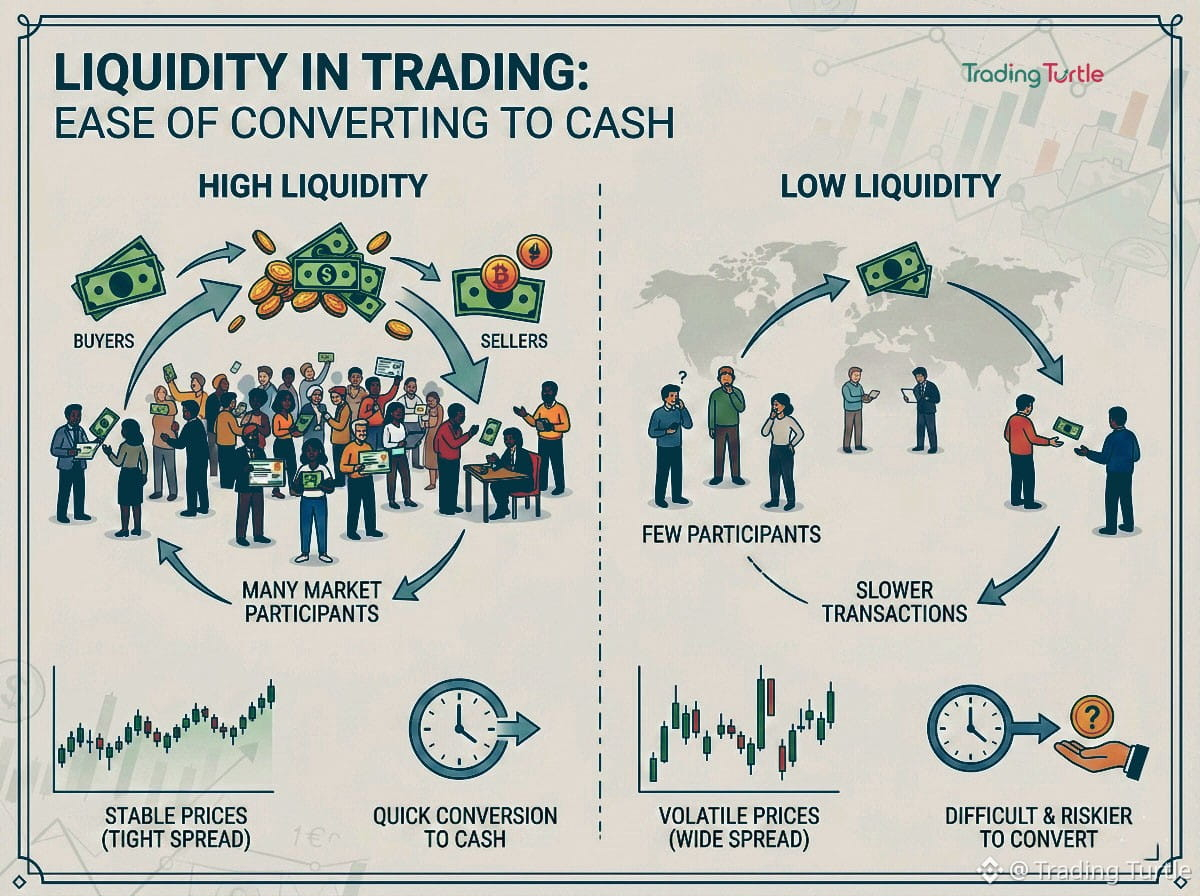
Liquidity and execution quality
A quoted price can hide how difficult it is to execute a whole order.
Liquidity describes the market’s ability to absorb buying and selling without large price changes. Highly liquid markets usually have tighter spreads and deeper books, while illiquid markets can produce larger slippage and sharper reactions. Traders should evaluate liquidity in relation to their own order size and timeframe rather than assuming a market is simply liquid or illiquid.
Imagine a market that looks active but has little quantity near the best quote. A larger order may cross several levels to fill.
Describe how the quantity available near the quote changes the quality of a hypothetical execution.
Next in this series: Support, resistance and reaction zones.
#TradingEducation #PriceAction #RiskManagement #TradingTurtle
Liquidity and price action · Lesson 13
Liquidity and execution quality
A quoted price can hide how difficult it is to execute a whole order.
Liquidity describes the market’s ability to absorb buying and selling without large price changes. Highly liquid markets usually have tighter spreads and deeper books, while illiquid markets can produce larger slippage and sharper reactions. Traders should evaluate liquidity in relation to their own order size and timeframe rather than assuming a market is simply liquid or illiquid.
Imagine a market that looks active but has little quantity near the best quote. A larger order may cross several levels to fill.
Describe how the quantity available near the quote changes the quality of a hypothetical execution.
Next in this series: Support, resistance and reaction zones.
#TradingEducation #PriceAction #RiskManagement #TradingTurtle
Liquidity and execution quality
A quoted price can hide how difficult it is to execute a whole order.
Liquidity describes the market’s ability to absorb buying and selling without large price changes. Highly liquid markets usually have tighter spreads and deeper books, while illiquid markets can produce larger slippage and sharper reactions. Traders should evaluate liquidity in relation to their own order size and timeframe rather than assuming a market is simply liquid or illiquid.
Imagine a market that looks active but has little quantity near the best quote. A larger order may cross several levels to fill.
Describe how the quantity available near the quote changes the quality of a hypothetical execution.
Next in this series: Support, resistance and reaction zones.
#TradingEducation #PriceAction #RiskManagement #TradingTurtle
60

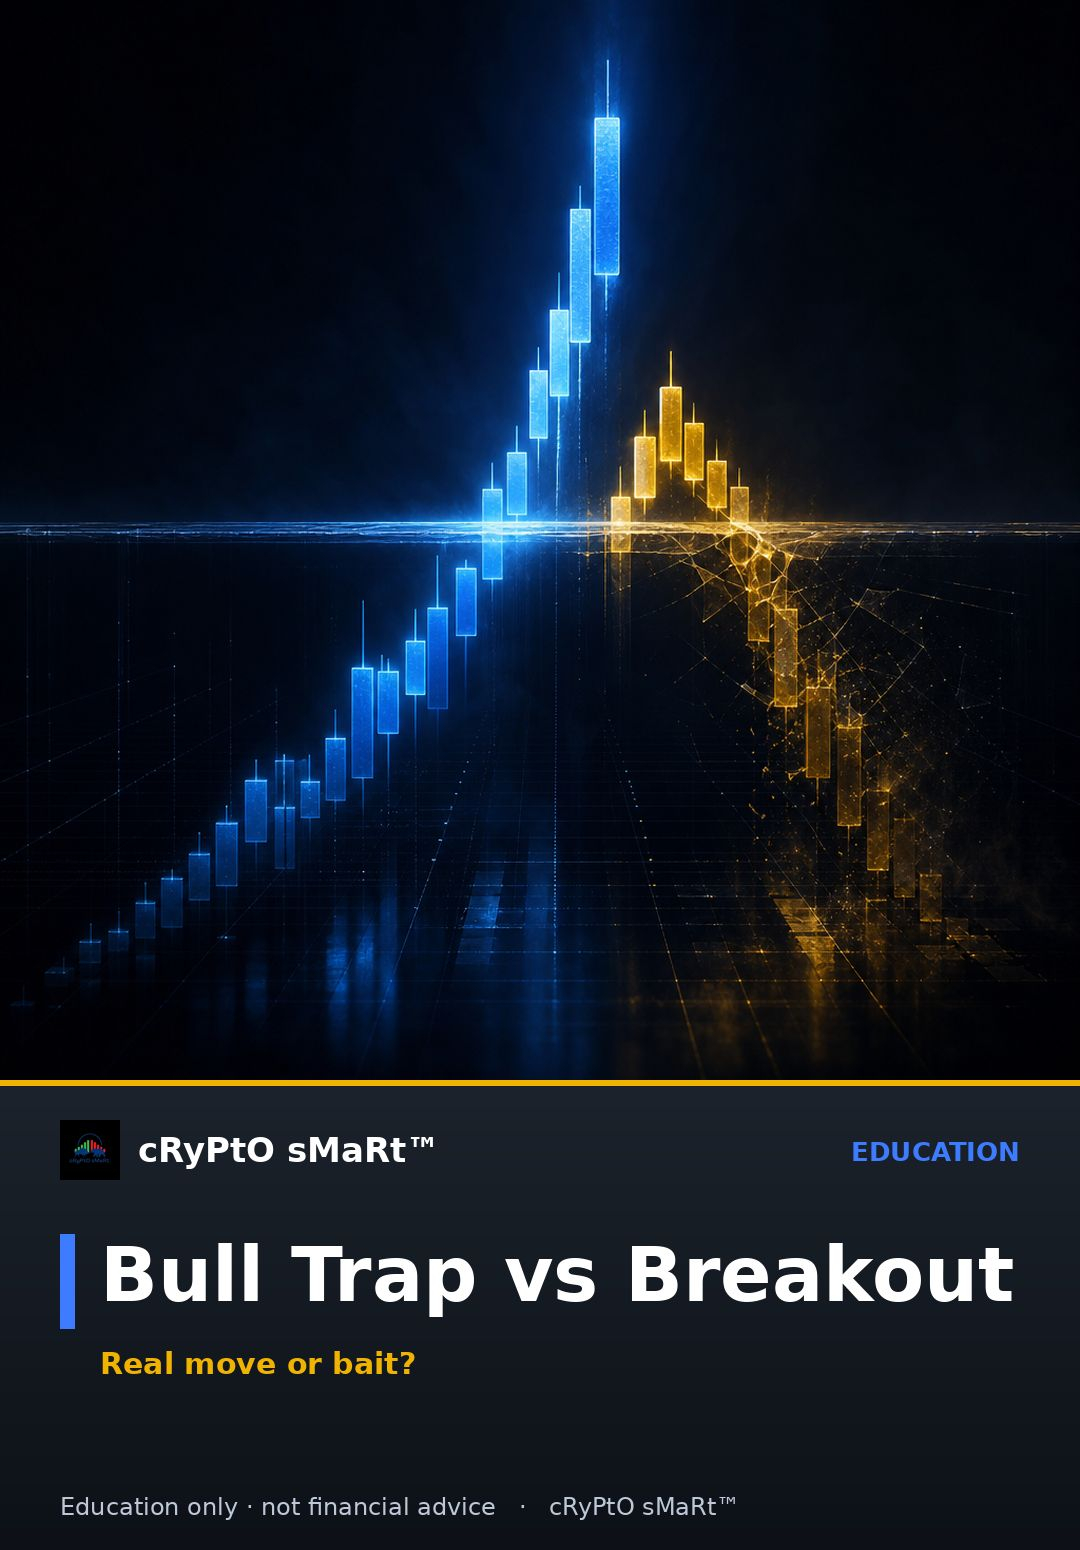
The most expensive mistake beginners make: buying the second price pokes above resistance, no questions asked.
Here's the fix. A genuine breakout is backed by volume expansion and a clean hold above the level — price pushes through and stays there, maybe pulling back to retest the old resistance as new support. A bull trap looks identical for the first few candles, then volume dries up, price stalls, and it slices back below the level fast, trapping everyone who chased it.
Watch what happens on the retest, not the breakout candle itself. That's where the truth shows up.
What's your rule for confirming a breakout before you act on it?
$SOL $XRP $ADA #Trading #TradingEducation #Crypto #TA
Follow for daily trading education · Education only, not financial advice.
The most expensive mistake beginners make: buying the second price pokes above resistance, no questions asked.
Here's the fix. A genuine breakout is backed by volume expansion and a clean hold above the level — price pushes through and stays there, maybe pulling back to retest the old resistance as new support. A bull trap looks identical for the first few candles, then volume dries up, price stalls, and it slices back below the level fast, trapping everyone who chased it.
Watch what happens on the retest, not the breakout candle itself. That's where the truth shows up.
What's your rule for confirming a breakout before you act on it?
$SOL $XRP $ADA #Trading #TradingEducation #Crypto #TA
Follow for daily trading education · Education only, not financial advice.
Here's the fix. A genuine breakout is backed by volume expansion and a clean hold above the level — price pushes through and stays there, maybe pulling back to retest the old resistance as new support. A bull trap looks identical for the first few candles, then volume dries up, price stalls, and it slices back below the level fast, trapping everyone who chased it.
Watch what happens on the retest, not the breakout candle itself. That's where the truth shows up.
What's your rule for confirming a breakout before you act on it?
$SOL $XRP $ADA #Trading #TradingEducation #Crypto #TA
Follow for daily trading education · Education only, not financial advice.
145

How to Read Candlestick Patterns for Beginners
Candlesticks tell a story in every wick and body. A long lower wick can signal buyers stepping in; a long upper wick can mean sellers rejected higher prices. Start by learning doji, hammer, and engulfing patterns — then practice spotting them on live charts. Which pattern do you rely on most when entering a trade?
{future}(BITOUSDT)
#TechnicalAnalysis #CryptoTips #CandlestickStrategies #tradingeducation
How to Read Candlestick Patterns for Beginners
Candlesticks tell a story in every wick and body. A long lower wick can signal buyers stepping in; a long upper wick can mean sellers rejected higher prices. Start by learning doji, hammer, and engulfing patterns — then practice spotting them on live charts. Which pattern do you rely on most when entering a trade?
#TechnicalAnalysis #CryptoTips #CandlestickStrategies #tradingeducation
Candlesticks tell a story in every wick and body. A long lower wick can signal buyers stepping in; a long upper wick can mean sellers rejected higher prices. Start by learning doji, hammer, and engulfing patterns — then practice spotting them on live charts. Which pattern do you rely on most when entering a trade?
#TechnicalAnalysis #CryptoTips #CandlestickStrategies #tradingeducation
41
Risk management · Lesson 10
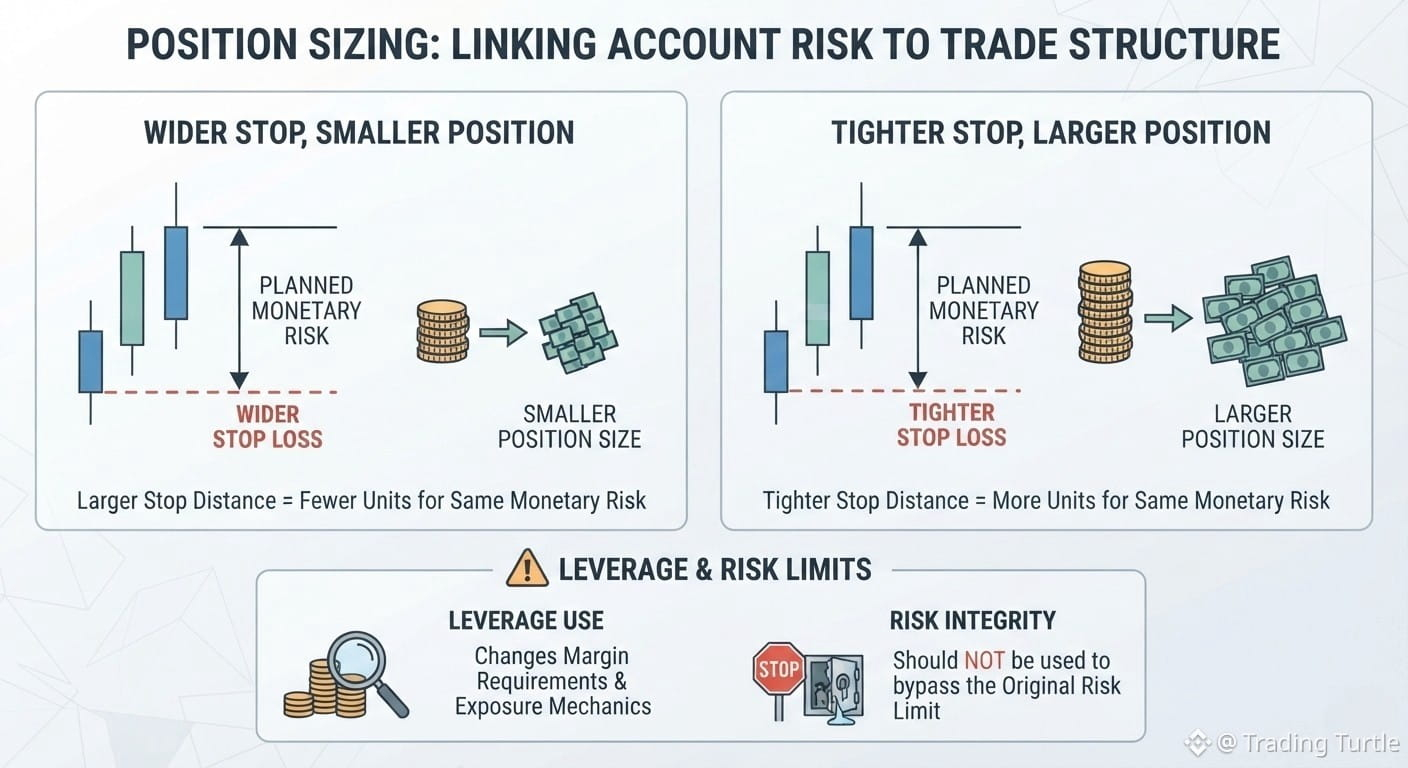
Position sizing
A wider stop changes the meaning of the same position size.
Position sizing links account risk to trade structure. A wider stop generally requires a smaller position for the same planned monetary risk, while a tighter stop permits a larger position only if the tighter invalidation is technically justified. Leverage changes margin requirements and exposure mechanics, but it should not be used to bypass the original risk limit.
Imagine the distance to invalidation widens while the risk budget stays fixed. Position size must respond to that distance rather than being chosen independently.
Explain how a change in stop distance affects size when the planned risk budget is unchanged. Include fees and execution uncertainty.
Next in this series: Risk-reward and expectancy.
#TradingEducation #PriceAction #RiskManagement #TradingTurtle
Risk management · Lesson 10
Position sizing
A wider stop changes the meaning of the same position size.
Position sizing links account risk to trade structure. A wider stop generally requires a smaller position for the same planned monetary risk, while a tighter stop permits a larger position only if the tighter invalidation is technically justified. Leverage changes margin requirements and exposure mechanics, but it should not be used to bypass the original risk limit.
Imagine the distance to invalidation widens while the risk budget stays fixed. Position size must respond to that distance rather than being chosen independently.
Explain how a change in stop distance affects size when the planned risk budget is unchanged. Include fees and execution uncertainty.
Next in this series: Risk-reward and expectancy.
#TradingEducation #PriceAction #RiskManagement #TradingTurtle
Position sizing
A wider stop changes the meaning of the same position size.
Position sizing links account risk to trade structure. A wider stop generally requires a smaller position for the same planned monetary risk, while a tighter stop permits a larger position only if the tighter invalidation is technically justified. Leverage changes margin requirements and exposure mechanics, but it should not be used to bypass the original risk limit.
Imagine the distance to invalidation widens while the risk budget stays fixed. Position size must respond to that distance rather than being chosen independently.
Explain how a change in stop distance affects size when the planned risk budget is unchanged. Include fees and execution uncertainty.
Next in this series: Risk-reward and expectancy.
#TradingEducation #PriceAction #RiskManagement #TradingTurtle
53
Beginners think blowing up an account takes one terrible trade. It doesn't. It takes four boring habits repeated until the damage adds up: overtrading out of boredom, skipping a stop because "this one feels right," widening that stop when price disagrees with you, and revenge trading to win back what the last loss took. None of these look reckless in the moment. Each one feels like a small, reasonable exception. That's exactly why they're dangerous — they never feel like the mistake until the balance shows it.
This week, track every time you break your own rule and note the excuse you gave yourself in that second.
Which of these four shows up most in your trading?
$AVAX $LINK $TRX #Trading #TradingEducation #Crypto #TA
Follow for daily trading education · Education only, not financial advice.
Beginners think blowing up an account takes one terrible trade. It doesn't. It takes four boring habits repeated until the damage adds up: overtrading out of boredom, skipping a stop because "this one feels right," widening that stop when price disagrees with you, and revenge trading to win back what the last loss took. None of these look reckless in the moment. Each one feels like a small, reasonable exception. That's exactly why they're dangerous — they never feel like the mistake until the balance shows it.
This week, track every time you break your own rule and note the excuse you gave yourself in that second.
Which of these four shows up most in your trading?
$AVAX $LINK $TRX #Trading #TradingEducation #Crypto #TA
Follow for daily trading education · Education only, not financial advice.
This week, track every time you break your own rule and note the excuse you gave yourself in that second.
Which of these four shows up most in your trading?
$AVAX $LINK $TRX #Trading #TradingEducation #Crypto #TA
Follow for daily trading education · Education only, not financial advice.

65
Risk management · Lesson 9
Risk per trade
An appealing setup can distract from the amount of capital exposed if it fails.
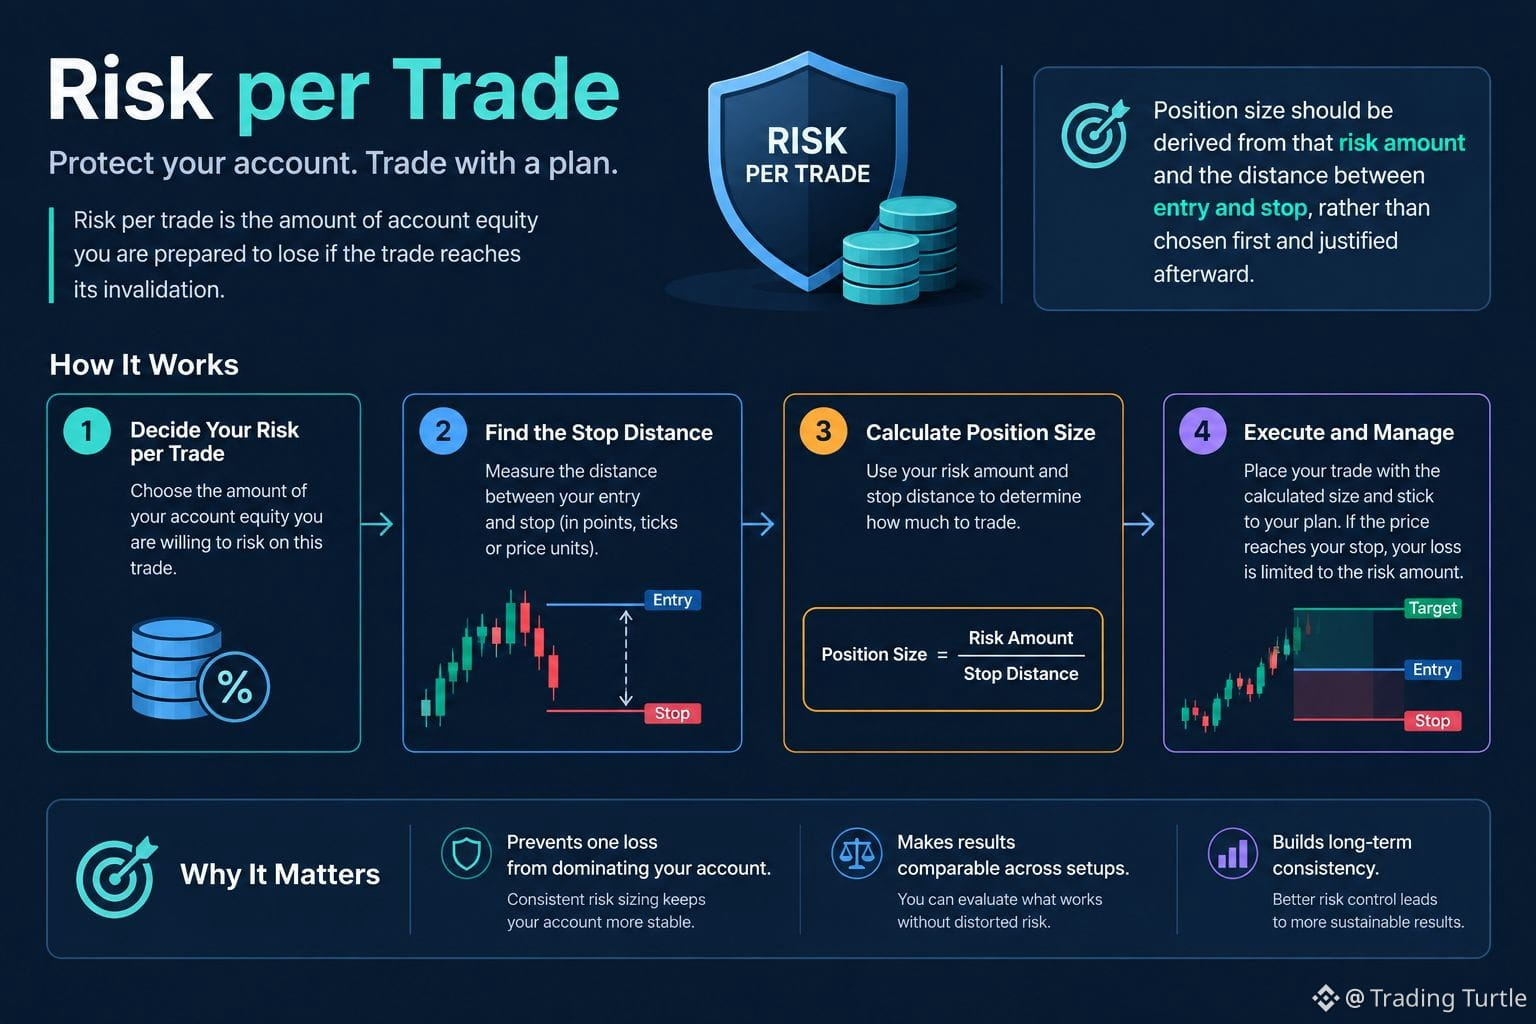
Risk per trade is the amount of account equity a trader is prepared to lose if the trade reaches its invalidation. Position size should be derived from that risk amount and the distance between entry and stop, rather than chosen first and justified afterward. Consistent risk sizing helps keep one losing trade from dominating the account and makes results easier to compare across setups.
Compare two hypothetical trades with different stop distances. Equal position sizes do not necessarily expose equal amounts of capital.
Describe the loss your plan is designed around before discussing potential reward. State what could make the realised loss worse.
Next in this series: Position sizing.
#TradingEducation #PriceAction #RiskManagement #TradingTurtle
Risk management · Lesson 9
Risk per trade
An appealing setup can distract from the amount of capital exposed if it fails.
Risk per trade is the amount of account equity a trader is prepared to lose if the trade reaches its invalidation. Position size should be derived from that risk amount and the distance between entry and stop, rather than chosen first and justified afterward. Consistent risk sizing helps keep one losing trade from dominating the account and makes results easier to compare across setups.
Compare two hypothetical trades with different stop distances. Equal position sizes do not necessarily expose equal amounts of capital.
Describe the loss your plan is designed around before discussing potential reward. State what could make the realised loss worse.
Next in this series: Position sizing.
#TradingEducation #PriceAction #RiskManagement #TradingTurtle
Risk per trade
An appealing setup can distract from the amount of capital exposed if it fails.
Risk per trade is the amount of account equity a trader is prepared to lose if the trade reaches its invalidation. Position size should be derived from that risk amount and the distance between entry and stop, rather than chosen first and justified afterward. Consistent risk sizing helps keep one losing trade from dominating the account and makes results easier to compare across setups.
Compare two hypothetical trades with different stop distances. Equal position sizes do not necessarily expose equal amounts of capital.
Describe the loss your plan is designed around before discussing potential reward. State what could make the realised loss worse.
Next in this series: Position sizing.
#TradingEducation #PriceAction #RiskManagement #TradingTurtle
1

·
--
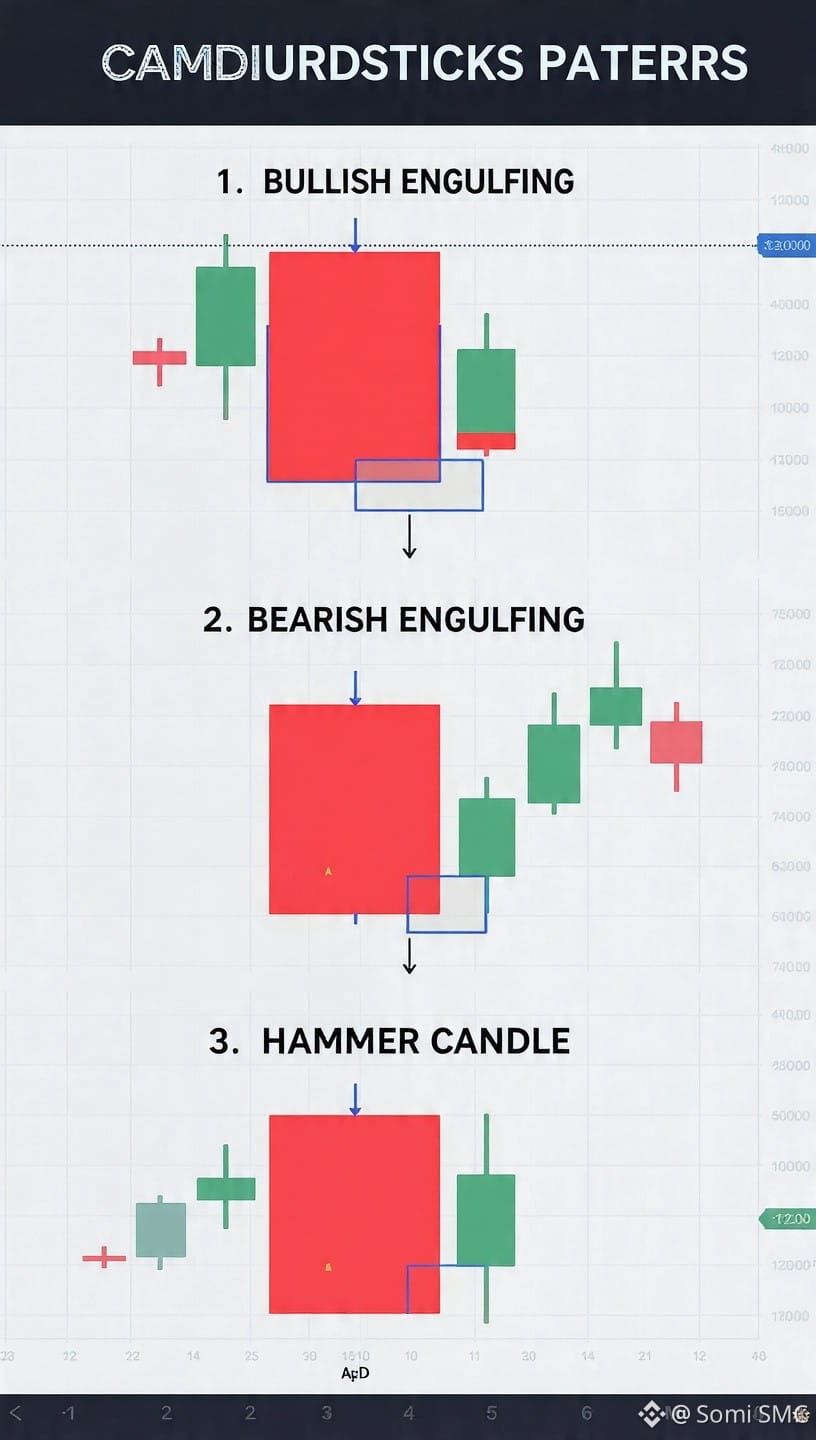
These 3 Candles Print Money in SMC 👇
In SMC, we don't guess. We wait for confirmation.
Here are the 3 candlestick patterns that tell you "Entry is valid"
1. BULLISH ENGULFING
What it means: Buyers took full control.
When to use: At Order Block after Sell Side Sweep.
2. BEARISH ENGULFING
What it means: Sellers took full control.
When to use: At Order Block after Buy Side Sweep.
3. HAMMER / SHOOTING STAR
What it means: Rejection from a level.
When to use: At OB or FVG.
---
RULE:
No Confirmation Candle = No Entry.
Wait for it. Be patient.
Which candle do you use the most? Comment 1, 2, or 3 👇
#CandlestickPatterns #SMC #TradingEducation #BinanceSquare #CryptoTrading.
These 3 Candles Print Money in SMC 👇
In SMC, we don't guess. We wait for confirmation.
Here are the 3 candlestick patterns that tell you "Entry is valid"
1. BULLISH ENGULFING
What it means: Buyers took full control.
When to use: At Order Block after Sell Side Sweep.
2. BEARISH ENGULFING
What it means: Sellers took full control.
When to use: At Order Block after Buy Side Sweep.
3. HAMMER / SHOOTING STAR
What it means: Rejection from a level.
When to use: At OB or FVG.
---
RULE:
No Confirmation Candle = No Entry.
Wait for it. Be patient.
Which candle do you use the most? Comment 1, 2, or 3 👇
#CandlestickPatterns #SMC #TradingEducation #BinanceSquare #CryptoTrading.
In SMC, we don't guess. We wait for confirmation.
Here are the 3 candlestick patterns that tell you "Entry is valid"
1. BULLISH ENGULFING
What it means: Buyers took full control.
When to use: At Order Block after Sell Side Sweep.
2. BEARISH ENGULFING
What it means: Sellers took full control.
When to use: At Order Block after Buy Side Sweep.
3. HAMMER / SHOOTING STAR
What it means: Rejection from a level.
When to use: At OB or FVG.
---
RULE:
No Confirmation Candle = No Entry.
Wait for it. Be patient.
Which candle do you use the most? Comment 1, 2, or 3 👇
#CandlestickPatterns #SMC #TradingEducation #BinanceSquare #CryptoTrading.
1
45
Orders and execution · Lesson 7
Stop orders and invalidation
A stop trigger and the final exit price are separate events.
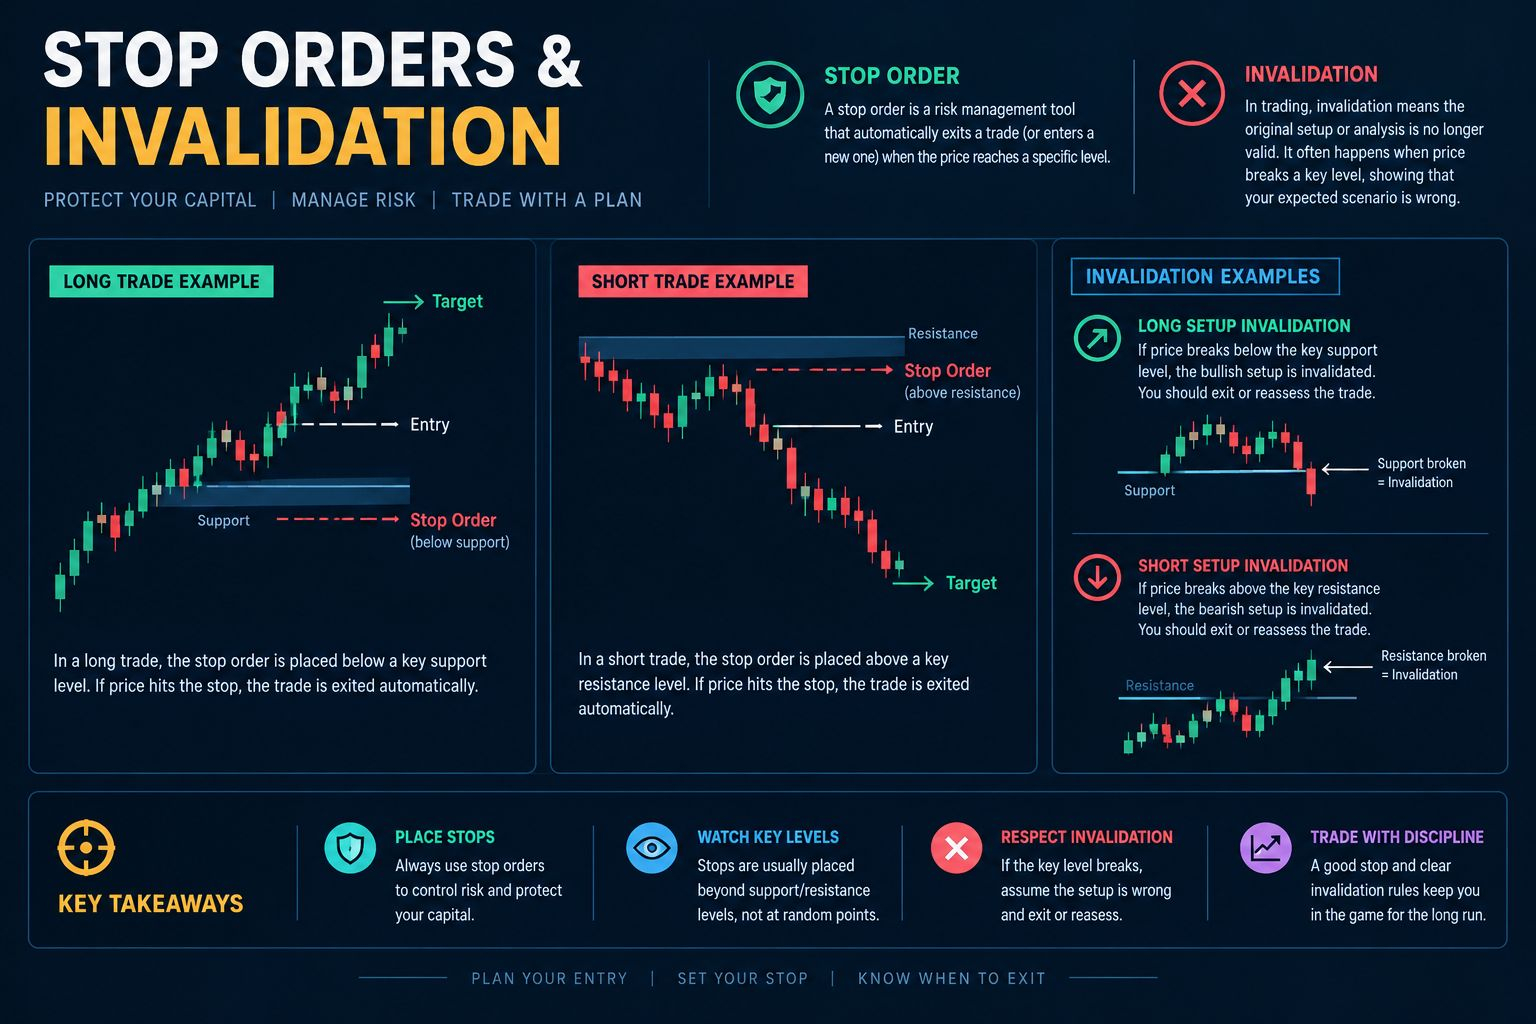
A stop order becomes active after a trigger condition is met. Traders often use stops to define where a trade idea is no longer valid, but the trigger does not guarantee the final fill price during gaps or fast markets. Good risk planning separates the analytical invalidation level from the amount of capital that can be lost if execution is worse than expected.
Imagine price gaps through a trigger during a fast market. The stop activates, but execution can occur beyond the level used in the original plan.
Write down the difference between invalidating an idea and guaranteeing an exit price. Explain why execution risk belongs in a plan.
Next in this series: Order book, spread and depth.
#TradingEducation #PriceAction #RiskManagement #TradingTurtle
Orders and execution · Lesson 7
Stop orders and invalidation
A stop trigger and the final exit price are separate events.
A stop order becomes active after a trigger condition is met. Traders often use stops to define where a trade idea is no longer valid, but the trigger does not guarantee the final fill price during gaps or fast markets. Good risk planning separates the analytical invalidation level from the amount of capital that can be lost if execution is worse than expected.
Imagine price gaps through a trigger during a fast market. The stop activates, but execution can occur beyond the level used in the original plan.
Write down the difference between invalidating an idea and guaranteeing an exit price. Explain why execution risk belongs in a plan.
Next in this series: Order book, spread and depth.
#TradingEducation #PriceAction #RiskManagement #TradingTurtle
Stop orders and invalidation
A stop trigger and the final exit price are separate events.
A stop order becomes active after a trigger condition is met. Traders often use stops to define where a trade idea is no longer valid, but the trigger does not guarantee the final fill price during gaps or fast markets. Good risk planning separates the analytical invalidation level from the amount of capital that can be lost if execution is worse than expected.
Imagine price gaps through a trigger during a fast market. The stop activates, but execution can occur beyond the level used in the original plan.
Write down the difference between invalidating an idea and guaranteeing an exit price. Explain why execution risk belongs in a plan.
Next in this series: Order book, spread and depth.
#TradingEducation #PriceAction #RiskManagement #TradingTurtle
25
Orders and execution · Lesson 5
Market orders
Getting an immediate fill and getting the price you expected are different things.
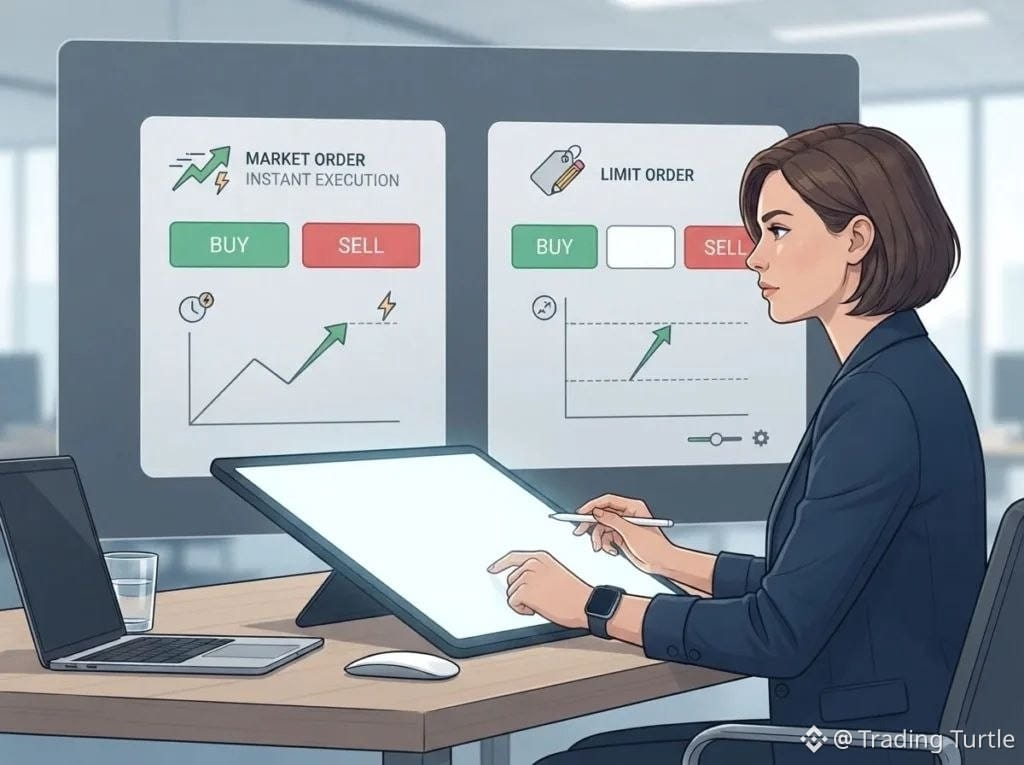
A market order prioritizes execution over exact price. It normally fills against available liquidity in the order book, which means the final average fill can differ from the last displayed price when the market moves quickly or depth is thin. This difference is slippage. Market orders can be useful when execution matters more than price precision, but they should not be treated as price guarantees.
Imagine available sell orders near the displayed price are thin. A market buy can fill across several prices, so the average differs from the screen price you first saw.
Explain the difference between the displayed price and the average execution price, using a historical or simulated order book.
Next in this series: Limit orders.
#TradingEducation #PriceAction #RiskManagement #TradingTurtle
Orders and execution · Lesson 5
Market orders
Getting an immediate fill and getting the price you expected are different things.
A market order prioritizes execution over exact price. It normally fills against available liquidity in the order book, which means the final average fill can differ from the last displayed price when the market moves quickly or depth is thin. This difference is slippage. Market orders can be useful when execution matters more than price precision, but they should not be treated as price guarantees.
Imagine available sell orders near the displayed price are thin. A market buy can fill across several prices, so the average differs from the screen price you first saw.
Explain the difference between the displayed price and the average execution price, using a historical or simulated order book.
Next in this series: Limit orders.
#TradingEducation #PriceAction #RiskManagement #TradingTurtle
Market orders
Getting an immediate fill and getting the price you expected are different things.
A market order prioritizes execution over exact price. It normally fills against available liquidity in the order book, which means the final average fill can differ from the last displayed price when the market moves quickly or depth is thin. This difference is slippage. Market orders can be useful when execution matters more than price precision, but they should not be treated as price guarantees.
Imagine available sell orders near the displayed price are thin. A market buy can fill across several prices, so the average differs from the screen price you first saw.
Explain the difference between the displayed price and the average execution price, using a historical or simulated order book.
Next in this series: Limit orders.
#TradingEducation #PriceAction #RiskManagement #TradingTurtle
59

·
--
🚨 TRADING REALITY
Most beginners don't lose because they can't find a good coin.
They lose because they: ❌ Enter without a plan
❌ Chase pumps
❌ Move their Stop Loss
❌ Take profits too early
❌ Trade emotionally
A good strategy means nothing without discipline.
Save this if you're learning to trade. 📌
#TradingEducation $BTC
{future}(BTCUSDT)
$ETH
{future}(ETHUSDT)
$BNB
{future}(BNBUSDT)
🚨 TRADING REALITY
Most beginners don't lose because they can't find a good coin.
They lose because they: ❌ Enter without a plan
❌ Chase pumps
❌ Move their Stop Loss
❌ Take profits too early
❌ Trade emotionally
A good strategy means nothing without discipline.
Save this if you're learning to trade. 📌
#TradingEducation $BTC
$ETH
$BNB
Most beginners don't lose because they can't find a good coin.
They lose because they: ❌ Enter without a plan
❌ Chase pumps
❌ Move their Stop Loss
❌ Take profits too early
❌ Trade emotionally
A good strategy means nothing without discipline.
Save this if you're learning to trade. 📌
#TradingEducation $BTC
$ETH
$BNB
68
Why do traders spend more energy predicting the top than riding the move that's already proven itself?
Here's the gap: reversals are rare, trends are common. Every time a trader hunts for the exact turning point, they're betting against the higher-probability outcome — continuation. The dominant trend already has momentum, volume, and structure behind it. Fading it means fighting all three at once, hoping to be early instead of being right.
Watch how often price makes higher highs and higher lows (or the reverse) before you start guessing a reversal. Practice identifying trend structure before you look for exhaustion signals.
What's your process for confirming a trend before you trade with it?
$ADA $DOGE $AVAX #Trading #TradingEducation #Crypto #TA
Follow for daily trading education · Education only, not financial advice.
Why do traders spend more energy predicting the top than riding the move that's already proven itself?
Here's the gap: reversals are rare, trends are common. Every time a trader hunts for the exact turning point, they're betting against the higher-probability outcome — continuation. The dominant trend already has momentum, volume, and structure behind it. Fading it means fighting all three at once, hoping to be early instead of being right.
Watch how often price makes higher highs and higher lows (or the reverse) before you start guessing a reversal. Practice identifying trend structure before you look for exhaustion signals.
What's your process for confirming a trend before you trade with it?
$ADA $DOGE $AVAX #Trading #TradingEducation #Crypto #TA
Follow for daily trading education · Education only, not financial advice.
Here's the gap: reversals are rare, trends are common. Every time a trader hunts for the exact turning point, they're betting against the higher-probability outcome — continuation. The dominant trend already has momentum, volume, and structure behind it. Fading it means fighting all three at once, hoping to be early instead of being right.
Watch how often price makes higher highs and higher lows (or the reverse) before you start guessing a reversal. Practice identifying trend structure before you look for exhaustion signals.
What's your process for confirming a trend before you trade with it?
$ADA $DOGE $AVAX #Trading #TradingEducation #Crypto #TA
Follow for daily trading education · Education only, not financial advice.

1
152

·
--
📊 What Is Risk-to-Reward Ratio in Trading?
The risk-to-reward ratio compares the amount you could lose on a trade with the amount you hope to gain.
For example:
🔹 Risk: $10
🔹 Potential reward: $20
🔹 Risk-to-reward ratio: 1:2
Traders often use this ratio when planning entry, stop-loss, and take-profit levels. However, a favorable ratio does not guarantee that a trade will succeed.
Always manage risk carefully, avoid overtrading, and do your own research before making decisions.
#tradingeducation #RiskManagementInTrading #CryptoTrading. #tradingbasics #BİNANCESQUARE
📊 What Is Risk-to-Reward Ratio in Trading?
The risk-to-reward ratio compares the amount you could lose on a trade with the amount you hope to gain.
For example:
🔹 Risk: $10
🔹 Potential reward: $20
🔹 Risk-to-reward ratio: 1:2
Traders often use this ratio when planning entry, stop-loss, and take-profit levels. However, a favorable ratio does not guarantee that a trade will succeed.
Always manage risk carefully, avoid overtrading, and do your own research before making decisions.
#tradingeducation #RiskManagementInTrading #CryptoTrading. #tradingbasics #BİNANCESQUARE
The risk-to-reward ratio compares the amount you could lose on a trade with the amount you hope to gain.
For example:
🔹 Risk: $10
🔹 Potential reward: $20
🔹 Risk-to-reward ratio: 1:2
Traders often use this ratio when planning entry, stop-loss, and take-profit levels. However, a favorable ratio does not guarantee that a trade will succeed.
Always manage risk carefully, avoid overtrading, and do your own research before making decisions.
#tradingeducation #RiskManagementInTrading #CryptoTrading. #tradingbasics #BİNANCESQUARE
60

·
--
NVDAB/USDT — Candlestick Analysis & Trade Setup
Coin: NVDAB
Trading pair: NVDAB/USDT
Timeframe: 1-hour chart
Candlestick observation
The candlestick chart helps us identify buying and selling pressure. I’m watching how NVDAB reacts around its support and resistance levels before considering a trade.
Example trade setup educational only
- Current price: [Insert the live NVDAB price]
- Entry: [Insert a possible entry price after your analysis]
- Stop-loss: [Insert a level below your support]
- Take-profit: [Insert your target near resistance]
- Risk-to-reward: [Calculate your ratio]
My view: I would wait for confirmation before entering rather than buying simply because the price is moving. A breakout that fails can quickly turn into a loss.
⚠️ This is not financial advice. Crypto is highly volatile, and this is an example of how to analyse a trade not a guaranteed prediction.
$NVDAB
#NVDAX #cryptouniverseofficial #candlestick_patterns #TradingEducation
NVDAB/USDT — Candlestick Analysis & Trade Setup
Coin: NVDAB
Trading pair: NVDAB/USDT
Timeframe: 1-hour chart
Candlestick observation
The candlestick chart helps us identify buying and selling pressure. I’m watching how NVDAB reacts around its support and resistance levels before considering a trade.
Example trade setup educational only
- Current price: [Insert the live NVDAB price]
- Entry: [Insert a possible entry price after your analysis]
- Stop-loss: [Insert a level below your support]
- Take-profit: [Insert your target near resistance]
- Risk-to-reward: [Calculate your ratio]
My view: I would wait for confirmation before entering rather than buying simply because the price is moving. A breakout that fails can quickly turn into a loss.
⚠️ This is not financial advice. Crypto is highly volatile, and this is an example of how to analyse a trade not a guaranteed prediction.
$NVDAB
#NVDAX #cryptouniverseofficial #candlestick_patterns #TradingEducation
Coin: NVDAB
Trading pair: NVDAB/USDT
Timeframe: 1-hour chart
Candlestick observation
The candlestick chart helps us identify buying and selling pressure. I’m watching how NVDAB reacts around its support and resistance levels before considering a trade.
Example trade setup educational only
- Current price: [Insert the live NVDAB price]
- Entry: [Insert a possible entry price after your analysis]
- Stop-loss: [Insert a level below your support]
- Take-profit: [Insert your target near resistance]
- Risk-to-reward: [Calculate your ratio]
My view: I would wait for confirmation before entering rather than buying simply because the price is moving. A breakout that fails can quickly turn into a loss.
⚠️ This is not financial advice. Crypto is highly volatile, and this is an example of how to analyse a trade not a guaranteed prediction.
$NVDAB
#NVDAX #cryptouniverseofficial #candlestick_patterns #TradingEducation
74
·
--
📚 TRADING LESSON: ENTRY → TP → SL
🟢 ENTRY = The price where you enter a trade.
Example: BTC at $80,000 → you buy.
🎯 TAKE PROFIT (TP) = The price where you plan to take your profit.
Example: TP at $83,000 → you sell in profit.
🛑 STOP LOSS (SL) = The price where you exit to limit your loss.
Example: SL at $78,000 → you exit if price falls.
Easy to remember:
ENTRY = Get in
TP = Take profit
SL = Limit loss
📌 Always have a plan before entering a trade.
#TradingEducation $BTC
{future}(BTCUSDT)
$BNB
{future}(BNBUSDT)
$ETH
{future}(ETHUSDT)
📚 TRADING LESSON: ENTRY → TP → SL
🟢 ENTRY = The price where you enter a trade.
Example: BTC at $80,000 → you buy.
🎯 TAKE PROFIT (TP) = The price where you plan to take your profit.
Example: TP at $83,000 → you sell in profit.
🛑 STOP LOSS (SL) = The price where you exit to limit your loss.
Example: SL at $78,000 → you exit if price falls.
Easy to remember:
ENTRY = Get in
TP = Take profit
SL = Limit loss
📌 Always have a plan before entering a trade.
#TradingEducation $BTC
$BNB
$ETH
🟢 ENTRY = The price where you enter a trade.
Example: BTC at $80,000 → you buy.
🎯 TAKE PROFIT (TP) = The price where you plan to take your profit.
Example: TP at $83,000 → you sell in profit.
🛑 STOP LOSS (SL) = The price where you exit to limit your loss.
Example: SL at $78,000 → you exit if price falls.
Easy to remember:
ENTRY = Get in
TP = Take profit
SL = Limit loss
📌 Always have a plan before entering a trade.
#TradingEducation $BTC
$BNB
$ETH
76
·
--
📚 TRADING LESSON: LONG vs SHORT
🟢 LONG = You expect the price to go UP 📈
Example: Buy BTC at $80K → sell at $83K = profit.
🔴 SHORT = You expect the price to go DOWN 📉
Example: Short BTC at $80K → close at $77K = profit.
Easy to remember:
LONG = UP 📈
SHORT = DOWN 📉
Which one did you learn first? 👇
#TradingEducation $BTC
{future}(BTCUSDT)
$BNB
{future}(BNBUSDT)
$ETH
{future}(ETHUSDT)
📚 TRADING LESSON: LONG vs SHORT
🟢 LONG = You expect the price to go UP 📈
Example: Buy BTC at $80K → sell at $83K = profit.
🔴 SHORT = You expect the price to go DOWN 📉
Example: Short BTC at $80K → close at $77K = profit.
Easy to remember:
LONG = UP 📈
SHORT = DOWN 📉
Which one did you learn first? 👇
#TradingEducation $BTC
$BNB
$ETH
🟢 LONG = You expect the price to go UP 📈
Example: Buy BTC at $80K → sell at $83K = profit.
🔴 SHORT = You expect the price to go DOWN 📉
Example: Short BTC at $80K → close at $77K = profit.
Easy to remember:
LONG = UP 📈
SHORT = DOWN 📉
Which one did you learn first? 👇
#TradingEducation $BTC
$BNB
$ETH
78
·
--
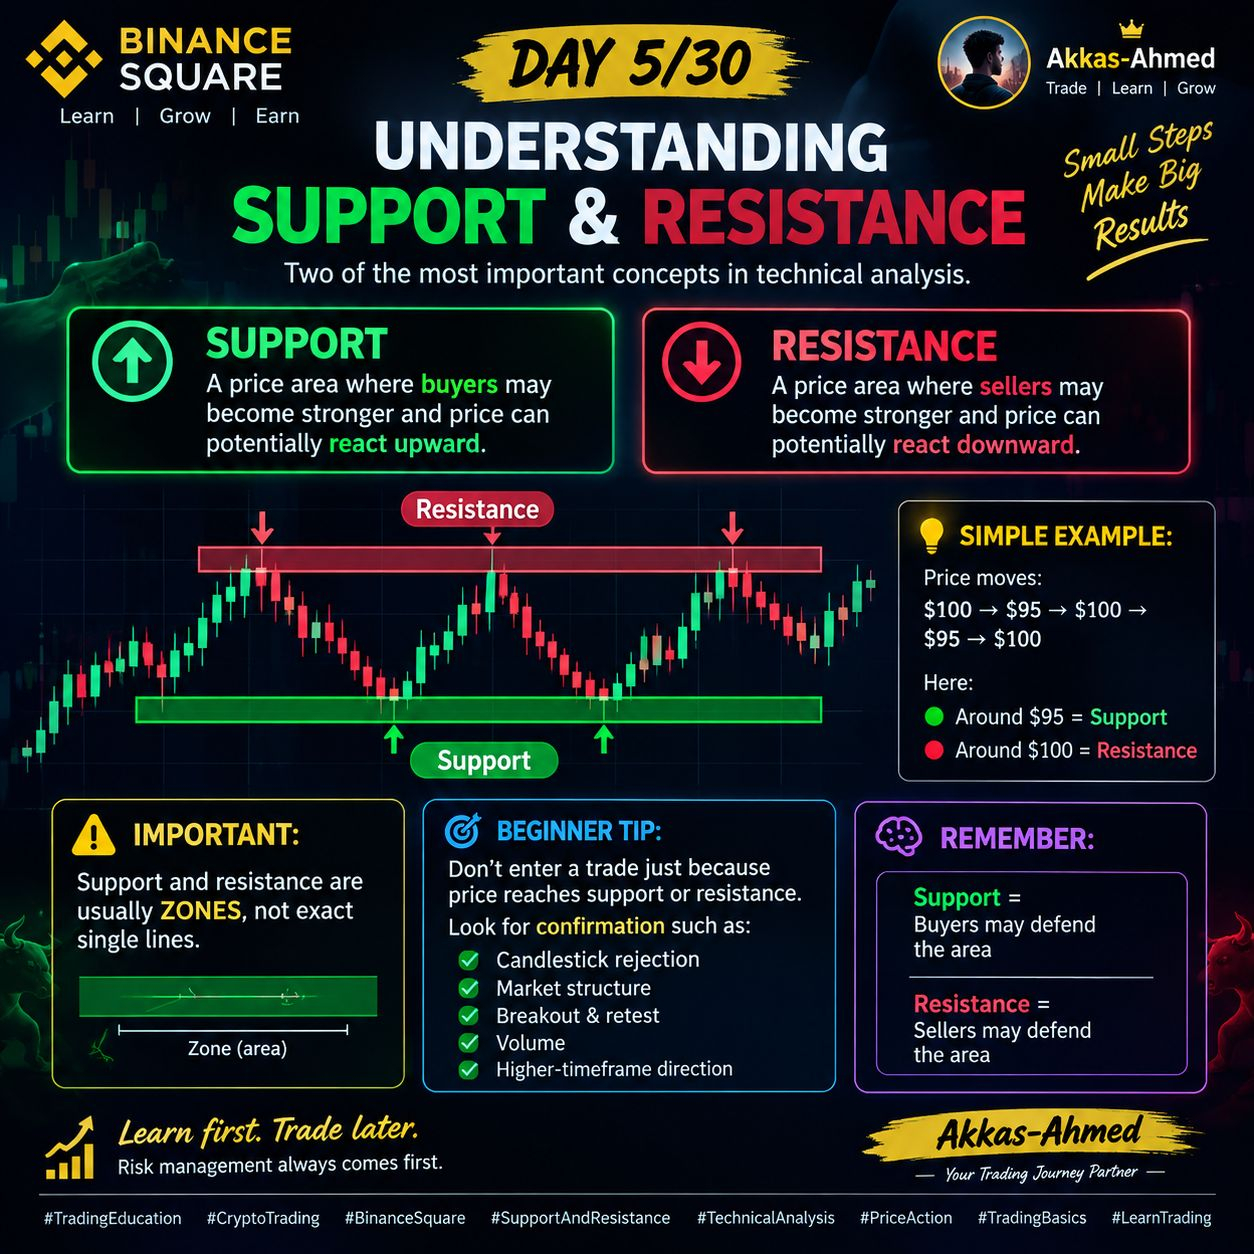
📅 DAY 5/30 — Understanding Support & Resistance 📊 $BTC
Support & Resistance are two of the most important concepts in technical analysis.
🟢 SUPPORT
A price area where buyers may become stronger and price can potentially react upward.
🔴 RESISTANCE
A price area where sellers may become stronger and price can potentially react downward.
📌 SIMPLE EXAMPLE:
Price moves: $100 → $95 → $100 → $95 → $100
Here: • Around $95 = Support • Around $100 = Resistance
⚠️ Important: Support and resistance are usually ZONES, not exact single lines.
💡 Beginner Tip: Don’t enter a trade just because price reaches support or resistance.
Look for confirmation such as: • Candlestick rejection • Market structure • Breakout & retest • Volume • Higher-timeframe direction
🧠 Remember: Support = Buyers may defend the area
Resistance = Sellers may defend the area
📚 Learn first. Trade later. Risk management always comes first.
#TradingEducation #CryptoTradingTip #BinanceSquareFamily #TechnicalAnalysis $BTC
📅 DAY 5/30 — Understanding Support & Resistance 📊 $BTC
Support & Resistance are two of the most important concepts in technical analysis.
🟢 SUPPORT
A price area where buyers may become stronger and price can potentially react upward.
🔴 RESISTANCE
A price area where sellers may become stronger and price can potentially react downward.
📌 SIMPLE EXAMPLE:
Price moves: $100 → $95 → $100 → $95 → $100
Here: • Around $95 = Support • Around $100 = Resistance
⚠️ Important: Support and resistance are usually ZONES, not exact single lines.
💡 Beginner Tip: Don’t enter a trade just because price reaches support or resistance.
Look for confirmation such as: • Candlestick rejection • Market structure • Breakout & retest • Volume • Higher-timeframe direction
🧠 Remember: Support = Buyers may defend the area
Resistance = Sellers may defend the area
📚 Learn first. Trade later. Risk management always comes first.
#TradingEducation #CryptoTradingTip #BinanceSquareFamily #TechnicalAnalysis $BTC
Support & Resistance are two of the most important concepts in technical analysis.
🟢 SUPPORT
A price area where buyers may become stronger and price can potentially react upward.
🔴 RESISTANCE
A price area where sellers may become stronger and price can potentially react downward.
📌 SIMPLE EXAMPLE:
Price moves: $100 → $95 → $100 → $95 → $100
Here: • Around $95 = Support • Around $100 = Resistance
⚠️ Important: Support and resistance are usually ZONES, not exact single lines.
💡 Beginner Tip: Don’t enter a trade just because price reaches support or resistance.
Look for confirmation such as: • Candlestick rejection • Market structure • Breakout & retest • Volume • Higher-timeframe direction
🧠 Remember: Support = Buyers may defend the area
Resistance = Sellers may defend the area
📚 Learn first. Trade later. Risk management always comes first.
#TradingEducation #CryptoTradingTip #BinanceSquareFamily #TechnicalAnalysis $BTC
1
72

Article
The Liquidity Illusion: Why Most Traders Get Trapped on BreakoutsMost traders see a large green candle piercing resistance as a signal to buy. To institutional desks, that exact candle is often just an exit door.
If you have ever market-bought a textbook breakout only to watch the price violently reverse into a red wick five minutes later, you didn't get unlucky—you provided the exit liquidity.
🧠 The Mechanics Behind the Trap
Markets do not move on patterns; they move on liquidity.
When an asset consolidates below a major resistance zone for days, two massive clusters of buy orders accumulate above that ceiling:
Buy-Stop orders from short sellers protecting their positions.Breakout Market-Buy orders from momentum traders waiting for the breach.
A high-volume entity holding a heavy position cannot simply sell at market price without crashing the order book against themselves. They need a concentrated surge of buyers. By driving price just high enough to trigger those stop-losses and breakout entries, they generate the exact counter-liquidity needed to offload size.
Once the trapped liquidity is absorbed, buying volume evaporates, and gravity takes over.
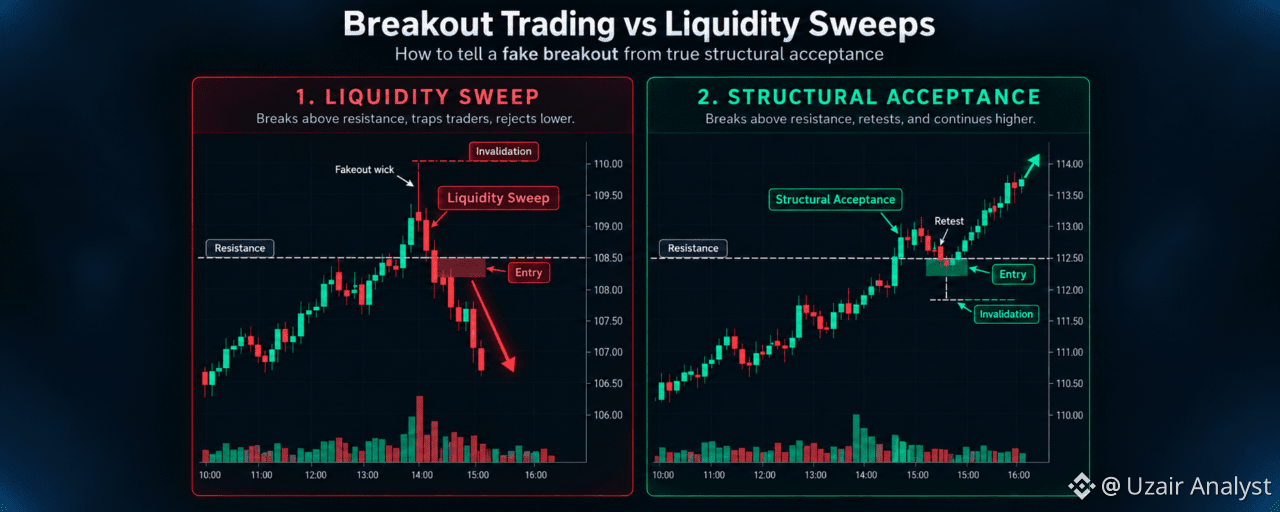
📊 Real Breakout vs. Liquidity Grab: The Difference
MetricLiquidity Grab (Fakeout)Structural BreakoutCandle BehaviorFast surge above level, leaves a long upper wickDecisive body close above level with minimal wick Volume SignatureVolume spike on the wick, dry volume immediately afterExpanding volume on the push, declining volume on the retest Lower TimeframeImmediate rejection back inside previous rangeRange acceptance: price treats previous resistance as support Open Interest (OI)Aggressive OI spike with funding heating up rapidly Gradual spot-driven accumulation backing derivatives volume
⚡ The 3-Rule Execution Checklist
Before taking another breakout trade, apply this filter:
Eliminate the First-Touch Entry: Never buy the initial expansion candle into an untested macro level. Chasing green candles gives you the worst possible risk-to-reward ratio.Wait for Structural Acceptance: A true breakout requires price to prove the level has changed hands. Look for a clean retest that prints a higher low above the broken level.Define Invalidation by Structure, Not Emotion: Your stop loss should not be an arbitrary percentage; it should sit where the breakout thesis is mathematically broken—typically back inside the old range.
Trading profitability does not come from catching every single move. It comes from avoiding the obvious traps designed to harvest impatient capital.
Chasing is optional. Discipline isn't.
$BTC $ETH #TradingEducation #CryptoStrategy #RiskManagement
The Liquidity Illusion: Why Most Traders Get Trapped on Breakouts
Most traders see a large green candle piercing resistance as a signal to buy. To institutional desks, that exact candle is often just an exit door.
If you have ever market-bought a textbook breakout only to watch the price violently reverse into a red wick five minutes later, you didn't get unlucky—you provided the exit liquidity.
🧠 The Mechanics Behind the Trap
Markets do not move on patterns; they move on liquidity.
When an asset consolidates below a major resistance zone for days, two massive clusters of buy orders accumulate above that ceiling:
Buy-Stop orders from short sellers protecting their positions.Breakout Market-Buy orders from momentum traders waiting for the breach.
A high-volume entity holding a heavy position cannot simply sell at market price without crashing the order book against themselves. They need a concentrated surge of buyers. By driving price just high enough to trigger those stop-losses and breakout entries, they generate the exact counter-liquidity needed to offload size.
Once the trapped liquidity is absorbed, buying volume evaporates, and gravity takes over.
📊 Real Breakout vs. Liquidity Grab: The Difference
MetricLiquidity Grab (Fakeout)Structural BreakoutCandle BehaviorFast surge above level, leaves a long upper wickDecisive body close above level with minimal wick Volume SignatureVolume spike on the wick, dry volume immediately afterExpanding volume on the push, declining volume on the retest Lower TimeframeImmediate rejection back inside previous rangeRange acceptance: price treats previous resistance as support Open Interest (OI)Aggressive OI spike with funding heating up rapidly Gradual spot-driven accumulation backing derivatives volume
⚡ The 3-Rule Execution Checklist
Before taking another breakout trade, apply this filter:
Eliminate the First-Touch Entry: Never buy the initial expansion candle into an untested macro level. Chasing green candles gives you the worst possible risk-to-reward ratio.Wait for Structural Acceptance: A true breakout requires price to prove the level has changed hands. Look for a clean retest that prints a higher low above the broken level.Define Invalidation by Structure, Not Emotion: Your stop loss should not be an arbitrary percentage; it should sit where the breakout thesis is mathematically broken—typically back inside the old range.
Trading profitability does not come from catching every single move. It comes from avoiding the obvious traps designed to harvest impatient capital.
Chasing is optional. Discipline isn't.
$BTC $ETH #TradingEducation #CryptoStrategy #RiskManagement
If you have ever market-bought a textbook breakout only to watch the price violently reverse into a red wick five minutes later, you didn't get unlucky—you provided the exit liquidity.
🧠 The Mechanics Behind the Trap
Markets do not move on patterns; they move on liquidity.
When an asset consolidates below a major resistance zone for days, two massive clusters of buy orders accumulate above that ceiling:
Buy-Stop orders from short sellers protecting their positions.Breakout Market-Buy orders from momentum traders waiting for the breach.
A high-volume entity holding a heavy position cannot simply sell at market price without crashing the order book against themselves. They need a concentrated surge of buyers. By driving price just high enough to trigger those stop-losses and breakout entries, they generate the exact counter-liquidity needed to offload size.
Once the trapped liquidity is absorbed, buying volume evaporates, and gravity takes over.
📊 Real Breakout vs. Liquidity Grab: The Difference
MetricLiquidity Grab (Fakeout)Structural BreakoutCandle BehaviorFast surge above level, leaves a long upper wickDecisive body close above level with minimal wick Volume SignatureVolume spike on the wick, dry volume immediately afterExpanding volume on the push, declining volume on the retest Lower TimeframeImmediate rejection back inside previous rangeRange acceptance: price treats previous resistance as support Open Interest (OI)Aggressive OI spike with funding heating up rapidly Gradual spot-driven accumulation backing derivatives volume
⚡ The 3-Rule Execution Checklist
Before taking another breakout trade, apply this filter:
Eliminate the First-Touch Entry: Never buy the initial expansion candle into an untested macro level. Chasing green candles gives you the worst possible risk-to-reward ratio.Wait for Structural Acceptance: A true breakout requires price to prove the level has changed hands. Look for a clean retest that prints a higher low above the broken level.Define Invalidation by Structure, Not Emotion: Your stop loss should not be an arbitrary percentage; it should sit where the breakout thesis is mathematically broken—typically back inside the old range.
Trading profitability does not come from catching every single move. It comes from avoiding the obvious traps designed to harvest impatient capital.
Chasing is optional. Discipline isn't.
$BTC $ETH #TradingEducation #CryptoStrategy #RiskManagement
56
Ever wonder why price rips away from a spot, then comes back to that exact spot before continuing?
That spot is an order block — the last candle before a strong, decisive move away from an area. It forms because large orders got filled there but not fully, so price returns later to let the rest execute before continuing the original direction. That's why these zones act like magnets on a pullback.
Watch this: never mark it as one thin line. Mark the whole candle's range, high to low. Price often wicks into part of the zone, not the exact edge, and reacts inside that range.
Where do you usually draw your zones — too tight or too wide?
$SOL $XRP $ADA #Trading #TradingEducation #Crypto #TA
Follow for daily trading education · Education only, not financial advice.
Ever wonder why price rips away from a spot, then comes back to that exact spot before continuing?
That spot is an order block — the last candle before a strong, decisive move away from an area. It forms because large orders got filled there but not fully, so price returns later to let the rest execute before continuing the original direction. That's why these zones act like magnets on a pullback.
Watch this: never mark it as one thin line. Mark the whole candle's range, high to low. Price often wicks into part of the zone, not the exact edge, and reacts inside that range.
Where do you usually draw your zones — too tight or too wide?
$SOL $XRP $ADA #Trading #TradingEducation #Crypto #TA
Follow for daily trading education · Education only, not financial advice.
That spot is an order block — the last candle before a strong, decisive move away from an area. It forms because large orders got filled there but not fully, so price returns later to let the rest execute before continuing the original direction. That's why these zones act like magnets on a pullback.
Watch this: never mark it as one thin line. Mark the whole candle's range, high to low. Price often wicks into part of the zone, not the exact edge, and reacts inside that range.
Where do you usually draw your zones — too tight or too wide?
$SOL $XRP $ADA #Trading #TradingEducation #Crypto #TA
Follow for daily trading education · Education only, not financial advice.

1
186
Big positions are never built in the candle everyone's watching.
Large players can't buy or sell all at once without moving price against themselves. So accumulation happens quietly — sideways ranges, boring charts, low volume periods where retail has already lost interest and moved on to whatever is pumping. Distribution works the same way in reverse: it looks calm, even bullish, right as size gets sold into strength. By the time the move is obvious, positioning is already done. The chop that bores you out of a trade is often the point, not a mistake.
Watch for extended ranges after a strong trend — that's where the real work gets done, not in the breakout candle.
What's the most boring chart you've ignored this month?
$AVAX $LINK $TRX #Trading #TradingEducation #Crypto #TA
Follow for daily trading education · Education only, not financial advice.
Big positions are never built in the candle everyone's watching.
Large players can't buy or sell all at once without moving price against themselves. So accumulation happens quietly — sideways ranges, boring charts, low volume periods where retail has already lost interest and moved on to whatever is pumping. Distribution works the same way in reverse: it looks calm, even bullish, right as size gets sold into strength. By the time the move is obvious, positioning is already done. The chop that bores you out of a trade is often the point, not a mistake.
Watch for extended ranges after a strong trend — that's where the real work gets done, not in the breakout candle.
What's the most boring chart you've ignored this month?
$AVAX $LINK $TRX #Trading #TradingEducation #Crypto #TA
Follow for daily trading education · Education only, not financial advice.
Large players can't buy or sell all at once without moving price against themselves. So accumulation happens quietly — sideways ranges, boring charts, low volume periods where retail has already lost interest and moved on to whatever is pumping. Distribution works the same way in reverse: it looks calm, even bullish, right as size gets sold into strength. By the time the move is obvious, positioning is already done. The chop that bores you out of a trade is often the point, not a mistake.
Watch for extended ranges after a strong trend — that's where the real work gets done, not in the breakout candle.
What's the most boring chart you've ignored this month?
$AVAX $LINK $TRX #Trading #TradingEducation #Crypto #TA
Follow for daily trading education · Education only, not financial advice.

104
Market structure · Lesson 4
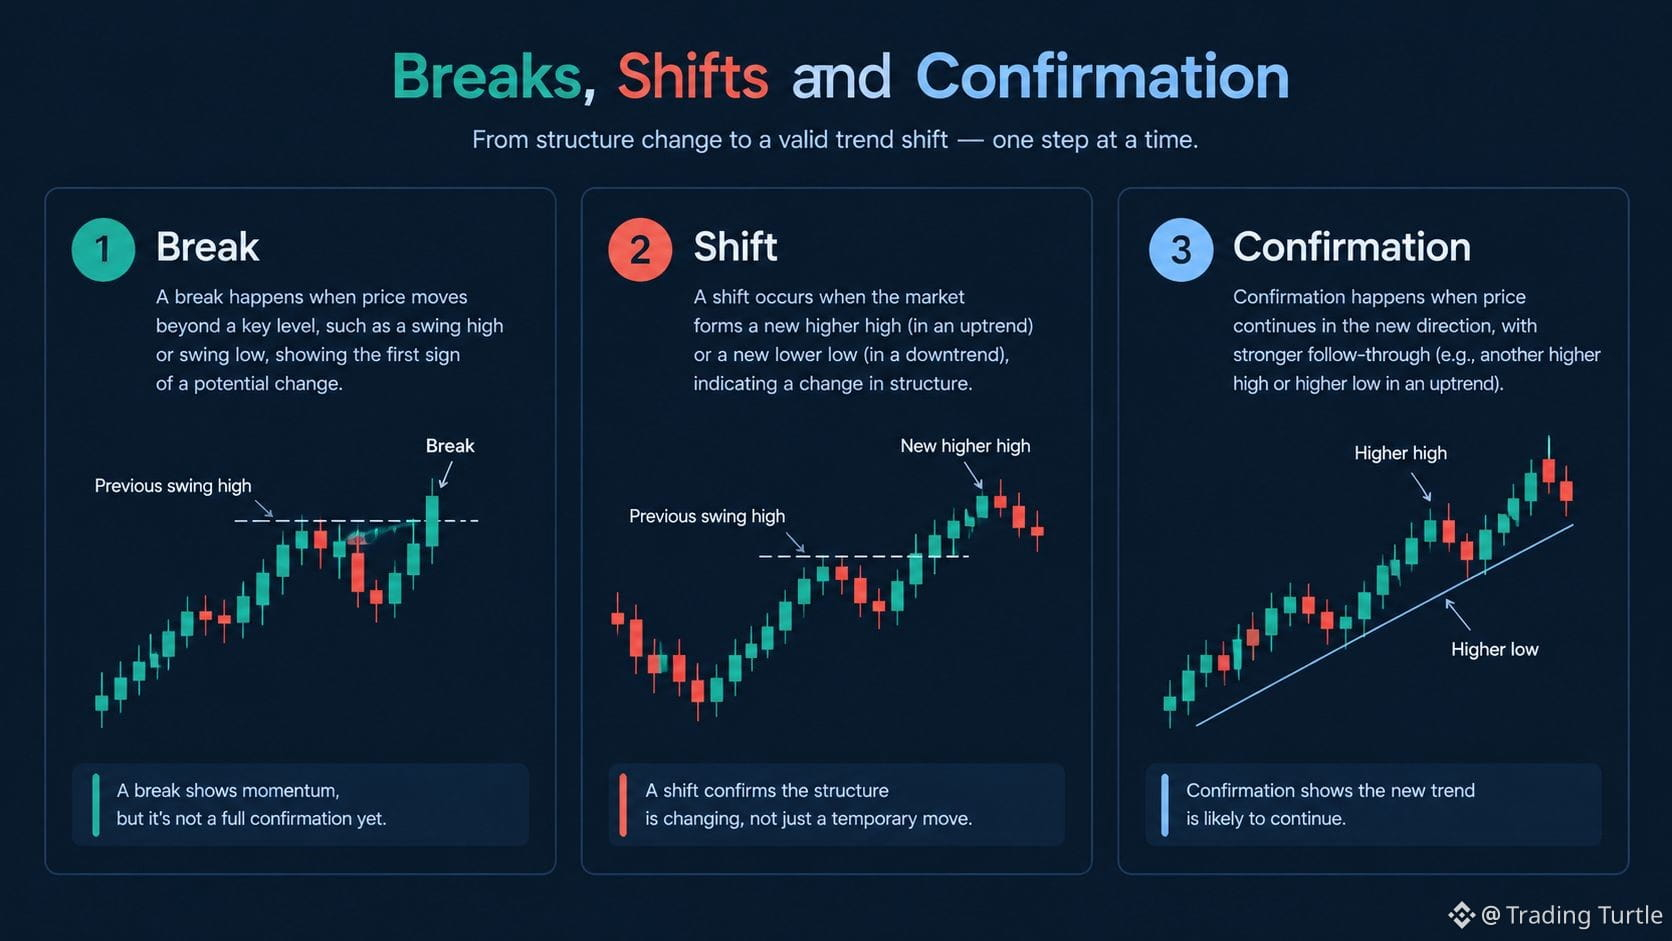
Breaks, shifts and confirmation
A broken level is a reason to reassess the chart, not proof of a new trend.
A break of a meaningful swing can weaken the prior structure, but it does not guarantee a full reversal. Confirmation usually comes from what price does after the break: whether the market accepts beyond the level, forms a new opposing swing sequence, or quickly reclaims the broken area. Structure is evidence for a trading thesis, not a promise about the next candle.
Compare a break followed by acceptance beyond a level with a break that quickly returns inside the old structure. The follow-through gives the two moves different meanings.
Find a historical break and hide the later candles. Write what evidence would strengthen or weaken each interpretation.
Next in this series: Market orders.
#TradingEducation #PriceAction #RiskManagement #TradingTurtle
Market structure · Lesson 4
Breaks, shifts and confirmation
A broken level is a reason to reassess the chart, not proof of a new trend.
A break of a meaningful swing can weaken the prior structure, but it does not guarantee a full reversal. Confirmation usually comes from what price does after the break: whether the market accepts beyond the level, forms a new opposing swing sequence, or quickly reclaims the broken area. Structure is evidence for a trading thesis, not a promise about the next candle.
Compare a break followed by acceptance beyond a level with a break that quickly returns inside the old structure. The follow-through gives the two moves different meanings.
Find a historical break and hide the later candles. Write what evidence would strengthen or weaken each interpretation.
Next in this series: Market orders.
#TradingEducation #PriceAction #RiskManagement #TradingTurtle
Breaks, shifts and confirmation
A broken level is a reason to reassess the chart, not proof of a new trend.
A break of a meaningful swing can weaken the prior structure, but it does not guarantee a full reversal. Confirmation usually comes from what price does after the break: whether the market accepts beyond the level, forms a new opposing swing sequence, or quickly reclaims the broken area. Structure is evidence for a trading thesis, not a promise about the next candle.
Compare a break followed by acceptance beyond a level with a break that quickly returns inside the old structure. The follow-through gives the two moves different meanings.
Find a historical break and hide the later candles. Write what evidence would strengthen or weaken each interpretation.
Next in this series: Market orders.
#TradingEducation #PriceAction #RiskManagement #TradingTurtle
51
Log in to explore more content
Join global crypto users on Binance Square
⚡️ Get latest and useful information about crypto.
💬 Trusted by the world’s largest crypto exchange.
👍 Discover real insights from verified creators.
Email / Phone number
Trending Topics
1
#BitcoinReboundsTo$79K
30,427 views
246 Discussing
2
#BessentEndorsesFinalClarityActDraft
16 views
17 Discussing
3
#ZamaOpens16ConfidentialMorphoVaults
21 views
13 Discussing
4
#USDCOnChainVolumeTops$100Trillion
197 views
10 Discussing
5
#BitcoinSpotETFsNetInflow$160M
1,055 views
60 Discussing
6
#SouthKoreaCryptoTaxDelayPetitionTops50000
22,043 views
686 Discussing
7
#SolanaTransactionV1GoesLiveOnMainnet
15,468 views
458 Discussing
8
#RussianCentralBankFlagsCryptoAsFinancialRisk
11,791 views
379 Discussing
9
#GrayscalePutsXRPAt26.11%InAdvisorPortfolio
28,016 views
501 Discussing
10
#PhiladelphiaSemiconductorIndexFalls5.9%
12,077 views
310 Discussing