Binance Square
Pejmanzwin
238 Publications

Pejmanzwin

Pejman_Zwin 8y crypto trader 50K TradingView followers 1000 BTC analyses high win rate ProTrader365 lead Follow for Bitcoin insights 🚀
2 Suivis
673 Abonnés
470 J’aime
Publications
·
--
Haussier
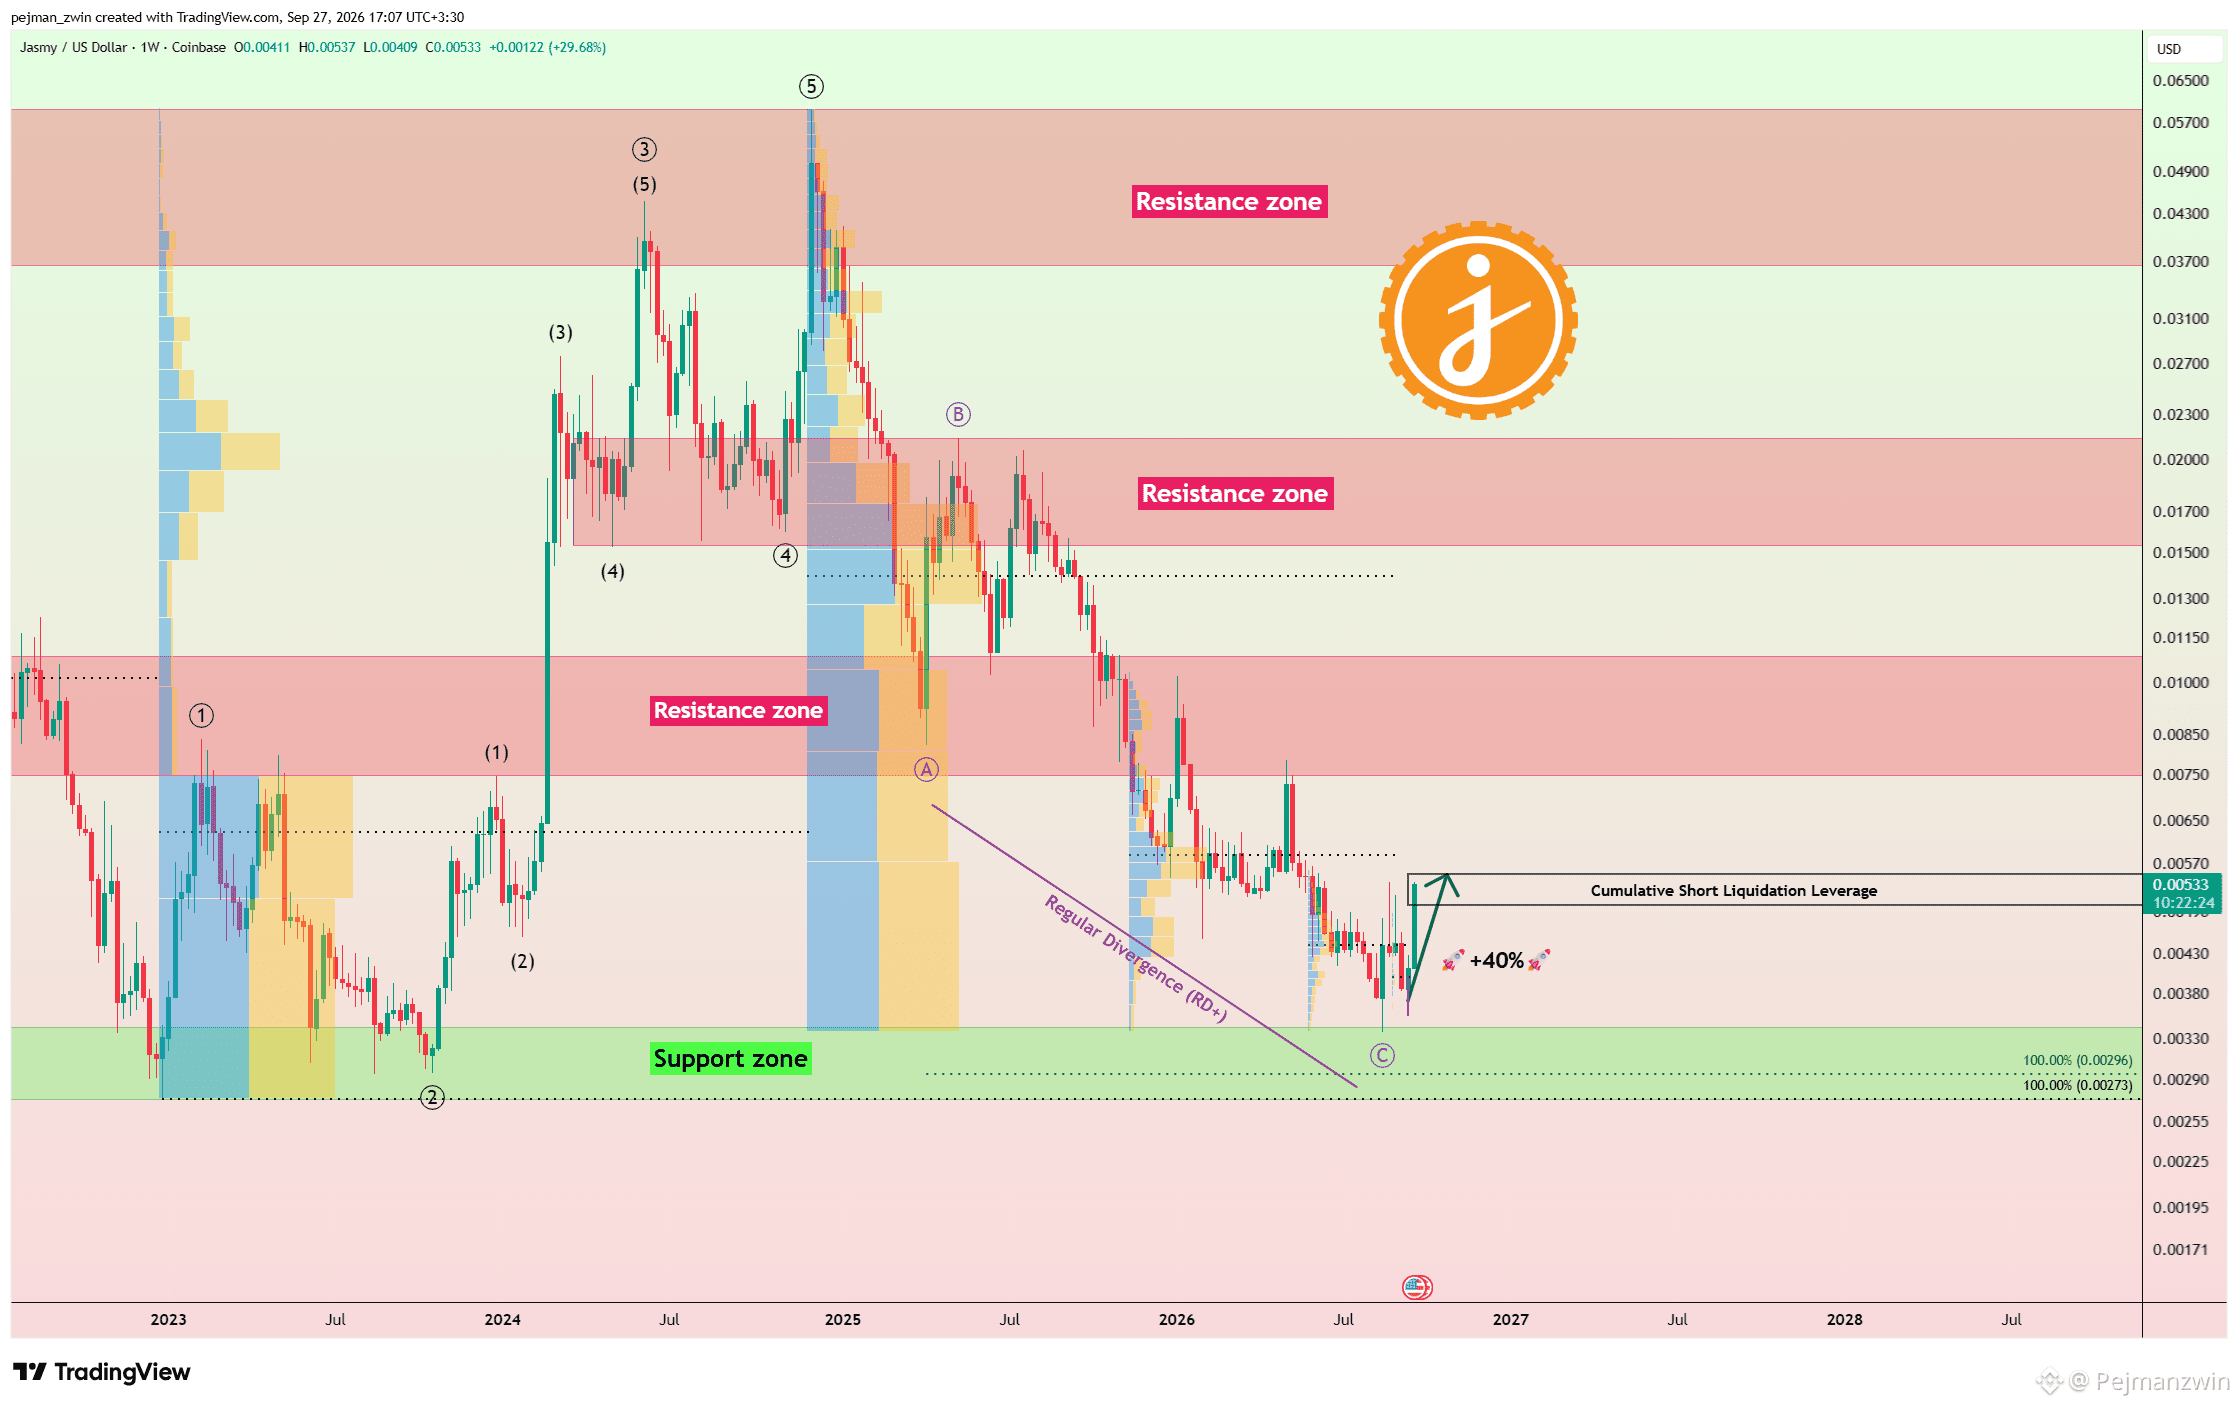
$JASMY Is Up +40% — Can $0.0058 Unlock the Next Leg Higher? The August 31 Weekly timeframe analysis has played out very well, with JASMY gaining approximately 40% so far. Price has now entered the Cumulative Short Liquidation Leverage at $0.0050–$0.0055, an area that could create meaningful resistance after such a strong move. The next key level to watch is $0.0058. If JASMY can break and hold above this level, the bullish structure could strengthen further and open the way for another leg higher. However, after a 40% rally, a rejection from the current liquidity zone and a short-term correction should also be considered. For now, $0.0058 is the key decision level. What comes next for JASMY? 🟢 Break above $0.0058 🔴 Rejection from the liquidity zone #jasmy
$JASMY Is Up +40% — Can $0.0058 Unlock the Next Leg Higher?

The August 31 Weekly timeframe analysis has played out very well, with JASMY gaining approximately 40% so far.

Price has now entered the Cumulative Short Liquidation Leverage at $0.0050–$0.0055, an area that could create meaningful resistance after such a strong move.

The next key level to watch is $0.0058.

If JASMY can break and hold above this level, the bullish structure could strengthen further and open the way for another leg higher.

However, after a 40% rally, a rejection from the current liquidity zone and a short-term correction should also be considered.

For now, $0.0058 is the key decision level.

What comes next for JASMY?

🟢 Break above $0.0058

🔴 Rejection from the liquidity zone

#jasmy
Pejmanzwin
·
--
Haussier
$JASMY Could Rally 40% — But One Major Risk Comes First

JASMY is showing a rare combination of improving fundamentals and an interesting technical setup, but short-term risk remains elevated.

On the fundamental side, the collaboration between Jasmy, Panasonic Advanced Technology and Jasmy Lab on the Smart Render distributed GPU service is a positive catalyst. At the same time, around 98.9% of the 50B max supply is already circulating, significantly reducing future dilution risk.

However, risks remain. JasmyChain adoption is still relatively limited, whale concentration remains high, and the Upbit and Bithumb delisting scheduled for September 14 could increase volatility and selling pressure.

Technically, JASMY reacted strongly from its Support Zone. From an Elliott Wave perspective, the weekly corrective Zigzag structure may already be complete, while positive divergence is visible across price, volume and several indicators.

As long as the Support Zone holds, I believe JASMY could potentially gain at least 40% over the coming days and weeks.

Key Levels: $0.0058 and $0.0063

A confirmed breakout above them could open the path toward $0.0073.

A lower-timeframe pullback may still offer a better entry, so risk management remains essential.

Can JASMY overcome the delisting pressure and start a 40% recovery?

#jasmy
·
--
Haussier
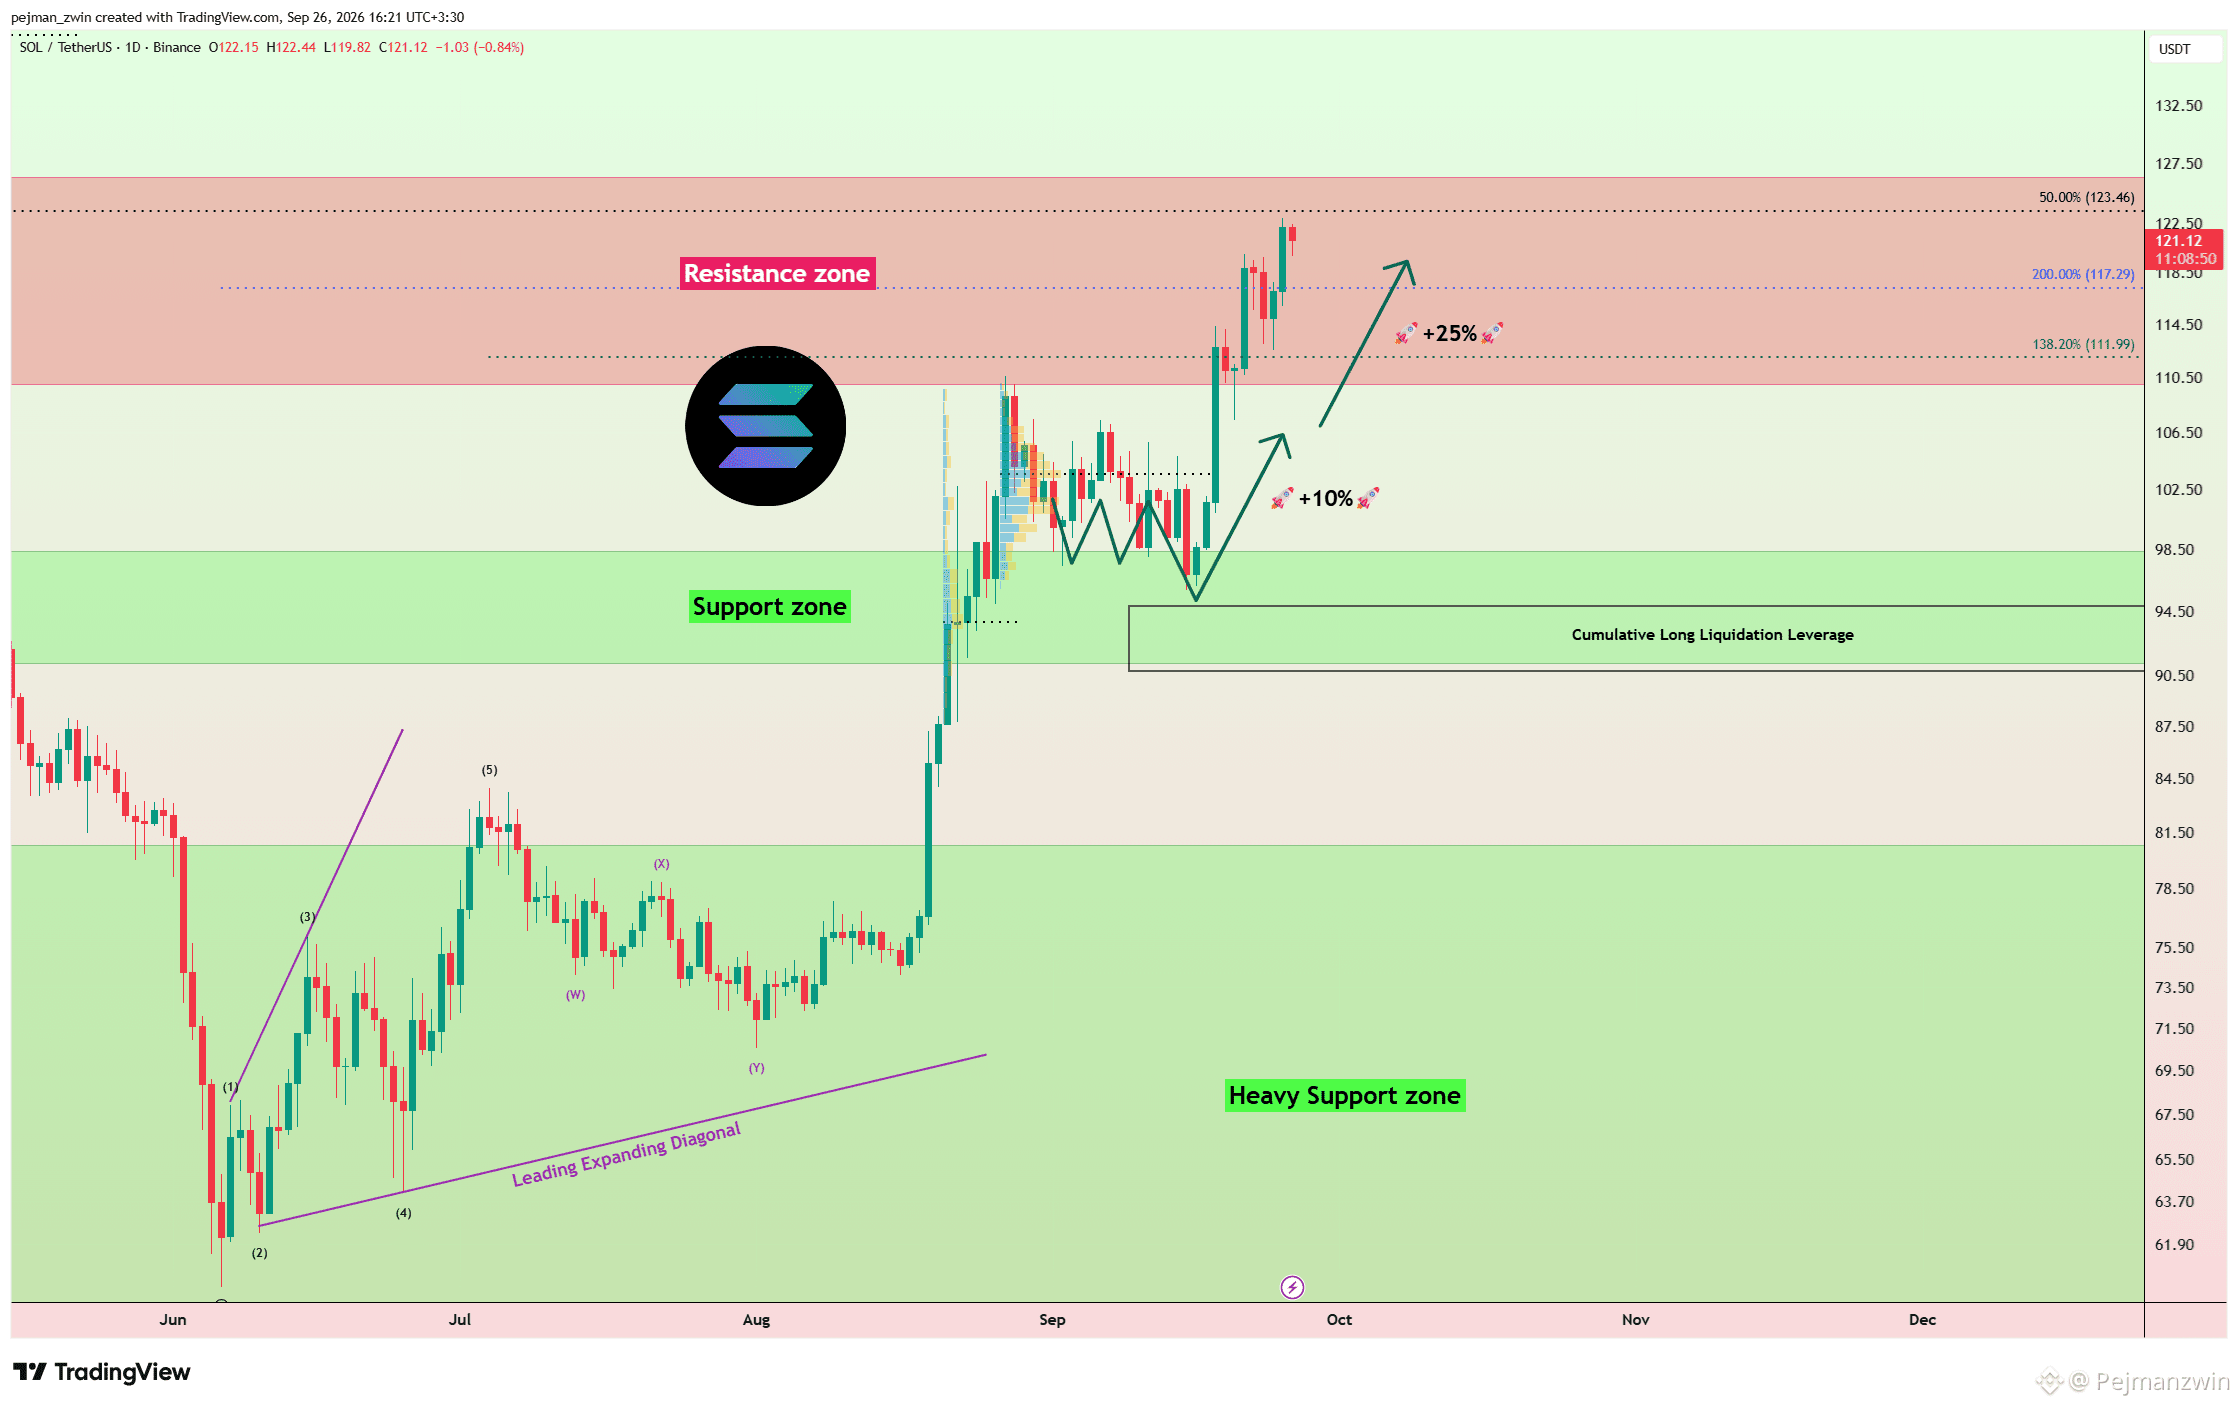
$SOL Outperformed the August 31 Target — Now Resistance Becomes the Real Test Solana followed my August 31 Daily timeframe analysis almost exactly and continued even beyond the original target. That move confirmed the strength of the bullish structure highlighted in the previous setup. SOL is now trading inside an important Resistance Zone at $110–$126, where the next reaction could determine whether the rally still has room to extend or if a correction is approaching. After such a strong move, this is no longer about chasing the previous target — the focus now shifts to how price behaves inside this resistance structure. A confirmed breakout above the zone could strengthen the broader bullish trend, while rejection from this area could trigger a short-term correction before the next opportunity develops. I hope you were able to take advantage of the Daily timeframe setup and benefit from the move. What comes next for Solana? 🟢 Break above $126 🔴 Correction from the Resistance Zone #solana
$SOL Outperformed the August 31 Target — Now Resistance Becomes the Real Test

Solana followed my August 31 Daily timeframe analysis almost exactly and continued even beyond the original target.
That move confirmed the strength of the bullish structure highlighted in the previous setup.

SOL is now trading inside an important Resistance Zone at $110–$126, where the next reaction could determine whether the rally still has room to extend or if a correction is approaching.

After such a strong move, this is no longer about chasing the previous target — the focus now shifts to how price behaves inside this resistance structure.

A confirmed breakout above the zone could strengthen the broader bullish trend, while rejection from this area could trigger a short-term correction before the next opportunity develops.

I hope you were able to take advantage of the Daily timeframe setup and benefit from the move.

What comes next for Solana?

🟢 Break above $126

🔴 Correction from the Resistance Zone

#solana
Pejmanzwin
·
--
Haussier
$SOL Breakout Confirmed — Is a 10% Rebound Next?

Solana broke above the Resistance Zone with strong volume, confirming significant buying pressure. Price is now pulling back toward the breakout area, which could become the key zone for the next move.

Two important liquidity areas are now in focus:

Cumulative Long Liquidation Leverage: $99.00–$100.20
Deeper Cumulative Long Liquidation Leverage: $90.80–$94.80
The $94 level remains especially important for preserving the broader bullish structure.

If SOL completes its pullback around these zones and buyers successfully defend support, I expect another bullish leg of at least 10%, targeting the Cumulative Short Liquidation Leverage at $108.20–$109.50.

The combination of a strong-volume breakout and a controlled pullback keeps the bullish setup interesting — as long as the key support structure remains intact.

Will SOL defend the pullback zone and push toward $109.50 next?

#solana
·
--
Haussier
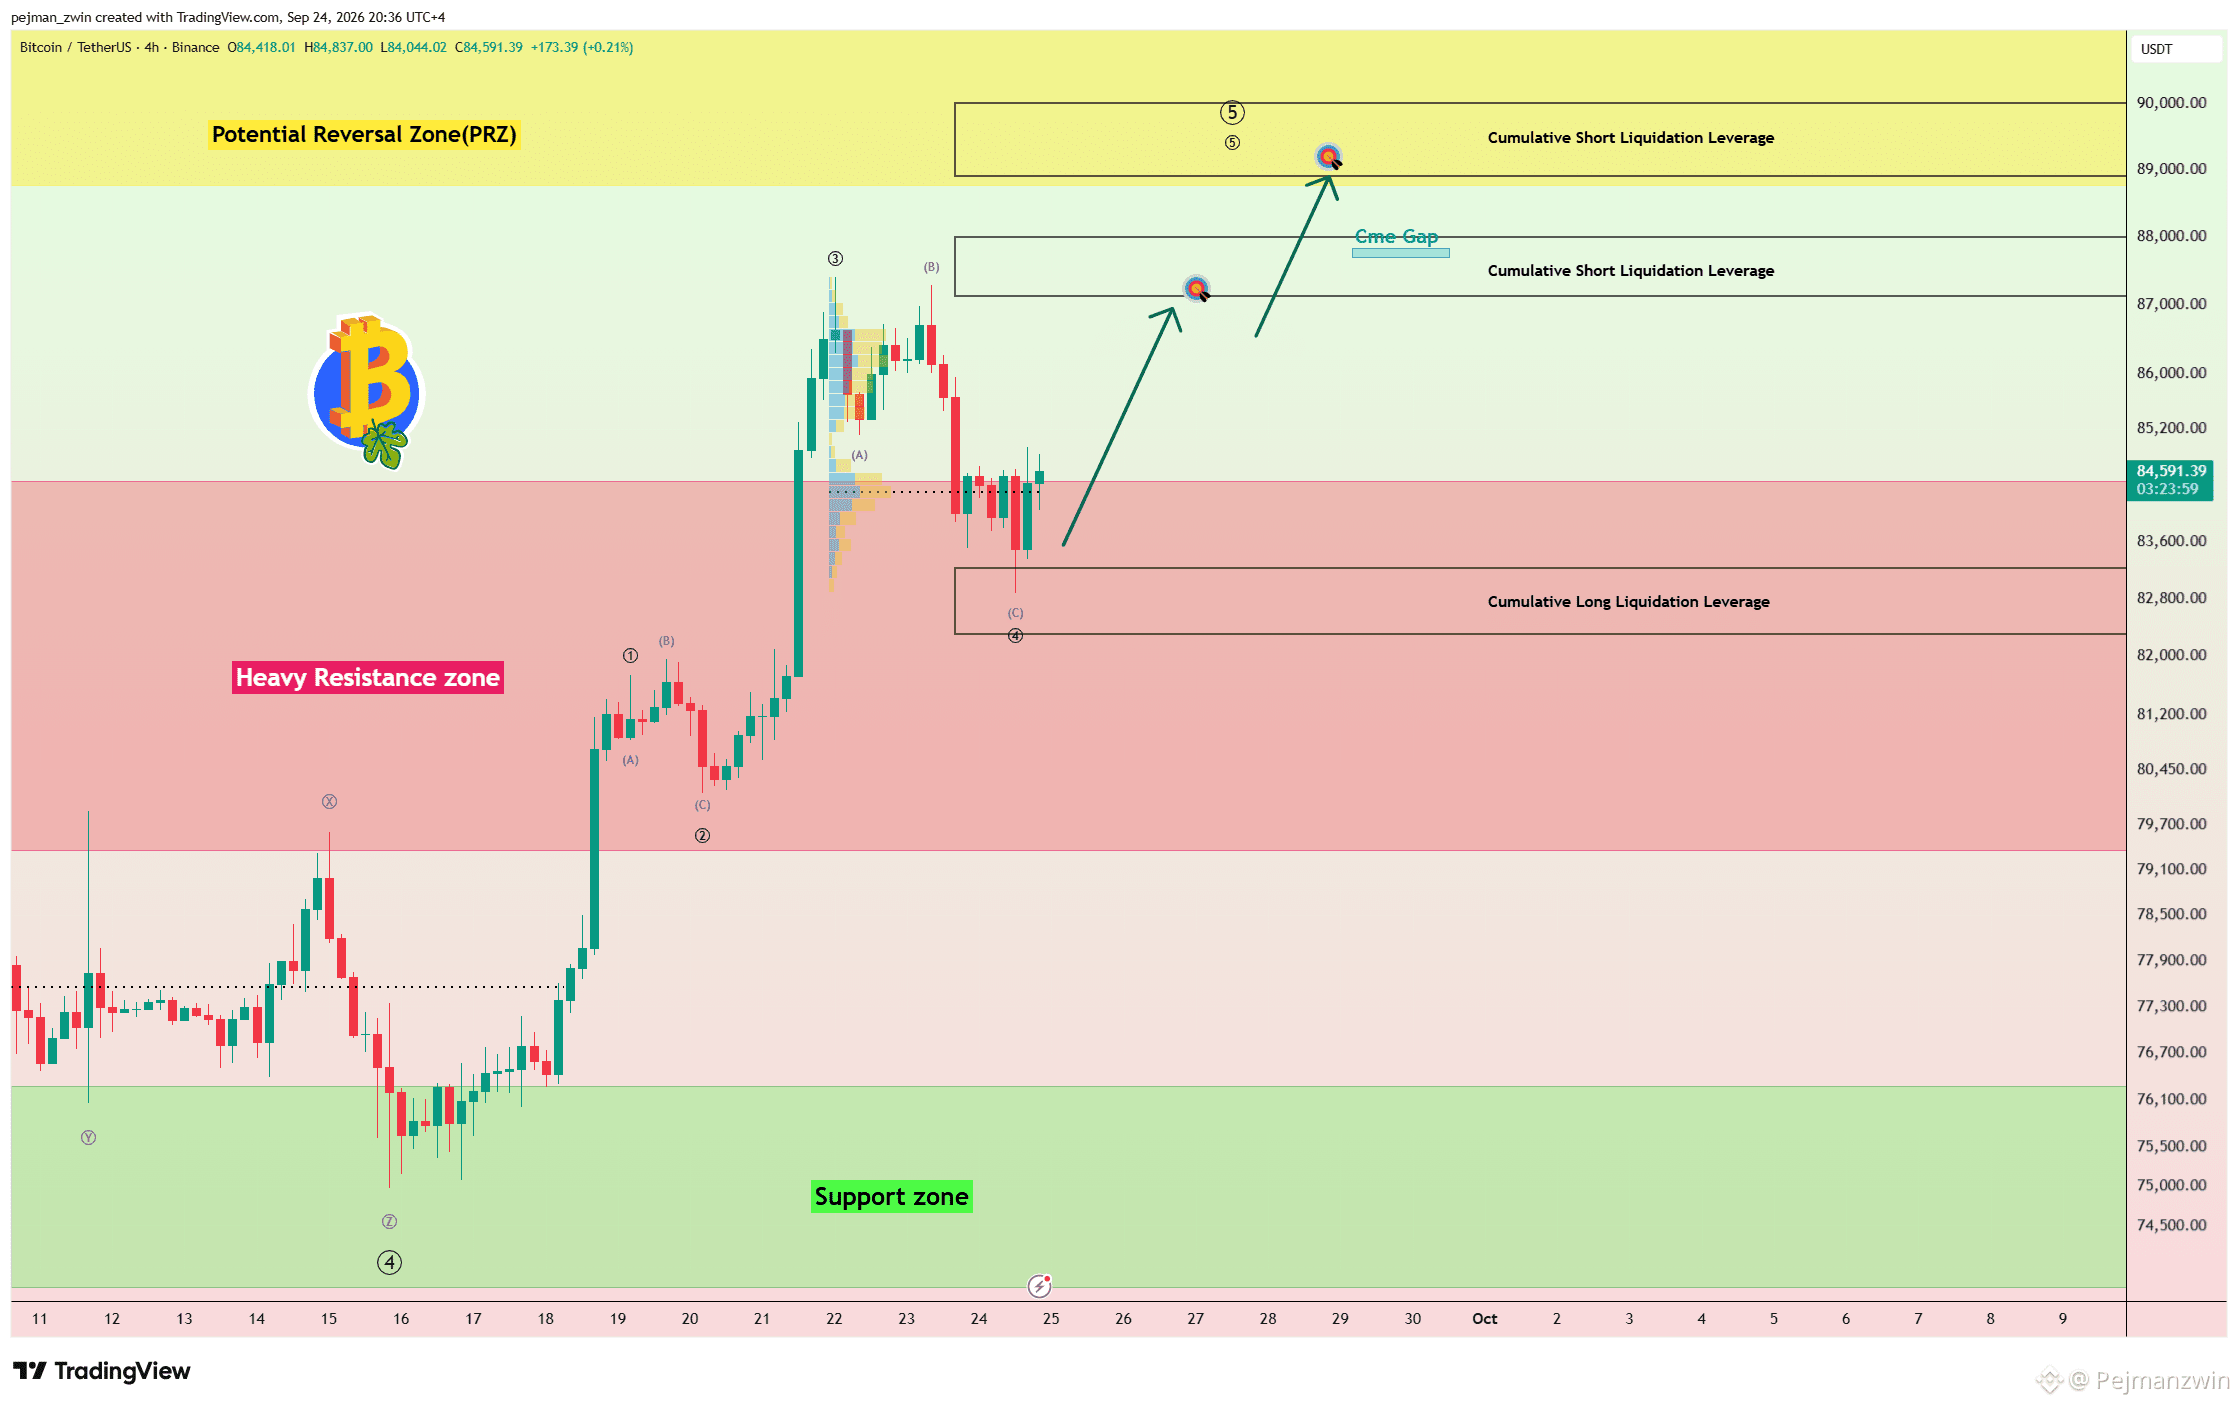
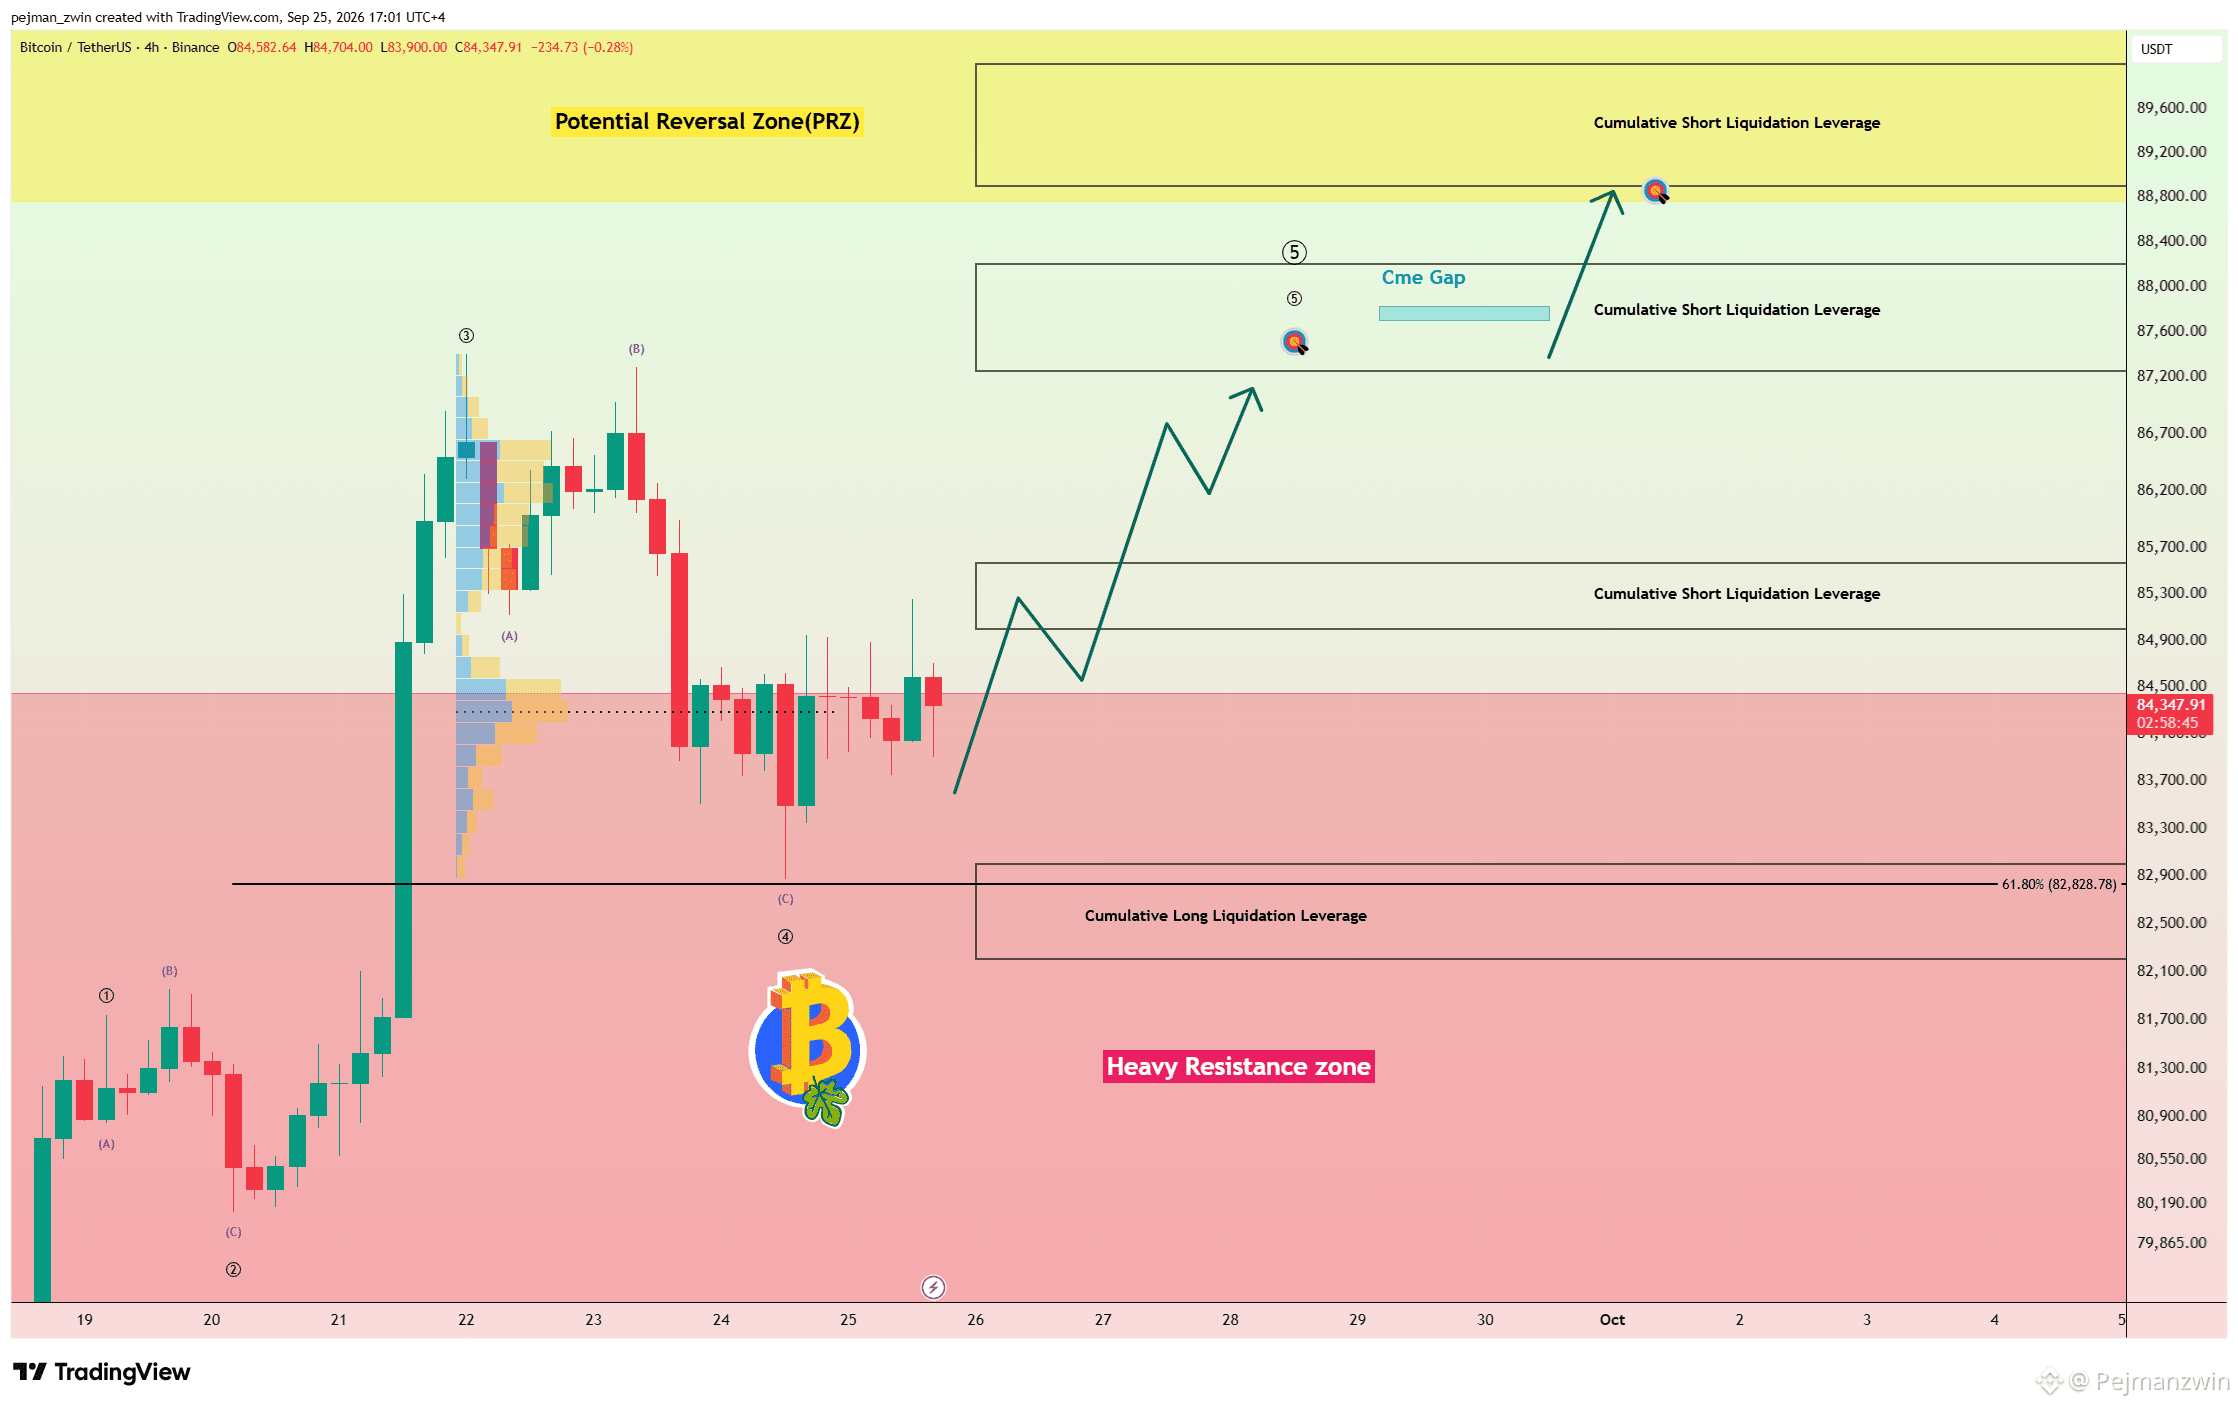
$BTC Has Been Range-Bound for 2 Days — These Liquidity Zones Could Decide the Breakout Bitcoin has been trading inside a Range for the past two days, while liquidity continues to build on both sides of the market. The key zones I’m watching are: 🔴 Short Liquidation: $89,000–$90,000 🔴 Short Liquidation: $87,250–$88,200 🔴 Short Liquidation: $85,000–$85,570 🟢 Long Liquidation: $82,200–$83,000 These liquidity clusters could act as important price magnets once BTC breaks out of its current Range. Fundamentally, the backdrop remains mixed but interesting. Strong Spot Bitcoin ETF inflows continue to provide support, while Binance has recorded unusually large BTC outflows, reducing the amount of Bitcoin immediately available on the exchange. However, short-term uncertainty remains elevated following today’s major options expiry and the recent Bitget security incident involving approximately $351.6M in unauthorized transfers. For now, the Range remains intact — but once it breaks, liquidity could accelerate the next move quickly. Which liquidity zone will Bitcoin reach first? 🔴 $85,000–$85,570 🟢 $82,200–$83,000 #bitcoin
$BTC Has Been Range-Bound for 2 Days — These Liquidity Zones Could Decide the Breakout

Bitcoin has been trading inside a Range for the past two days, while liquidity continues to build on both sides of the market.

The key zones I’m watching are:

🔴 Short Liquidation: $89,000–$90,000

🔴 Short Liquidation: $87,250–$88,200

🔴 Short Liquidation: $85,000–$85,570

🟢 Long Liquidation: $82,200–$83,000

These liquidity clusters could act as important price magnets once BTC breaks out of its current Range.

Fundamentally, the backdrop remains mixed but interesting.

Strong Spot Bitcoin ETF inflows continue to provide support, while Binance has recorded unusually large BTC outflows, reducing the amount of Bitcoin immediately available on the exchange.

However, short-term uncertainty remains elevated following today’s major options expiry and the recent Bitget security incident involving approximately $351.6M in unauthorized transfers.

For now, the Range remains intact — but once it breaks, liquidity could accelerate the next move quickly.

Which liquidity zone will Bitcoin reach first?

🔴 $85,000–$85,570
🟢 $82,200–$83,000

#bitcoin
·
--
Haussier
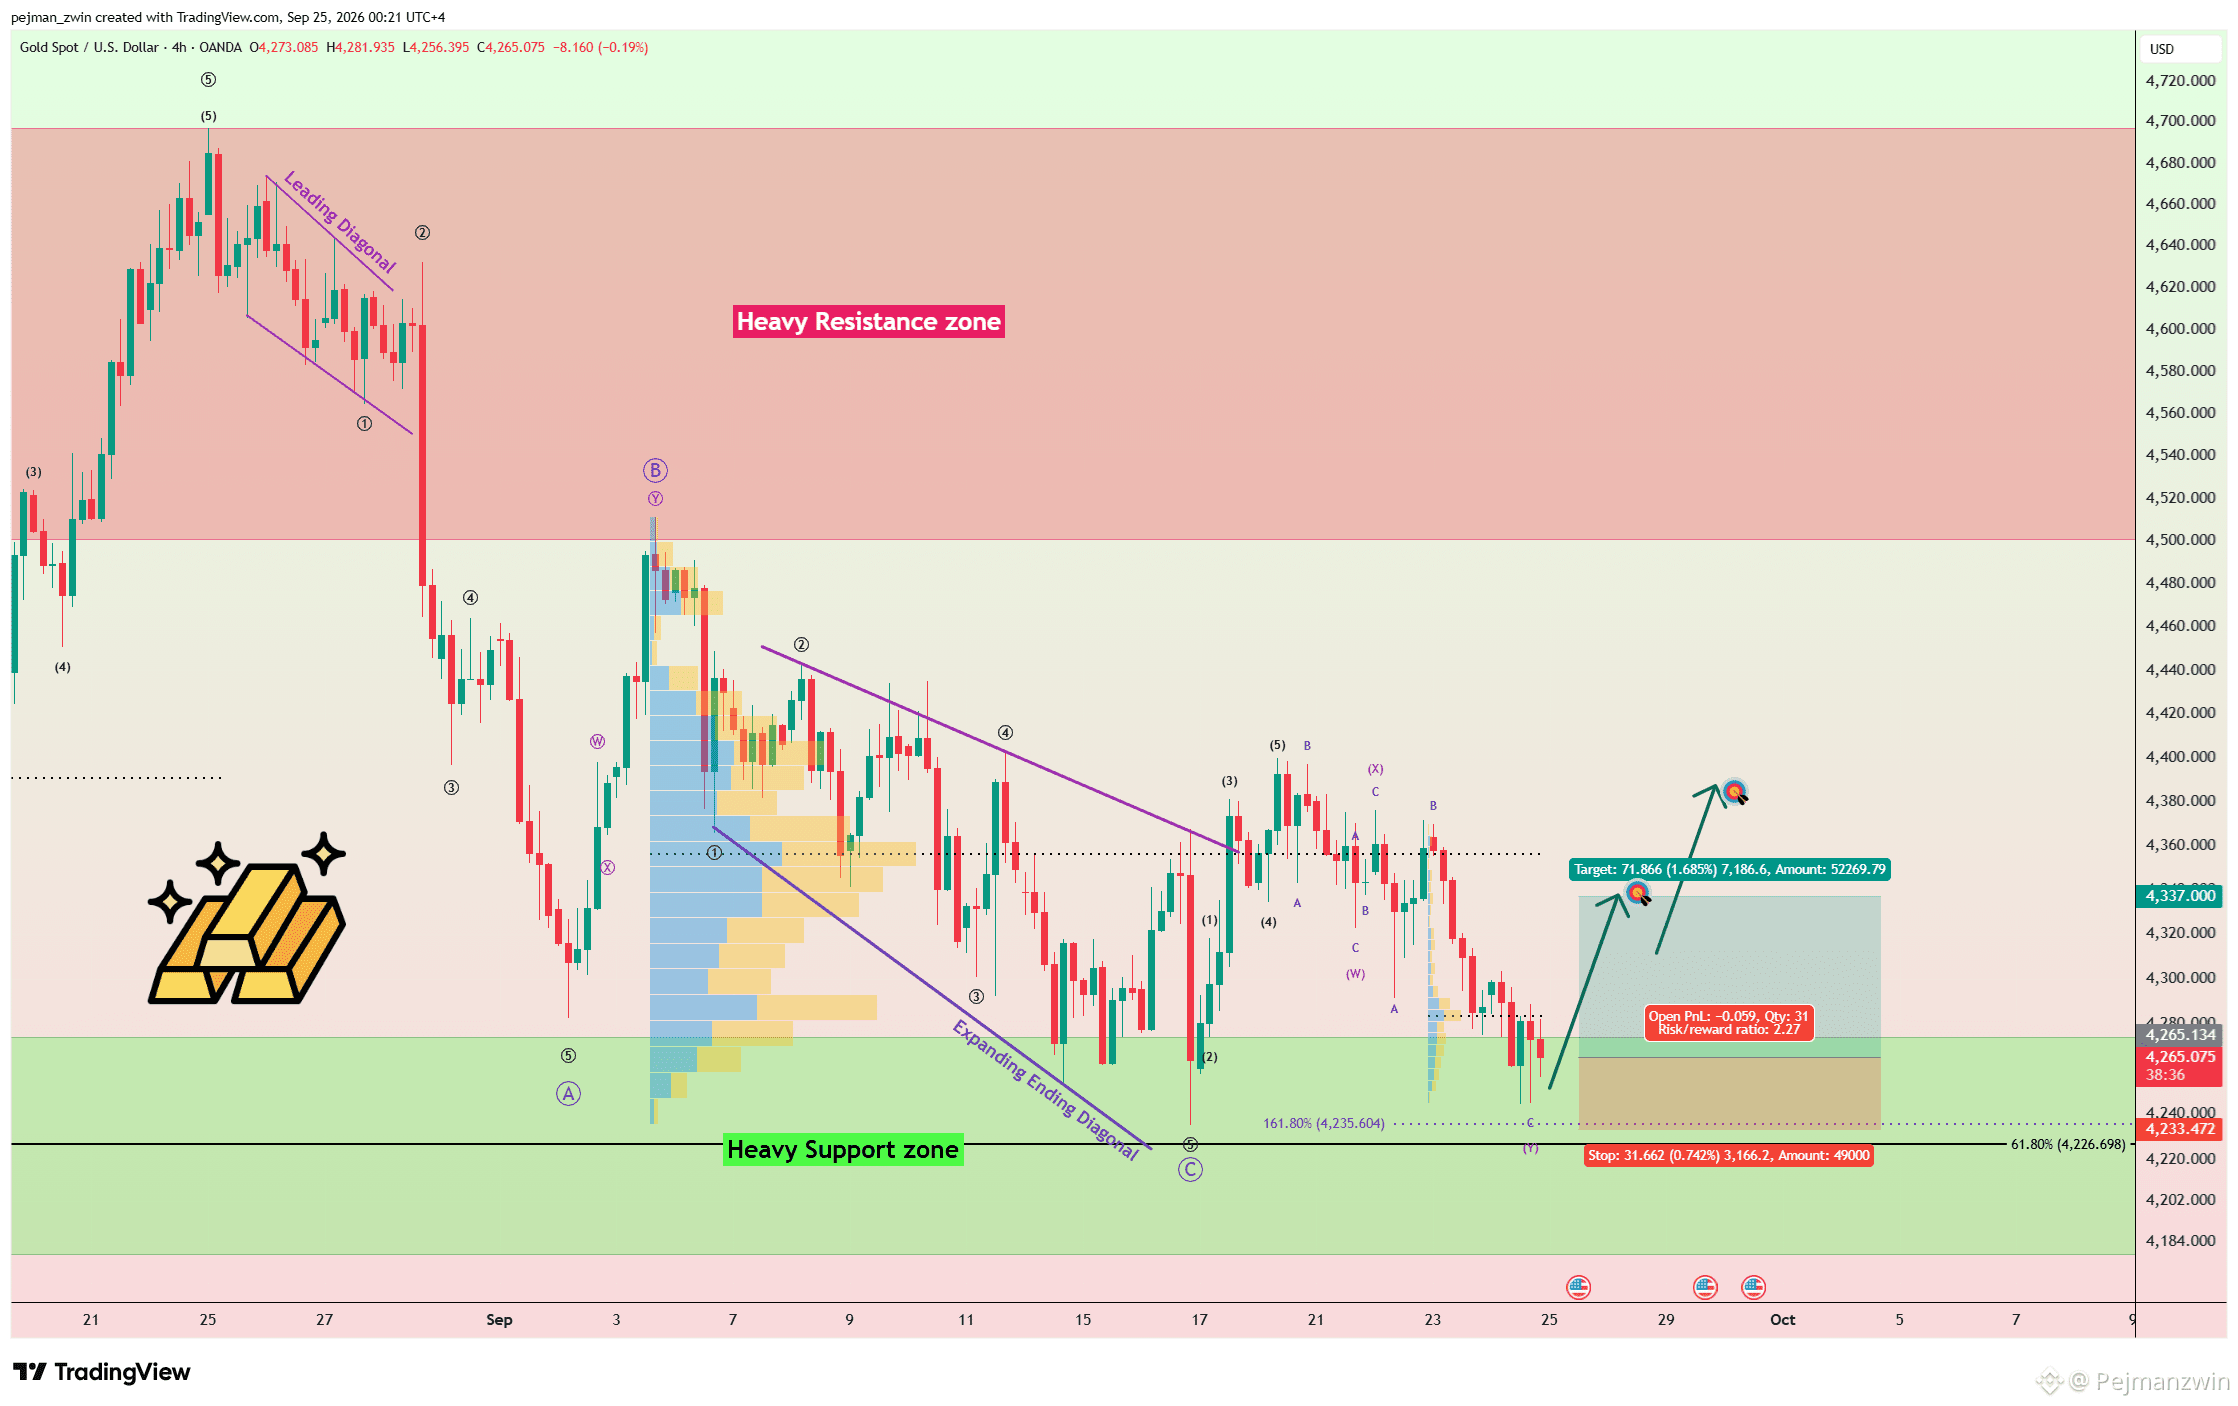
Gold Has Been Falling for 7 Days — But Buyers Still Look Strong $XAU has remained in a bearish trend for the past 6–7 days, but the decline has developed with relatively weak momentum. More importantly, the powerful bullish move completed in less than two days has still not been fully retraced after nearly a week of selling, suggesting that buyers continue to show relative strength. Gold is now trading near the 61.8% Fibonacci retracement on the Daily timeframe and inside the Heavy Support Zone at $4,178–$4,274. From an Elliott Wave perspective, the 4-hour structure still appears to be completing a Double Three Correction (W-X-Y). I initially expected this correction to finish earlier, but as long as gold remains above $4,233, the current structure remains valid. Another supportive factor could come from the U.S. 10-Year Treasury Yield. If US10Y begins to decline from its current resistance structure, lower yields could provide additional support for gold. For bullish confirmation, I want to see gold break above $4,284. That could open the way toward $4,337 first. A confirmed breakout above $4,355 could then extend the recovery toward $4,381 and potentially higher levels. Trade Setup First TP: $4,337 Second TP: $4,381 Stop Loss: $4,229 Key Levels: $4,284 | $4,355 | $4,400 Which level will gold reach first? 🟢 $4,381 🔴 $4,229 #GOLD
Gold Has Been Falling for 7 Days — But Buyers Still Look Strong

$XAU has remained in a bearish trend for the past 6–7 days, but the decline has developed with relatively weak momentum.

More importantly, the powerful bullish move completed in less than two days has still not been fully retraced after nearly a week of selling, suggesting that buyers continue to show relative strength.

Gold is now trading near the 61.8% Fibonacci retracement on the Daily timeframe and inside the Heavy Support Zone at $4,178–$4,274.

From an Elliott Wave perspective, the 4-hour structure still appears to be completing a Double Three Correction (W-X-Y).

I initially expected this correction to finish earlier, but as long as gold remains above $4,233, the current structure remains valid.

Another supportive factor could come from the U.S. 10-Year Treasury Yield. If US10Y begins to decline from its current resistance structure, lower yields could provide additional support for gold.

For bullish confirmation, I want to see gold break above $4,284.
That could open the way toward $4,337 first.

A confirmed breakout above $4,355 could then extend the recovery toward $4,381 and potentially higher levels.

Trade Setup

First TP: $4,337

Second TP: $4,381

Stop Loss: $4,229

Key Levels: $4,284 | $4,355 | $4,400

Which level will gold reach first?

🟢 $4,381

🔴 $4,229

#GOLD
·
--
Baissier
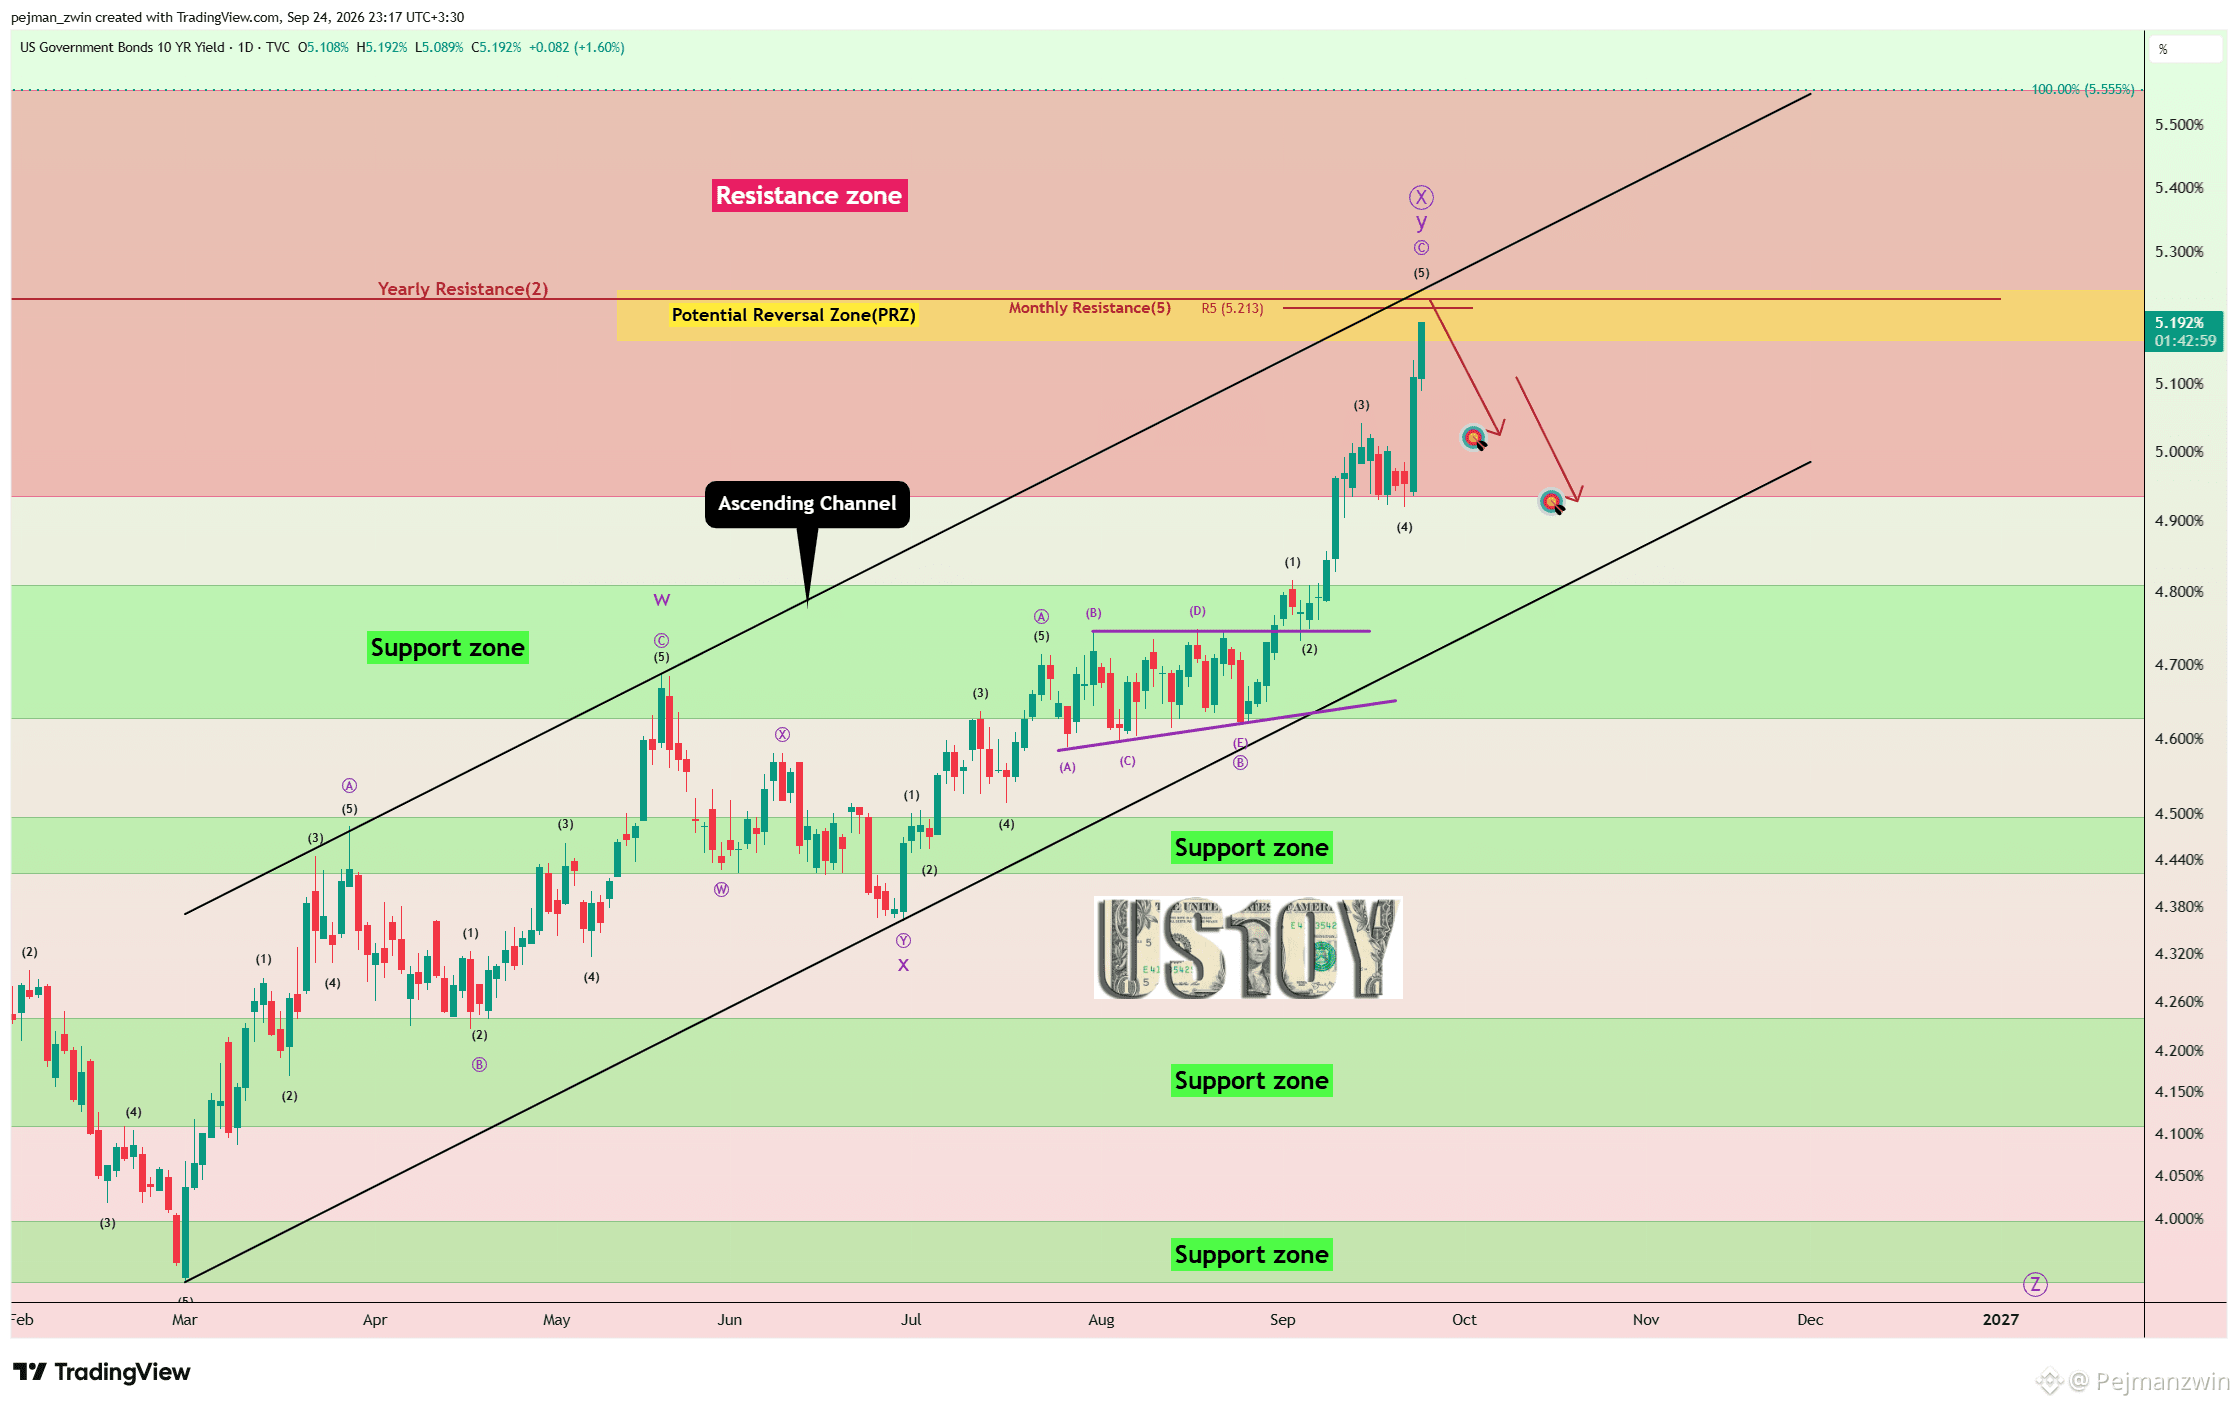
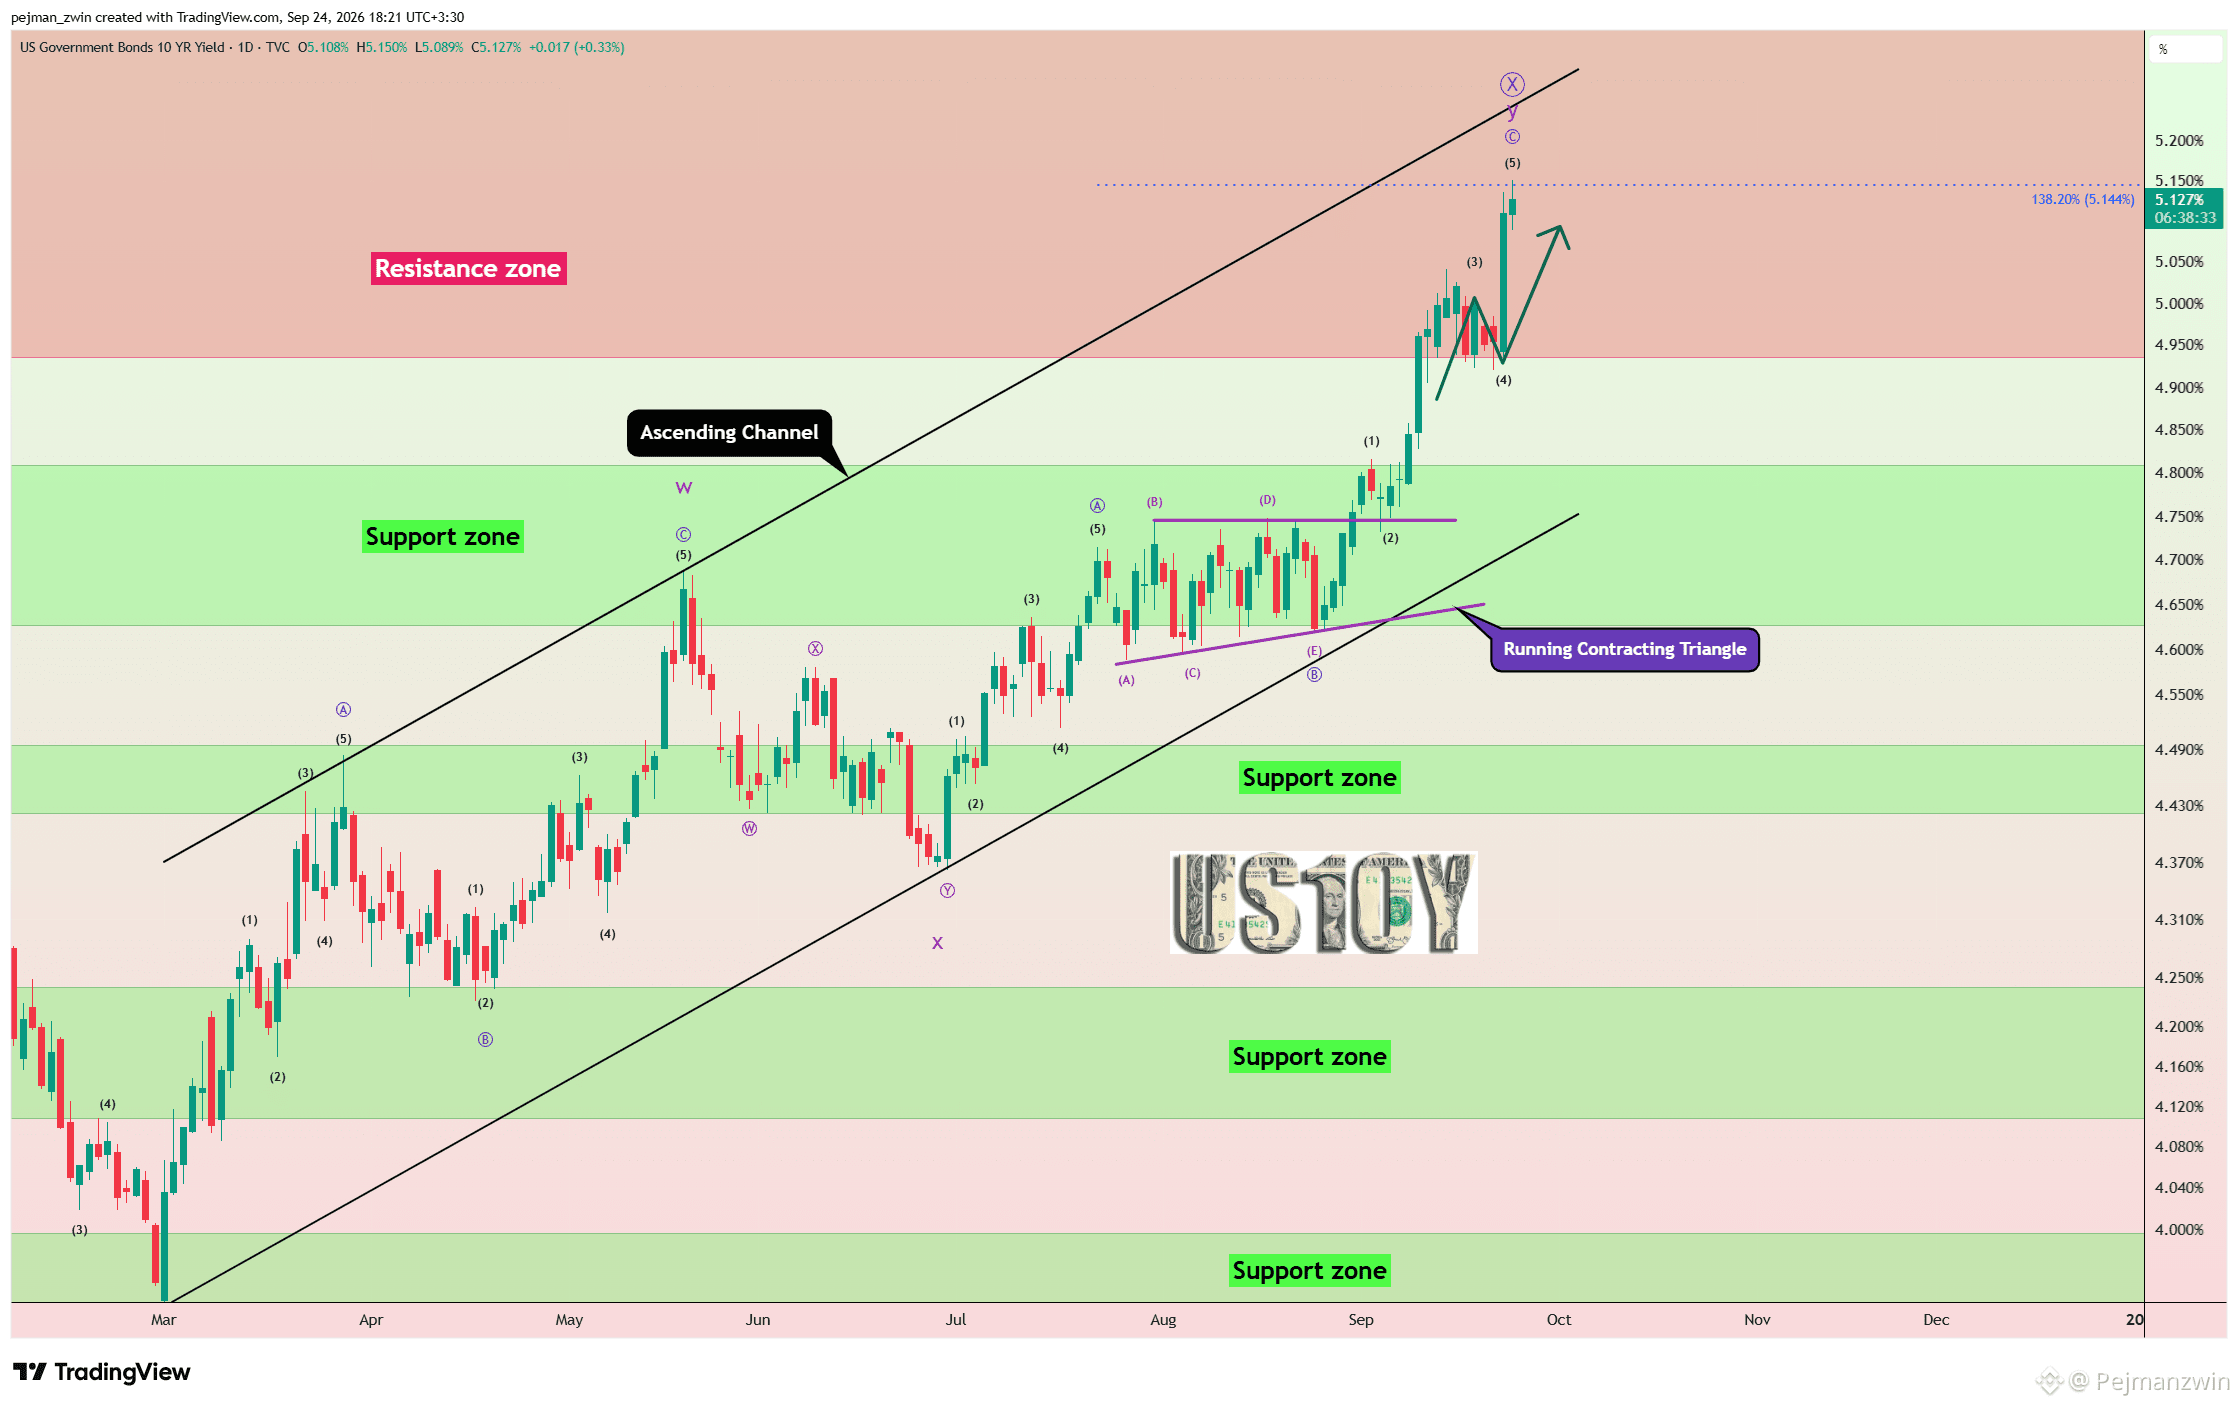
US10Y Hits a Major Resistance Cluster — Could This Trigger a Relief Rally in Risk Assets? The U.S. 10-Year Treasury Yield has rallied strongly over the past 2–3 days, tightening financial conditions and adding pressure across Gold, Bitcoin, and U.S. equities. But US10Y has now entered a major technical confluence that could change the short-term picture. The yield is trading inside the 5.55%–4.93% Resistance Zone, while also approaching: Major PRZ: 5.16%–5.25% Upper trendline of the Ascending Channel Monthly Resistance 5 Yearly Resistance 2 From an Elliott Wave perspective, US10Y also appears to be completing Wave 5, increasing the probability that corrective waves could begin from this area. I expect the U.S. 10-Year Treasury Yield to potentially start declining from the current resistance structure. If that happens, falling yields could ease financial conditions and provide support for $XAU , $BTC , and major U.S. stock indices. Trade Setup First TP: 5.03% Second TP: 4.95% Stop Loss: 5.29% This makes the current US10Y resistance cluster one of the most important macro areas to watch. Which level will US10Y reach first? 🔴 4.95% 🟢 5.29% #US10YT
US10Y Hits a Major Resistance Cluster — Could This Trigger a Relief Rally in Risk Assets?

The U.S. 10-Year Treasury Yield has rallied strongly over the past 2–3 days, tightening financial conditions and adding pressure across Gold, Bitcoin, and U.S. equities.

But US10Y has now entered a major technical confluence that could change the short-term picture.

The yield is trading inside the 5.55%–4.93% Resistance Zone, while also approaching:

Major PRZ: 5.16%–5.25%

Upper trendline of the Ascending Channel

Monthly Resistance 5

Yearly Resistance 2

From an Elliott Wave perspective, US10Y also appears to be completing Wave 5, increasing the probability that corrective waves could begin from this area.

I expect the U.S. 10-Year Treasury Yield to potentially start declining from the current resistance structure.

If that happens, falling yields could ease financial conditions and provide support for $XAU , $BTC , and major U.S. stock indices.

Trade Setup

First TP: 5.03%

Second TP: 4.95%

Stop Loss: 5.29%

This makes the current US10Y resistance cluster one of the most important macro areas to watch.

Which level will US10Y reach first?

🔴 4.95%

🟢 5.29%

#US10YT
Article
USDT Dominance Is Falling — Could This Fuel the Next Crypto Rally?$USDT Dominance (USDT.D) is one of the most important indicators I monitor when analyzing the broader cryptocurrency market. USDT Dominance represents Tether’s share of the total crypto market capitalization. In general, when USDT.D rises, it can signal that capital is rotating toward stablecoins and risk appetite is weakening. When it declines, conditions are often more supportive for Bitcoin and the broader crypto market. Right now, the structure is becoming particularly interesting. Technical Analysis On the Daily timeframe, USDT.D has entered the Heavy Support Zone at 5.25%–6.77% and successfully broken below its Support Lines. Today’s move also appears to have completed a pullback toward those previously broken Support Lines, potentially setting the stage for another move lower. From an Elliott Wave perspective, USDT.D appears to be completing its main Wave 5. The key area I’m watching is the Potential Reversal Zone (PRZ) at 6.07%–6.30%. I expect USDT Dominance to potentially continue declining toward this PRZ. If that happens, it could create a more favorable environment for Bitcoin and other cryptocurrencies, as declining stablecoin dominance generally reflects improving risk appetite across the crypto market. But There Is a Second Scenario to Watch The PRZ could become even more important once Wave 5 is complete. If USDT.D reaches 6.07%–6.30% and reacts strongly from this area, a short-term bullish reversal in dominance could begin. That would potentially create the opposite effect: USDT.D falling → supportive for crypto USDT.D reversing higher → increased correction risk for crypto This means the current decline could support another bullish phase first, while the eventual reaction from the PRZ may provide an early warning that market conditions are beginning to change. Key Zone Potential Reversal Zone (PRZ): 6.07%–6.30% For now, I’m watching for further weakness in USDT.D toward this area. But once the PRZ is reached, the reaction could become an important signal for the next short-term direction of $BTC and the broader crypto market. What do you expect first: continued weakness in USDT Dominance and higher crypto prices, or an early reversal before the PRZ is reached? #Tether

USDT Dominance Is Falling — Could This Fuel the Next Crypto Rally?

$USDT Dominance (USDT.D) is one of the most important indicators I monitor when analyzing the broader cryptocurrency market.
USDT Dominance represents Tether’s share of the total crypto market capitalization.
In general, when USDT.D rises, it can signal that capital is rotating toward stablecoins and risk appetite is weakening. When it declines, conditions are often more supportive for Bitcoin and the broader crypto market.
Right now, the structure is becoming particularly interesting.
Technical Analysis
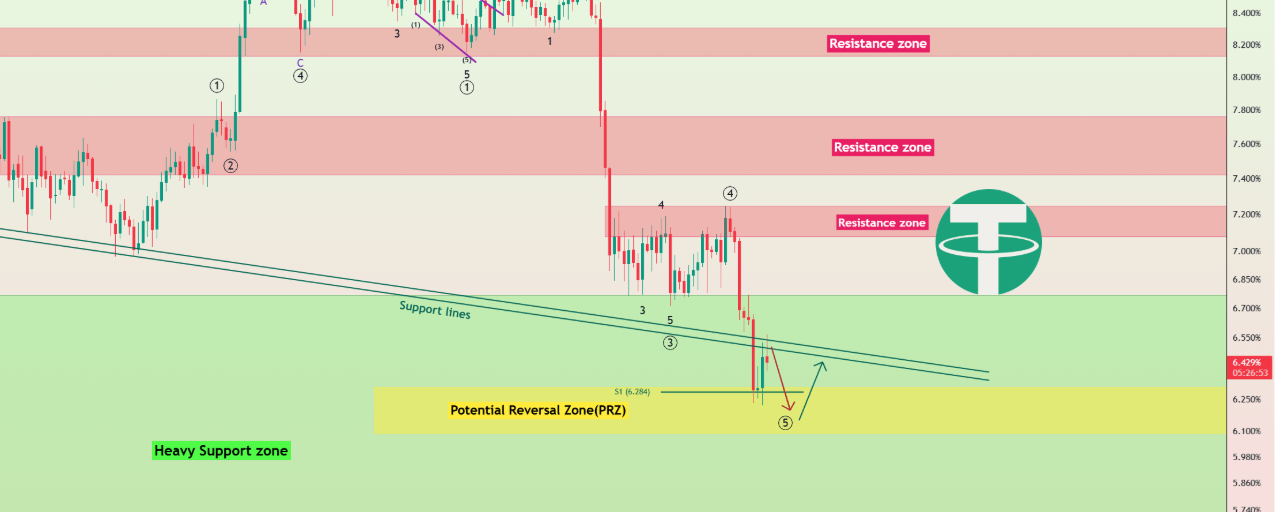
On the Daily timeframe, USDT.D has entered the Heavy Support Zone at 5.25%–6.77% and successfully broken below its Support Lines.
Today’s move also appears to have completed a pullback toward those previously broken Support Lines, potentially setting the stage for another move lower.
From an Elliott Wave perspective, USDT.D appears to be completing its main Wave 5.
The key area I’m watching is the Potential Reversal Zone (PRZ) at 6.07%–6.30%.
I expect USDT Dominance to potentially continue declining toward this PRZ.
If that happens, it could create a more favorable environment for Bitcoin and other cryptocurrencies, as declining stablecoin dominance generally reflects improving risk appetite across the crypto market.
But There Is a Second Scenario to Watch
The PRZ could become even more important once Wave 5 is complete.
If USDT.D reaches 6.07%–6.30% and reacts strongly from this area, a short-term bullish reversal in dominance could begin.
That would potentially create the opposite effect:
USDT.D falling → supportive for crypto
USDT.D reversing higher → increased correction risk for crypto
This means the current decline could support another bullish phase first, while the eventual reaction from the PRZ may provide an early warning that market conditions are beginning to change.
Key Zone
Potential Reversal Zone (PRZ): 6.07%–6.30%
For now, I’m watching for further weakness in USDT.D toward this area.
But once the PRZ is reached, the reaction could become an important signal for the next short-term direction of $BTC and the broader crypto market.
What do you expect first: continued weakness in USDT Dominance and higher crypto prices, or an early reversal before the PRZ is reached?
#Tether
·
--
Haussier
$BTC Breaks Heavy Resistance — Is $88.8K the Next Target? Bitcoin appears to have successfully broken above the Heavy Resistance Zone and is now completing a pullback toward the breakout area. BTC also reacted strongly from the Cumulative Long Liquidation Leverage at $82,300–$83,220, where buyers stepped back in. This makes the current pullback especially important: if the former resistance successfully turns into support, another bullish leg could begin. From an Elliott Wave perspective, Bitcoin appears to have completed Primary Wave 4, potentially setting the stage for the next Impulsive Waves. I expect BTC to move higher toward the nearby Cumulative Short Liquidation Leverage first. If bullish momentum strengthens, Bitcoin could extend through the upper CME Gap at $87,700–$87,825 and enter the major Potential Reversal Zone (PRZ) at $88,760–$91,860. Trade Setup First TP: $86,870 Second TP: $88,810 Stop Loss: $81,770 Long Liquidation Zone: $82,300–$83,220 Upper CME Gap: $87,700–$87,825 Major PRZ: $88,760–$91,860 The key now is whether Bitcoin can turn the broken Heavy Resistance Zone into new support. Which level will Bitcoin reach first? 🟢 $88,810 🔴 $81,770 #bitcoin
$BTC Breaks Heavy Resistance — Is $88.8K the Next Target?

Bitcoin appears to have successfully broken above the Heavy Resistance Zone and is now completing a pullback toward the breakout area.

BTC also reacted strongly from the Cumulative Long Liquidation Leverage at $82,300–$83,220, where buyers stepped back in.

This makes the current pullback especially important: if the former resistance successfully turns into support, another bullish leg could begin.

From an Elliott Wave perspective, Bitcoin appears to have completed Primary Wave 4, potentially setting the stage for the next Impulsive Waves.

I expect BTC to move higher toward the nearby Cumulative Short Liquidation Leverage first.

If bullish momentum strengthens, Bitcoin could extend through the upper CME Gap at $87,700–$87,825 and enter the major Potential Reversal Zone (PRZ) at $88,760–$91,860.

Trade Setup

First TP: $86,870

Second TP: $88,810

Stop Loss: $81,770

Long Liquidation Zone: $82,300–$83,220

Upper CME Gap: $87,700–$87,825

Major PRZ: $88,760–$91,860

The key now is whether Bitcoin can turn the broken Heavy
Resistance Zone into new support.

Which level will Bitcoin reach first?

🟢 $88,810

🔴 $81,770

#bitcoin
·
--
Haussier
US10Y Hit the Target — Is a Yield Reversal About to Begin? The U.S. 10-Year Treasury Yield moved very well according to the previous analysis and successfully reached its target. Now, the technical structure has shifted. US10Y is trading inside an important Resistance Zone and close to the upper trendline of the Ascending Channel, creating a strong resistance confluence. This area could trigger a rejection and lead to at least a short-term correction in Treasury yields. That reaction matters far beyond the bond market. If US10Y begins to decline, lower yields could ease some of the pressure on Gold, $BTC , U.S. equities, and other risk assets. However, a confirmed breakout above the current Resistance Zone and channel boundary would weaken the correction scenario and signal that yields may still have room to extend higher. For now, this is one of the most important macro areas to watch. Do you expect US10Y to reject from the current Resistance Zone, or break higher again? #US10YearTreasuryYieldNears5
US10Y Hit the Target — Is a Yield Reversal About to Begin?

The U.S. 10-Year Treasury Yield moved very well according to the previous analysis and successfully reached its target.

Now, the technical structure has shifted.

US10Y is trading inside an important Resistance Zone and close to the upper trendline of the Ascending Channel, creating a strong resistance confluence.

This area could trigger a rejection and lead to at least a short-term correction in Treasury yields.

That reaction matters far beyond the bond market.

If US10Y begins to decline, lower yields could ease some of the pressure on Gold, $BTC , U.S. equities, and other risk assets.

However, a confirmed breakout above the current Resistance Zone and channel boundary would weaken the correction scenario and signal that yields may still have room to extend higher.

For now, this is one of the most important macro areas to watch.

Do you expect US10Y to reject from the current Resistance Zone, or break higher again?

#US10YearTreasuryYieldNears5
Pejmanzwin
·
--
US10Y Is Approaching 5% — Could 5.1% Trigger Another Market Sell-Off?
The U.S. 10-Year Treasury Yield (US10Y) is one of the most important benchmarks for global interest rates and financial conditions.
Its recent rise matters far beyond the bond market.
Higher Treasury yields can put pressure on U.S. stocks, Gold, Silver, Bitcoin, and the broader crypto market by tightening financial conditions and increasing the attractiveness of risk-free assets.
The key question now is:
Could US10Y continue rising toward 5.1% and trigger another wave of pressure across financial markets?
Why US10Y Matters
US10Y represents the yield investors receive from holding a 10-year U.S. Treasury bond and is widely used as a benchmark for long-term borrowing costs.
When this yield rises sharply, its impact can spread across multiple asset classes.
U.S. Stocks: Higher yields increase borrowing costs and can pressure equity valuations, particularly growth and technology stocks.
Gold & Silver: Rising yields — especially real yields — increase the opportunity cost of holding non-yielding assets. If higher yields are accompanied by a stronger U.S. Dollar, pressure on precious metals can increase further.
Bitcoin & Crypto: Rising Treasury yields can tighten financial conditions, strengthen the Dollar and reduce investors’ appetite for risk, creating additional pressure across the crypto market.
For this reason, I closely monitor US10Y alongside the U.S. Dollar Index (DXY) when analyzing Bitcoin, Gold and U.S. equity indices.
Technical Analysis
On the daily timeframe, US10Y is approaching an important Resistance Zone after moving inside an Ascending Channel for approximately 190 days.
From an Elliott Wave perspective, the U.S. 10-Year Treasury Yield appears to be completing its main Wave X inside the Ascending Channel.
Considering recent U.S. economic data, persistent inflationary pressures and continued geopolitical risks in the Middle East, I expect US10Y to potentially continue moving higher.
The next major upside target I am watching is approximately:
5.1%
Why 5.1% Could Matter for Markets
If US10Y continues toward 5.1%, financial conditions could become even more restrictive.
That could create additional pressure on:
S&P 500 and Nasdaq through higher discount rates and borrowing costs.
Gold and Silver through higher yields and potentially a stronger Dollar.
Bitcoin and crypto through weaker risk appetite and tighter global liquidity conditions.
This does not mean every asset will automatically decline if US10Y rises, but a sustained move toward 5.1% would represent an important macro risk that traders should not ignore.
Target: 5.1%
For now, US10Y may be one of the most important charts to watch across global financial markets.
Do you think the U.S. 10-Year Treasury Yield will reach 5.1%, or will the current Resistance Zone stop the rally first?
#US10YT
IEFETF-0,36%
·
--
Baissier
Vérifié
Gold Stop Loss Hit — Now $4,235–$4,285 Could Decide the Next Major Move $XAU continued lower as the U.S. Dollar Index (DXY) and the U.S. 10-Year Treasury Yield moved higher, eventually triggering the Stop Loss from the previous analysis. Transparency remains important to me — winning targets and losing setups should both be reported. At the same time, oil prices have started rising again, adding another macro factor to watch. Over recent months, sharp moves in energy prices have played an increasingly important role in inflation expectations, Treasury yields, and broader market sentiment. From a technical perspective, gold is now approaching two important decision levels. A confirmed break below $4,235 could open the way for further downside. On the other hand, for buyers to regain control and establish a stronger recovery, gold first needs to break and hold above $4,285. For now, the market is caught between these two key levels: 🔴 Below $4,235 → bearish continuation risk increases 🟢 Above $4,285 → bullish recovery gains confirmation Which level do you think gold will break first? #GOLD
Gold Stop Loss Hit — Now $4,235–$4,285 Could Decide the Next Major Move

$XAU continued lower as the U.S. Dollar Index (DXY) and the U.S. 10-Year Treasury Yield moved higher, eventually triggering the Stop Loss from the previous analysis.

Transparency remains important to me — winning targets and losing setups should both be reported.

At the same time, oil prices have started rising again, adding another macro factor to watch. Over recent months, sharp moves in energy prices have played an increasingly important role in inflation expectations, Treasury yields, and broader market sentiment.
From a technical perspective, gold is now approaching two important decision levels.

A confirmed break below $4,235 could open the way for further downside.

On the other hand, for buyers to regain control and establish a stronger recovery, gold first needs to break and hold above $4,285.
For now, the market is caught between these two key levels:

🔴 Below $4,235 → bearish continuation risk increases

🟢 Above $4,285 → bullish recovery gains confirmation

Which level do you think gold will break first?

#GOLD
Pejmanzwin
·
--
Haussier
Gold Holds Above the Broadening Wedge: Is the Correction Ending?

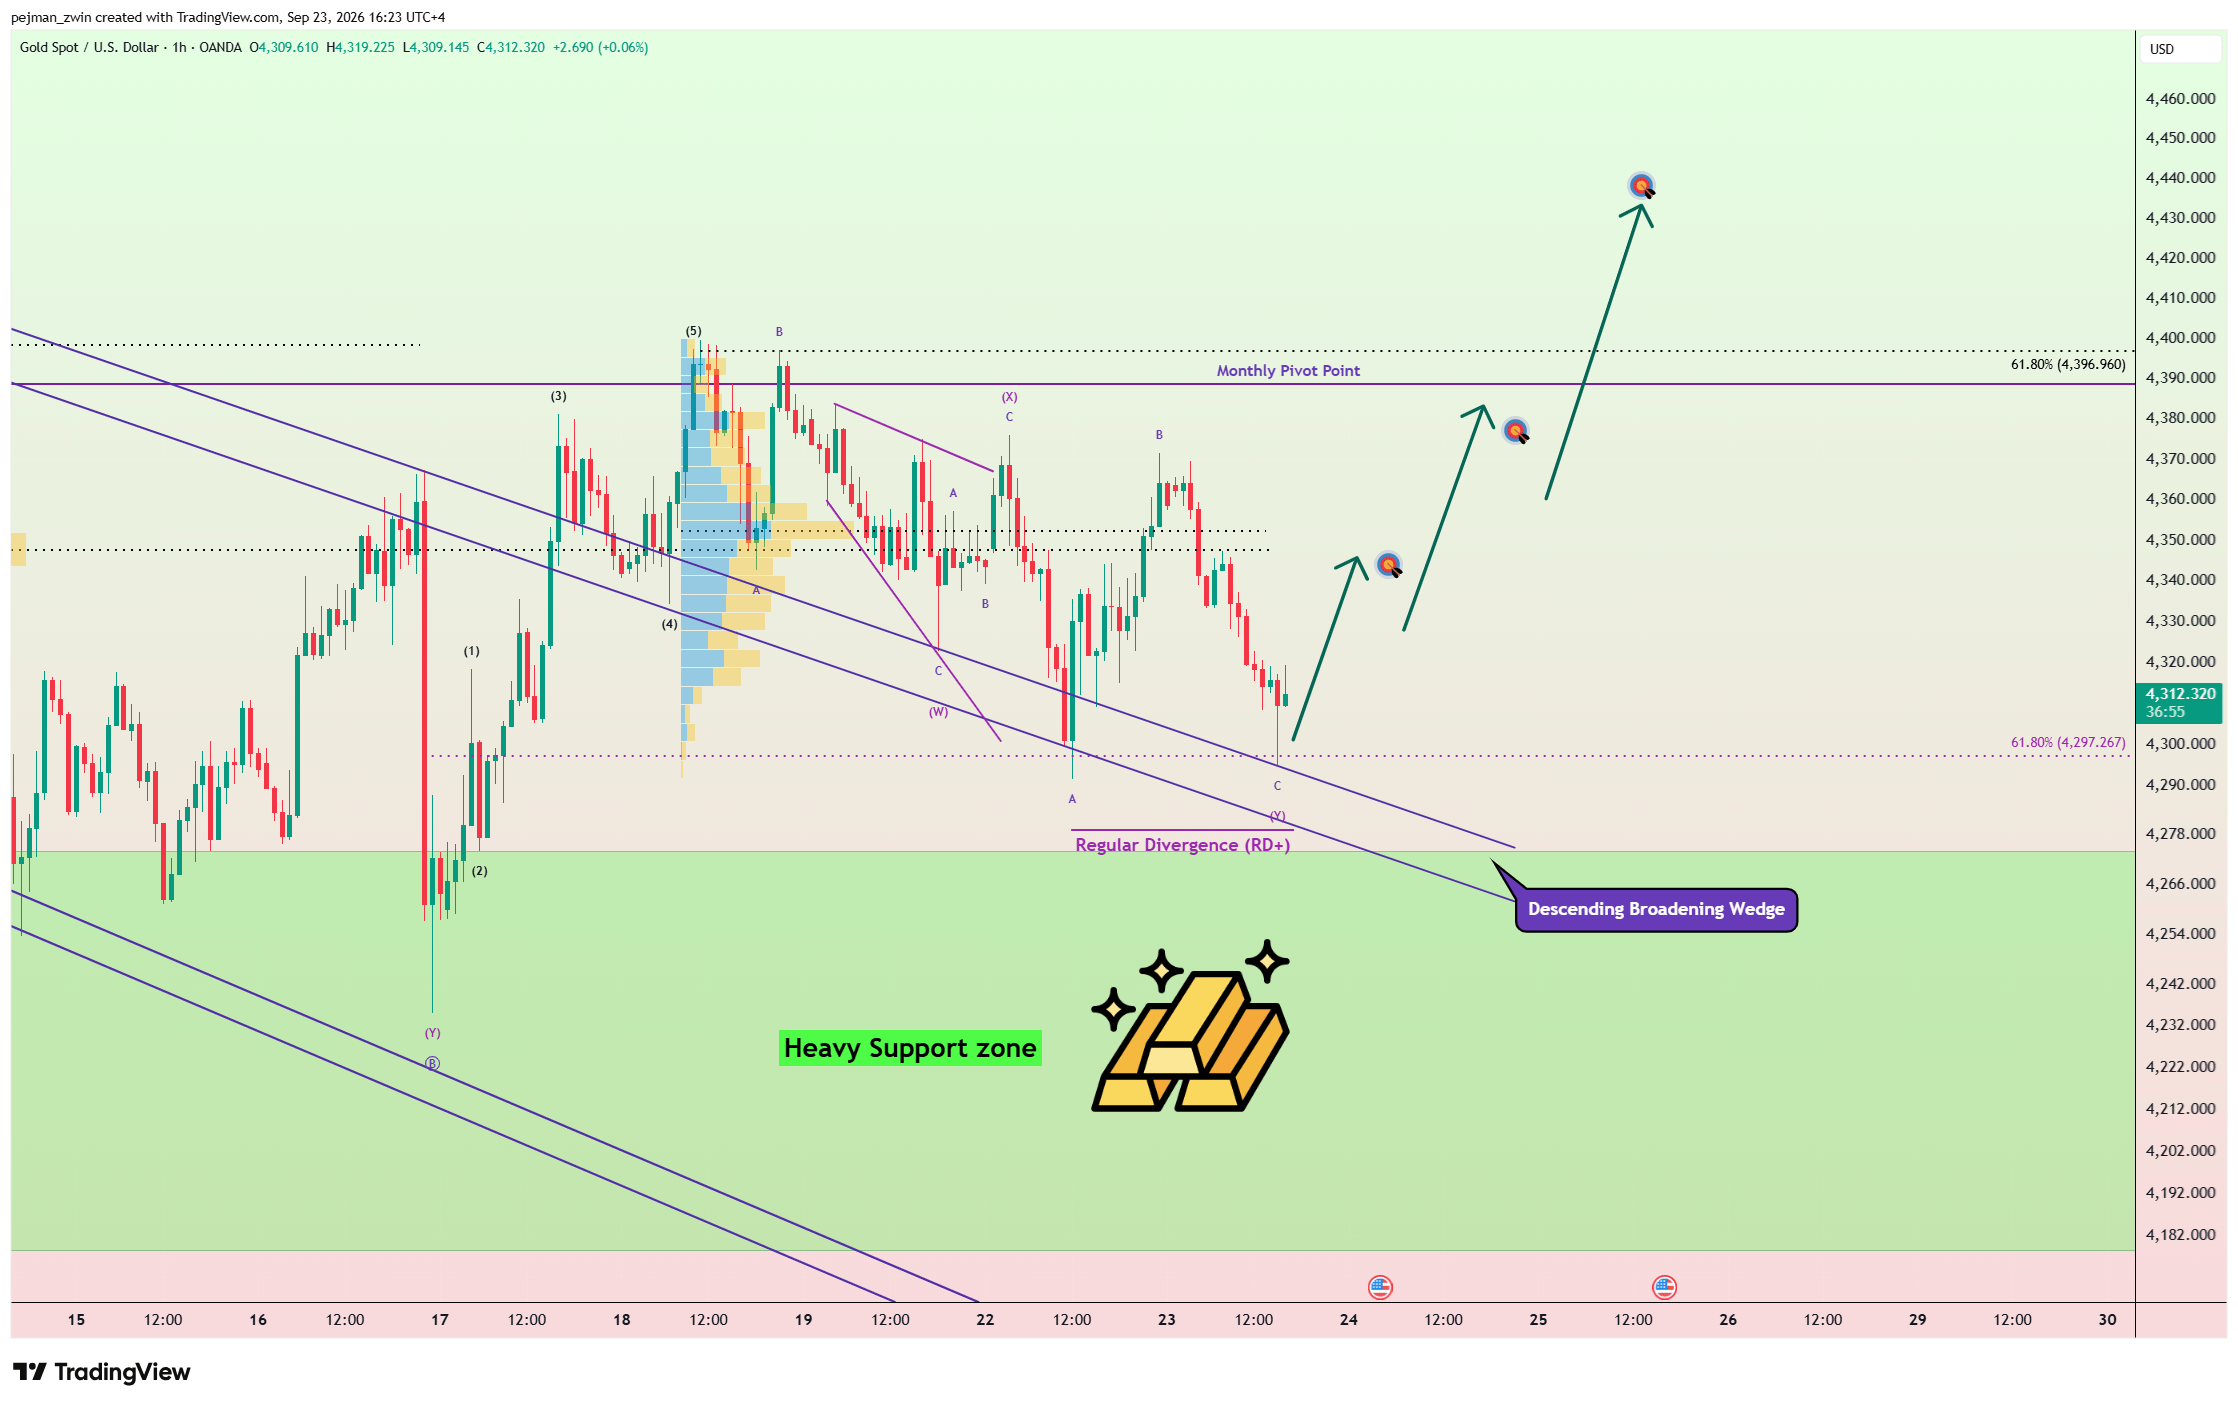
$XAU has declined over the past 4–5 days, but the move has developed with high volatility and relatively weak bearish momentum.

More importantly, price remains above the trendlines of the Descending Broadening Wedge, keeping the broader bullish scenario active.

Gold is now trading near the Heavy Support Zone, where the current correction could be approaching completion.

From an Elliott Wave perspective, gold appears to have formed a Double Three Correction (W-X-Y) over the past five days. If this structure is complete, the next impulsive bullish move could begin from the current area.

I expect gold to potentially move toward $4,344 first.
A confirmed breakout above the key $4,350 trading level could open the way toward $4,377.

If bullish momentum strengthens, gold could then extend toward $4,421, with $4,400 remaining one of the most important levels to reclaim.

Trade Setup

First TP: $4,344

Second TP: $4,377

Third TP: $4,421

Stop Loss: $4,284

Key Levels: $4,350 | $4,400

Which level will gold reach first?

🟢 $4,421

🔴 $4,284

#GOLD
·
--
Haussier
Gold Holds Above the Broadening Wedge: Is the Correction Ending? $XAU has declined over the past 4–5 days, but the move has developed with high volatility and relatively weak bearish momentum. More importantly, price remains above the trendlines of the Descending Broadening Wedge, keeping the broader bullish scenario active. Gold is now trading near the Heavy Support Zone, where the current correction could be approaching completion. From an Elliott Wave perspective, gold appears to have formed a Double Three Correction (W-X-Y) over the past five days. If this structure is complete, the next impulsive bullish move could begin from the current area. I expect gold to potentially move toward $4,344 first. A confirmed breakout above the key $4,350 trading level could open the way toward $4,377. If bullish momentum strengthens, gold could then extend toward $4,421, with $4,400 remaining one of the most important levels to reclaim. Trade Setup First TP: $4,344 Second TP: $4,377 Third TP: $4,421 Stop Loss: $4,284 Key Levels: $4,350 | $4,400 Which level will gold reach first? 🟢 $4,421 🔴 $4,284 #GOLD
Gold Holds Above the Broadening Wedge: Is the Correction Ending?

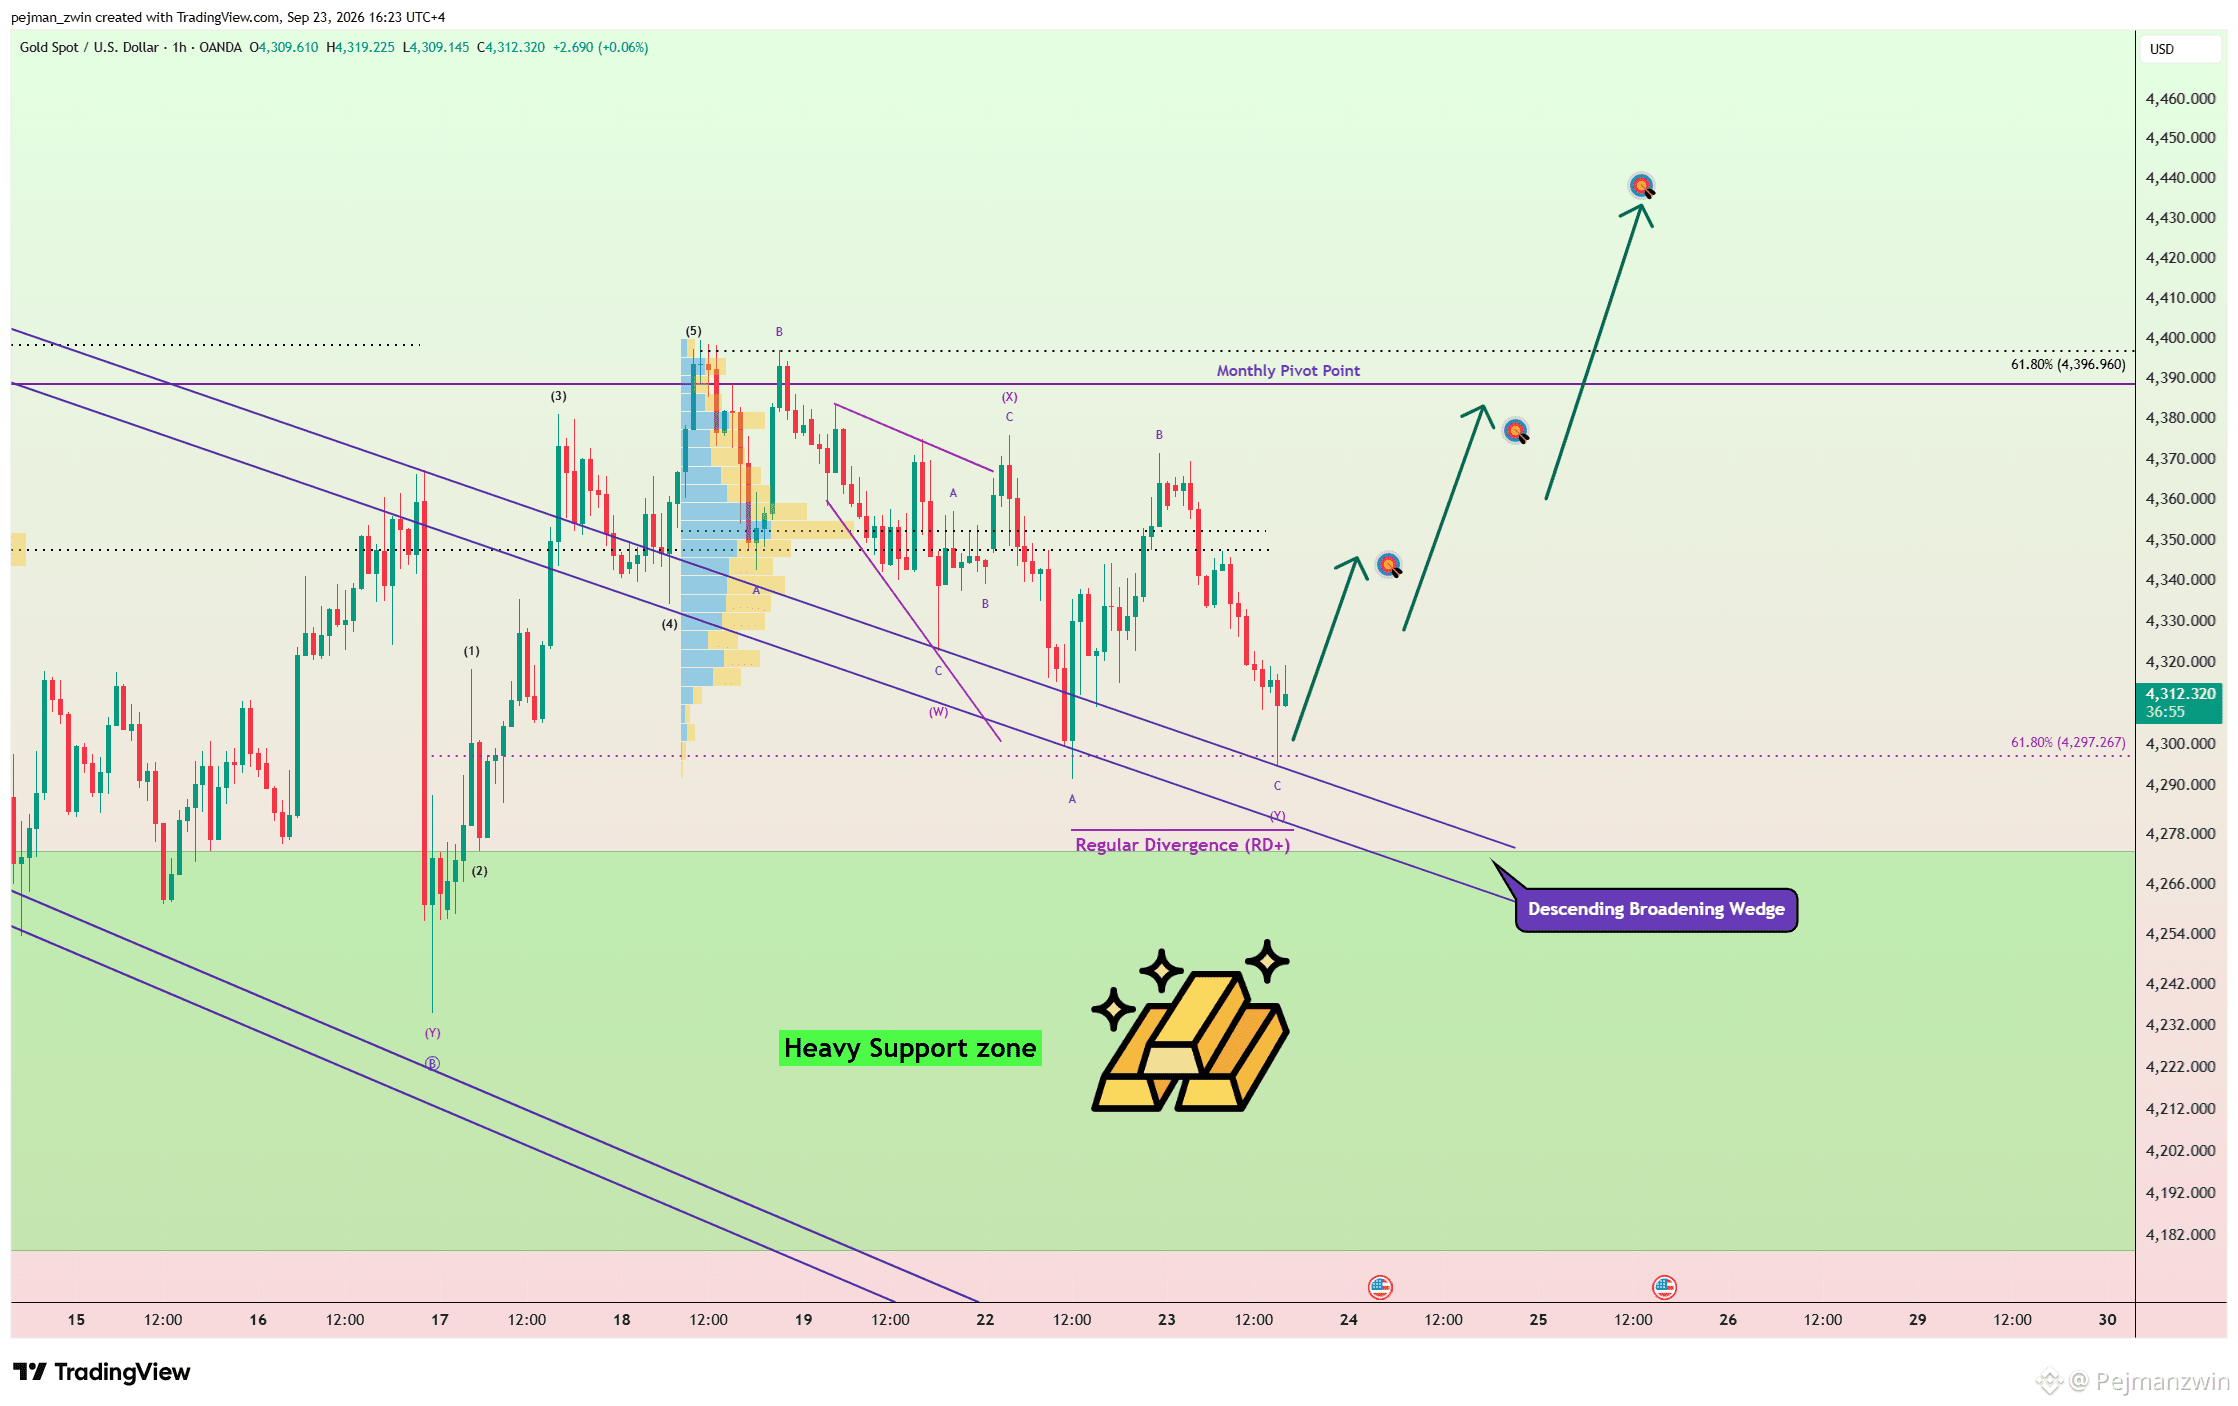
$XAU has declined over the past 4–5 days, but the move has developed with high volatility and relatively weak bearish momentum.

More importantly, price remains above the trendlines of the Descending Broadening Wedge, keeping the broader bullish scenario active.

Gold is now trading near the Heavy Support Zone, where the current correction could be approaching completion.

From an Elliott Wave perspective, gold appears to have formed a Double Three Correction (W-X-Y) over the past five days. If this structure is complete, the next impulsive bullish move could begin from the current area.

I expect gold to potentially move toward $4,344 first.
A confirmed breakout above the key $4,350 trading level could open the way toward $4,377.

If bullish momentum strengthens, gold could then extend toward $4,421, with $4,400 remaining one of the most important levels to reclaim.

Trade Setup

First TP: $4,344

Second TP: $4,377

Third TP: $4,421

Stop Loss: $4,284

Key Levels: $4,350 | $4,400

Which level will gold reach first?

🟢 $4,421

🔴 $4,284

#GOLD
·
--
Haussier
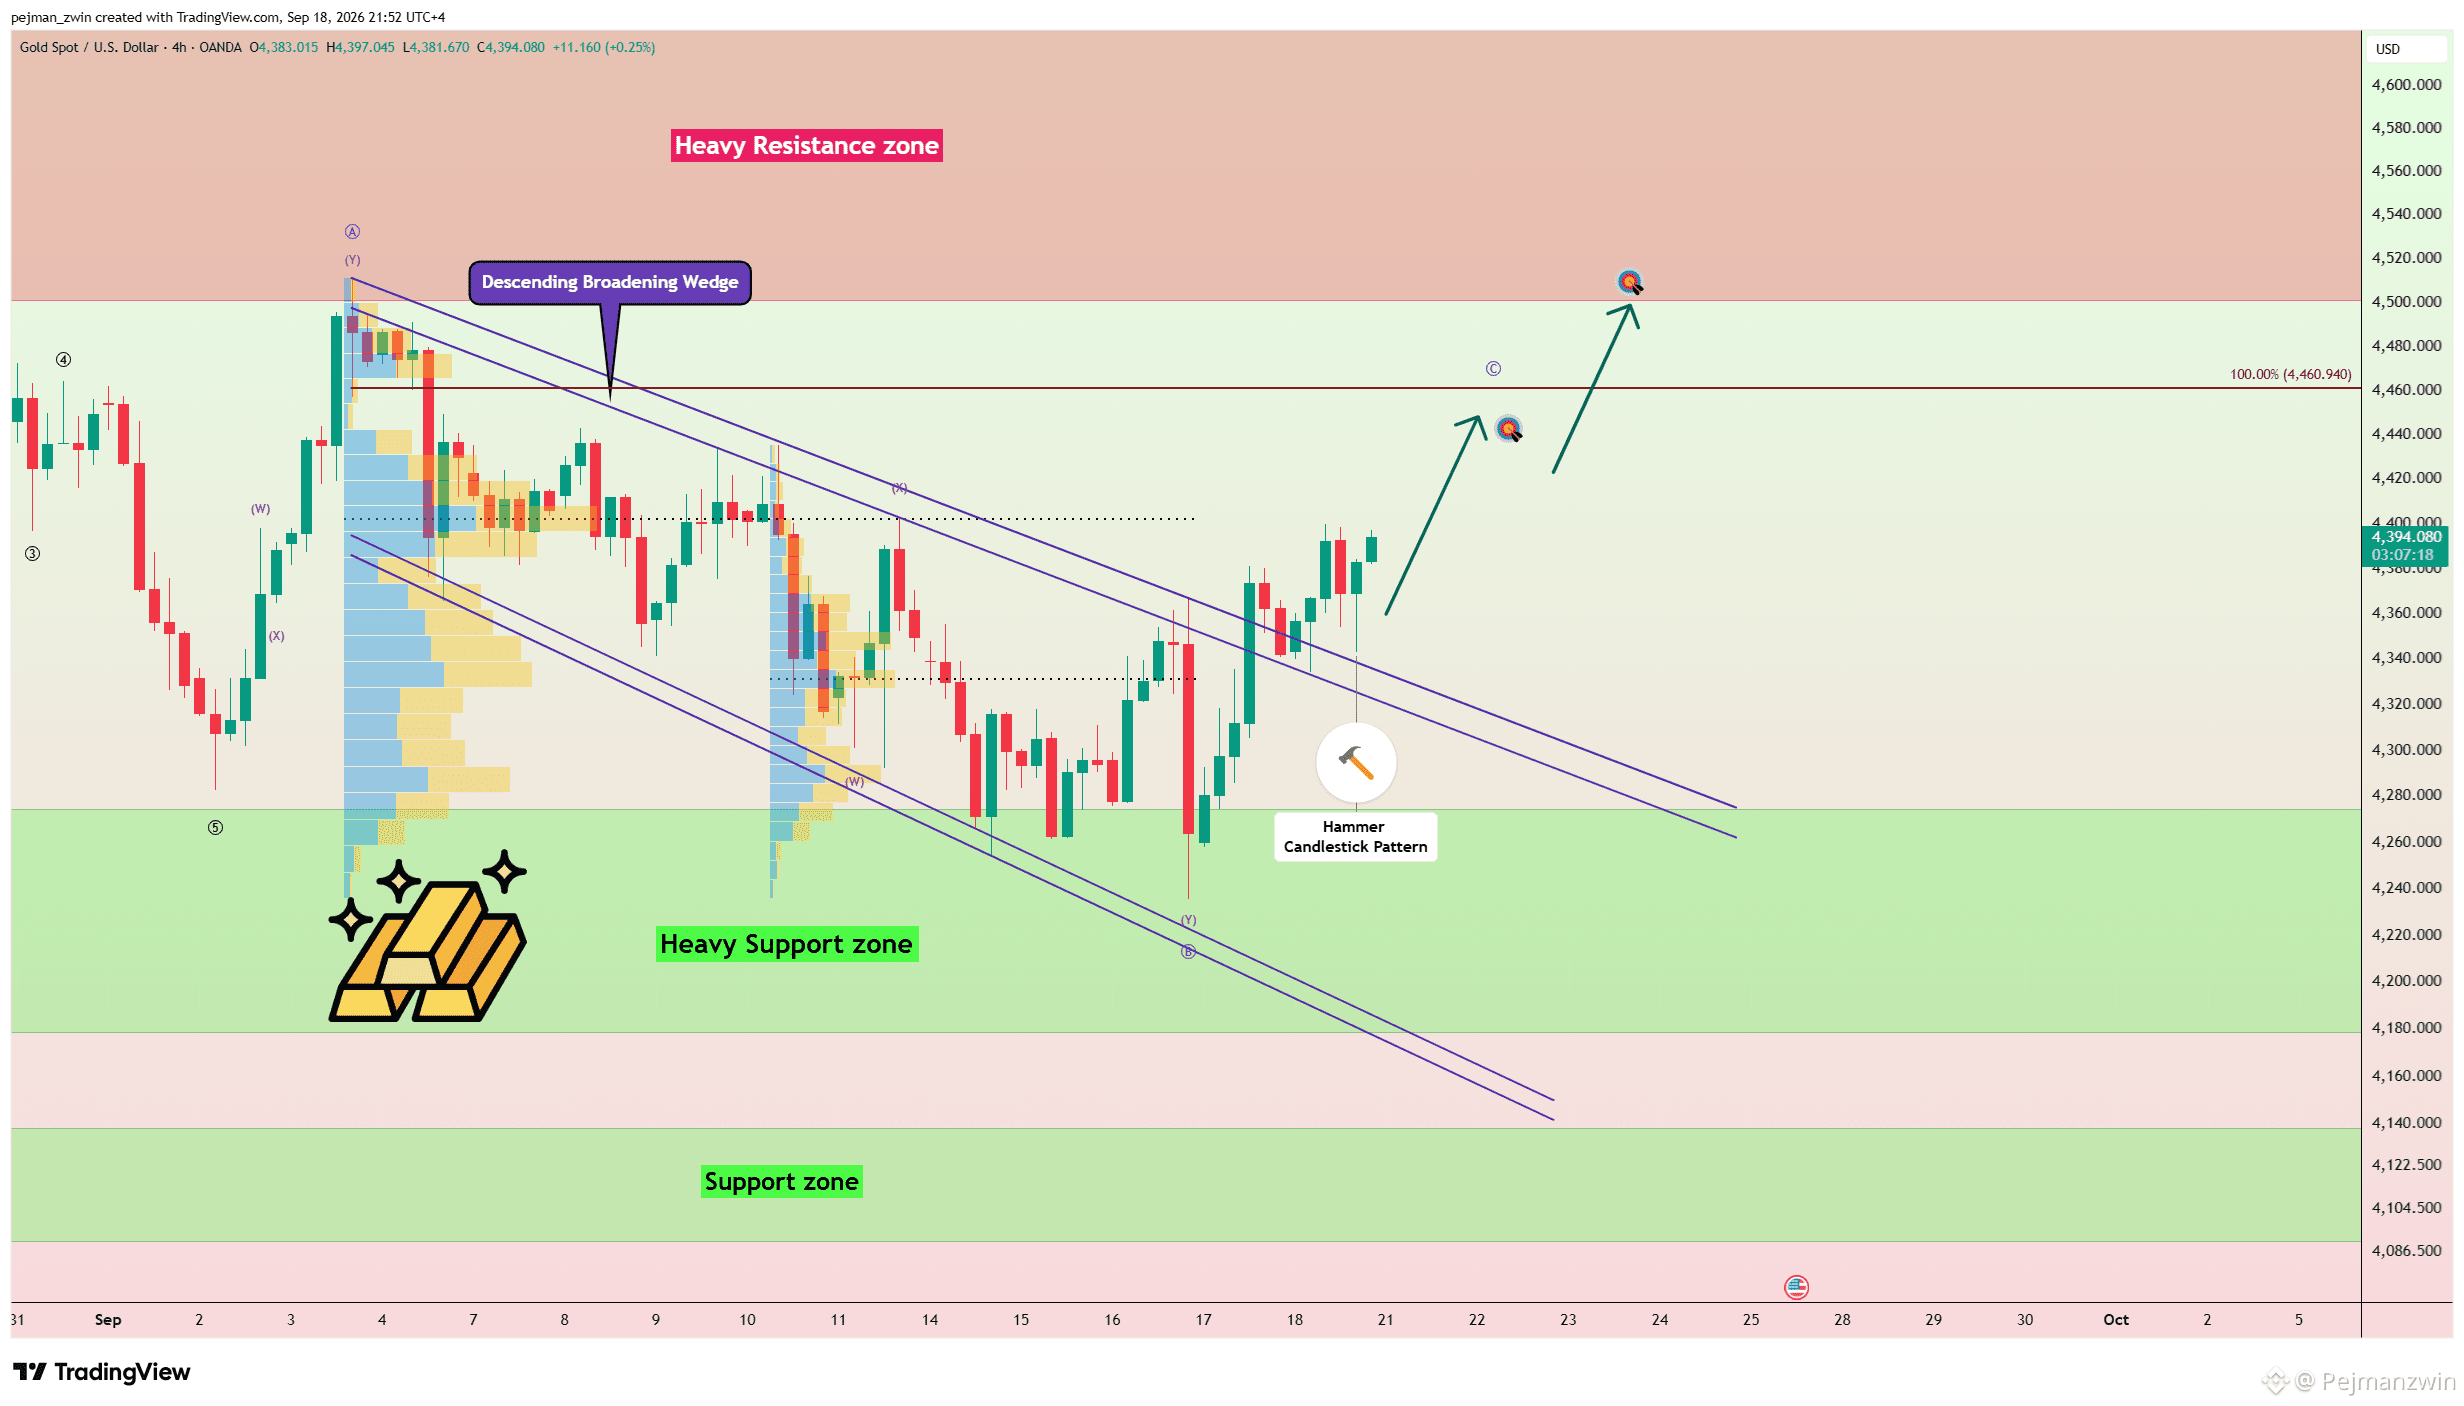
Gold Breaks the Broadening Wedge — Is $4,487 Next? $XAU has successfully broken above the upper trendline of the Descending Broadening Wedge and is now trading above the pattern. This breakout suggests that bearish pressure may be weakening and buyers are attempting to regain control — potentially setting up another bullish move during the final trading hours of the week and into next week. However, the key confirmation level remains $4,400. If gold successfully breaks and holds above $4,400, I expect bullish momentum to strengthen, opening the way toward $4,443 first. If buyers maintain control, the rally could then extend toward the $4,487 second target. Trade Setup First TP: $4,443 Second TP: $4,487 Stop Loss: $4,321 Key Levels: $4,330 | $4,400 For now, the wedge breakout is encouraging — but $4,400 is the level that could confirm the next bullish leg. Which level will gold reach first? 🟢 $4,487 🔴 $4,321 #GOLD
Gold Breaks the Broadening Wedge — Is $4,487 Next?

$XAU has successfully broken above the upper trendline of the Descending Broadening Wedge and is now trading above the pattern.

This breakout suggests that bearish pressure may be weakening and buyers are attempting to regain control — potentially setting up another bullish move during the final trading hours of the week and into next week.

However, the key confirmation level remains $4,400.

If gold successfully breaks and holds above $4,400, I expect bullish momentum to strengthen, opening the way toward $4,443 first.

If buyers maintain control, the rally could then extend toward the $4,487 second target.

Trade Setup

First TP: $4,443

Second TP: $4,487

Stop Loss: $4,321

Key Levels: $4,330 | $4,400

For now, the wedge breakout is encouraging — but $4,400 is the level that could confirm the next bullish leg.

Which level will gold reach first?

🟢 $4,487

🔴 $4,321

#GOLD
Article
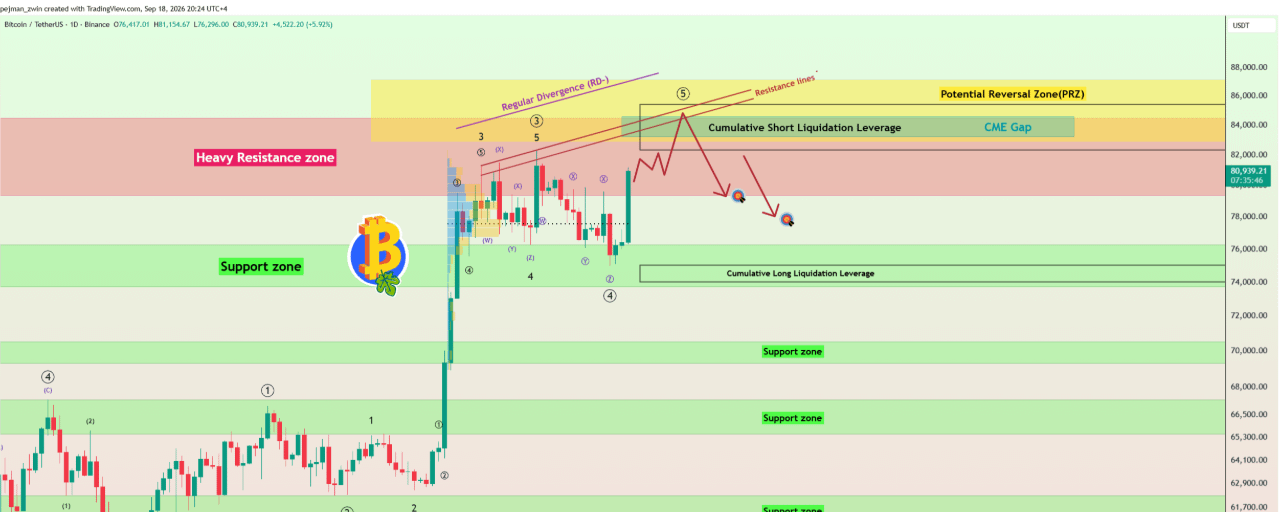
BTC Surges 7% — But Is This Rally Setting Up a Bull Trap?$BTC has gained more than 6–7% over the past few hours, building strong bullish momentum and pushing back toward some of the most important resistance levels on the chart. But after such a sharp move, Bitcoin is now entering a major technical resistance structure — while ETF flows remain inconsistent and regulatory uncertainty has not disappeared. Can Bitcoin establish itself above $85,000, or is the current rally setting up another correction? Macro Outlook From a fundamental perspective, the bullish move still needs confirmation. Bitcoin ETF flows have remained volatile rather than consistently bullish, suggesting that institutional demand has not yet developed into a stable one-way trend. At the same time, the failure of the CLARITY Act to advance in the U.S. Senate has added another layer of regulatory uncertainty for the crypto market. These factors do not necessarily end the rally, but they increase the importance of confirmation before assuming that a sustained bullish breakout has begun. Technical Analysis Bitcoin is currently trading inside the Heavy Resistance Zone at $79,350–$84,500, while approaching several major technical areas at the same time: Potential Reversal Zone (PRZ): $82,850–$87,100 Cumulative Short Liquidation Leverage: $82,300–$85,400 Resistance Lines The upper CME Gap at $83,215–$84,560 is also back in focus and could finally be filled after remaining open for several months. From an Elliott Wave perspective, Bitcoin appears to be completing Primary Wave 5, while Primary Wave 3 developed as an Extended Wave. A Negative Regular Divergence (RD-) is also visible between Consecutive Peaks, providing another warning that bullish momentum may be weakening as price moves deeper into resistance. I expect Bitcoin to potentially move further into the Cumulative Short Liquidation Leverage and major PRZ, possibly filling the upper CME Gap first. A temporary breakout above the Heavy Resistance Zone — followed by a Bull Trap — also remains possible before the next bearish move develops. From this broader resistance structure, I expect Bitcoin to potentially correct toward $79,000. If bearish momentum strengthens, the decline could extend toward the key $77,700 trading level. Trade Setup First TP: $79,000 Second TP: $77,700 Stop Loss: $87,300 Key Trading Level: $77,700 Upper CME Gap: $83,215–$84,560 Bitcoin’s momentum is clearly bullish right now — but price is also entering one of the strongest technical resistance clusters on the chart. The next reaction inside $82,300–$87,100 could determine whether this rally develops into a genuine breakout or ends with another Bull Trap. Which level will Bitcoin reach first? 🔴 $77,700 🟢 $87,300 #bitcoin

BTC Surges 7% — But Is This Rally Setting Up a Bull Trap?

$BTC has gained more than 6–7% over the past few hours, building strong bullish momentum and pushing back toward some of the most important resistance levels on the chart.
But after such a sharp move, Bitcoin is now entering a major technical resistance structure — while ETF flows remain inconsistent and regulatory uncertainty has not disappeared.
Can Bitcoin establish itself above $85,000, or is the current rally setting up another correction?
Macro Outlook
From a fundamental perspective, the bullish move still needs confirmation.
Bitcoin ETF flows have remained volatile rather than consistently bullish, suggesting that institutional demand has not yet developed into a stable one-way trend.
At the same time, the failure of the CLARITY Act to advance in the U.S. Senate has added another layer of regulatory uncertainty for the crypto market.
These factors do not necessarily end the rally, but they increase the importance of confirmation before assuming that a sustained bullish breakout has begun.
Technical Analysis
Bitcoin is currently trading inside the Heavy Resistance Zone at $79,350–$84,500, while approaching several major technical areas at the same time:
Potential Reversal Zone (PRZ): $82,850–$87,100
Cumulative Short Liquidation Leverage: $82,300–$85,400
Resistance Lines
The upper CME Gap at $83,215–$84,560 is also back in focus and could finally be filled after remaining open for several months.
From an Elliott Wave perspective, Bitcoin appears to be completing Primary Wave 5, while Primary Wave 3 developed as an Extended Wave.
A Negative Regular Divergence (RD-) is also visible between Consecutive Peaks, providing another warning that bullish momentum may be weakening as price moves deeper into resistance.
I expect Bitcoin to potentially move further into the Cumulative Short Liquidation Leverage and major PRZ, possibly filling the upper CME Gap first.
A temporary breakout above the Heavy Resistance Zone — followed by a Bull Trap — also remains possible before the next bearish move develops.
From this broader resistance structure, I expect Bitcoin to potentially correct toward $79,000.
If bearish momentum strengthens, the decline could extend toward the key $77,700 trading level.
Trade Setup
First TP: $79,000
Second TP: $77,700
Stop Loss: $87,300
Key Trading Level: $77,700
Upper CME Gap: $83,215–$84,560
Bitcoin’s momentum is clearly bullish right now — but price is also entering one of the strongest technical resistance clusters on the chart.
The next reaction inside $82,300–$87,100 could determine whether this rally develops into a genuine breakout or ends with another Bull Trap.
Which level will Bitcoin reach first?
🔴 $77,700
🟢 $87,300
#bitcoin
·
--
Haussier
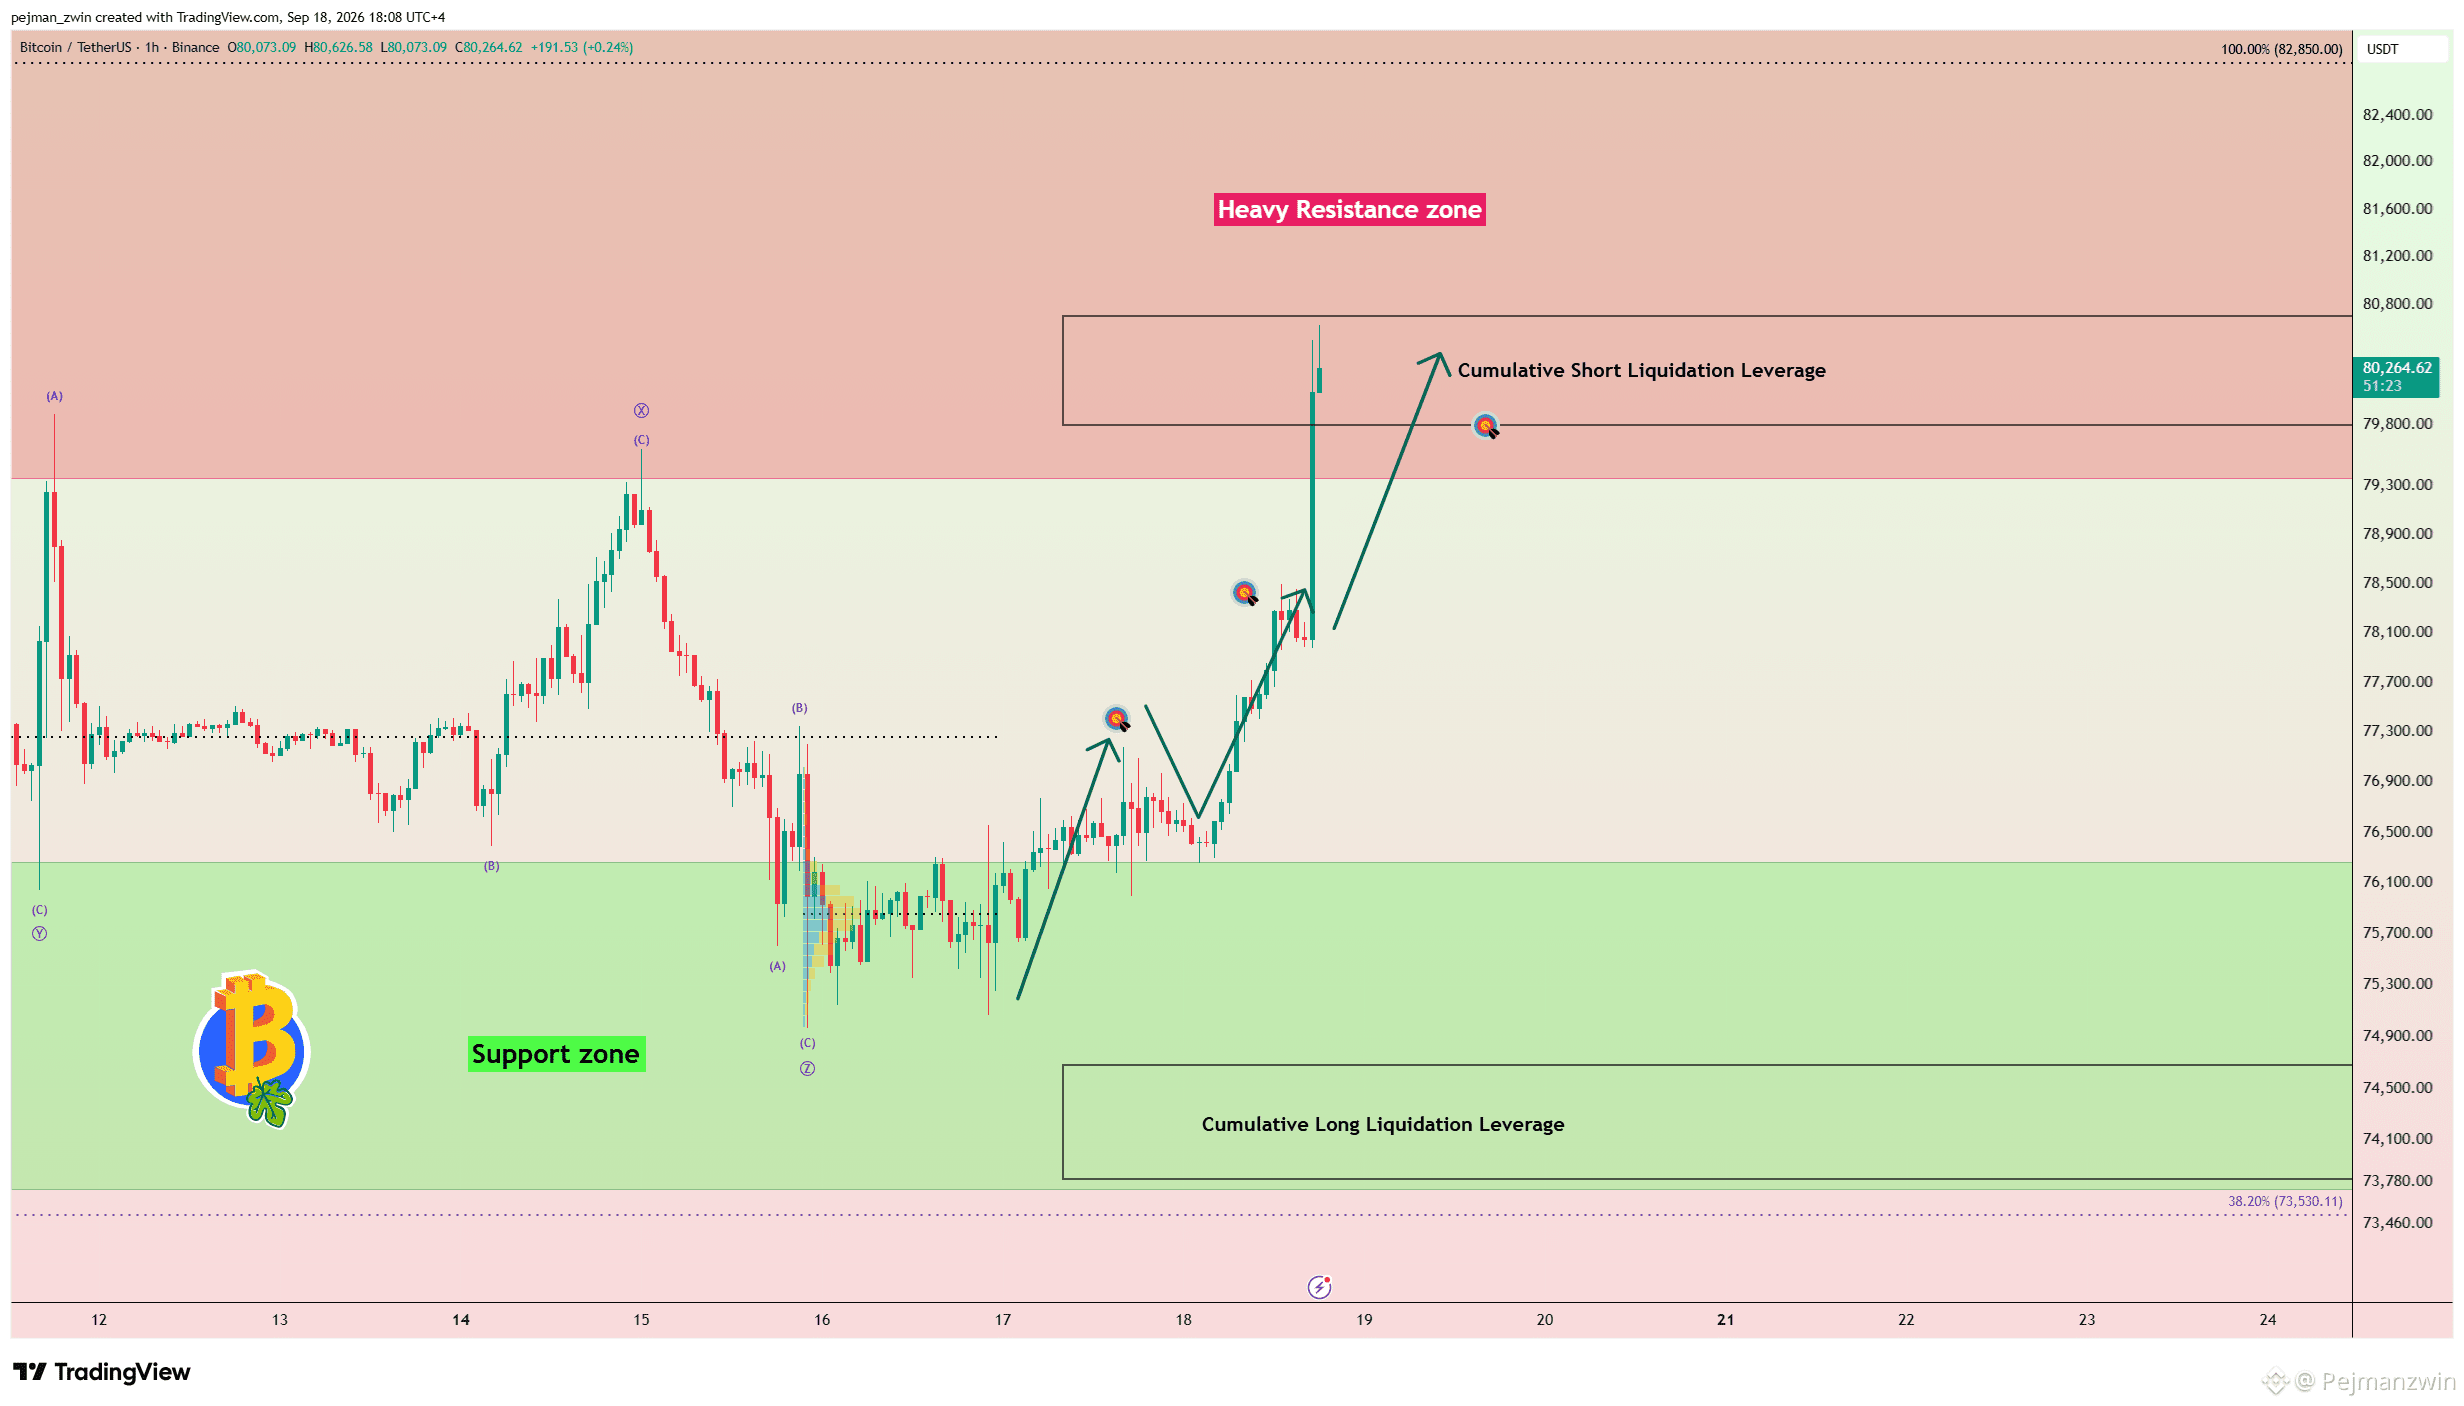
$BTC Full Target Hit at $80,500 — What Comes Next? As mentioned in the previous analysis, Bitcoin was likely to continue its upward move — and that scenario has now played out successfully. BTC continued higher and reached the Full Target at $80,500, completing the setup. The next step is to reassess the structure and identify whether bullish momentum can continue from here or if Bitcoin needs a short-term correction before the next major move. I’ll share an updated Bitcoin analysis soon with the next key levels, targets, and invalidation scenario. I hope you were able to take advantage of the move and secure some profits. Do you expect Bitcoin to continue higher from $80,500, or correct first? #bitcoin
$BTC Full Target Hit at $80,500 — What Comes Next?

As mentioned in the previous analysis, Bitcoin was likely to continue its upward move — and that scenario has now played out successfully.

BTC continued higher and reached the Full Target at $80,500, completing the setup.

The next step is to reassess the structure and identify whether bullish momentum can continue from here or if Bitcoin needs a short-term correction before the next major move.

I’ll share an updated Bitcoin analysis soon with the next key levels, targets, and invalidation scenario.

I hope you were able to take advantage of the move and secure some profits.

Do you expect Bitcoin to continue higher from $80,500, or correct first?

#bitcoin
Pejmanzwin
·
--
Haussier
$BTC Defies the Sell-Off — Can $75K Launch a Move Toward $80K?

Bitcoin experienced sharp volatility following the Fed’s rate decision and Kevin Warsh’s remarks, but unlike Gold and the S&P 500, BTC has so far managed to hold inside its Support Zone.

Now, $75,000 is the key battleground.

Nearly $1 billion in long positions could be liquidated around $74,860, while BTC is also trading near the Cumulative Long Liquidation Leverage at $73,800–$74,680.

Despite the macro pressure, Bitcoin’s technical structure remains interesting.

A valid Golden Cross between the 50 SMA (Daily) and 200 SMA (Daily) remains active, while the Elliott Wave structure of the past 12 days appears more corrective than impulsively bearish.

As long as BTC stays above $73,500, I expect another bullish attempt.

A break above the key $77,280 level could open the way toward $78,370, followed by the Cumulative Short Liquidation Leverage at $79,800–$80,700.

Trade Setup

First TP: $76,990

Second TP: $78,370

Third TP: $79,800–$80,700

Stop Loss: $73,500

Key Level: $77,280

New CME Gap: $79,110–$79,270

Which level will Bitcoin reach first?

🟢 $79,800

🔴 $73,500
·
--
Haussier
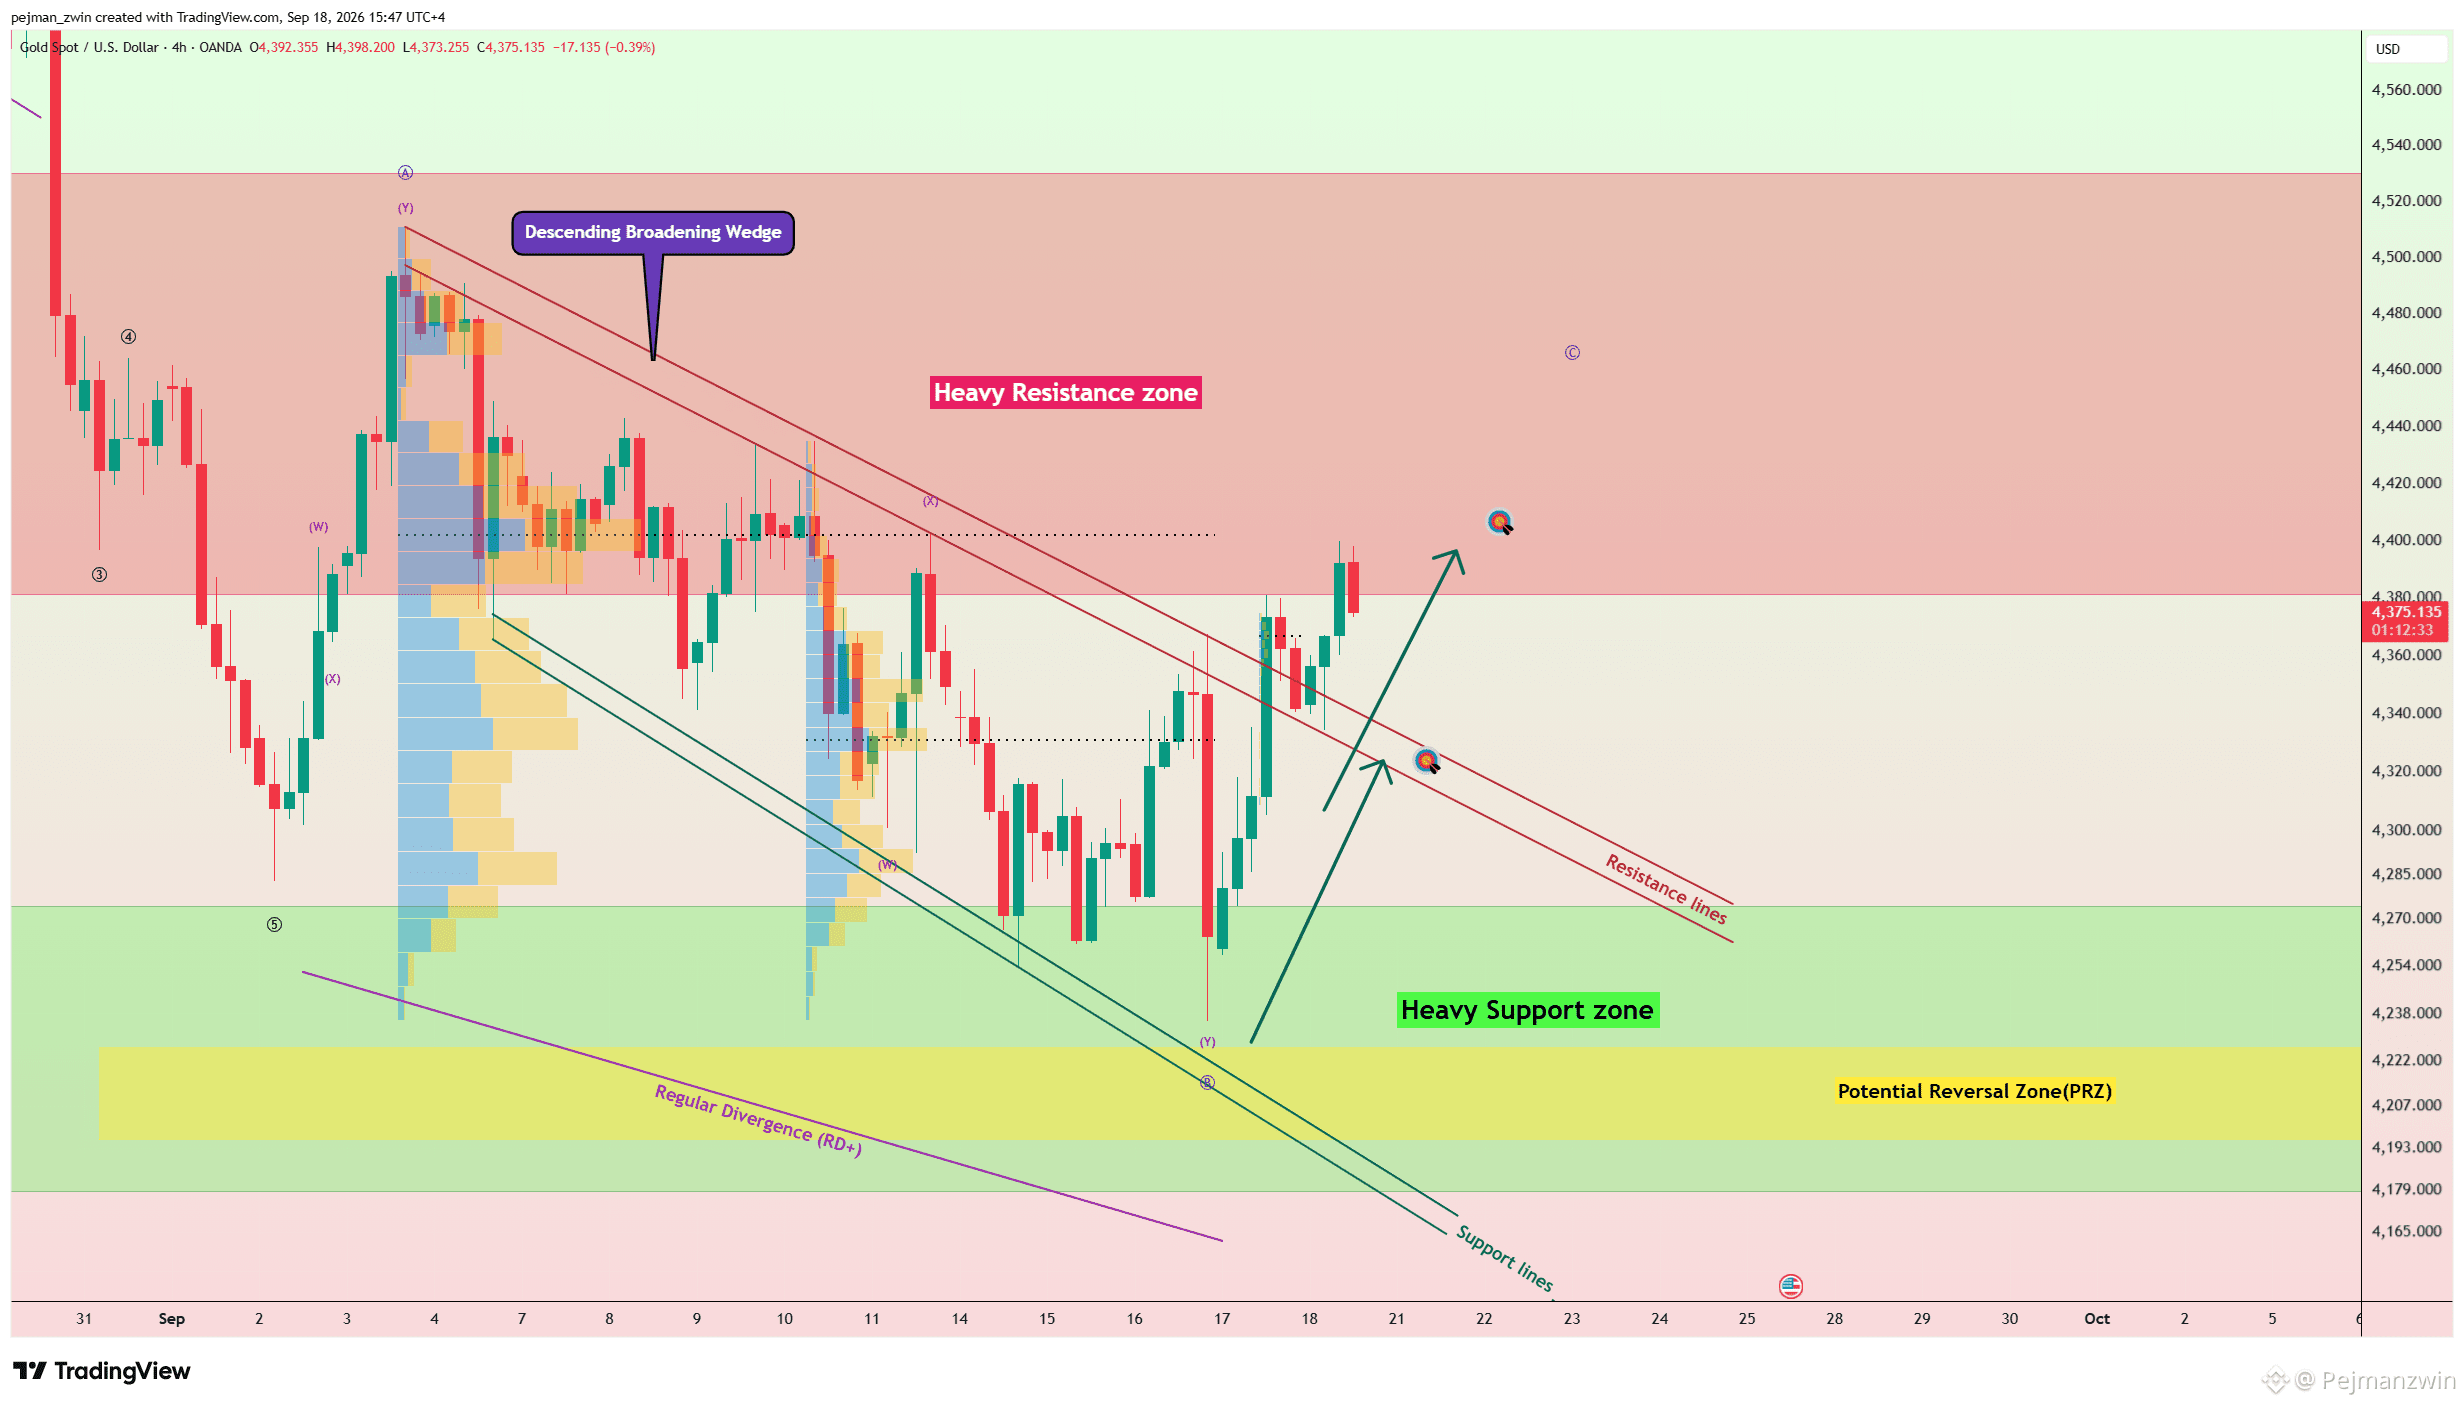
Gold Full Target Hit — Now $4,330–$4,400 Decides the Next Move As mentioned in the previous update, $XAU was likely to continue toward the second target at $4,391 — and that scenario has now played out successfully, completing the analysis with a Full Target. The focus now shifts to two critical levels. For the bullish move to continue, gold needs to break and hold above the key $4,400 trading level. A confirmed breakout above this area could also strengthen the chances of breaking through the current Resistance Zone. On the downside, $4,330 remains an important support level. If gold moves back below $4,330, the probability of a deeper correction would increase. For now, price is trading between these two major levels, and the next confirmed breakout could determine the short-term direction. What comes next for gold? 🟢 Break above $4,400 and continue higher 🔴 Lose $4,330 and enter a deeper correction #GOLD
Gold Full Target Hit — Now $4,330–$4,400 Decides the Next Move

As mentioned in the previous update, $XAU was likely to continue toward the second target at $4,391 — and that scenario has now played out successfully, completing the analysis with a Full Target.
The focus now shifts to two critical levels.

For the bullish move to continue, gold needs to break and hold above the key $4,400 trading level. A confirmed breakout above this area could also strengthen the chances of breaking through the current Resistance Zone.

On the downside, $4,330 remains an important support level.
If gold moves back below $4,330, the probability of a deeper correction would increase.

For now, price is trading between these two major levels, and the next confirmed breakout could determine the short-term direction.
What comes next for gold?

🟢 Break above $4,400 and continue higher

🔴 Lose $4,330 and enter a deeper correction

#GOLD
Pejmanzwin
·
--
Haussier
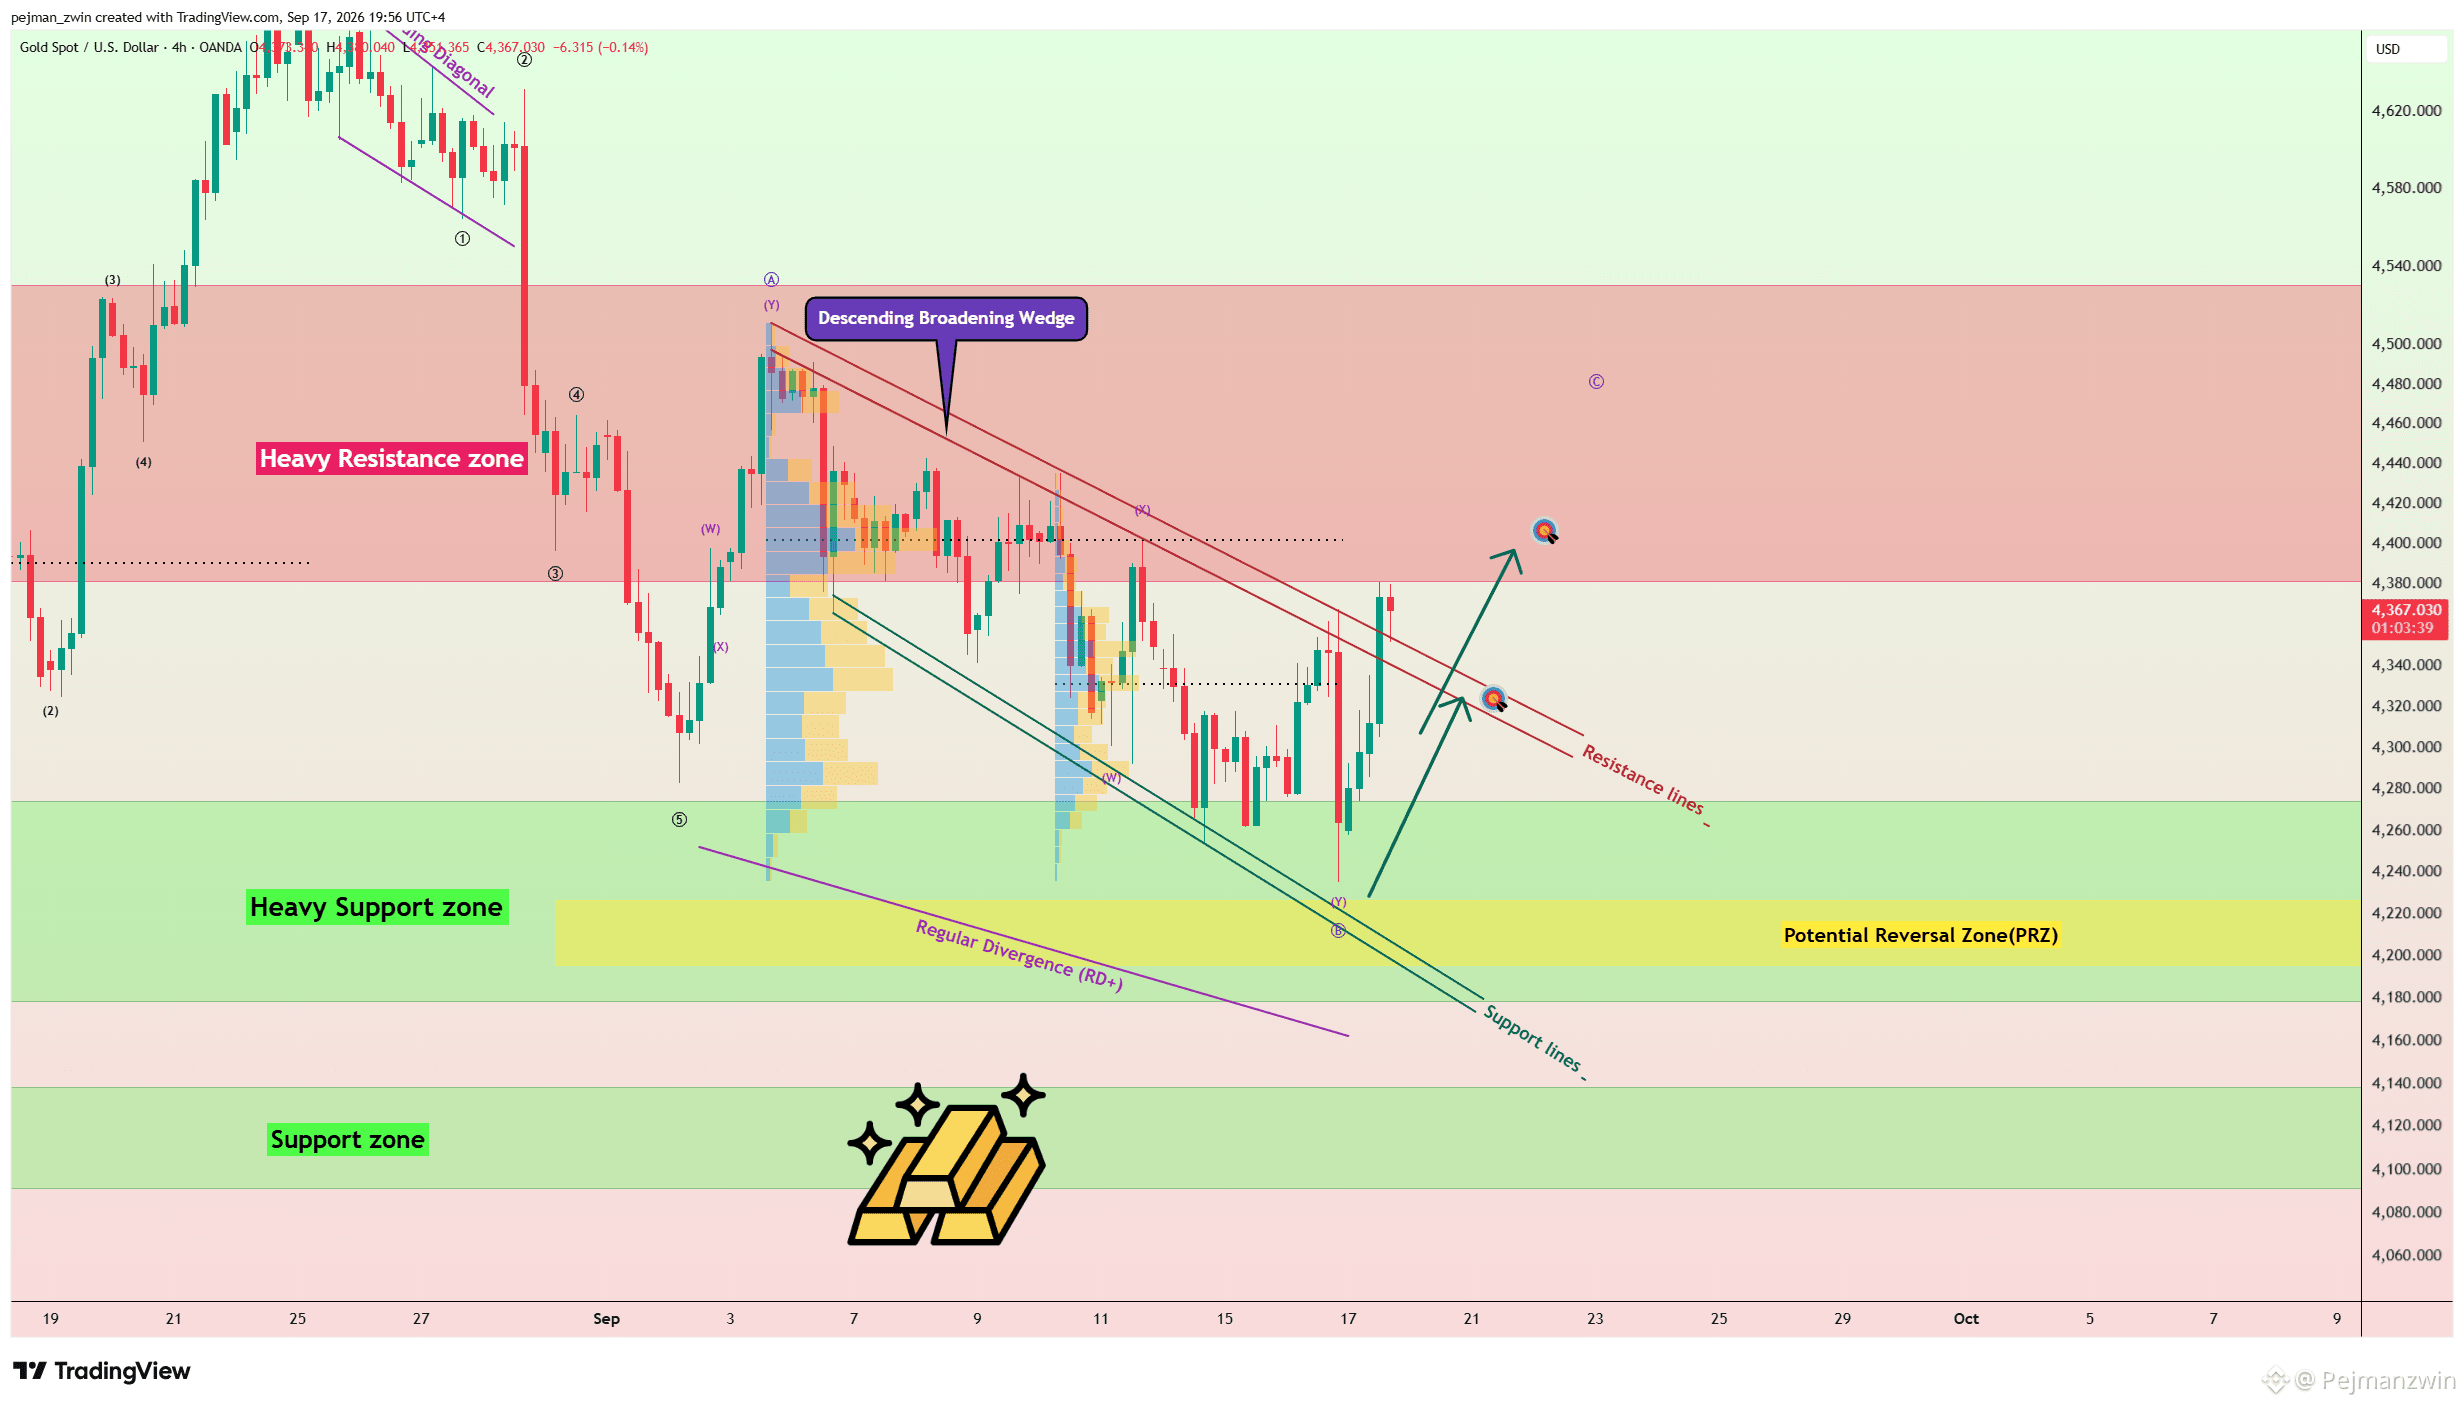
Gold Breakout Confirmed — Is $4,400 the Next Level to Fall?

$XAU has continued to follow the expected scenario very well.

Price successfully broke above the key $4,330 trading level and, more importantly, pushed through the upper trendlines of the Descending Broadening Wedge.

The first target has now been reached, confirming further strength in the current bullish structure.

The focus now shifts to the crucial $4,400 trading level.

Considering the breakout already confirmed and the current bullish momentum, the probability of reaching the second target has increased.

However, $4,400 remains an important resistance area. A clean break and hold above this level could strengthen the bullish structure further and open the way for another leg higher.

For now, $4,400 is the key decision point.

Will gold break above $4,400, or will sellers defend this level first?

#GOLD
·
--
Haussier
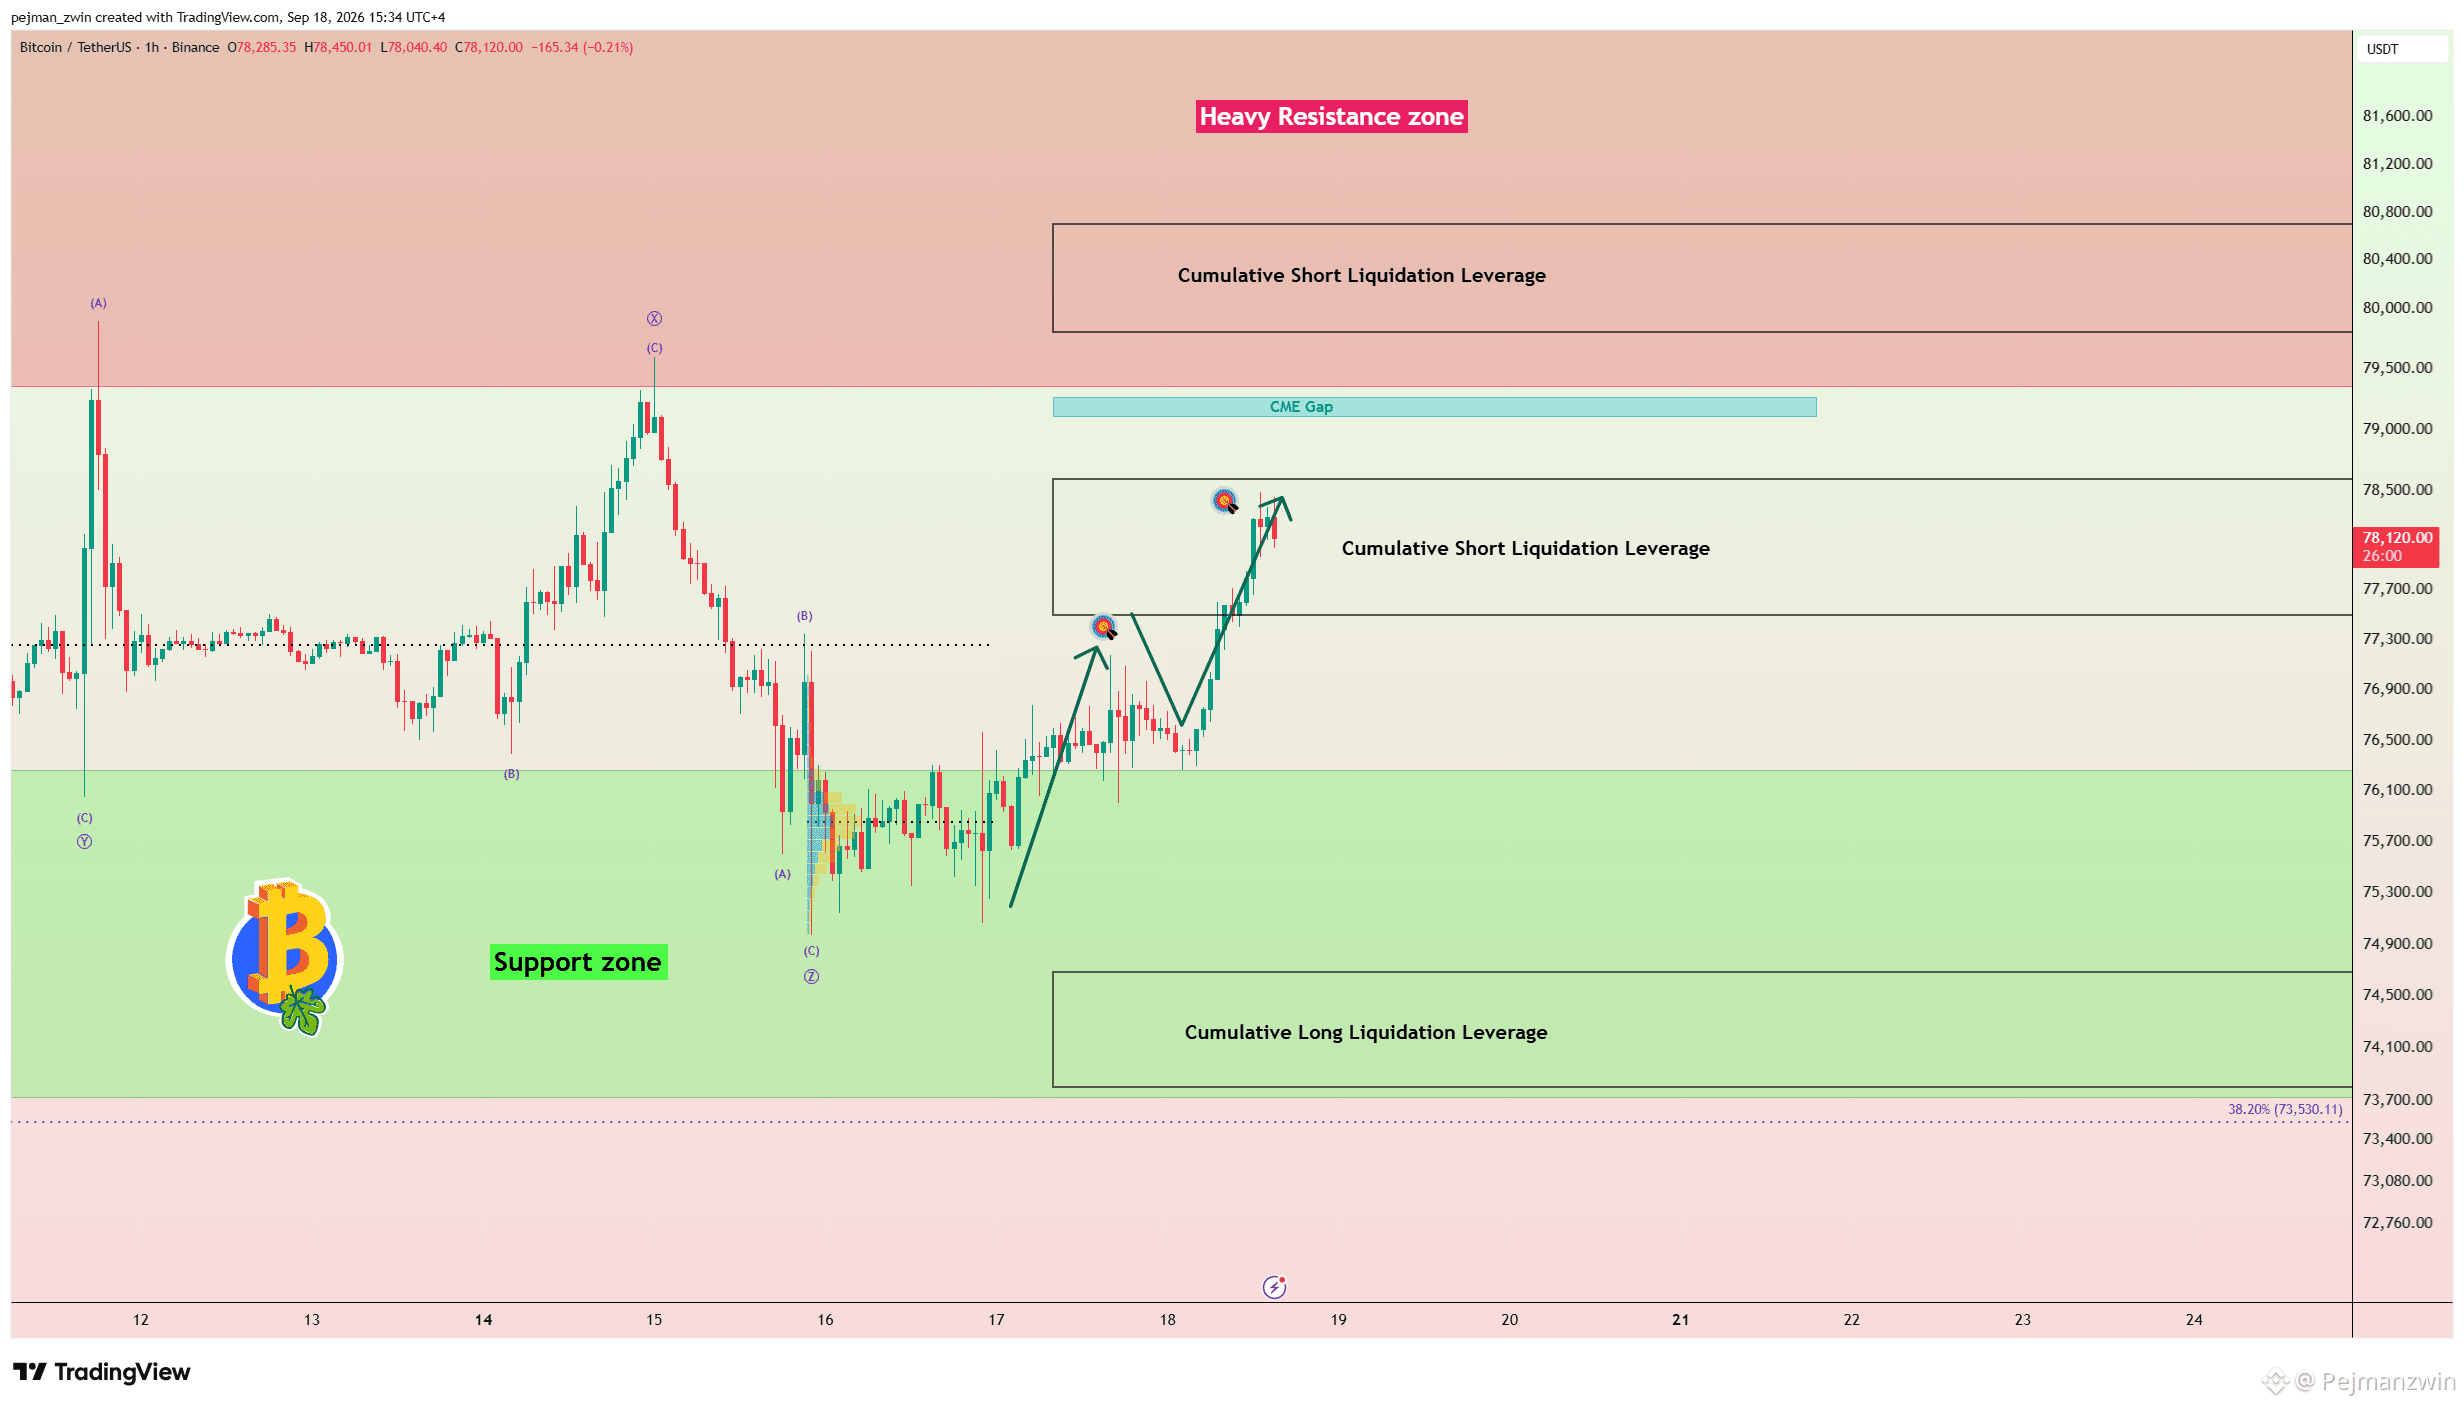
$BTC Hit the Second Target — Now $77,280 Holds the Key Bitcoin moved almost exactly along the projected trendlines and continued the expected bullish move, successfully reaching the second target at $78,370. The focus now shifts to the key $77,280 trading level. As long as Bitcoin continues to trade above this level, the current short-term bullish momentum remains intact and another move higher could still develop. A confirmed breakdown below $77,280, however, would weaken the current structure and increase the probability of another correction. For now, $77,280 remains the key level protecting the bullish scenario. I hope you were able to take advantage of the previous analysis and secure some profits. As always, proper risk management remains essential. Will Bitcoin defend $77,280 and continue higher? #bitcoin
$BTC Hit the Second Target — Now $77,280 Holds the Key

Bitcoin moved almost exactly along the projected trendlines and continued the expected bullish move, successfully reaching the second target at $78,370.

The focus now shifts to the key $77,280 trading level.
As long as Bitcoin continues to trade above this level, the current short-term bullish momentum remains intact and another move higher could still develop.

A confirmed breakdown below $77,280, however, would weaken the current structure and increase the probability of another correction.
For now, $77,280 remains the key level protecting the bullish scenario.

I hope you were able to take advantage of the previous analysis and secure some profits.

As always, proper risk management remains essential.

Will Bitcoin defend $77,280 and continue higher?

#bitcoin
Pejmanzwin
·
--
Haussier
$BTC Defies the Sell-Off — Can $75K Launch a Move Toward $80K?

Bitcoin experienced sharp volatility following the Fed’s rate decision and Kevin Warsh’s remarks, but unlike Gold and the S&P 500, BTC has so far managed to hold inside its Support Zone.

Now, $75,000 is the key battleground.

Nearly $1 billion in long positions could be liquidated around $74,860, while BTC is also trading near the Cumulative Long Liquidation Leverage at $73,800–$74,680.

Despite the macro pressure, Bitcoin’s technical structure remains interesting.

A valid Golden Cross between the 50 SMA (Daily) and 200 SMA (Daily) remains active, while the Elliott Wave structure of the past 12 days appears more corrective than impulsively bearish.

As long as BTC stays above $73,500, I expect another bullish attempt.

A break above the key $77,280 level could open the way toward $78,370, followed by the Cumulative Short Liquidation Leverage at $79,800–$80,700.

Trade Setup

First TP: $76,990

Second TP: $78,370

Third TP: $79,800–$80,700

Stop Loss: $73,500

Key Level: $77,280

New CME Gap: $79,110–$79,270

Which level will Bitcoin reach first?

🟢 $79,800

🔴 $73,500
·
--
Haussier
Gold Breakout Confirmed — Is $4,400 the Next Level to Fall? $XAU has continued to follow the expected scenario very well. Price successfully broke above the key $4,330 trading level and, more importantly, pushed through the upper trendlines of the Descending Broadening Wedge. The first target has now been reached, confirming further strength in the current bullish structure. The focus now shifts to the crucial $4,400 trading level. Considering the breakout already confirmed and the current bullish momentum, the probability of reaching the second target has increased. However, $4,400 remains an important resistance area. A clean break and hold above this level could strengthen the bullish structure further and open the way for another leg higher. For now, $4,400 is the key decision point. Will gold break above $4,400, or will sellers defend this level first? #GOLD
Gold Breakout Confirmed — Is $4,400 the Next Level to Fall?

$XAU has continued to follow the expected scenario very well.

Price successfully broke above the key $4,330 trading level and, more importantly, pushed through the upper trendlines of the Descending Broadening Wedge.

The first target has now been reached, confirming further strength in the current bullish structure.

The focus now shifts to the crucial $4,400 trading level.

Considering the breakout already confirmed and the current bullish momentum, the probability of reaching the second target has increased.

However, $4,400 remains an important resistance area. A clean break and hold above this level could strengthen the bullish structure further and open the way for another leg higher.

For now, $4,400 is the key decision point.

Will gold break above $4,400, or will sellers defend this level first?

#GOLD
Pejmanzwin
·
--
Haussier
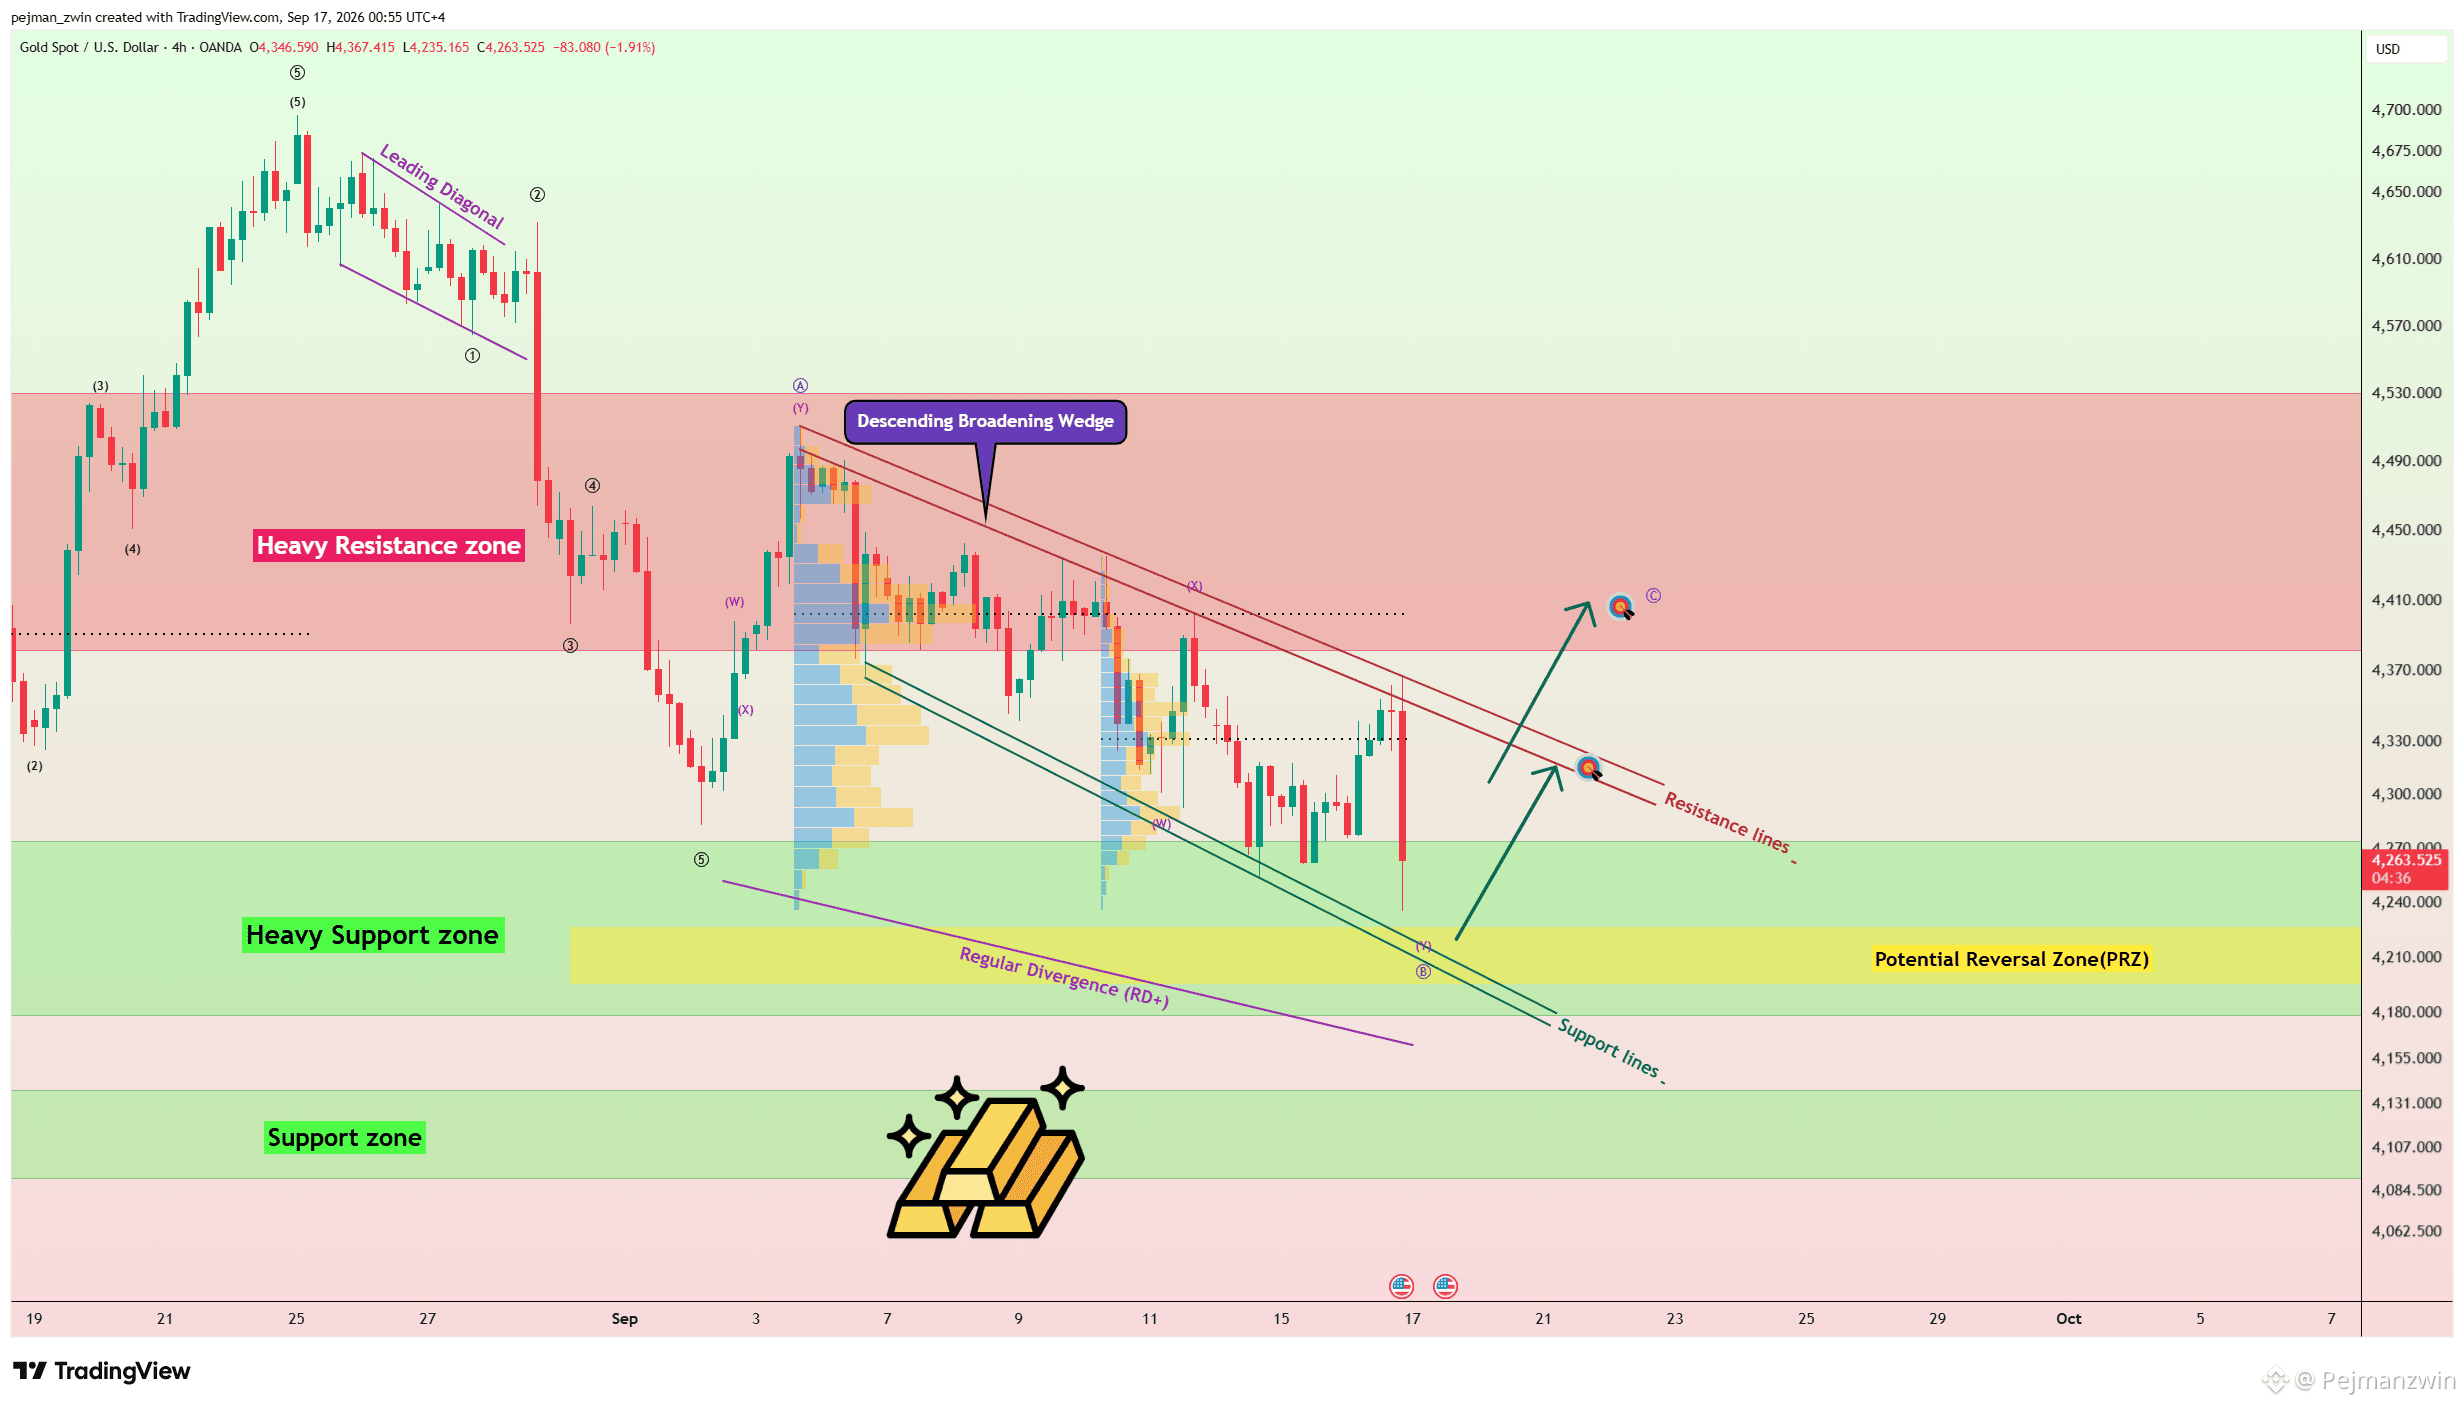
Gold Hits Heavy Support After the Fed — Is a Reversal Starting?

$XAU sold off sharply following the Federal Funds Rate decision and Kevin Warsh’s remarks, but price has now reached an important technical confluence.

#GOLD is trading inside the Heavy Support Zone, near the Support Lines and the major Potential Reversal Zone (PRZ) at $4,195–$4,226.
Several technical signals are now aligning.

From an Elliott Wave perspective, gold appears to have developed a corrective structure to the downside over the past 13 days, suggesting that at least a short-term bullish move could begin from the current area.

From a classical technical perspective, gold also appears to have formed a Descending Broadening Wedge, while a Positive Regular Divergence (RD+) is visible between two Major Consecutive Valley Pivots.

Together, these signals suggest that bearish momentum may be weakening.

As long as the PRZ and Support Lines hold, I expect gold to potentially rebound toward $4,317.

If bullish momentum strengthens and price breaks above the Resistance Lines, the recovery could extend toward $4,391.

Trade Setup

First TP: $4,317

Second TP: $4,391

Stop Loss: $4,170

Key Levels: $4,330 | $4,400

Which level will gold reach first?

🟢 $4,391

🔴 $4,170
·
--
Haussier
Gold Hits Heavy Support After the Fed — Is a Reversal Starting? $XAU sold off sharply following the Federal Funds Rate decision and Kevin Warsh’s remarks, but price has now reached an important technical confluence. #GOLD is trading inside the Heavy Support Zone, near the Support Lines and the major Potential Reversal Zone (PRZ) at $4,195–$4,226. Several technical signals are now aligning. From an Elliott Wave perspective, gold appears to have developed a corrective structure to the downside over the past 13 days, suggesting that at least a short-term bullish move could begin from the current area. From a classical technical perspective, gold also appears to have formed a Descending Broadening Wedge, while a Positive Regular Divergence (RD+) is visible between two Major Consecutive Valley Pivots. Together, these signals suggest that bearish momentum may be weakening. As long as the PRZ and Support Lines hold, I expect gold to potentially rebound toward $4,317. If bullish momentum strengthens and price breaks above the Resistance Lines, the recovery could extend toward $4,391. Trade Setup First TP: $4,317 Second TP: $4,391 Stop Loss: $4,170 Key Levels: $4,330 | $4,400 Which level will gold reach first? 🟢 $4,391 🔴 $4,170
Gold Hits Heavy Support After the Fed — Is a Reversal Starting?

$XAU sold off sharply following the Federal Funds Rate decision and Kevin Warsh’s remarks, but price has now reached an important technical confluence.

#GOLD is trading inside the Heavy Support Zone, near the Support Lines and the major Potential Reversal Zone (PRZ) at $4,195–$4,226.
Several technical signals are now aligning.

From an Elliott Wave perspective, gold appears to have developed a corrective structure to the downside over the past 13 days, suggesting that at least a short-term bullish move could begin from the current area.

From a classical technical perspective, gold also appears to have formed a Descending Broadening Wedge, while a Positive Regular Divergence (RD+) is visible between two Major Consecutive Valley Pivots.

Together, these signals suggest that bearish momentum may be weakening.

As long as the PRZ and Support Lines hold, I expect gold to potentially rebound toward $4,317.

If bullish momentum strengthens and price breaks above the Resistance Lines, the recovery could extend toward $4,391.

Trade Setup

First TP: $4,317

Second TP: $4,391

Stop Loss: $4,170

Key Levels: $4,330 | $4,400

Which level will gold reach first?

🟢 $4,391

🔴 $4,170
·
--
Haussier
$BTC Defies the Sell-Off — Can $75K Launch a Move Toward $80K? Bitcoin experienced sharp volatility following the Fed’s rate decision and Kevin Warsh’s remarks, but unlike Gold and the S&P 500, BTC has so far managed to hold inside its Support Zone. Now, $75,000 is the key battleground. Nearly $1 billion in long positions could be liquidated around $74,860, while BTC is also trading near the Cumulative Long Liquidation Leverage at $73,800–$74,680. Despite the macro pressure, Bitcoin’s technical structure remains interesting. A valid Golden Cross between the 50 SMA (Daily) and 200 SMA (Daily) remains active, while the Elliott Wave structure of the past 12 days appears more corrective than impulsively bearish. As long as BTC stays above $73,500, I expect another bullish attempt. A break above the key $77,280 level could open the way toward $78,370, followed by the Cumulative Short Liquidation Leverage at $79,800–$80,700. Trade Setup First TP: $76,990 Second TP: $78,370 Third TP: $79,800–$80,700 Stop Loss: $73,500 Key Level: $77,280 New CME Gap: $79,110–$79,270 Which level will Bitcoin reach first? 🟢 $79,800 🔴 $73,500
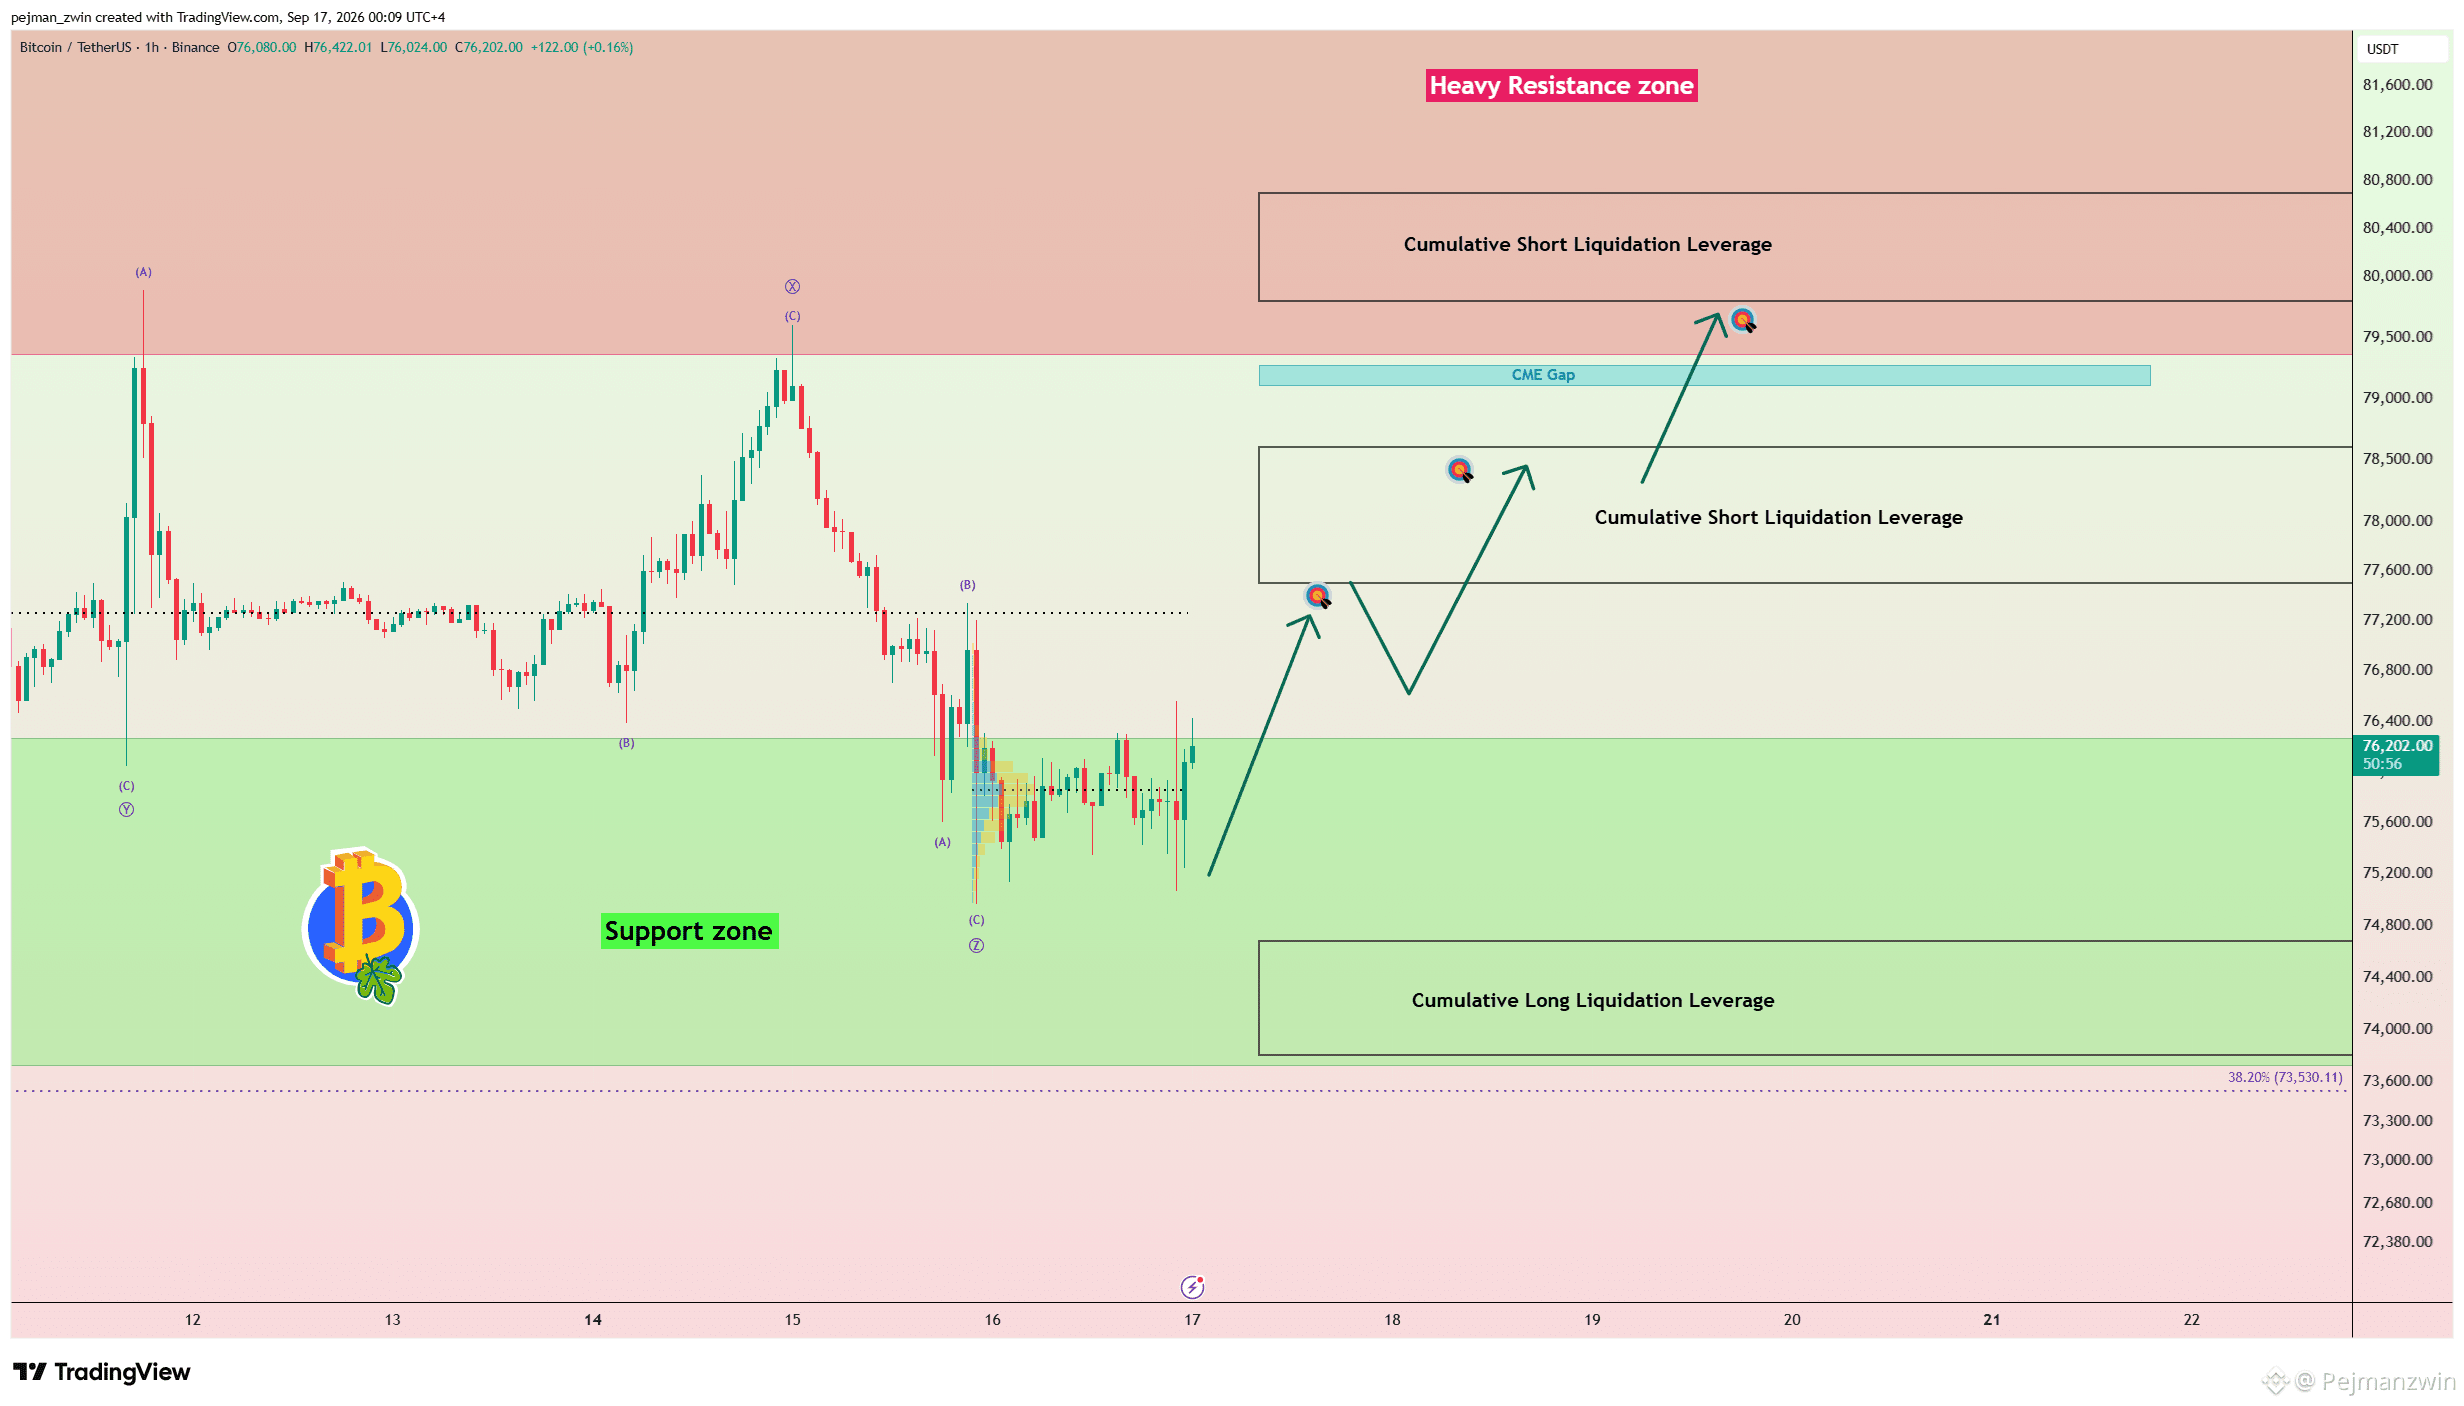
$BTC Defies the Sell-Off — Can $75K Launch a Move Toward $80K?

Bitcoin experienced sharp volatility following the Fed’s rate decision and Kevin Warsh’s remarks, but unlike Gold and the S&P 500, BTC has so far managed to hold inside its Support Zone.

Now, $75,000 is the key battleground.

Nearly $1 billion in long positions could be liquidated around $74,860, while BTC is also trading near the Cumulative Long Liquidation Leverage at $73,800–$74,680.

Despite the macro pressure, Bitcoin’s technical structure remains interesting.

A valid Golden Cross between the 50 SMA (Daily) and 200 SMA (Daily) remains active, while the Elliott Wave structure of the past 12 days appears more corrective than impulsively bearish.

As long as BTC stays above $73,500, I expect another bullish attempt.

A break above the key $77,280 level could open the way toward $78,370, followed by the Cumulative Short Liquidation Leverage at $79,800–$80,700.

Trade Setup

First TP: $76,990

Second TP: $78,370

Third TP: $79,800–$80,700

Stop Loss: $73,500

Key Level: $77,280

New CME Gap: $79,110–$79,270

Which level will Bitcoin reach first?

🟢 $79,800

🔴 $73,500
·
--
Haussier
$BTC Is Holding Stronger Than Gold and Stocks — But Can $75K Survive? Following the Federal Funds Rate decision and Kevin Warsh’s remarks, Bitcoin has so far shown notable relative strength compared with Gold and U.S. stock indices, particularly the S&P 500. While broader markets came under renewed pressure, BTC has managed to resist part of the sell-off. Now, the key battleground is $75,000. This area becomes even more important because more than $1 billion in leveraged positions could be liquidated around $74,860. If Bitcoin moves into this liquidity zone, volatility could increase sharply as leveraged positions are forced out of the market. Holding above $75,000 would therefore be an important sign of strength and could keep the possibility of another recovery alive. A decisive breakdown, however, could trigger a liquidity cascade and accelerate the next bearish move. For now, $75K is the level that could decide Bitcoin’s next major move. What happens first? 🟢 BTC holds $75,000 and rebounds 🔴 $74,860 liquidity gets swept
$BTC Is Holding Stronger Than Gold and Stocks — But Can $75K Survive?

Following the Federal Funds Rate decision and Kevin Warsh’s remarks, Bitcoin has so far shown notable relative strength compared with Gold and U.S. stock indices, particularly the S&P 500.

While broader markets came under renewed pressure, BTC has managed to resist part of the sell-off.

Now, the key battleground is $75,000.

This area becomes even more important because more than $1 billion in leveraged positions could be liquidated around $74,860.
If Bitcoin moves into this liquidity zone, volatility could increase sharply as leveraged positions are forced out of the market.

Holding above $75,000 would therefore be an important sign of strength and could keep the possibility of another recovery alive.
A decisive breakdown, however, could trigger a liquidity cascade and accelerate the next bearish move.

For now, $75K is the level that could decide Bitcoin’s next major move.

What happens first?

🟢 BTC holds $75,000 and rebounds
🔴 $74,860 liquidity gets swept
Vérifié
Article
Fed Hikes Rates — Warsh Sends a Hawkish Warning to MarketsThe Federal Reserve has raised interest rates by 25 basis points to 3.75%–4.00%, and Chair Kevin Warsh’s message afterward was clear: Inflation remains too high, the economy remains resilient, and the Fed is not yet convinced that price pressures are returning sustainably toward its 2% target. For financial markets, this is an important shift. The Fed is becoming more serious about restoring price stability — and if inflation does not improve sufficiently, additional monetary tightening remains possible. Key Takeaways From Kevin Warsh Warsh emphasized several important points: • Inflation remains too high and has stayed elevated for too long. • Recent inflation data have not provided enough evidence that the underlying trend is moving sustainably toward the 2% target. • Upside inflation risks have increased, while risks surrounding the labor market remain broadly balanced. • The U.S. economy remains resilient, with low unemployment and a labor market that is still relatively strong. • Warsh indicated that the economy is operating close to full employment, giving the Fed more room to focus on restoring price stability. • Financial conditions are difficult to describe as genuinely restrictive, which reduces the argument for maintaining easier policy. • The Fed will focus more on economic trends than on individual data releases, which can be volatile and misleading. • Warsh did not pre-commit to the next policy decision, meaning future moves will continue to depend on inflation, economic activity and broader financial conditions. Why Are Treasury Yields So High? Warsh highlighted several forces contributing to elevated Treasury yields: Stronger economic growth A resilient economy reduces the urgency for easier monetary policy. Heavy investment and competition for capital Large investment requirements increase demand for capital and can put upward pressure on long-term borrowing costs. Geopolitical risk Ongoing global uncertainty can also influence inflation expectations, capital flows and Treasury-market pricing. What Does This Mean for Markets? U.S. Dollar The current policy environment is fundamentally supportive for the U.S. Dollar. Higher-for-longer interest rates — and the possibility of additional tightening — can increase the relative attractiveness of dollar-denominated assets. That does not guarantee that DXY will rise continuously, but the monetary-policy backdrop remains supportive. U.S. Treasury Yields If markets continue pricing another rate hike or a longer period of restrictive policy, Treasury yields could remain elevated. This is especially important because higher yields tighten financial conditions across nearly every major asset class. Gold Gold now faces competing forces. Geopolitical uncertainty can create safe-haven demand, but higher Treasury yields and a stronger Dollar can pressure non-yielding assets. If yields continue climbing, gold could struggle despite elevated geopolitical risk. Bitcoin & Crypto For Bitcoin and the broader crypto market, the main risk is tighter liquidity. Higher yields and a stronger Dollar can reduce investors’ willingness to hold riskier assets. If expectations for further Fed tightening increase, crypto could face additional short-term pressure. U.S. Stocks Higher interest rates and bond yields can pressure equity valuations, particularly in growth and technology stocks. However, the strong economy highlighted by Warsh can partially offset this effect, meaning the market reaction will depend on whether investors focus more on economic resilience or tighter financial conditions. Market Interpretation The overall message from Warsh was hawkish. Persistent inflation, a resilient economy, strong employment and financial conditions that do not appear particularly restrictive give the Fed room to maintain tighter policy — and potentially tighten further if inflation fails to improve. The most important charts to watch now are: DXY U.S. 10-Year Treasury Yield Gold $BTC S&P 500 If the Dollar and Treasury yields continue rising together, pressure on risk assets could increase. For now, the key question is no longer simply whether inflation is falling. The market needs to determine how much additional tightening the Fed may be willing to deliver before inflation convincingly returns toward 2%. What do you expect after Warsh’s hawkish message: another Fed rate hike, or will today’s move be enough? #FederalReserve

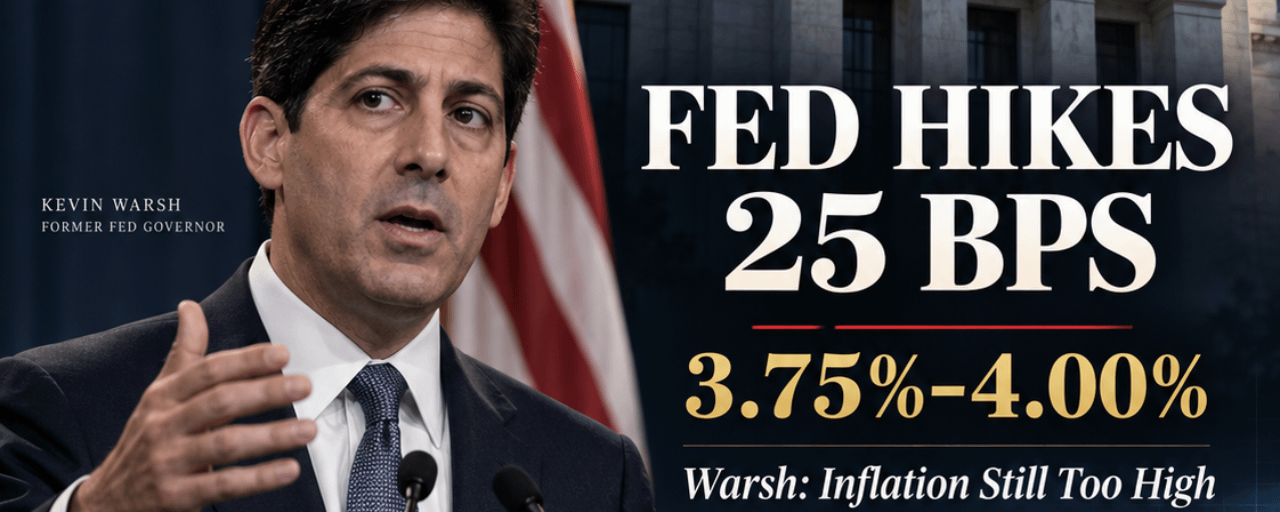
Fed Hikes Rates — Warsh Sends a Hawkish Warning to Markets

The Federal Reserve has raised interest rates by 25 basis points to 3.75%–4.00%, and Chair Kevin Warsh’s message afterward was clear:
Inflation remains too high, the economy remains resilient, and the Fed is not yet convinced that price pressures are returning sustainably toward its 2% target.
For financial markets, this is an important shift.
The Fed is becoming more serious about restoring price stability — and if inflation does not improve sufficiently, additional monetary tightening remains possible.
Key Takeaways From Kevin Warsh
Warsh emphasized several important points:
• Inflation remains too high and has stayed elevated for too long.
• Recent inflation data have not provided enough evidence that the underlying trend is moving sustainably toward the 2% target.
• Upside inflation risks have increased, while risks surrounding the labor market remain broadly balanced.
• The U.S. economy remains resilient, with low unemployment and a labor market that is still relatively strong.
• Warsh indicated that the economy is operating close to full employment, giving the Fed more room to focus on restoring price stability.
• Financial conditions are difficult to describe as genuinely restrictive, which reduces the argument for maintaining easier policy.
• The Fed will focus more on economic trends than on individual data releases, which can be volatile and misleading.
• Warsh did not pre-commit to the next policy decision, meaning future moves will continue to depend on inflation, economic activity and broader financial conditions.
Why Are Treasury Yields So High?
Warsh highlighted several forces contributing to elevated Treasury yields:
Stronger economic growth
A resilient economy reduces the urgency for easier monetary policy.
Heavy investment and competition for capital
Large investment requirements increase demand for capital and can put upward pressure on long-term borrowing costs.
Geopolitical risk
Ongoing global uncertainty can also influence inflation expectations, capital flows and Treasury-market pricing.
What Does This Mean for Markets?
U.S. Dollar
The current policy environment is fundamentally supportive for the U.S. Dollar.
Higher-for-longer interest rates — and the possibility of additional tightening — can increase the relative attractiveness of dollar-denominated assets.
That does not guarantee that DXY will rise continuously, but the monetary-policy backdrop remains supportive.
U.S. Treasury Yields
If markets continue pricing another rate hike or a longer period of restrictive policy, Treasury yields could remain elevated.
This is especially important because higher yields tighten financial conditions across nearly every major asset class.
Gold
Gold now faces competing forces.
Geopolitical uncertainty can create safe-haven demand, but higher Treasury yields and a stronger Dollar can pressure non-yielding assets.
If yields continue climbing, gold could struggle despite elevated geopolitical risk.
Bitcoin & Crypto
For Bitcoin and the broader crypto market, the main risk is tighter liquidity.
Higher yields and a stronger Dollar can reduce investors’ willingness to hold riskier assets.
If expectations for further Fed tightening increase, crypto could face additional short-term pressure.
U.S. Stocks
Higher interest rates and bond yields can pressure equity valuations, particularly in growth and technology stocks.
However, the strong economy highlighted by Warsh can partially offset this effect, meaning the market reaction will depend on whether investors focus more on economic resilience or tighter financial conditions.
Market Interpretation
The overall message from Warsh was hawkish.
Persistent inflation, a resilient economy, strong employment and financial conditions that do not appear particularly restrictive give the Fed room to maintain tighter policy — and potentially tighten further if inflation fails to improve.
The most important charts to watch now are:
DXY
U.S. 10-Year Treasury Yield
Gold
$BTC
S&P 500
If the Dollar and Treasury yields continue rising together, pressure on risk assets could increase.
For now, the key question is no longer simply whether inflation is falling.
The market needs to determine how much additional tightening the Fed may be willing to deliver before inflation convincingly returns toward 2%.
What do you expect after Warsh’s hawkish message: another Fed rate hike, or will today’s move be enough?
#FederalReserve
Connectez-vous pour découvrir plus de contenu
Rejoignez la communauté mondiale des adeptes de cryptomonnaies sur Binance Square
⚡️ Suviez les dernières informations importantes sur les cryptomonnaies.
💬 Jugé digne de confiance par la plus grande plateforme d’échange de cryptomonnaies au monde.
👍 Découvrez les connaissances que partagent les créateurs vérifiés.
Adresse e-mail/Nº de téléphone
Plan du site
Préférences de cookies
CGU de la plateforme