
Lumen Crypto
34 Posts

Lumen Crypto
Report
Block User
Зажигаю свечи не ради хайпа, а ради света на рынке.
0 Following
9 Followers
5 Liked
Posts
·
--
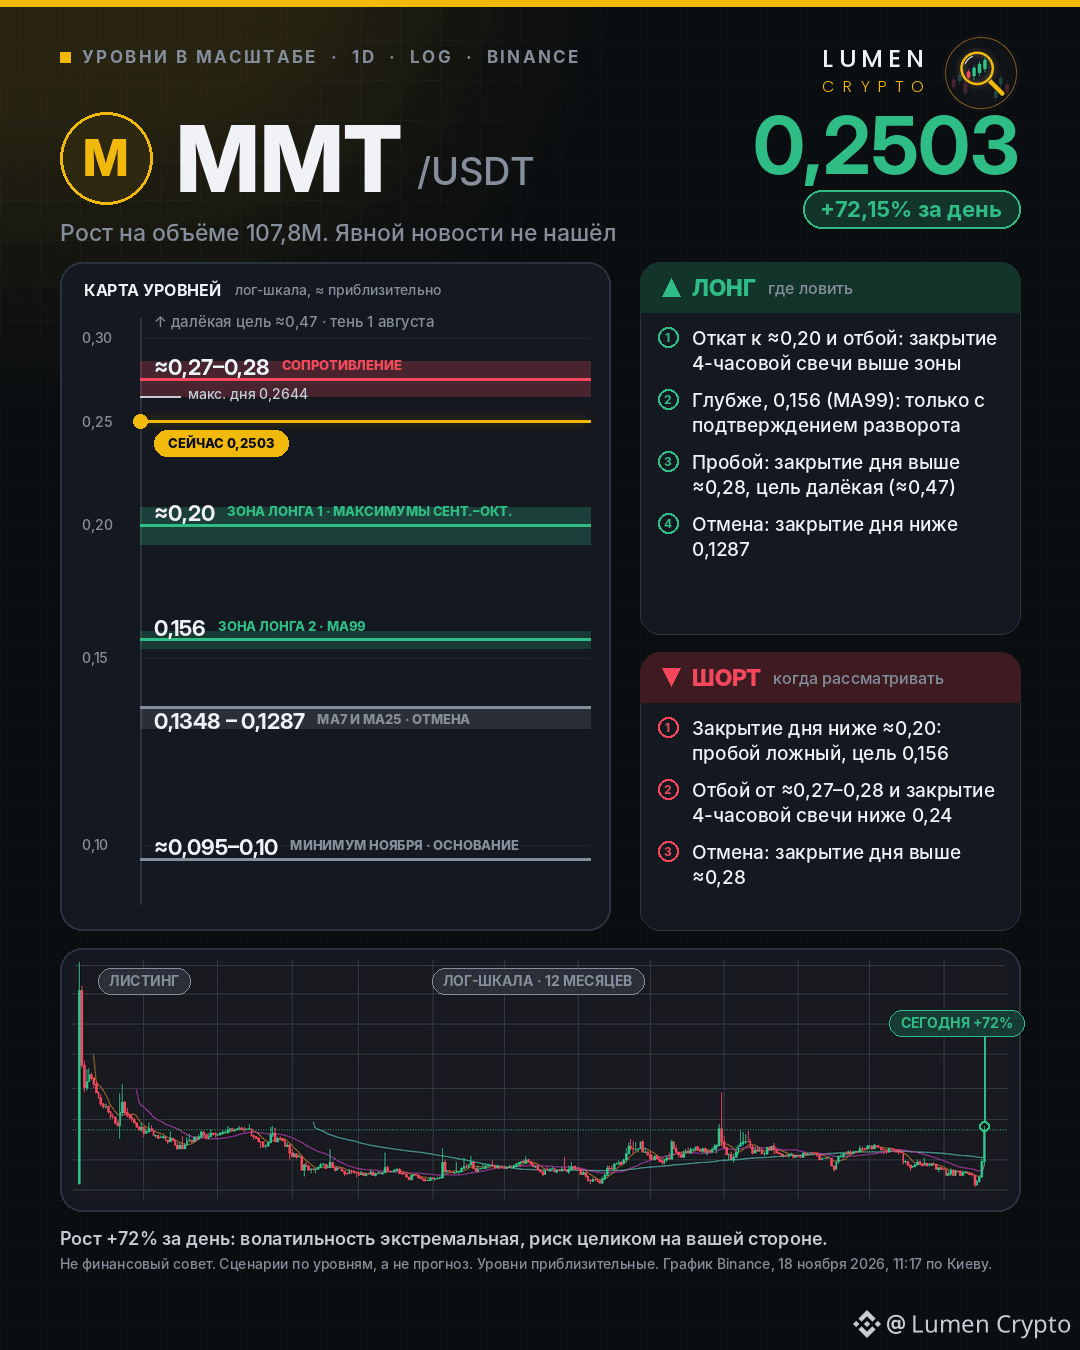
$MMT : +72% in a day. Level map at a glance 🔍
The coin rose from 0.1453 to 0.2503 (day’s high: 0.2644) on volume of 107.8M. I couldn’t find any clear news to explain the rise. According to CoinMarketCap, the price was around 0.102 as recently as November 15, meaning it more than doubled in three days.
What the chart shows:
▫️ Resistance ≈0.27–0.28: this is where the highs were in December, January, and on August 1. Today’s high stopped just below it.
▫️ ≈0.20: the September–October highs. If the price returns, this zone could become support.
▫️ 0.156 (MA99) and 0.1348–0.1287 (MA7 and MA25): the rally started above these levels.
🟢 Where to look for a long:
▫️ Pullback to ≈0.20 and a bounce: a 4-hour candle closes above the zone.
▫️ Deeper pullback to 0.156: only with confirmation of a reversal.
▫️ Breakout: daily close above ≈0.28, with a distant target (≈0.47).
▫️ Invalidation: daily close below 0.1287.
🔴 When to consider a short:
▫️ Daily close below ≈0.20: the breakout was false, target 0.156.
▫️ Rejection from ≈0.27–0.28 and a 4-hour candle close below 0.24.
▫️ Invalidation: daily close above ≈0.28.
After a +72% day, volatility is extreme: the risk is entirely yours. Would you enter on a pullback or a breakout?
Tell us what you’d choose 👇
Not financial advice. Scenarios based on levels, not a forecast.
#MMT #momentum #Binance #LumenCrypto
$MMT : +72% in a day. Level map at a glance 🔍
The coin rose from 0.1453 to 0.2503 (day’s high: 0.2644) on volume of 107.8M. I couldn’t find any clear news to explain the rise. According to CoinMarketCap, the price was around 0.102 as recently as November 15, meaning it more than doubled in three days.
What the chart shows:
▫️ Resistance ≈0.27–0.28: this is where the highs were in December, January, and on August 1. Today’s high stopped just below it.
▫️ ≈0.20: the September–October highs. If the price returns, this zone could become support.
▫️ 0.156 (MA99) and 0.1348–0.1287 (MA7 and MA25): the rally started above these levels.
🟢 Where to look for a long:
▫️ Pullback to ≈0.20 and a bounce: a 4-hour candle closes above the zone.
▫️ Deeper pullback to 0.156: only with confirmation of a reversal.
▫️ Breakout: daily close above ≈0.28, with a distant target (≈0.47).
▫️ Invalidation: daily close below 0.1287.
🔴 When to consider a short:
▫️ Daily close below ≈0.20: the breakout was false, target 0.156.
▫️ Rejection from ≈0.27–0.28 and a 4-hour candle close below 0.24.
▫️ Invalidation: daily close above ≈0.28.
After a +72% day, volatility is extreme: the risk is entirely yours. Would you enter on a pullback or a breakout?
Tell us what you’d choose 👇
Not financial advice. Scenarios based on levels, not a forecast.
#MMT #momentum #Binance #LumenCrypto
The coin rose from 0.1453 to 0.2503 (day’s high: 0.2644) on volume of 107.8M. I couldn’t find any clear news to explain the rise. According to CoinMarketCap, the price was around 0.102 as recently as November 15, meaning it more than doubled in three days.
What the chart shows:
▫️ Resistance ≈0.27–0.28: this is where the highs were in December, January, and on August 1. Today’s high stopped just below it.
▫️ ≈0.20: the September–October highs. If the price returns, this zone could become support.
▫️ 0.156 (MA99) and 0.1348–0.1287 (MA7 and MA25): the rally started above these levels.
🟢 Where to look for a long:
▫️ Pullback to ≈0.20 and a bounce: a 4-hour candle closes above the zone.
▫️ Deeper pullback to 0.156: only with confirmation of a reversal.
▫️ Breakout: daily close above ≈0.28, with a distant target (≈0.47).
▫️ Invalidation: daily close below 0.1287.
🔴 When to consider a short:
▫️ Daily close below ≈0.20: the breakout was false, target 0.156.
▫️ Rejection from ≈0.27–0.28 and a 4-hour candle close below 0.24.
▫️ Invalidation: daily close above ≈0.28.
After a +72% day, volatility is extreme: the risk is entirely yours. Would you enter on a pullback or a breakout?
Tell us what you’d choose 👇
Not financial advice. Scenarios based on levels, not a forecast.
#MMT #momentum #Binance #LumenCrypto
122
·
--
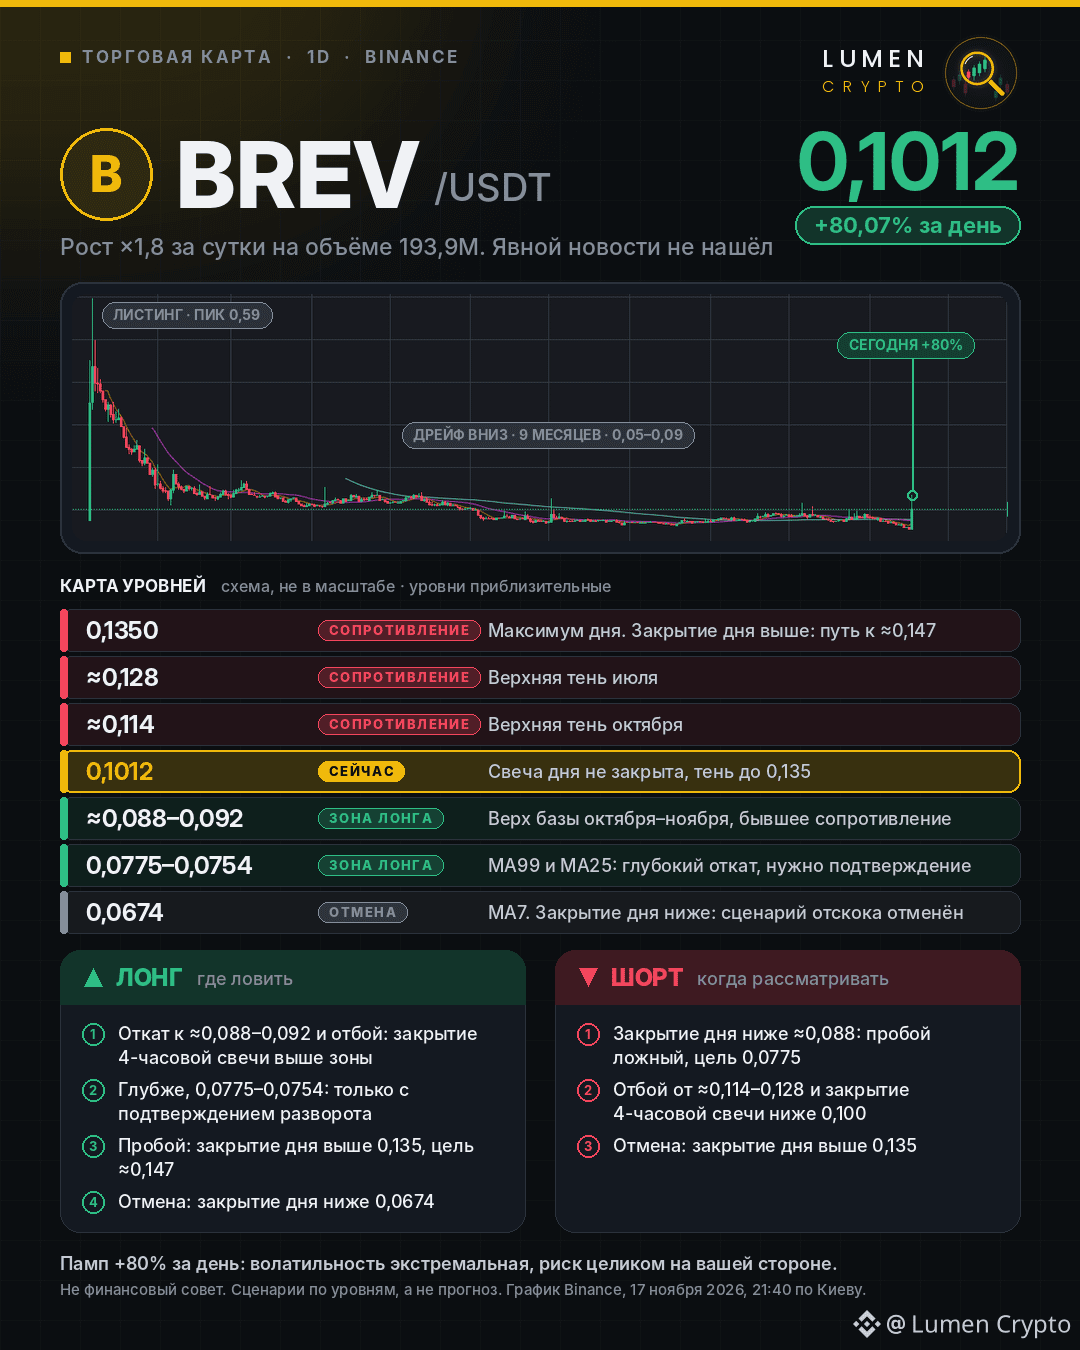
$BREV : +80% in a day. Where to look for a long, and when to consider a short 🔍
The coin drifted downward in the 0.05–0.09 range for nine months, then rose today to 0.1012, with a wick up to 0.135 on 193.9M in volume. I couldn’t find any clear news to explain the rise. Moves like this often reverse just as sharply.
🟢 Where to look for a long (if conditions are met):
▫️ A pullback to ≈0.088–0.092 (the top of the base) and a bounce: a 4-hour candle closes above the zone.
▫️ Deeper, at 0.0775–0.0754 (MA99 and MA25): only with confirmation of a reversal.
▫️ Breakout: daily close above 0.135, target ≈0.147.
▫️ Invalidation: daily close below 0.0674 (MA7).
🔴 When to consider a short:
▫️ Daily close below ≈0.088: the breakout was false, target 0.0775.
▫️ Rejection from ≈0.114–0.128 and a 4-hour candle close below 0.100.
▫️ Invalidation: daily close above 0.135.
After +80% in 24 hours, volatility is extreme: the risk is entirely yours. Where are you waiting to enter: on a pullback or a breakout? 👇
Not financial advice. These are level-based scenarios, not a forecast.
#BREV #brevis #Binance #LumenCrypto
$BREV : +80% in a day. Where to look for a long, and when to consider a short 🔍
The coin drifted downward in the 0.05–0.09 range for nine months, then rose today to 0.1012, with a wick up to 0.135 on 193.9M in volume. I couldn’t find any clear news to explain the rise. Moves like this often reverse just as sharply.
🟢 Where to look for a long (if conditions are met):
▫️ A pullback to ≈0.088–0.092 (the top of the base) and a bounce: a 4-hour candle closes above the zone.
▫️ Deeper, at 0.0775–0.0754 (MA99 and MA25): only with confirmation of a reversal.
▫️ Breakout: daily close above 0.135, target ≈0.147.
▫️ Invalidation: daily close below 0.0674 (MA7).
🔴 When to consider a short:
▫️ Daily close below ≈0.088: the breakout was false, target 0.0775.
▫️ Rejection from ≈0.114–0.128 and a 4-hour candle close below 0.100.
▫️ Invalidation: daily close above 0.135.
After +80% in 24 hours, volatility is extreme: the risk is entirely yours. Where are you waiting to enter: on a pullback or a breakout? 👇
Not financial advice. These are level-based scenarios, not a forecast.
#BREV #brevis #Binance #LumenCrypto
The coin drifted downward in the 0.05–0.09 range for nine months, then rose today to 0.1012, with a wick up to 0.135 on 193.9M in volume. I couldn’t find any clear news to explain the rise. Moves like this often reverse just as sharply.
🟢 Where to look for a long (if conditions are met):
▫️ A pullback to ≈0.088–0.092 (the top of the base) and a bounce: a 4-hour candle closes above the zone.
▫️ Deeper, at 0.0775–0.0754 (MA99 and MA25): only with confirmation of a reversal.
▫️ Breakout: daily close above 0.135, target ≈0.147.
▫️ Invalidation: daily close below 0.0674 (MA7).
🔴 When to consider a short:
▫️ Daily close below ≈0.088: the breakout was false, target 0.0775.
▫️ Rejection from ≈0.114–0.128 and a 4-hour candle close below 0.100.
▫️ Invalidation: daily close above 0.135.
After +80% in 24 hours, volatility is extreme: the risk is entirely yours. Where are you waiting to enter: on a pullback or a breakout? 👇
Not financial advice. These are level-based scenarios, not a forecast.
#BREV #brevis #Binance #LumenCrypto
1
1.2k
·
--
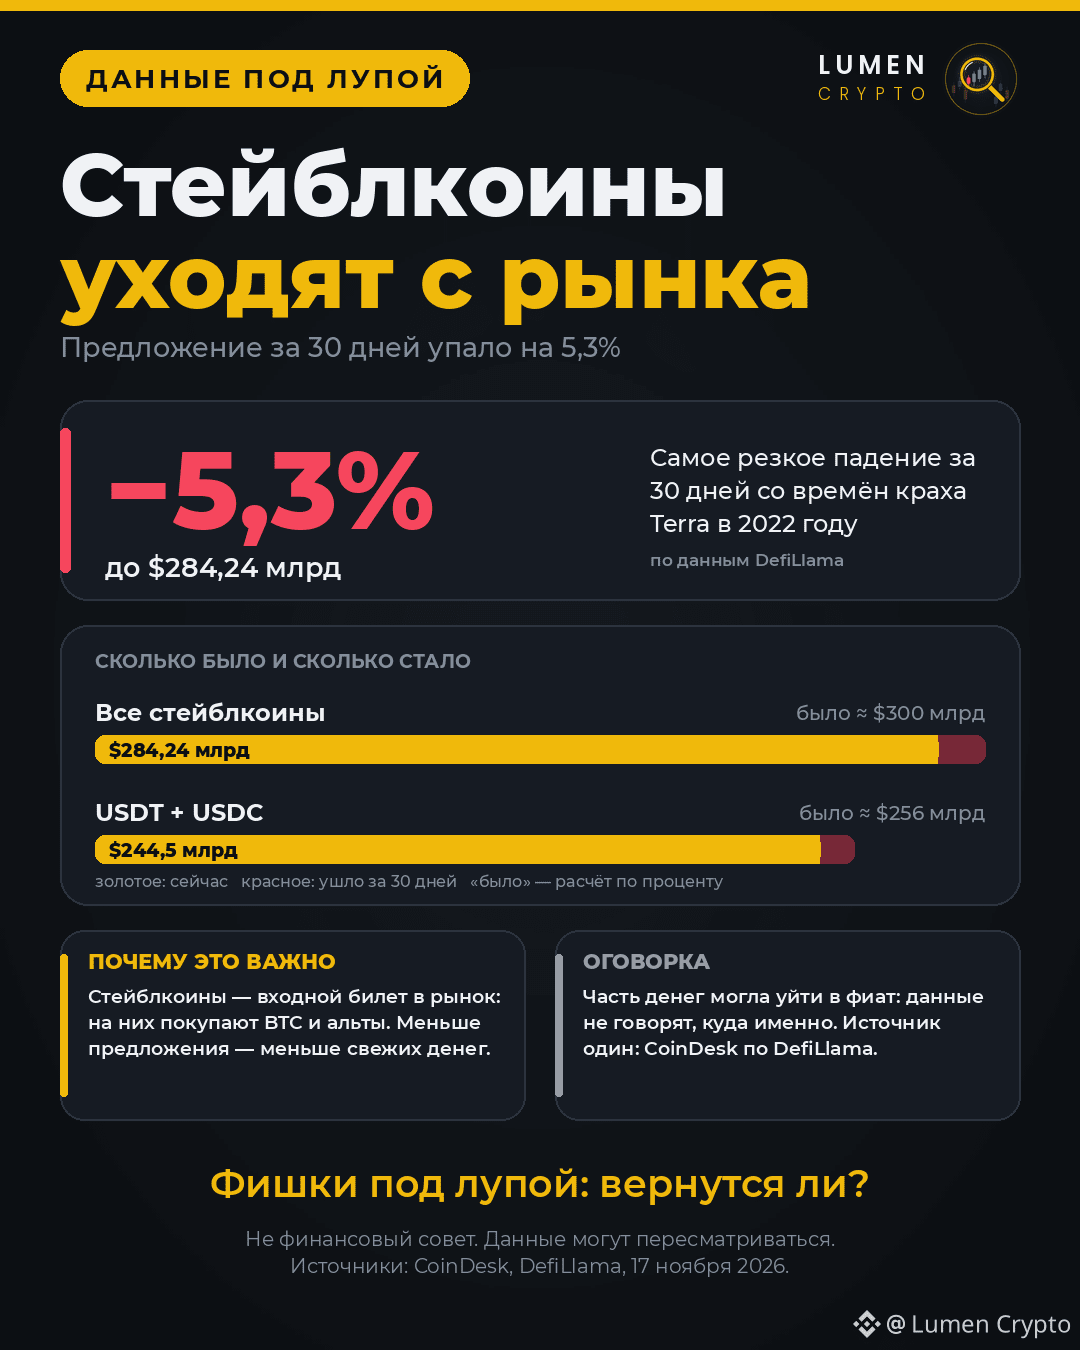
“Casino chips” are leaving the market 🔍
CoinDesk calls stablecoins that: traders use them to exchange dollars before buying crypto. And there are fewer of these “chips” now.
▫️ Over 30 days, the total supply of stablecoins fell 5.3% to $284.24 billion.
▫️ This is the sharpest 30-day decline since the Terra collapse in 2022.
▫️ $USDT and $USDC together lost about 4.5% (≈ $11.6 billion) and are now at $244.5 billion.
Why this matters: people use stablecoins to get into $BTC and altcoins. A smaller supply means less fresh money in the market, coinciding with outflows from spot ETFs and BTC trading around $65,000.
Caveat: some money may have moved into fiat, and the figures alone don’t tell us where exactly. Data from DefiLlama, via CoinDesk.
Chips under the microscope: will they return? What’s your forecast? 👇
Not financial advice.
#Stablecoins #USDT #USDC #BTC #LumenCrypto
“Casino chips” are leaving the market 🔍
CoinDesk calls stablecoins that: traders use them to exchange dollars before buying crypto. And there are fewer of these “chips” now.
▫️ Over 30 days, the total supply of stablecoins fell 5.3% to $284.24 billion.
▫️ This is the sharpest 30-day decline since the Terra collapse in 2022.
▫️ $USDT and $USDC together lost about 4.5% (≈ $11.6 billion) and are now at $244.5 billion.
Why this matters: people use stablecoins to get into $BTC and altcoins. A smaller supply means less fresh money in the market, coinciding with outflows from spot ETFs and BTC trading around $65,000.
Caveat: some money may have moved into fiat, and the figures alone don’t tell us where exactly. Data from DefiLlama, via CoinDesk.
Chips under the microscope: will they return? What’s your forecast? 👇
Not financial advice.
#Stablecoins #USDT #USDC #BTC #LumenCrypto
CoinDesk calls stablecoins that: traders use them to exchange dollars before buying crypto. And there are fewer of these “chips” now.
▫️ Over 30 days, the total supply of stablecoins fell 5.3% to $284.24 billion.
▫️ This is the sharpest 30-day decline since the Terra collapse in 2022.
▫️ $USDT and $USDC together lost about 4.5% (≈ $11.6 billion) and are now at $244.5 billion.
Why this matters: people use stablecoins to get into $BTC and altcoins. A smaller supply means less fresh money in the market, coinciding with outflows from spot ETFs and BTC trading around $65,000.
Caveat: some money may have moved into fiat, and the figures alone don’t tell us where exactly. Data from DefiLlama, via CoinDesk.
Chips under the microscope: will they return? What’s your forecast? 👇
Not financial advice.
#Stablecoins #USDT #USDC #BTC #LumenCrypto
161
·
--
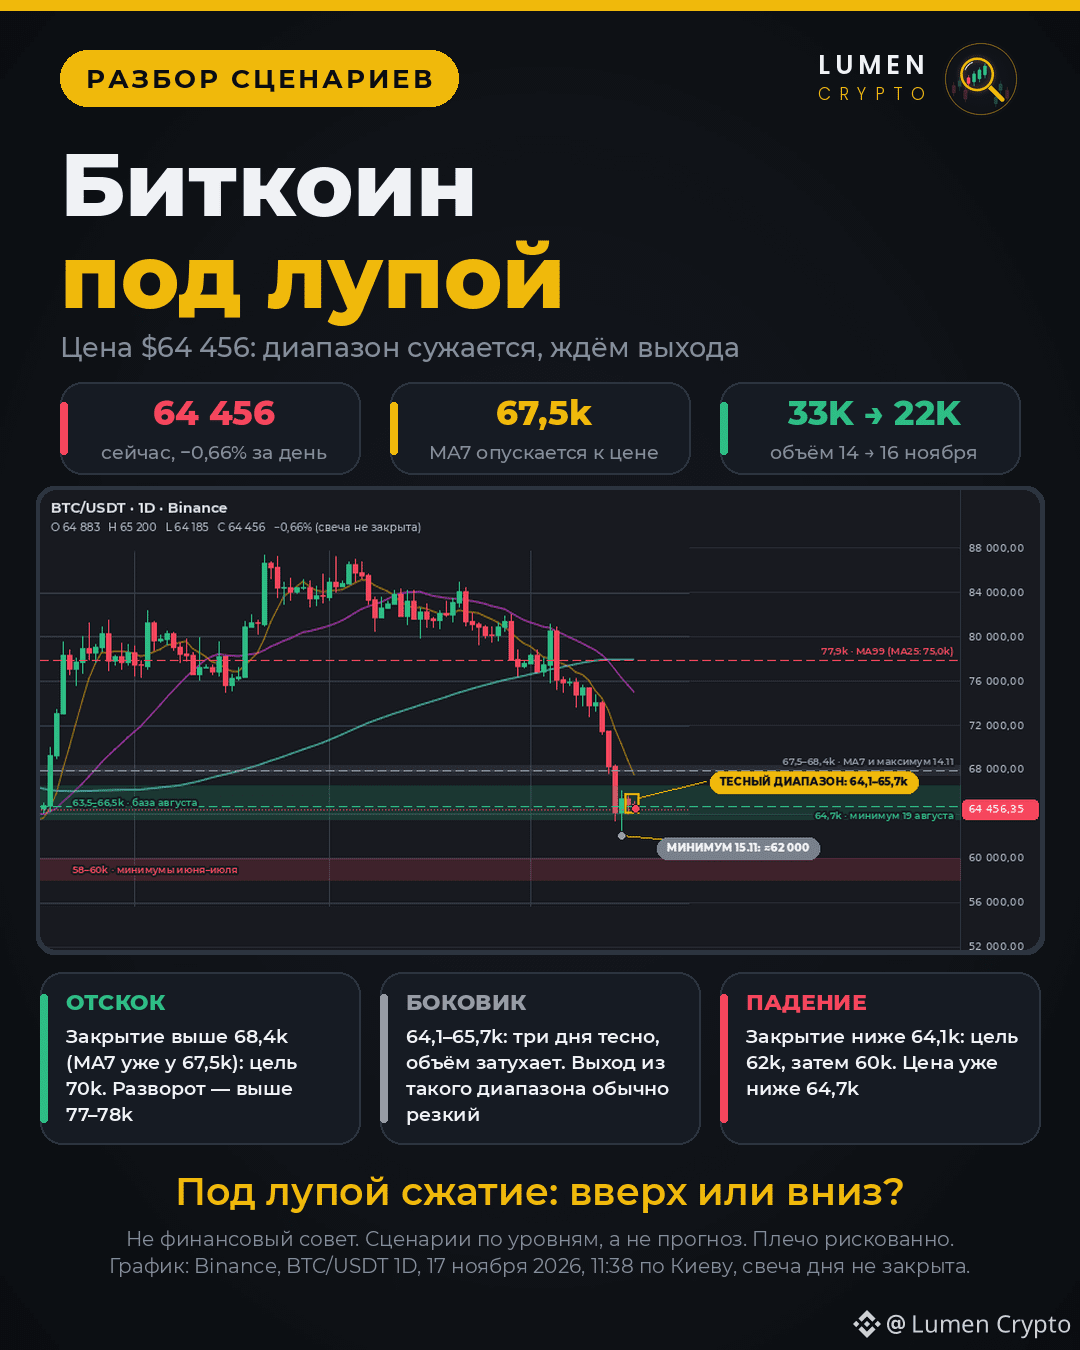
$BTC under the magnifying glass: price is squeezed 🔍
Bitcoin is around $64,456 (−0.66% for the day). For the past three days, it has been stuck in a tight range of 64.1–65.7k.
▫️ Volume is fading: 33K on the day of the dip (November 14), then 30K and 22K over the following days. So far today, it’s 11K; the day isn’t over yet. Buyers haven’t returned, but sellers have run out of steam too.
▫️ MA7 has fallen to 67.5k, in line with the November 14 high (68.4k). This is the 67.5–68.4k resistance zone.
▫️ 64.7k (the August 19 low) has already been broken to the downside intraday, and the candle hasn’t closed yet.
▫️ MA99 (77.9k) is nearly flat, while MA25 (75.0k) is pointing down. A trend reversal is still a long way off.
Scenarios by level:
🟢 Close above 68.4k → target 70k. Reversal only above 77–78k.
⚪ Sideways movement between 64.1–65.7k. A breakout from this kind of range is usually sharp.
🔴 Close below 64.1k → target 62k, then 60k.
The daily candle closes at 02:00 Kyiv time. Under the magnifying glass: compression—up or down? Share your view 👇
Not financial advice. These are scenarios by level, not a forecast.
#BTC #bitcoin #Binance #LumenCrypto
$BTC under the magnifying glass: price is squeezed 🔍
Bitcoin is around $64,456 (−0.66% for the day). For the past three days, it has been stuck in a tight range of 64.1–65.7k.
▫️ Volume is fading: 33K on the day of the dip (November 14), then 30K and 22K over the following days. So far today, it’s 11K; the day isn’t over yet. Buyers haven’t returned, but sellers have run out of steam too.
▫️ MA7 has fallen to 67.5k, in line with the November 14 high (68.4k). This is the 67.5–68.4k resistance zone.
▫️ 64.7k (the August 19 low) has already been broken to the downside intraday, and the candle hasn’t closed yet.
▫️ MA99 (77.9k) is nearly flat, while MA25 (75.0k) is pointing down. A trend reversal is still a long way off.
Scenarios by level:
🟢 Close above 68.4k → target 70k. Reversal only above 77–78k.
⚪ Sideways movement between 64.1–65.7k. A breakout from this kind of range is usually sharp.
🔴 Close below 64.1k → target 62k, then 60k.
The daily candle closes at 02:00 Kyiv time. Under the magnifying glass: compression—up or down? Share your view 👇
Not financial advice. These are scenarios by level, not a forecast.
#BTC #bitcoin #Binance #LumenCrypto
Bitcoin is around $64,456 (−0.66% for the day). For the past three days, it has been stuck in a tight range of 64.1–65.7k.
▫️ Volume is fading: 33K on the day of the dip (November 14), then 30K and 22K over the following days. So far today, it’s 11K; the day isn’t over yet. Buyers haven’t returned, but sellers have run out of steam too.
▫️ MA7 has fallen to 67.5k, in line with the November 14 high (68.4k). This is the 67.5–68.4k resistance zone.
▫️ 64.7k (the August 19 low) has already been broken to the downside intraday, and the candle hasn’t closed yet.
▫️ MA99 (77.9k) is nearly flat, while MA25 (75.0k) is pointing down. A trend reversal is still a long way off.
Scenarios by level:
🟢 Close above 68.4k → target 70k. Reversal only above 77–78k.
⚪ Sideways movement between 64.1–65.7k. A breakout from this kind of range is usually sharp.
🔴 Close below 64.1k → target 62k, then 60k.
The daily candle closes at 02:00 Kyiv time. Under the magnifying glass: compression—up or down? Share your view 👇
Not financial advice. These are scenarios by level, not a forecast.
#BTC #bitcoin #Binance #LumenCrypto
916
·
--
$BTC under the microscope: daily recap 🔍
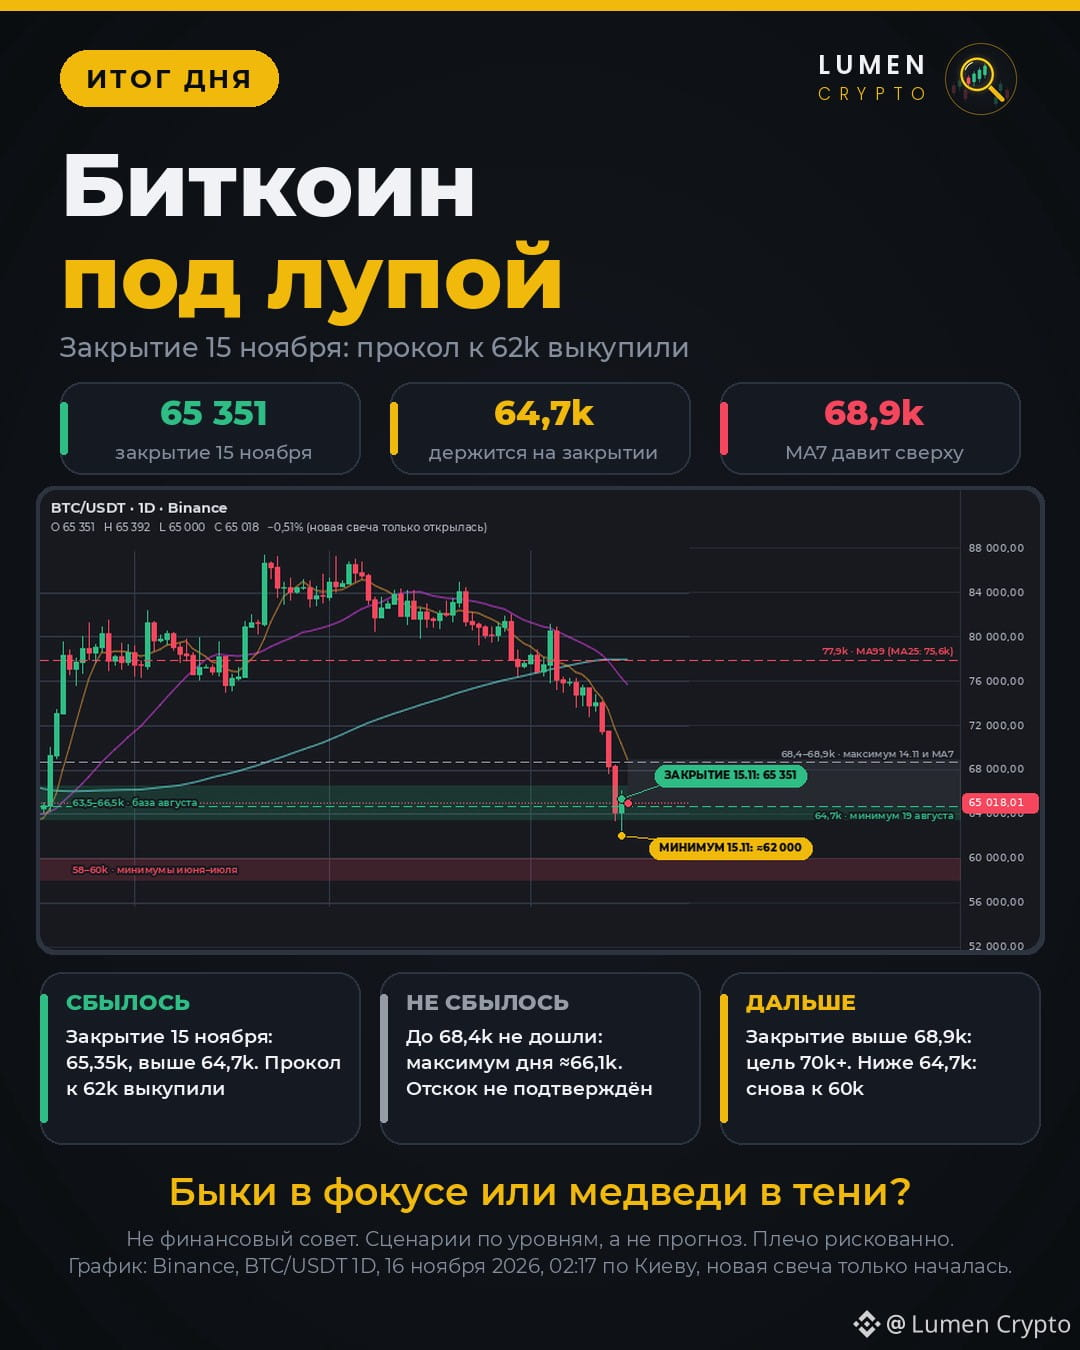
The daily candle on November 15 closed at 65,351. That’s above 64.7k, the August 19 low. The dip to 62k was bought up, and the close returned to the August base.
✅ Confirmed: 64.7k held at the close.
❌ Not confirmed: price didn’t reach 68.4k; the day’s high was around 66.1k. The rebound isn’t confirmed yet.
What’s weighing on price from above: MA7 has fallen to 68.9k, aligning with the November 14 high (68.4k). This is now a single resistance zone at 68.4–68.9k.
What’s next:
🟢 Close above 68.9k: target 70k+.
🟡 Between 64.7k and 68.4k for now: range-bound. The weekend is behind us, but the market is still cautious.
🔴 Close below 64.7k: back to 60k.
The new candle has just opened (65,018, −0.5%). The market is deciding which way to go: are the bulls in focus, or are the bears lurking in the shadows? Your move 👇
Not financial advice. Scenarios based on levels, not a forecast.
#BTC #bitcoin #Binance #LumenCrypto
$BTC under the microscope: daily recap 🔍
The daily candle on November 15 closed at 65,351. That’s above 64.7k, the August 19 low. The dip to 62k was bought up, and the close returned to the August base.
✅ Confirmed: 64.7k held at the close.
❌ Not confirmed: price didn’t reach 68.4k; the day’s high was around 66.1k. The rebound isn’t confirmed yet.
What’s weighing on price from above: MA7 has fallen to 68.9k, aligning with the November 14 high (68.4k). This is now a single resistance zone at 68.4–68.9k.
What’s next:
🟢 Close above 68.9k: target 70k+.
🟡 Between 64.7k and 68.4k for now: range-bound. The weekend is behind us, but the market is still cautious.
🔴 Close below 64.7k: back to 60k.
The new candle has just opened (65,018, −0.5%). The market is deciding which way to go: are the bulls in focus, or are the bears lurking in the shadows? Your move 👇
Not financial advice. Scenarios based on levels, not a forecast.
#BTC #bitcoin #Binance #LumenCrypto
The daily candle on November 15 closed at 65,351. That’s above 64.7k, the August 19 low. The dip to 62k was bought up, and the close returned to the August base.
✅ Confirmed: 64.7k held at the close.
❌ Not confirmed: price didn’t reach 68.4k; the day’s high was around 66.1k. The rebound isn’t confirmed yet.
What’s weighing on price from above: MA7 has fallen to 68.9k, aligning with the November 14 high (68.4k). This is now a single resistance zone at 68.4–68.9k.
What’s next:
🟢 Close above 68.9k: target 70k+.
🟡 Between 64.7k and 68.4k for now: range-bound. The weekend is behind us, but the market is still cautious.
🔴 Close below 64.7k: back to 60k.
The new candle has just opened (65,018, −0.5%). The market is deciding which way to go: are the bulls in focus, or are the bears lurking in the shadows? Your move 👇
Not financial advice. Scenarios based on levels, not a forecast.
#BTC #bitcoin #Binance #LumenCrypto
183
·
--
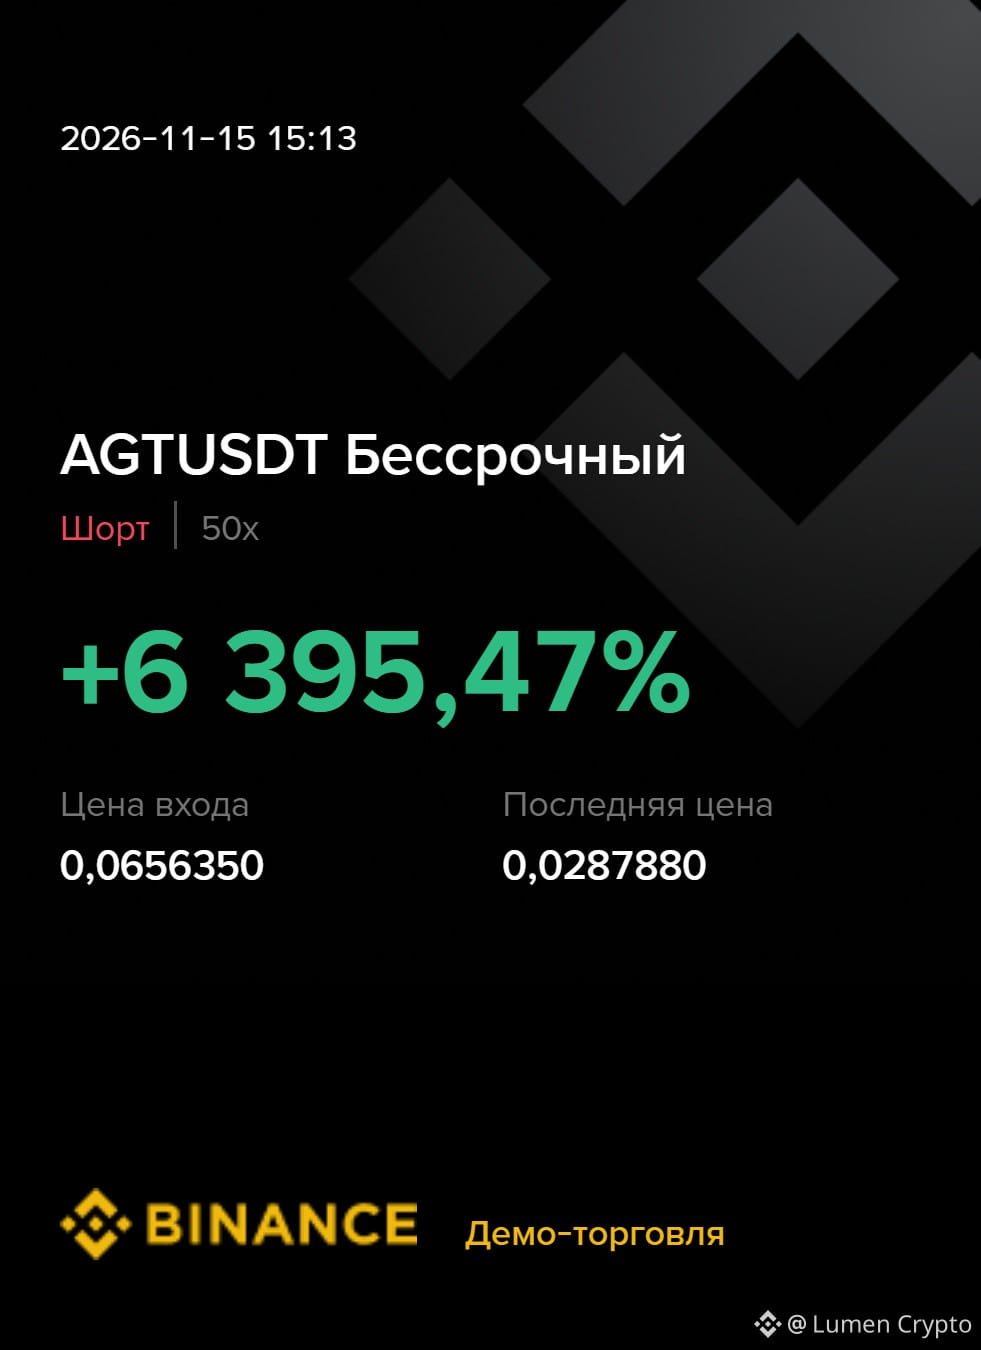
$AGT Anyone else holding a short position?
Good result in a couple of days, isn't it?
#AGT #LumenCrypto
$AGT Anyone else holding a short position?
Good result in a couple of days, isn't it?
#AGT #LumenCrypto
Good result in a couple of days, isn't it?
#AGT #LumenCrypto
295
·
--
Verified
$ETH Under the microscope: analysis 🔍
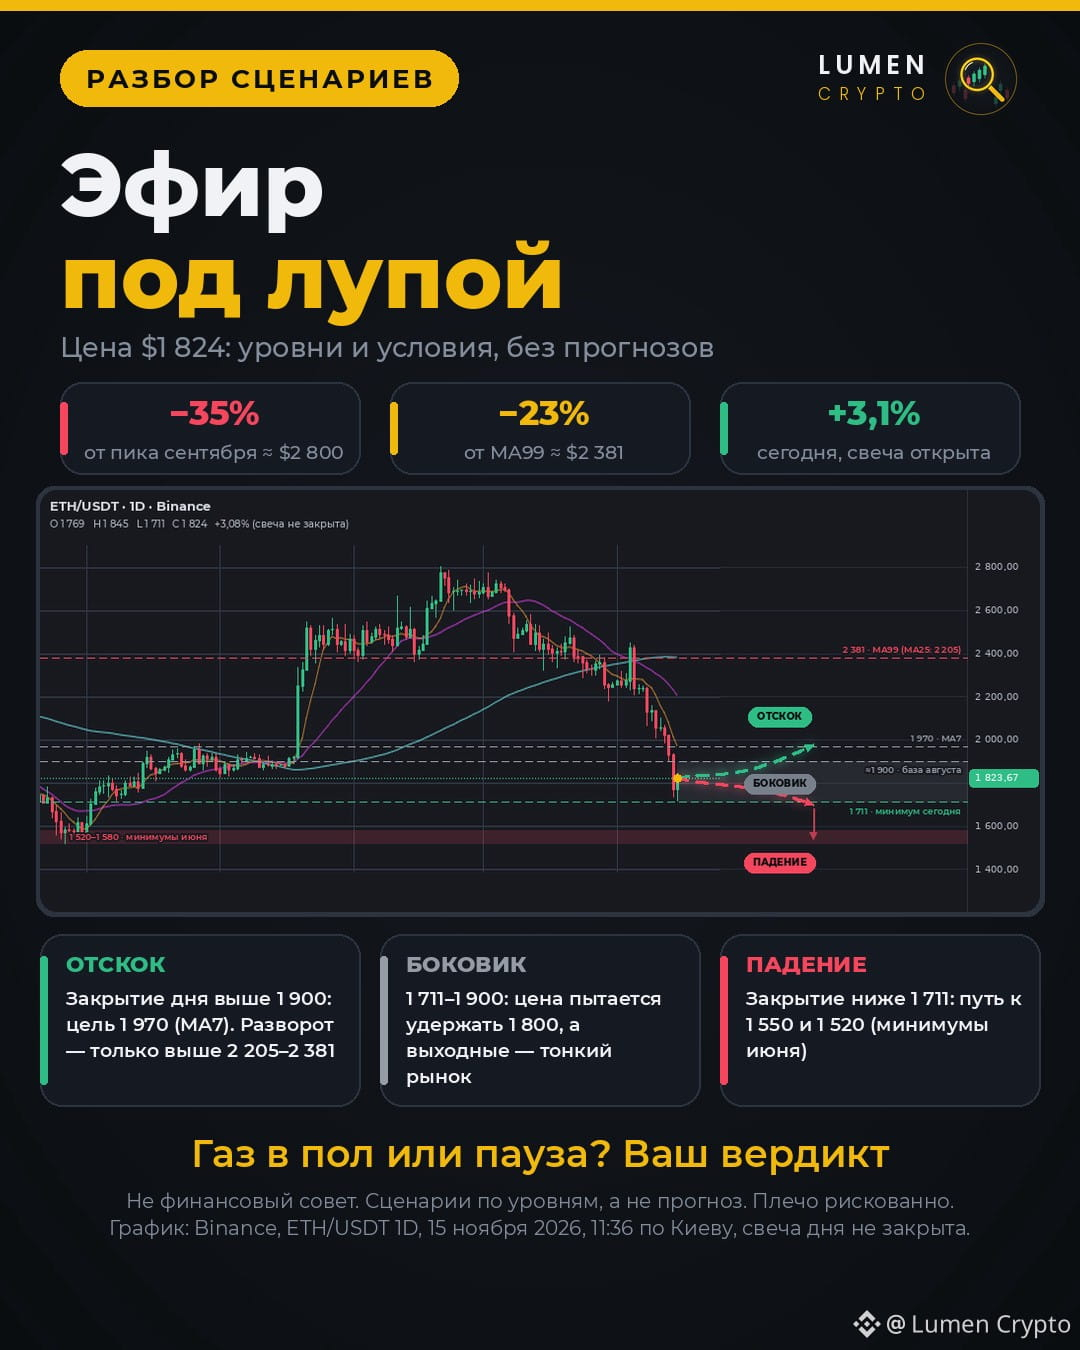
Ether around $1,824, up 3% today after dipping lower. Here’s what the chart shows:
▫️ Price is 23% below the MA99 (≈2,381) and 35% below September’s peak (≈2,800). The MA25 (≈2,205) and MA7 (≈1,970) are trending down.
▫️ The ≈1,900 zone, where Ether traded in August, has broken. It’s now resistance.
▫️ Today’s low was 1,711, after which the price was bought back up to 1,824. But the day isn’t over yet.
▫️ Background: On November 11, Core CPI came in at +0.3% m/m, while Fed member Waller said a rate hike in December was possible. This puts pressure on risk assets.
Scenarios by level:
🟢 Daily close above 1,900 → target 1,970 (MA7). A reversal only above 2,205–2,381.
⚪ Sideways between 1,711–1,900. Price is trying to hold 1,800; weekend trading is thin.
🔴 Close below 1,711 → path to 1,550 and 1,520 (June lows).
Floor it or take a break? Choose a side and tell us in the comments 👇
Not financial advice. These are scenarios based on levels, not a forecast.
#ETH #Ethereum #Binance #LumenCrypto
$ETH Under the microscope: analysis 🔍
Ether around $1,824, up 3% today after dipping lower. Here’s what the chart shows:
▫️ Price is 23% below the MA99 (≈2,381) and 35% below September’s peak (≈2,800). The MA25 (≈2,205) and MA7 (≈1,970) are trending down.
▫️ The ≈1,900 zone, where Ether traded in August, has broken. It’s now resistance.
▫️ Today’s low was 1,711, after which the price was bought back up to 1,824. But the day isn’t over yet.
▫️ Background: On November 11, Core CPI came in at +0.3% m/m, while Fed member Waller said a rate hike in December was possible. This puts pressure on risk assets.
Scenarios by level:
🟢 Daily close above 1,900 → target 1,970 (MA7). A reversal only above 2,205–2,381.
⚪ Sideways between 1,711–1,900. Price is trying to hold 1,800; weekend trading is thin.
🔴 Close below 1,711 → path to 1,550 and 1,520 (June lows).
Floor it or take a break? Choose a side and tell us in the comments 👇
Not financial advice. These are scenarios based on levels, not a forecast.
#ETH #Ethereum #Binance #LumenCrypto
Ether around $1,824, up 3% today after dipping lower. Here’s what the chart shows:
▫️ Price is 23% below the MA99 (≈2,381) and 35% below September’s peak (≈2,800). The MA25 (≈2,205) and MA7 (≈1,970) are trending down.
▫️ The ≈1,900 zone, where Ether traded in August, has broken. It’s now resistance.
▫️ Today’s low was 1,711, after which the price was bought back up to 1,824. But the day isn’t over yet.
▫️ Background: On November 11, Core CPI came in at +0.3% m/m, while Fed member Waller said a rate hike in December was possible. This puts pressure on risk assets.
Scenarios by level:
🟢 Daily close above 1,900 → target 1,970 (MA7). A reversal only above 2,205–2,381.
⚪ Sideways between 1,711–1,900. Price is trying to hold 1,800; weekend trading is thin.
🔴 Close below 1,711 → path to 1,550 and 1,520 (June lows).
Floor it or take a break? Choose a side and tell us in the comments 👇
Not financial advice. These are scenarios based on levels, not a forecast.
#ETH #Ethereum #Binance #LumenCrypto
837
·
--
$BTC under the magnifying glass: yesterday’s analysis, summed up 🔍
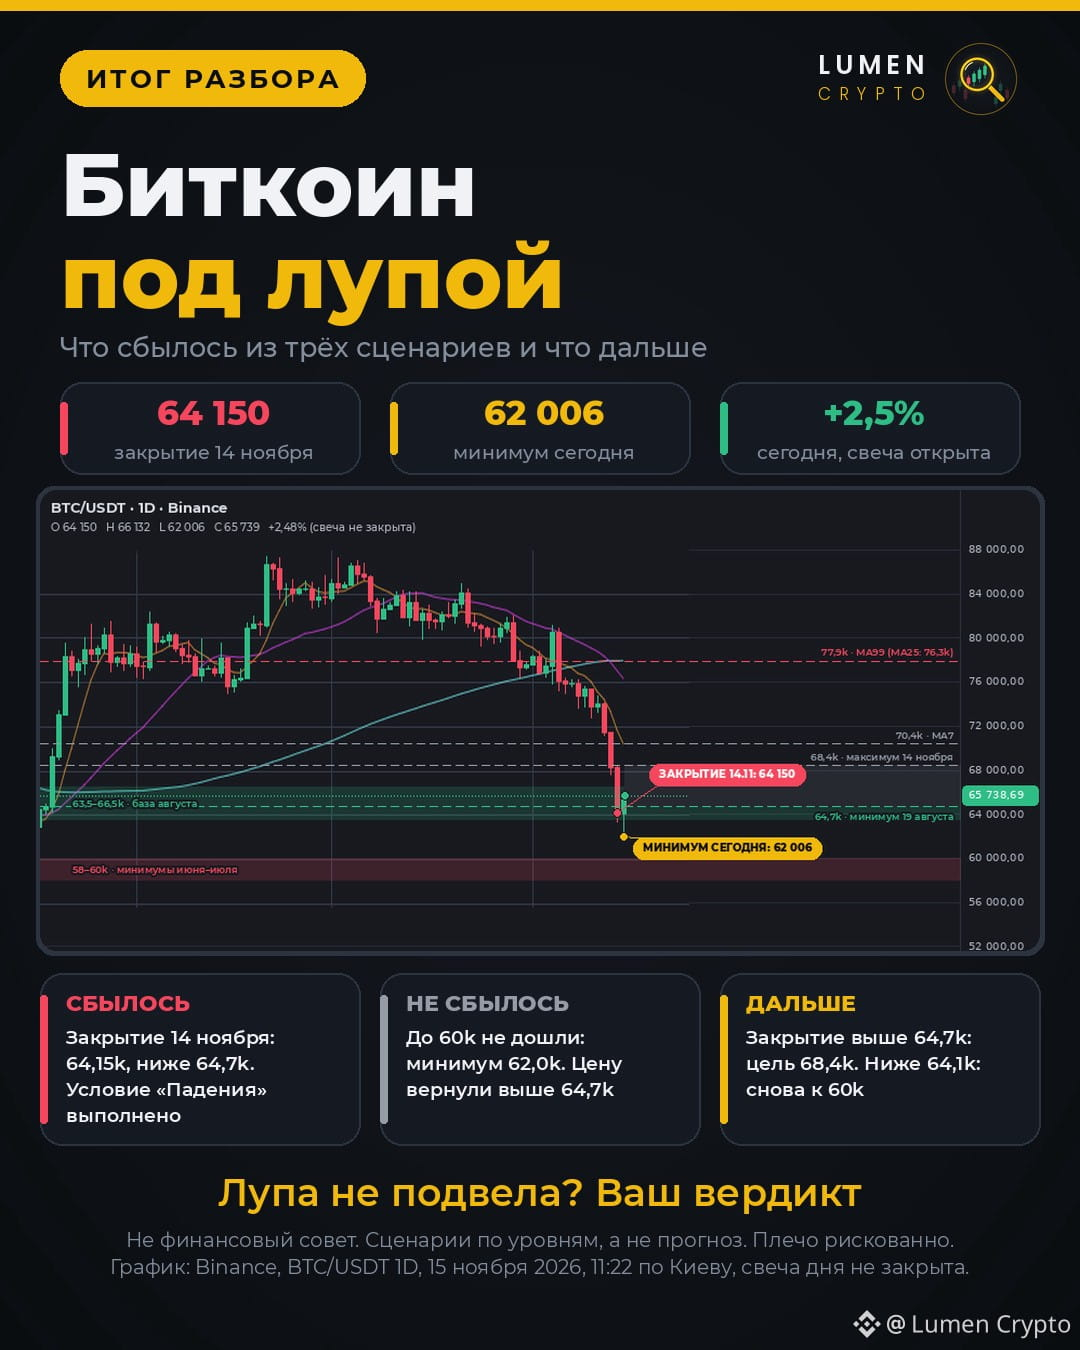
Yesterday I analyzed three scenarios. Let’s see what came true.
🔴 It happened: the daily candle on November 14 closed at 64.15k, below 64.7k (the August 19 low). The “Drop” scenario condition was met.
⚪ It didn’t happen: we didn’t reach 60k. Today’s low was 62.0k, after which the price was pushed back above 64.7k. It’s now around 65.7k, back at the August base.
What this means: the dip below 64.7k was bought up, but the trend is still down, with MA7 (≈70.4k) pressing from above.
🟡 Daily close above 64.7k: target 68.4k.
🟡 Close below 64.1k: back to 60k.
Today’s candle will close at 02:00 Kyiv time. If you’d like, I can share the results for that one too.
Did the magnifying glass get it right, or miss the mark? What’s your verdict? 👇
Not financial advice. These are scenarios based on levels, not a forecast.
#BTC #bitcoin #LumenCrypto
$BTC under the magnifying glass: yesterday’s analysis, summed up 🔍
Yesterday I analyzed three scenarios. Let’s see what came true.
🔴 It happened: the daily candle on November 14 closed at 64.15k, below 64.7k (the August 19 low). The “Drop” scenario condition was met.
⚪ It didn’t happen: we didn’t reach 60k. Today’s low was 62.0k, after which the price was pushed back above 64.7k. It’s now around 65.7k, back at the August base.
What this means: the dip below 64.7k was bought up, but the trend is still down, with MA7 (≈70.4k) pressing from above.
🟡 Daily close above 64.7k: target 68.4k.
🟡 Close below 64.1k: back to 60k.
Today’s candle will close at 02:00 Kyiv time. If you’d like, I can share the results for that one too.
Did the magnifying glass get it right, or miss the mark? What’s your verdict? 👇
Not financial advice. These are scenarios based on levels, not a forecast.
#BTC #bitcoin #LumenCrypto
Yesterday I analyzed three scenarios. Let’s see what came true.
🔴 It happened: the daily candle on November 14 closed at 64.15k, below 64.7k (the August 19 low). The “Drop” scenario condition was met.
⚪ It didn’t happen: we didn’t reach 60k. Today’s low was 62.0k, after which the price was pushed back above 64.7k. It’s now around 65.7k, back at the August base.
What this means: the dip below 64.7k was bought up, but the trend is still down, with MA7 (≈70.4k) pressing from above.
🟡 Daily close above 64.7k: target 68.4k.
🟡 Close below 64.1k: back to 60k.
Today’s candle will close at 02:00 Kyiv time. If you’d like, I can share the results for that one too.
Did the magnifying glass get it right, or miss the mark? What’s your verdict? 👇
Not financial advice. These are scenarios based on levels, not a forecast.
#BTC #bitcoin #LumenCrypto
242
·
--
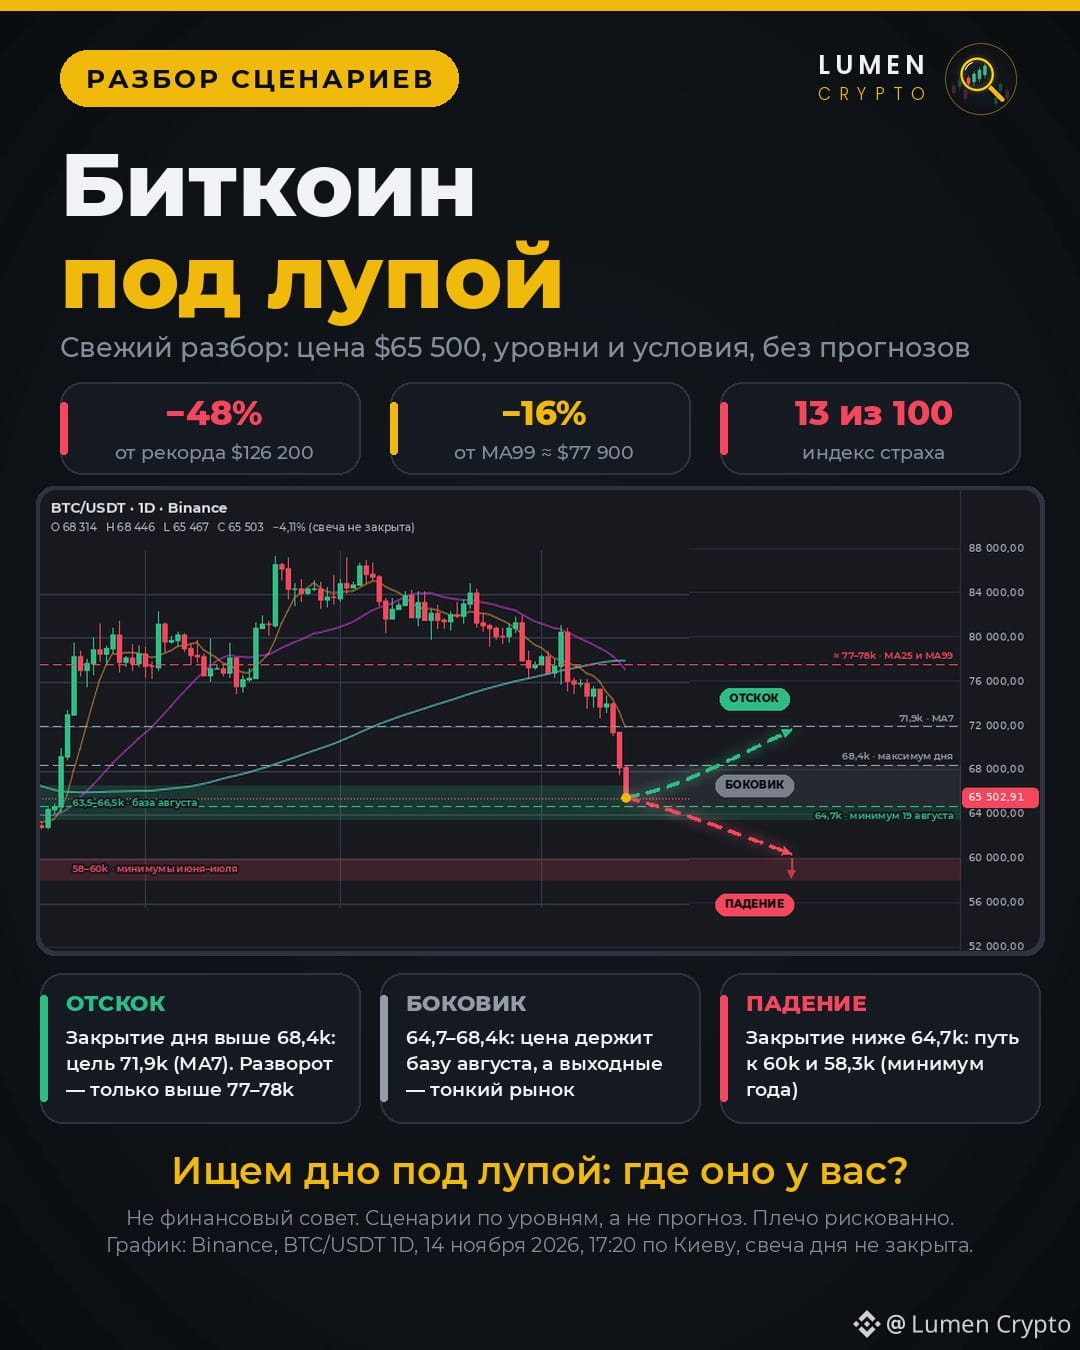
$BTC under the microscope: a fresh analysis 🔍
Price around $65,500, daily candle −4%. Here’s what I see on the chart:
▫️ Price is sitting at the upper boundary of the August base (63.5–66.5k). This is the last major support before the June and July lows (58–60k).
▫️ The day is closing near its low, with almost no lower wick. Buyers haven’t shown up yet.
▫️ MA25 has crossed below MA99, and the price is 16% below MA99 (≈$77,900). A reversal of that kind is still a long way off.
▫️ Yesterday’s volume was noticeably lower than the June and August peaks. There’s been no capitulation yet, so it’s too early to call a bottom.
Scenarios by levels:
🟢 Daily close above 68.4k → target 71.9k (MA7). The trend only reverses above 77–78k.
⚪ Sideways between 64.7–68.4k. It’s the weekend, liquidity is thin, and movement in either direction is possible.
🔴 Close below 64.7k (August 19 low) → path to 60k and 58.3k.
Important: the daily candle closes at 02:00 Kyiv time, and the close—not an intraday wick—is what matters. Fear Index: 13 out of 100.
Everyone is looking for a bottom. Where do you think it is, and what signal will tell you that it’s here? 👇
Not financial advice. These are scenarios based on levels, not a forecast.
#BTC #bitcoin #BİNANCE #TechnicalAnalysis #LumenCrypto
$BTC under the microscope: a fresh analysis 🔍
Price around $65,500, daily candle −4%. Here’s what I see on the chart:
▫️ Price is sitting at the upper boundary of the August base (63.5–66.5k). This is the last major support before the June and July lows (58–60k).
▫️ The day is closing near its low, with almost no lower wick. Buyers haven’t shown up yet.
▫️ MA25 has crossed below MA99, and the price is 16% below MA99 (≈$77,900). A reversal of that kind is still a long way off.
▫️ Yesterday’s volume was noticeably lower than the June and August peaks. There’s been no capitulation yet, so it’s too early to call a bottom.
Scenarios by levels:
🟢 Daily close above 68.4k → target 71.9k (MA7). The trend only reverses above 77–78k.
⚪ Sideways between 64.7–68.4k. It’s the weekend, liquidity is thin, and movement in either direction is possible.
🔴 Close below 64.7k (August 19 low) → path to 60k and 58.3k.
Important: the daily candle closes at 02:00 Kyiv time, and the close—not an intraday wick—is what matters. Fear Index: 13 out of 100.
Everyone is looking for a bottom. Where do you think it is, and what signal will tell you that it’s here? 👇
Not financial advice. These are scenarios based on levels, not a forecast.
#BTC #bitcoin #BİNANCE #TechnicalAnalysis #LumenCrypto
Price around $65,500, daily candle −4%. Here’s what I see on the chart:
▫️ Price is sitting at the upper boundary of the August base (63.5–66.5k). This is the last major support before the June and July lows (58–60k).
▫️ The day is closing near its low, with almost no lower wick. Buyers haven’t shown up yet.
▫️ MA25 has crossed below MA99, and the price is 16% below MA99 (≈$77,900). A reversal of that kind is still a long way off.
▫️ Yesterday’s volume was noticeably lower than the June and August peaks. There’s been no capitulation yet, so it’s too early to call a bottom.
Scenarios by levels:
🟢 Daily close above 68.4k → target 71.9k (MA7). The trend only reverses above 77–78k.
⚪ Sideways between 64.7–68.4k. It’s the weekend, liquidity is thin, and movement in either direction is possible.
🔴 Close below 64.7k (August 19 low) → path to 60k and 58.3k.
Important: the daily candle closes at 02:00 Kyiv time, and the close—not an intraday wick—is what matters. Fear Index: 13 out of 100.
Everyone is looking for a bottom. Where do you think it is, and what signal will tell you that it’s here? 👇
Not financial advice. These are scenarios based on levels, not a forecast.
#BTC #bitcoin #BİNANCE #TechnicalAnalysis #LumenCrypto
3k
·
--
$AKE
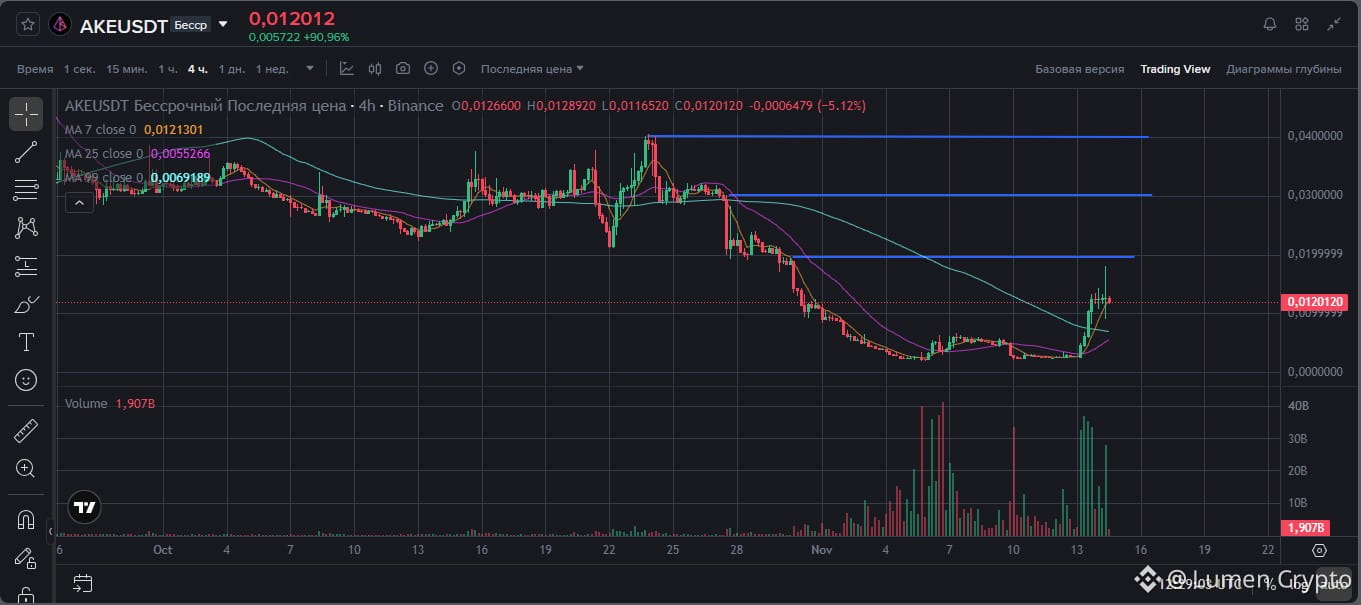
If you think the coin's rise is over, you're very wrong!
There's still room to grow! I've marked the levels on the chart. It could go even higher in the future.
What do you think? Will it wipe out all the short positions, or will it go down? 👇
#AKE #LumenCrypto
$AKE
If you think the coin's rise is over, you're very wrong!
There's still room to grow! I've marked the levels on the chart. It could go even higher in the future.
What do you think? Will it wipe out all the short positions, or will it go down? 👇
#AKE #LumenCrypto
If you think the coin's rise is over, you're very wrong!
There's still room to grow! I've marked the levels on the chart. It could go even higher in the future.
What do you think? Will it wipe out all the short positions, or will it go down? 👇
#AKE #LumenCrypto
2
1.2k
·
--
Bearish
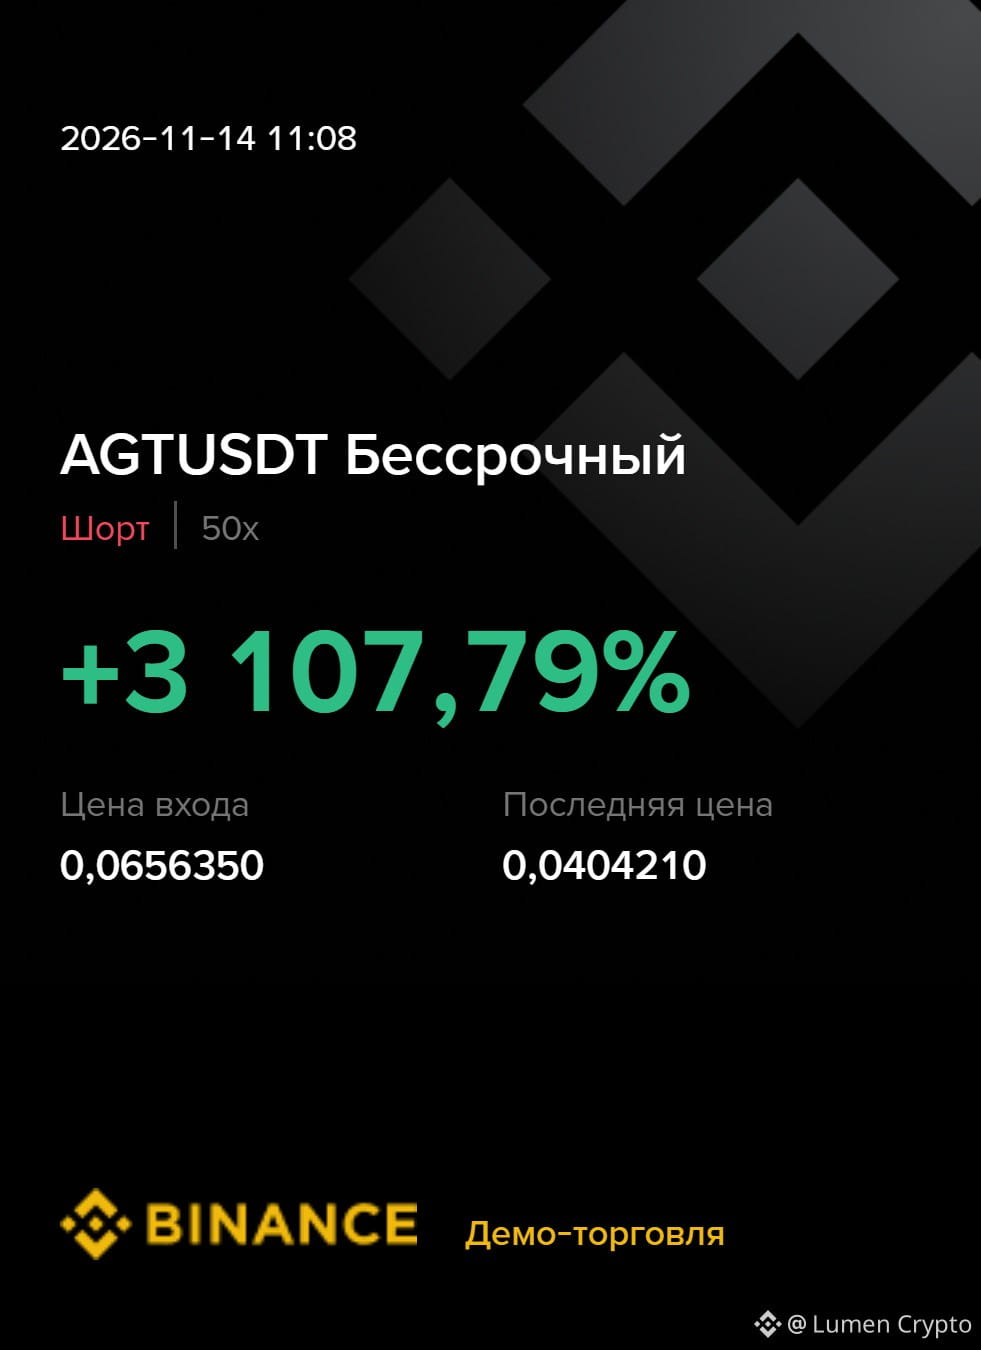
$AGT continues to fall.
Is anyone else still holding? Share your results if you followed my advice in the comments!
#AGT #LumenCrypto
$AGT continues to fall.
Is anyone else still holding? Share your results if you followed my advice in the comments!
#AGT #LumenCrypto
Is anyone else still holding? Share your results if you followed my advice in the comments!
#AGT #LumenCrypto
343
·
--
📖 From Scratch Under the Microscope · Chapter 1: “Balance: Zero”
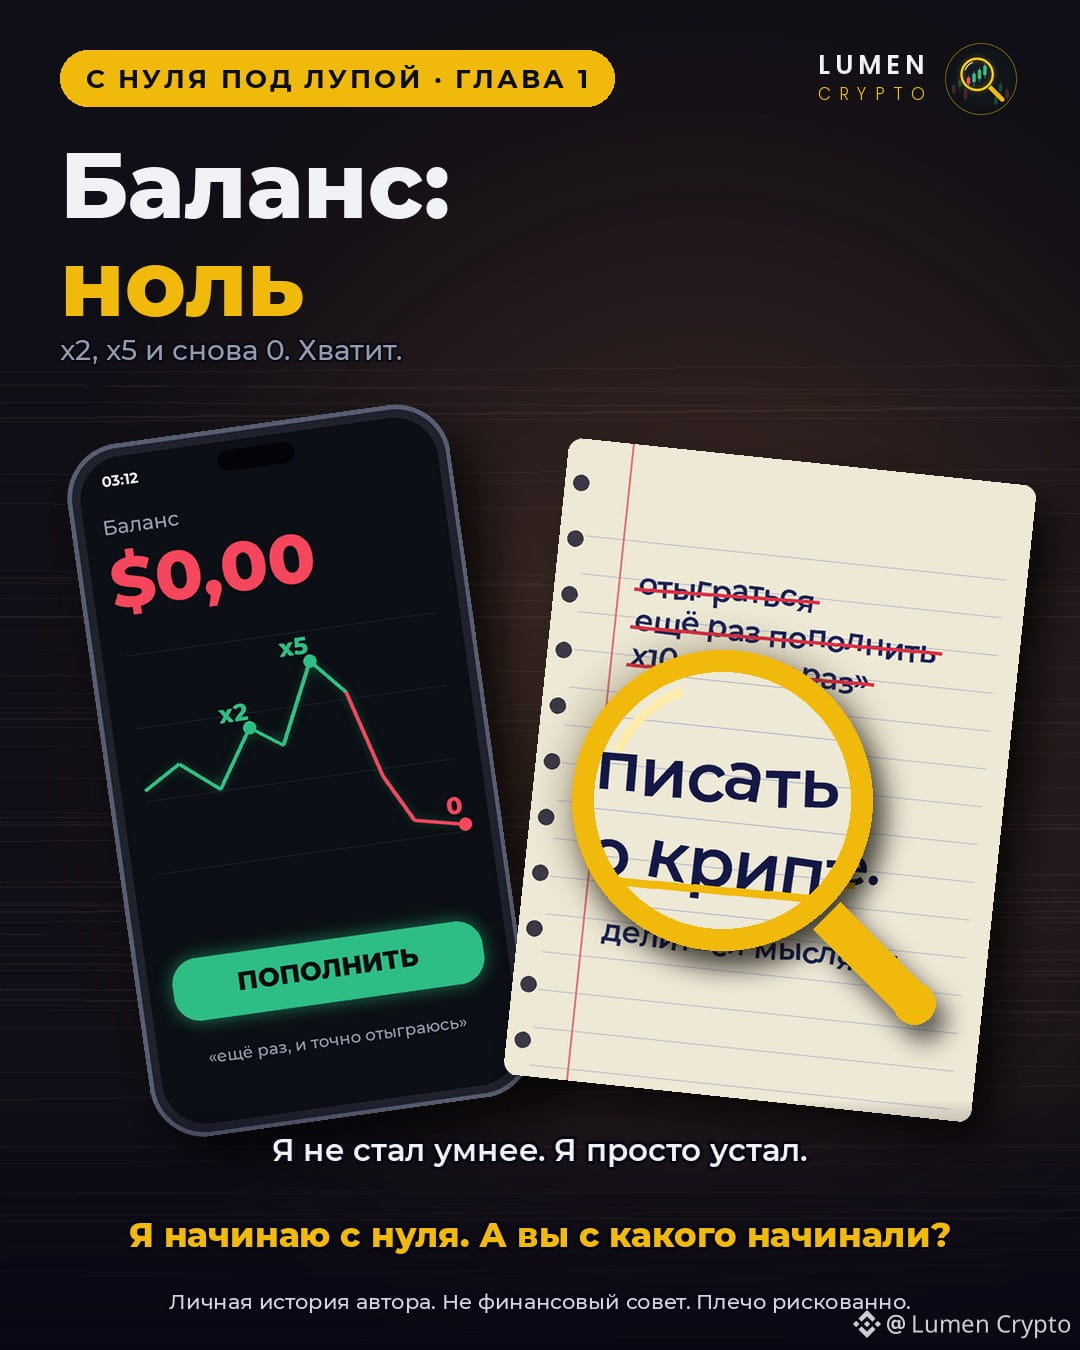
I know this screen by heart. Three in the morning, the app is open, and in the corner, in red: $0.00.
The worst part is, I wasn’t always in the red. I was up x2. I was up x5. Once, I even thought I’d finally figured out the market. And then came “just a little more,” “it’ll bounce back now,” “I’ll top up and win it back.” And back to zero.
I topped up my account so many times that the “Top Up” button became a habit. Like a cigarette: you know you shouldn’t, but you reach for it anyway.
Today, I didn’t press it. Not because I’ve gotten smarter. I’m just tired.
I’ve decided: no more blowing my money. Instead, I’ll do something I can manage without leverage: write. About crypto, about what I see, about my mistakes. Maybe someone will find it interesting, or at least useful for avoiding the same pitfalls.
The rules:
🔹 no “buy now” signals
🔹 no screenshots of other people’s profits
🔹 just honesty: what I see, what I think, where I went wrong.
My starting goal: 1,000 subscribers and my first $100 from writing. Then, even more.
I’m starting from zero, in the most literal sense. What did you start with? Tell me—there are lots of people like that here 👇
#снуля #bitcoin #crypto #LumenCrypto
📖 From Scratch Under the Microscope · Chapter 1: “Balance: Zero”
I know this screen by heart. Three in the morning, the app is open, and in the corner, in red: $0.00.
The worst part is, I wasn’t always in the red. I was up x2. I was up x5. Once, I even thought I’d finally figured out the market. And then came “just a little more,” “it’ll bounce back now,” “I’ll top up and win it back.” And back to zero.
I topped up my account so many times that the “Top Up” button became a habit. Like a cigarette: you know you shouldn’t, but you reach for it anyway.
Today, I didn’t press it. Not because I’ve gotten smarter. I’m just tired.
I’ve decided: no more blowing my money. Instead, I’ll do something I can manage without leverage: write. About crypto, about what I see, about my mistakes. Maybe someone will find it interesting, or at least useful for avoiding the same pitfalls.
The rules:
🔹 no “buy now” signals
🔹 no screenshots of other people’s profits
🔹 just honesty: what I see, what I think, where I went wrong.
My starting goal: 1,000 subscribers and my first $100 from writing. Then, even more.
I’m starting from zero, in the most literal sense. What did you start with? Tell me—there are lots of people like that here 👇
#снуля #bitcoin #crypto #LumenCrypto
I know this screen by heart. Three in the morning, the app is open, and in the corner, in red: $0.00.
The worst part is, I wasn’t always in the red. I was up x2. I was up x5. Once, I even thought I’d finally figured out the market. And then came “just a little more,” “it’ll bounce back now,” “I’ll top up and win it back.” And back to zero.
I topped up my account so many times that the “Top Up” button became a habit. Like a cigarette: you know you shouldn’t, but you reach for it anyway.
Today, I didn’t press it. Not because I’ve gotten smarter. I’m just tired.
I’ve decided: no more blowing my money. Instead, I’ll do something I can manage without leverage: write. About crypto, about what I see, about my mistakes. Maybe someone will find it interesting, or at least useful for avoiding the same pitfalls.
The rules:
🔹 no “buy now” signals
🔹 no screenshots of other people’s profits
🔹 just honesty: what I see, what I think, where I went wrong.
My starting goal: 1,000 subscribers and my first $100 from writing. Then, even more.
I’m starting from zero, in the most literal sense. What did you start with? Tell me—there are lots of people like that here 👇
#снуля #bitcoin #crypto #LumenCrypto
88
·
--
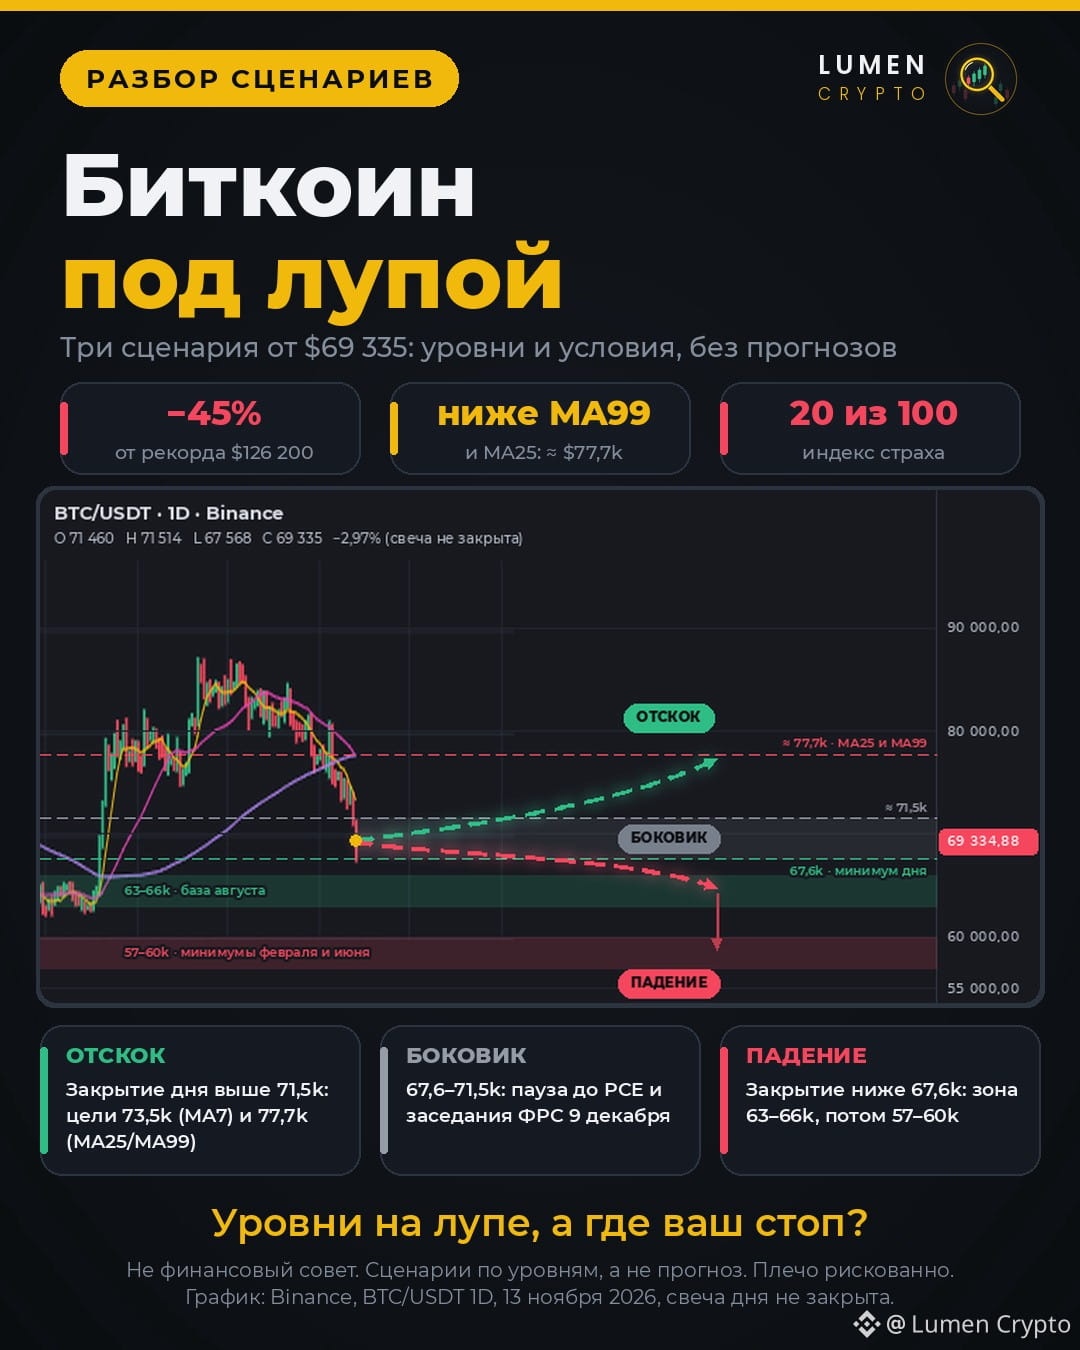
🔍 Bitcoin under the magnifying glass: structure and scenarios
$BTC is trading around $69,300: that’s −45% from its record high ($126,200) and about a 61.8% retracement of the rise from the June low (≈$57.5k) to the October high (≈$87k).
What the daily chart shows:
The price is below MA7 ($73.5k), MA25 and MA99 (≈$77.7k), while MA25 is crossing MA99 from above. As long as the price remains below this cluster, bounces are moves toward resistance, not a reversal. The decline is happening on volumes below February’s spikes. A bottom is usually accompanied by a volume spike, which hasn’t appeared yet. Today’s candle, with a low of $67,568, has a lower wick of nearly $1,800: $67.6k is holding for now, but the candle hasn’t closed yet.
Three scenarios based on key levels:
🟢 Bounce: daily close above $71.5k → targets of $73.5k (MA7) and $77.7k (MA25/MA99). Only a close above $77.7k would count as a reversal.
⚪ Sideways: $67.6–71.5k, a pause until the PCE data and the Fed meeting on December 9.
🔴 Drop: close below $67.6k → the $63–66k zone (August base); if that gives way, $57–60k (February and June lows).
The backdrop: CPI came in above expectations, the Fed’s rate decision in December is uncertain, ETF outflows, and a fear index reading of 20. None of these scenarios is guaranteed; these are levels to watch.
What do you see under the magnifying glass: a bounce or a new low? 👇
#Bitcoin #BTC #TechnicalAnalysis #LumenCrypto
🔍 Bitcoin under the magnifying glass: structure and scenarios
$BTC is trading around $69,300: that’s −45% from its record high ($126,200) and about a 61.8% retracement of the rise from the June low (≈$57.5k) to the October high (≈$87k).
What the daily chart shows:
The price is below MA7 ($73.5k), MA25 and MA99 (≈$77.7k), while MA25 is crossing MA99 from above. As long as the price remains below this cluster, bounces are moves toward resistance, not a reversal. The decline is happening on volumes below February’s spikes. A bottom is usually accompanied by a volume spike, which hasn’t appeared yet. Today’s candle, with a low of $67,568, has a lower wick of nearly $1,800: $67.6k is holding for now, but the candle hasn’t closed yet.
Three scenarios based on key levels:
🟢 Bounce: daily close above $71.5k → targets of $73.5k (MA7) and $77.7k (MA25/MA99). Only a close above $77.7k would count as a reversal.
⚪ Sideways: $67.6–71.5k, a pause until the PCE data and the Fed meeting on December 9.
🔴 Drop: close below $67.6k → the $63–66k zone (August base); if that gives way, $57–60k (February and June lows).
The backdrop: CPI came in above expectations, the Fed’s rate decision in December is uncertain, ETF outflows, and a fear index reading of 20. None of these scenarios is guaranteed; these are levels to watch.
What do you see under the magnifying glass: a bounce or a new low? 👇
#Bitcoin #BTC #TechnicalAnalysis #LumenCrypto
$BTC is trading around $69,300: that’s −45% from its record high ($126,200) and about a 61.8% retracement of the rise from the June low (≈$57.5k) to the October high (≈$87k).
What the daily chart shows:
The price is below MA7 ($73.5k), MA25 and MA99 (≈$77.7k), while MA25 is crossing MA99 from above. As long as the price remains below this cluster, bounces are moves toward resistance, not a reversal. The decline is happening on volumes below February’s spikes. A bottom is usually accompanied by a volume spike, which hasn’t appeared yet. Today’s candle, with a low of $67,568, has a lower wick of nearly $1,800: $67.6k is holding for now, but the candle hasn’t closed yet.
Three scenarios based on key levels:
🟢 Bounce: daily close above $71.5k → targets of $73.5k (MA7) and $77.7k (MA25/MA99). Only a close above $77.7k would count as a reversal.
⚪ Sideways: $67.6–71.5k, a pause until the PCE data and the Fed meeting on December 9.
🔴 Drop: close below $67.6k → the $63–66k zone (August base); if that gives way, $57–60k (February and June lows).
The backdrop: CPI came in above expectations, the Fed’s rate decision in December is uncertain, ETF outflows, and a fear index reading of 20. None of these scenarios is guaranteed; these are levels to watch.
What do you see under the magnifying glass: a bounce or a new low? 👇
#Bitcoin #BTC #TechnicalAnalysis #LumenCrypto
1
1.2k
·
--
Bearish
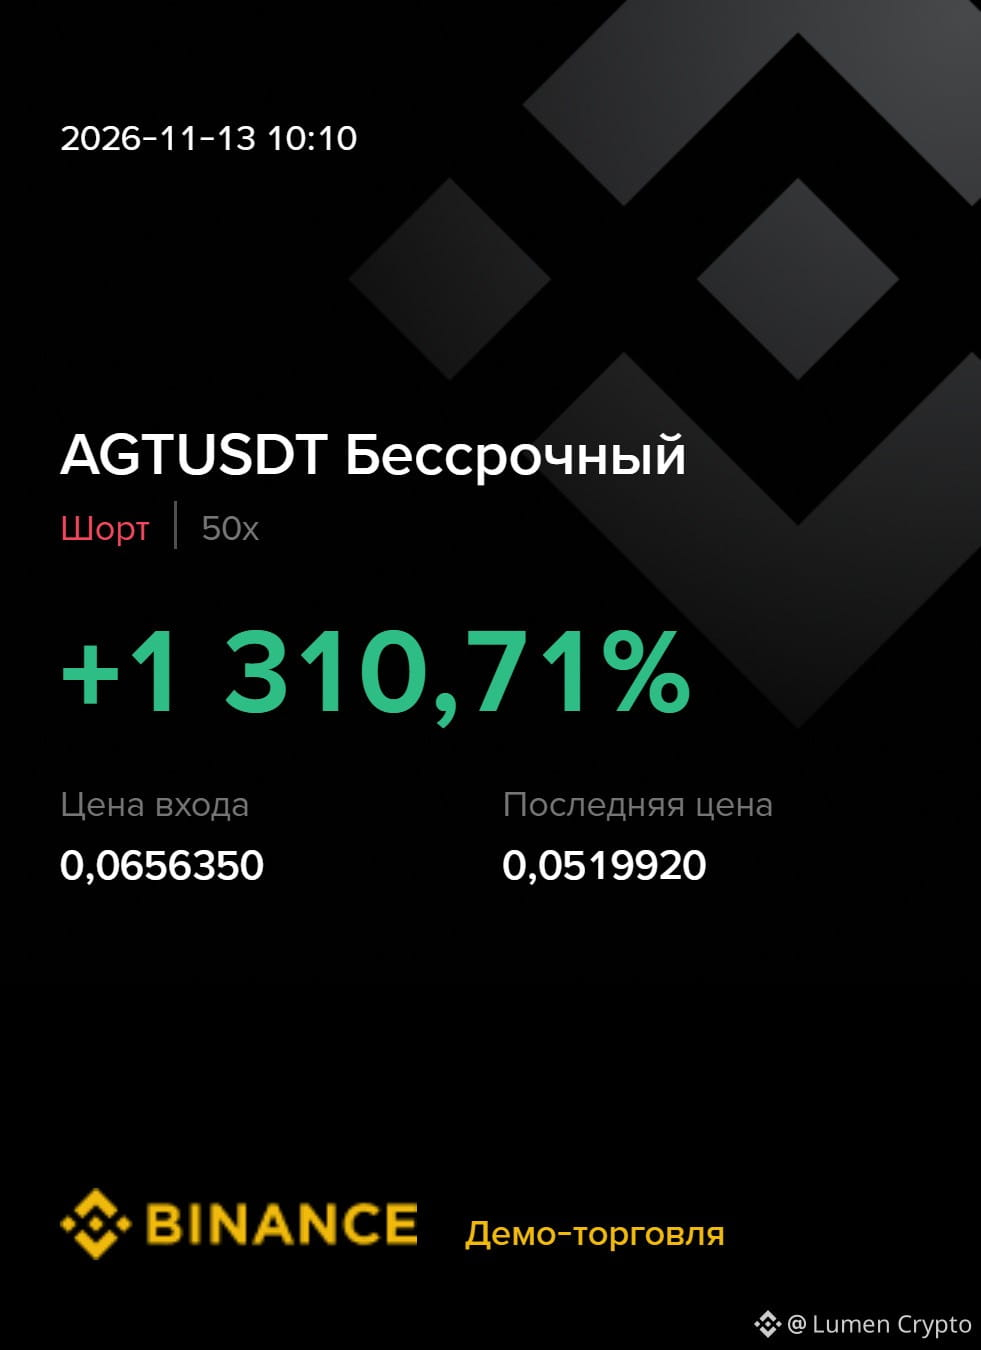
$AGT Finally, the coin has started to fall!
The scenario from previous posts played out well!
Now the question is: should I close the position or ride it further down?
#AGT #demotraiding #LumenCrypto
$AGT Finally, the coin has started to fall!
The scenario from previous posts played out well!
Now the question is: should I close the position or ride it further down?
#AGT #demotraiding #LumenCrypto
The scenario from previous posts played out well!
Now the question is: should I close the position or ride it further down?
#AGT #demotraiding #LumenCrypto
610
·
--
🔍 NVIDIA under the microscope: Jensen Huang steps down
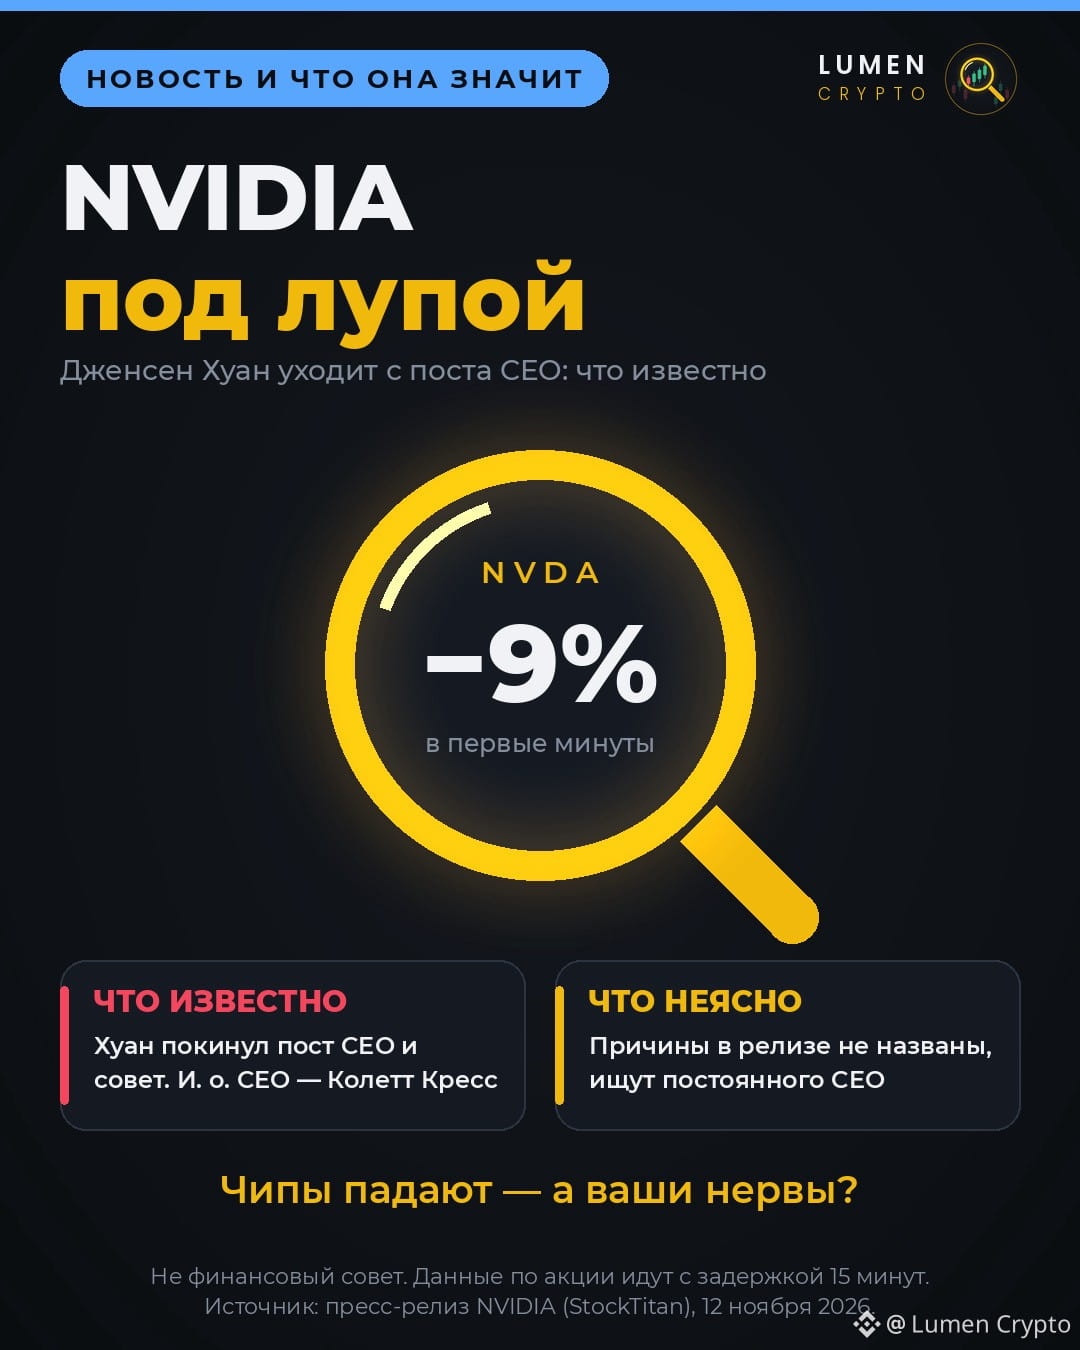
Today, NVIDIA announced that Jensen Huang has left his positions as CEO, president, and board member. Here’s what we know:
✅ Colette Kress (also the CFO) has been appointed interim CEO
✅ The board is searching for a permanent leader
❓ The announcement did not state the reasons
📉 Shares $NVDA fell by about 9% in the first few minutes
Why this matters for crypto: NVIDIA is the leading symbol of the AI rally, and news like this weighs on risk sentiment across all markets. No one has proven a direct connection to $BTC and AI tokens, but market reactions often have a ripple effect.
Chips are falling—how are your nerves? What do you see under the microscope: a one-off panic or the start of an AI correction? 👇
Not financial advice.
#NVIDIA #Bitcoin #Aİ #crypto #LumenCrypto
🔍 NVIDIA under the microscope: Jensen Huang steps down
Today, NVIDIA announced that Jensen Huang has left his positions as CEO, president, and board member. Here’s what we know:
✅ Colette Kress (also the CFO) has been appointed interim CEO
✅ The board is searching for a permanent leader
❓ The announcement did not state the reasons
📉 Shares $NVDA fell by about 9% in the first few minutes
Why this matters for crypto: NVIDIA is the leading symbol of the AI rally, and news like this weighs on risk sentiment across all markets. No one has proven a direct connection to $BTC and AI tokens, but market reactions often have a ripple effect.
Chips are falling—how are your nerves? What do you see under the microscope: a one-off panic or the start of an AI correction? 👇
Not financial advice.
#NVIDIA #Bitcoin #Aİ #crypto #LumenCrypto
Today, NVIDIA announced that Jensen Huang has left his positions as CEO, president, and board member. Here’s what we know:
✅ Colette Kress (also the CFO) has been appointed interim CEO
✅ The board is searching for a permanent leader
❓ The announcement did not state the reasons
📉 Shares $NVDA fell by about 9% in the first few minutes
Why this matters for crypto: NVIDIA is the leading symbol of the AI rally, and news like this weighs on risk sentiment across all markets. No one has proven a direct connection to $BTC and AI tokens, but market reactions often have a ripple effect.
Chips are falling—how are your nerves? What do you see under the microscope: a one-off panic or the start of an AI correction? 👇
Not financial advice.
#NVIDIA #Bitcoin #Aİ #crypto #LumenCrypto
480
·
--
Bearish
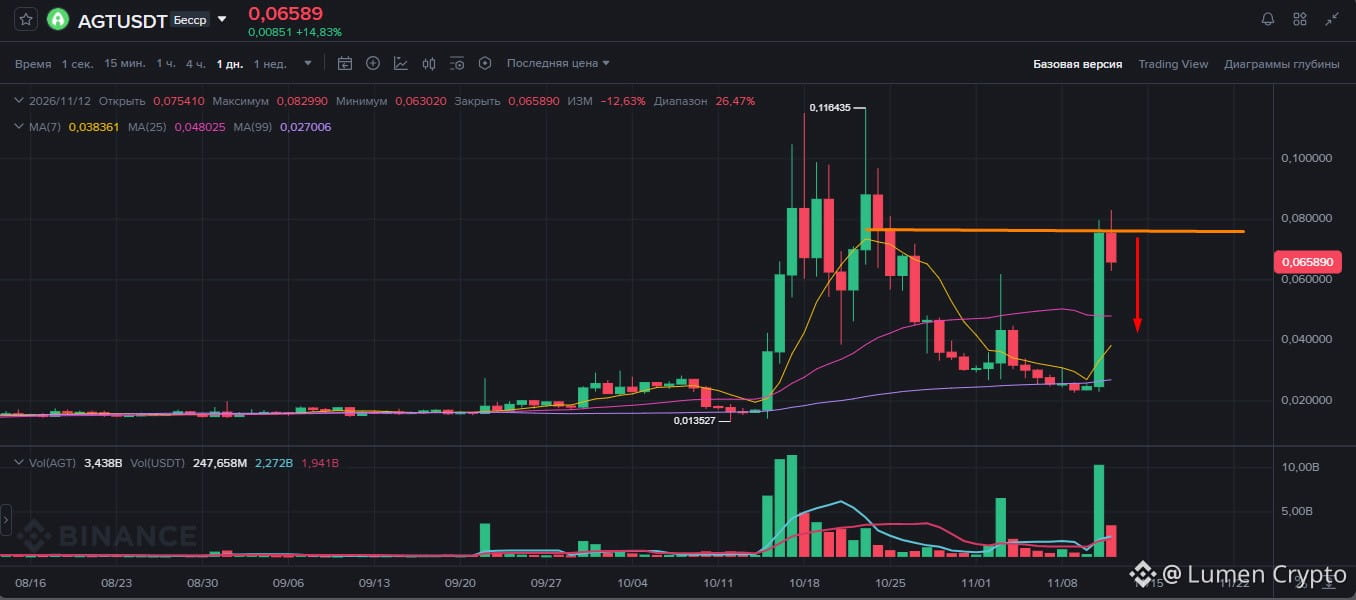
$AGT Failed to break through a strong support level! A pullback followed.
Watch the marked level closely. I recommend placing the stop just beyond the level above.
There’s a chance to enter a short position.
#AGT #LumenCrypto
$AGT Failed to break through a strong support level! A pullback followed.
Watch the marked level closely. I recommend placing the stop just beyond the level above.
There’s a chance to enter a short position.
#AGT #LumenCrypto
Watch the marked level closely. I recommend placing the stop just beyond the level above.
There’s a chance to enter a short position.
#AGT #LumenCrypto
132
·
--
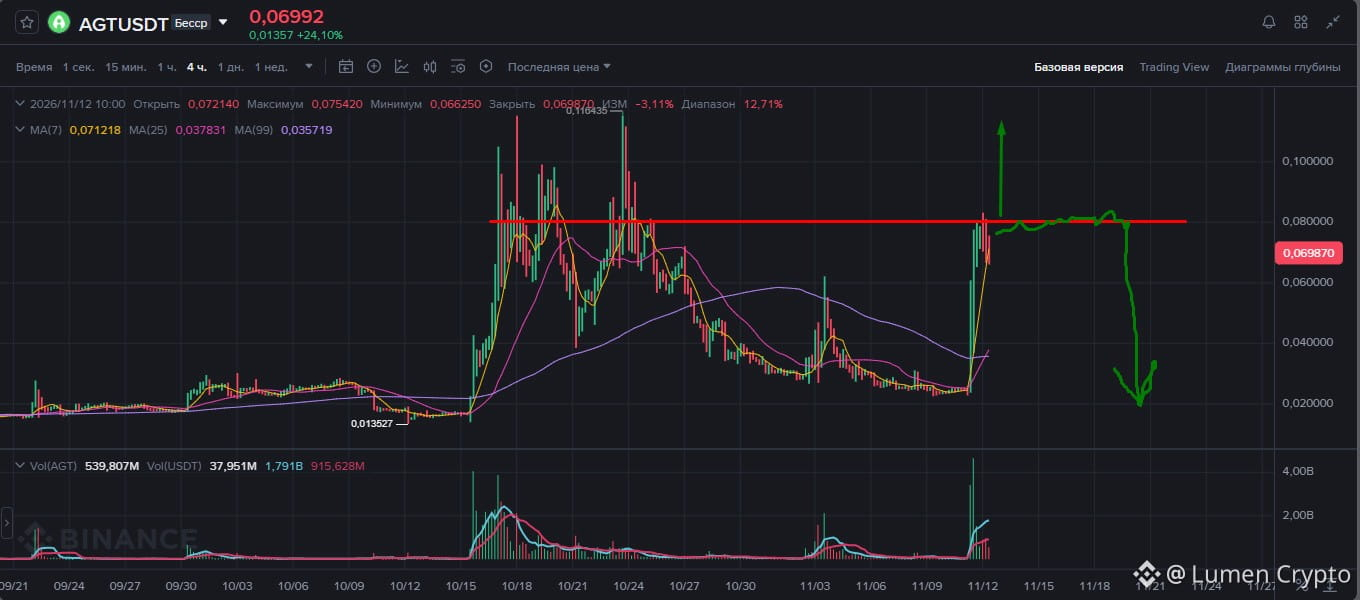
$AGT
Since the last post, the overall situation hasn’t changed! The coin broke through several strong support levels and moved higher.
Now it’s hit resistance again. We need to keep a close eye on the situation:
- if it breaks through the marked level, it could climb even higher;
- if it fails and starts pulling back, it may be time to look for short positions.
#AGT #LumenCrypto
$AGT
Since the last post, the overall situation hasn’t changed! The coin broke through several strong support levels and moved higher.
Now it’s hit resistance again. We need to keep a close eye on the situation:
- if it breaks through the marked level, it could climb even higher;
- if it fails and starts pulling back, it may be time to look for short positions.
#AGT #LumenCrypto
Since the last post, the overall situation hasn’t changed! The coin broke through several strong support levels and moved higher.
Now it’s hit resistance again. We need to keep a close eye on the situation:
- if it breaks through the marked level, it could climb even higher;
- if it fails and starts pulling back, it may be time to look for short positions.
#AGT #LumenCrypto
1.5k
·
--
🔍 MSCI under the microscope: final list published today
MSCI has decided to exclude companies that hold 50% or more of their assets in crypto from its indexes. Strategy (the largest corporate holder of $BTC) and Metaplanet are among those affected. The final list of companies to be removed will be published on November 11.
The figures cited by analysts:
💸 JPMorgan estimates around $2.8 billion in forced selling and outflows from MSCI indexes
🌊 If FTSE Russell and S&P Dow Jones follow MSCI, outflows could rise to $8–11 billion
👀 Also on the risk list: Sharplink, DeFi Dev Corp, Upexi, Capital B, and others.
What this means: index funds are required to sell the shares, even if they don't want to. This puts pressure on the companies' shares, while the impact on $BTC itself is indirect and depends on market sentiment.
They’re being removed from the index—are you holding or getting out? Tell us in the comments what you think 👇
Not financial advice. The figures are analysts' estimates; the final outcome depends on MSCI's list.
#MSCI #strategy #metaplanet #bitcoin #LumenCrypto
🔍 MSCI under the microscope: final list published today
MSCI has decided to exclude companies that hold 50% or more of their assets in crypto from its indexes. Strategy (the largest corporate holder of $BTC) and Metaplanet are among those affected. The final list of companies to be removed will be published on November 11.
The figures cited by analysts:
💸 JPMorgan estimates around $2.8 billion in forced selling and outflows from MSCI indexes
🌊 If FTSE Russell and S&P Dow Jones follow MSCI, outflows could rise to $8–11 billion
👀 Also on the risk list: Sharplink, DeFi Dev Corp, Upexi, Capital B, and others.
What this means: index funds are required to sell the shares, even if they don't want to. This puts pressure on the companies' shares, while the impact on $BTC itself is indirect and depends on market sentiment.
They’re being removed from the index—are you holding or getting out? Tell us in the comments what you think 👇
Not financial advice. The figures are analysts' estimates; the final outcome depends on MSCI's list.
#MSCI #strategy #metaplanet #bitcoin #LumenCrypto
MSCI has decided to exclude companies that hold 50% or more of their assets in crypto from its indexes. Strategy (the largest corporate holder of $BTC) and Metaplanet are among those affected. The final list of companies to be removed will be published on November 11.
The figures cited by analysts:
💸 JPMorgan estimates around $2.8 billion in forced selling and outflows from MSCI indexes
🌊 If FTSE Russell and S&P Dow Jones follow MSCI, outflows could rise to $8–11 billion
👀 Also on the risk list: Sharplink, DeFi Dev Corp, Upexi, Capital B, and others.
What this means: index funds are required to sell the shares, even if they don't want to. This puts pressure on the companies' shares, while the impact on $BTC itself is indirect and depends on market sentiment.
They’re being removed from the index—are you holding or getting out? Tell us in the comments what you think 👇
Not financial advice. The figures are analysts' estimates; the final outcome depends on MSCI's list.
#MSCI #strategy #metaplanet #bitcoin #LumenCrypto

91
·
--
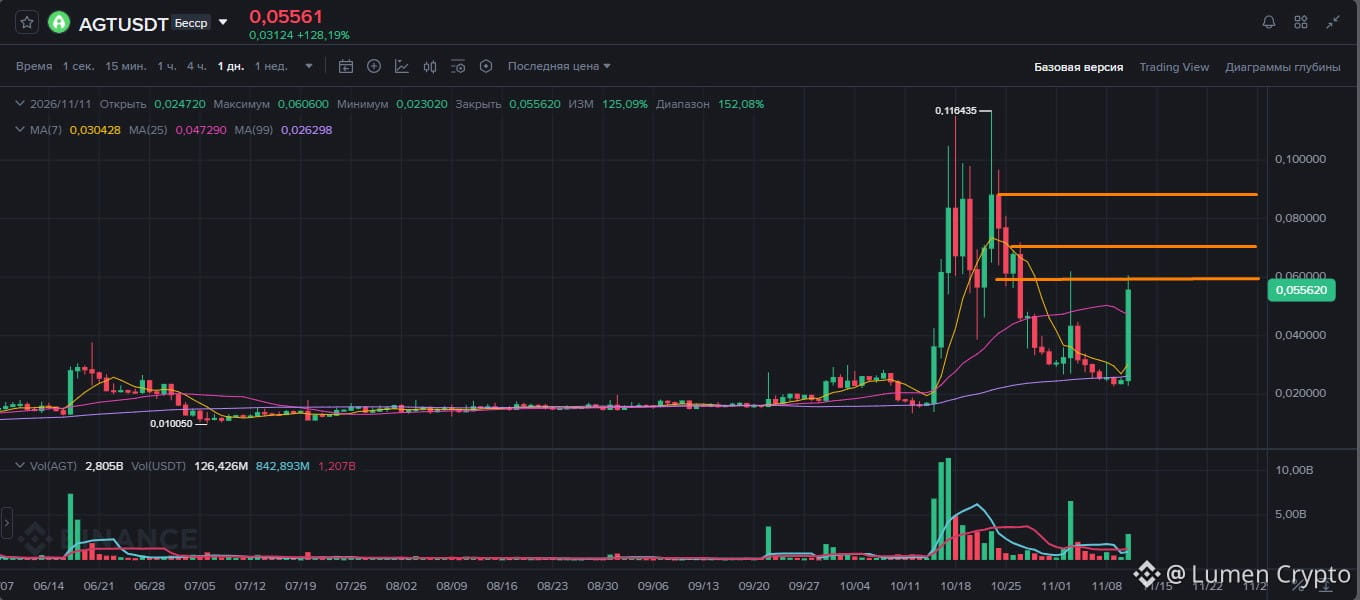
$AGT
After the drop, the coin $AGT rises again 🚀.
Such coins are dangerous for the balance, but if handled carefully from the marked levels with a short stop, then you can catch a short.
Not financial advice!
#AGT #LumenCrypto
$AGT
After the drop, the coin $AGT rises again 🚀.
Such coins are dangerous for the balance, but if handled carefully from the marked levels with a short stop, then you can catch a short.
Not financial advice!
#AGT #LumenCrypto
After the drop, the coin $AGT rises again 🚀.
Such coins are dangerous for the balance, but if handled carefully from the marked levels with a short stop, then you can catch a short.
Not financial advice!
#AGT #LumenCrypto
2
1
2.3k
·
--
Bullish
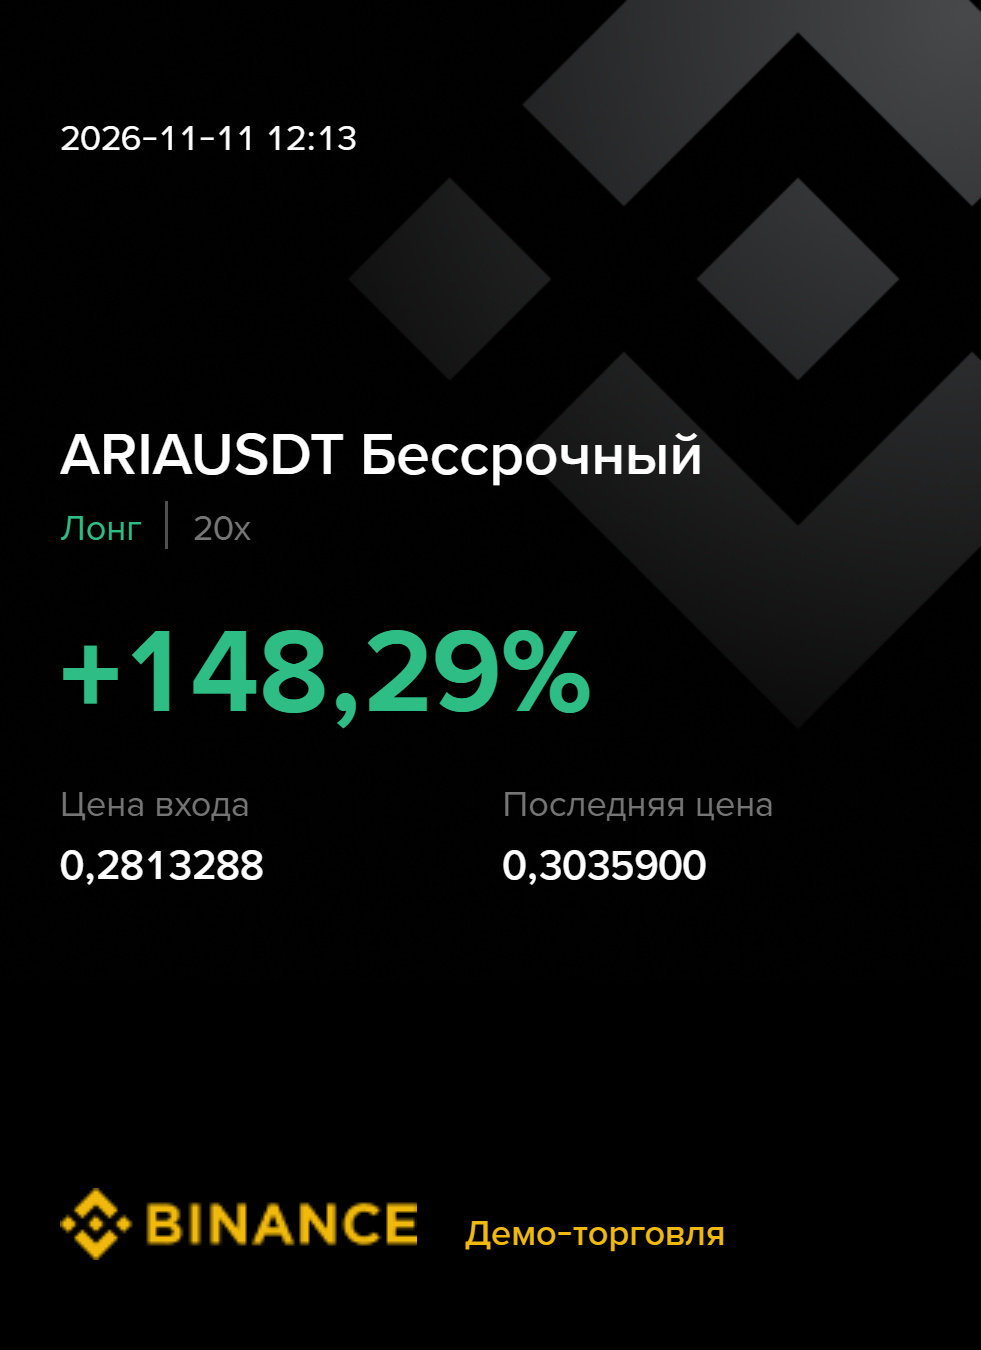
$ARIA
🚀 The rocket is flying to the 🌕 moon!
Taking partial profits, stop at breakeven!
#ARİA #LumenCrypto
$ARIA
🚀 The rocket is flying to the 🌕 moon!
Taking partial profits, stop at breakeven!
#ARİA #LumenCrypto
🚀 The rocket is flying to the 🌕 moon!
Taking partial profits, stop at breakeven!
#ARİA #LumenCrypto
505
Log in to explore more content
Join global crypto users on Binance Square
⚡️ Get latest and useful information about crypto.
💬 Trusted by the world’s largest crypto exchange.
👍 Discover real insights from verified creators.
Email / Phone number
Trending Topics
NvidiaBeatsEstimatesWith$130BQ4Outlook
9,106 views
138 Discussing
Nvidia Beats With $115.8 Billion in Revenue, Guides to $130 Billion and Adds $150 Billion Buyback
Binance News
·42 Likes
·39.3k views
AnthropicIPOPriceCouldExceed$80
15,114 views
128 Discussing
CanNvidia’sDataCenterGrowthContinue?
45,564 views
618 Discussing