CryptoSpotter Official

32K Yt Subs • Trader, Not a News Reporter Called breakouts before influencers even noticed them. No fake hopium. Just charts & cold reality
5 Following
2.1K+ Followers
2.6K+ Liked
Posts
PINNED
·
--
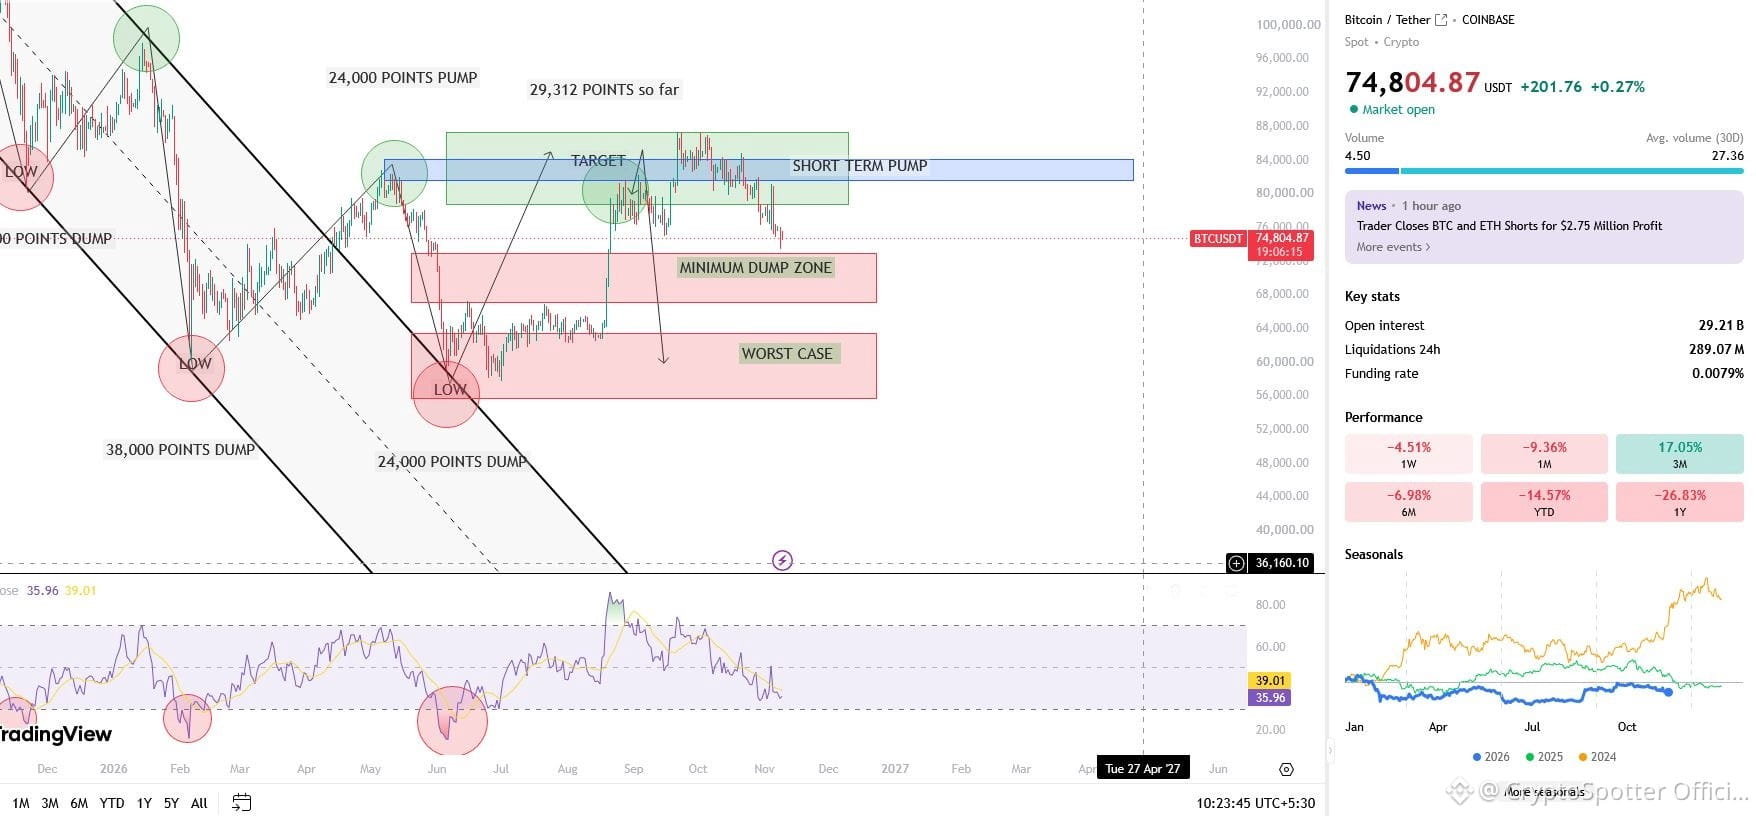
Gm 🌞 As explained in all my previous $BTC charts, based on our mathematical model, Bitcoin has a very high probability of entering our Minimum Dump Zone, which is roughly between $67K and $73K. Let me explain once again why. 👇 Based on our historical 1st Low = 48,000 points 2nd Low = 38,000 points 3rd Low = 24,000 points 4th Low = Ongoing! The estimated 4th Low is around 14,000–20,000 points. Based on this calculation, our next projected BTC drop zone is approximately $67K–$73K. Last night, $BTC dropped as low as $73.5K, meaning we have almost entered this range, or potentially already tapped it. However, I still think we could go slightly deeper into our Minimum Dump Zone. That is the key area I'm watching closely. Our Worst-Case Dump Zone is also possible, but based on our current model, its probability is significantly lower. Now, the BIG question: Why are we putting so much trust in this chart? Because this mathematical model has been tracking the market remarkably well since June. I first shared this chart back in June 👇 https://x.com/CryptoSpotter05/status/2076562578445406218 As you can see, the roadmap has played out very closely to our projections so far. That's exactly why we're giving this chart so much weight in our current $BTC outlook. So #Bitcoin might bounce back from either of these two zone, But high probability is From the Minimum Dump zone.. Remember, this is a probability-based model, not a Financial advice🎯 Follow @Cryptospotter1505 #bitcoin #BitcoinDunyamiz
Gm 🌞

As explained in all my previous $BTC charts, based on our mathematical model, Bitcoin has a very high probability of entering our Minimum Dump Zone, which is roughly between $67K and $73K.

Let me explain once again why. 👇

Based on our historical

1st Low = 48,000 points
2nd Low = 38,000 points
3rd Low = 24,000 points
4th Low = Ongoing!
The estimated 4th Low is around 14,000–20,000 points.
Based on this calculation, our next projected BTC drop zone is approximately $67K–$73K.
Last night, $BTC dropped as low as $73.5K, meaning we have almost entered this range, or potentially already tapped it.

However, I still think we could go slightly deeper into our Minimum Dump Zone. That is the key area I'm watching closely.

Our Worst-Case Dump Zone is also possible, but based on our current model, its probability is significantly lower.

Now, the BIG question: Why are we putting so much trust in this chart?

Because this mathematical model has been tracking the market remarkably well since June.

I first shared this chart back in June 👇
https://x.com/CryptoSpotter05/status/2076562578445406218

As you can see, the roadmap has played out very closely to our projections so far.
That's exactly why we're giving this chart so much weight in our current $BTC outlook.
So #Bitcoin might bounce back from either of these two zone, But high probability is From
the Minimum Dump zone..

Remember, this is a probability-based model, not a Financial advice🎯

Follow @CryptoSpotter Official
#bitcoin #BitcoinDunyamiz
CryptoSpotter Official
·
--
GM 😎

For everyone asking about the short-term $BTC update:

$BTC still has some probability of tapping the
$82K–$83K range, or at least getting closer to it.
However, I am personally not chasing this move.

I had a long position open on $BTC , which I had shared with our VIP Group. Unfortunately, it got stopped out at breakeven.
So, I am not opening any new positions for now. I'll simply wait for the right opportunity to strike.

Patience is key. I'd rather miss a move than force a trade. 🎯

#bitcoin #BTC #crypto
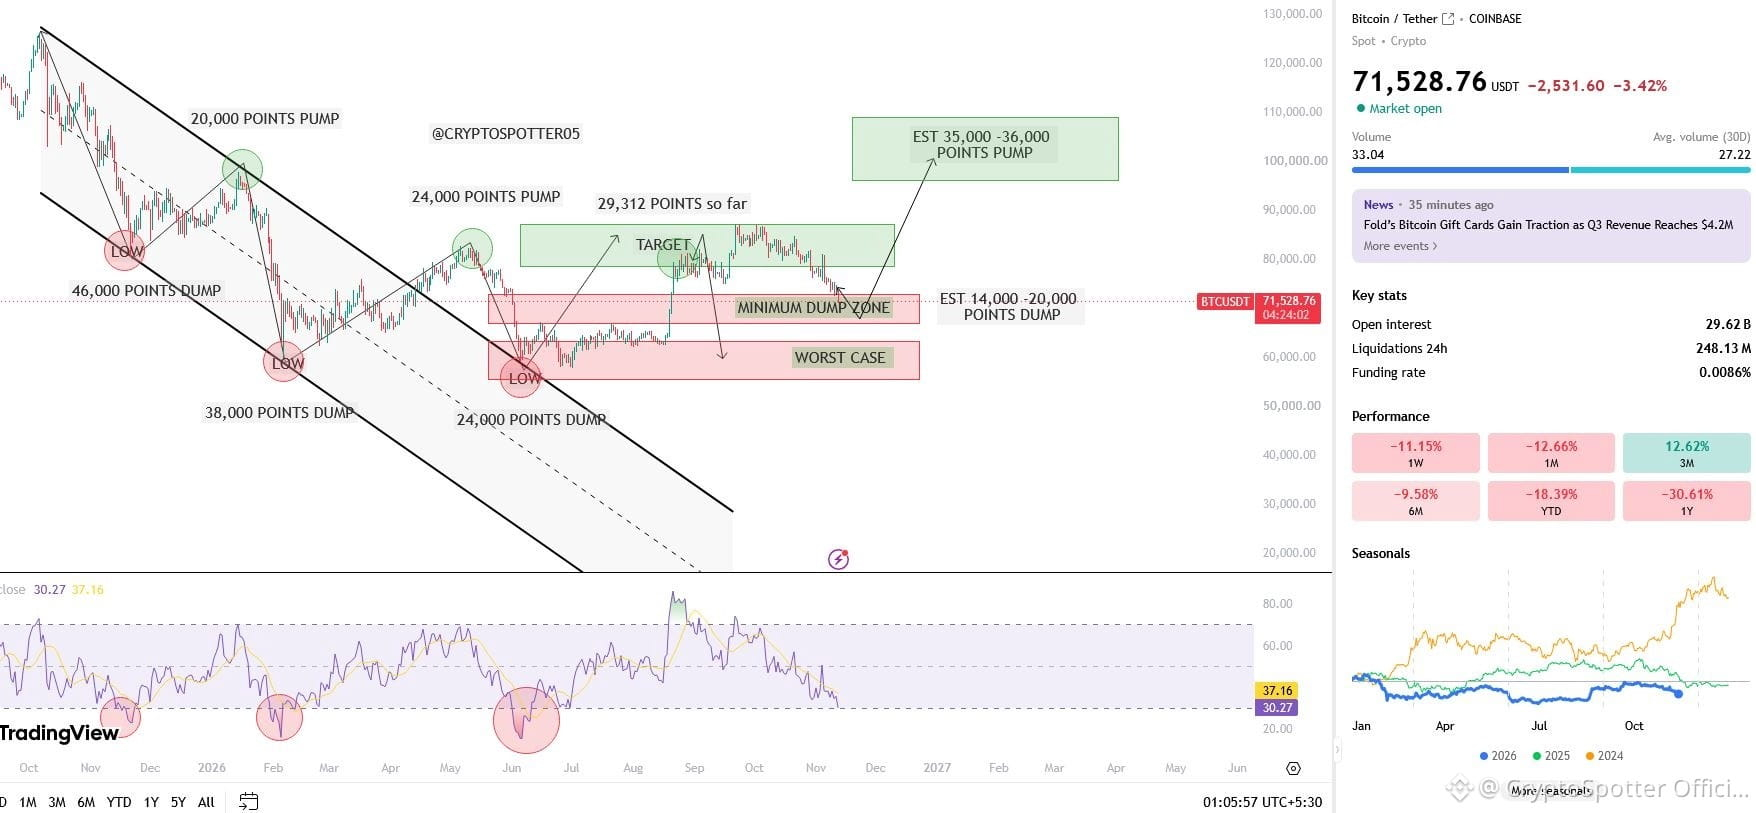
$BTC UPDATE 🚨 A Lot Of Big Accounts Who Were Previously Bullish And Calling For A Bull Run Have Suddenly Turned Bearish And Are Now Calling For $BTC To Drop To $40K. 😅 I Can't Comment On Their Analysis, But You Guys Are Smart Enough To Understand What's Happening. 😜 Anyways, According To Our Points-Based Model, Which Has Been Working Since June 2026, We Have Successfully Predicted The Local Highs And Lows So Far, With 95% Accuracy. As You Can See, We Have Now Tapped Our MINIMUM DUMP ZONE. And According To This Points-Based Model, This Is A Potential Reversal Zone For $BTC. However, Just To Be On The Safe Side, I Have Also Shared A WORST-CASE SCENARIO, Which You Can See In The Image. BUT WHY ARE SO MANY BIG ACCOUNTS, INCLUDING SOME OF THE BEST TRADERS WHO AREN'T EVEN FAMOUS, PREDICTING A DROP TO $40K? The Reason Is Quite Simple. They Are Using Historical Data From Previous Cycles To Predict The Current $BTC Move. As Per Cycle Theory, Which I Have Already Explained Earlier, Which shows,This Cycle Could See A 65%–72% Crash From Its All-Time High. However, So Far, We Have Only Experienced A 53.61% Drawdown. That's Exactly Why Many Are Suggesting That #BITCOIN Could Drop As Low As $40K. SO WHAT AM I BETTING ON? My Highest Probability Scenario Remains Our MINIMUM DUMP ZONE, But sometimes things can go south so The Worst-Case Scenario Shared In The Image is also Possible. And According To My Model, The Probability Of IT Crashing Below $40K Is Less Than 5%, We Also Have Data To Back Up This Claim, Which You Can Check Here 👇 https://x.com/CryptoSpotter05/status/2102687408471028196 Now, I'm not as big or as smart as the major accounts and professional traders out there. Some of them are far more experienced than I am and have spent their entire lives doing this. I'm just sharing my 2 cents based on my own analysis and the data I have. 🙂 As Always, Nothing Is Guaranteed. We Are Working With Probabilities, Not Certainties. Let's See How This Plays Out. 👀 #BITCOIN #bitcoin #crypto
$BTC UPDATE 🚨

A Lot Of Big Accounts Who Were Previously Bullish And Calling For A Bull Run Have Suddenly Turned Bearish And Are Now Calling For $BTC To Drop To $40K. 😅
I Can't Comment On Their Analysis, But You Guys Are Smart Enough To Understand What's Happening. 😜

Anyways,
According To Our Points-Based Model, Which Has Been Working Since June 2026, We Have Successfully Predicted The Local Highs And Lows So Far, With 95% Accuracy.

As You Can See, We Have Now Tapped Our MINIMUM DUMP ZONE.
And According To This Points-Based Model, This Is A Potential Reversal Zone For $BTC .

However, Just To Be On The Safe Side, I Have Also Shared A WORST-CASE SCENARIO, Which You Can See In The Image.

BUT WHY ARE SO MANY BIG ACCOUNTS, INCLUDING SOME OF THE BEST TRADERS WHO AREN'T EVEN FAMOUS, PREDICTING A DROP TO $40K?
The Reason Is Quite Simple.

They Are Using Historical Data From Previous Cycles To Predict The Current $BTC Move.
As Per Cycle Theory, Which I Have Already Explained Earlier, Which shows,This Cycle Could See A 65%–72% Crash From Its All-Time High.
However, So Far, We Have Only Experienced A 53.61% Drawdown.
That's Exactly Why Many Are Suggesting That #BITCOIN Could Drop As Low As $40K.

SO WHAT AM I BETTING ON?

My Highest Probability Scenario Remains Our MINIMUM DUMP ZONE, But sometimes things can go south so The Worst-Case Scenario Shared In The Image is also Possible.
And According To My Model, The Probability Of IT Crashing Below $40K Is Less Than 5%,

We Also Have Data To Back Up This Claim, Which You Can Check Here 👇
https://x.com/CryptoSpotter05/status/2102687408471028196

Now, I'm not as big or as smart as the major accounts and professional traders out there. Some of them are far more experienced than I am and have spent their entire lives doing this.
I'm just sharing my 2 cents based on my own analysis and the data I have. 🙂

As Always, Nothing Is Guaranteed. We Are Working With Probabilities, Not Certainties.

Let's See How This Plays Out. 👀

#BITCOIN #bitcoin #crypto
CryptoSpotter Official
·
--
My $BTC Plan is Simple 🚨
I have already explained that in my previous Video,
If You Missed it, You can go ahead and watch it on my YT OR X Account!

But let me explain, Once again.
As per $BTC One Year Data,
1st Pump 20,000 points
2nd Pump 24,000 points,
3rd Pump estimation was 28,000 point,
But We got roughly 29k Points Pump,
Which means the Upside move as per the 1 year data is almost Completed or closer to completion.

What's Next?
Well as per this data, Next Move Should be Downside.
1st Low = 48,000 points.
2nd Low = 38,000 points.
3rd Low = 24,000 points.
4th Low? = Pending

This Low is estimated to be around 14,000- 20,000 points.
And Based on that the next Drop is estimated to be around 67k to 73k.

However based on the chart's The Weekly Support sits anywhere between 55k to 64k, Which Should be the worst case.
So based on this analysis i personally don't the $BTC Will now dump below 40k or even 50k.
I have given you the minimum and max Dump zone,
Assuming 87k to be the local top.

So let's see how this Plays out!
Let me know your thoughts in the comment box below.

Give me a Follow @CryptoSpotter Official

#bitcoin #BitcoinDunyamiz #BitcoinETFs
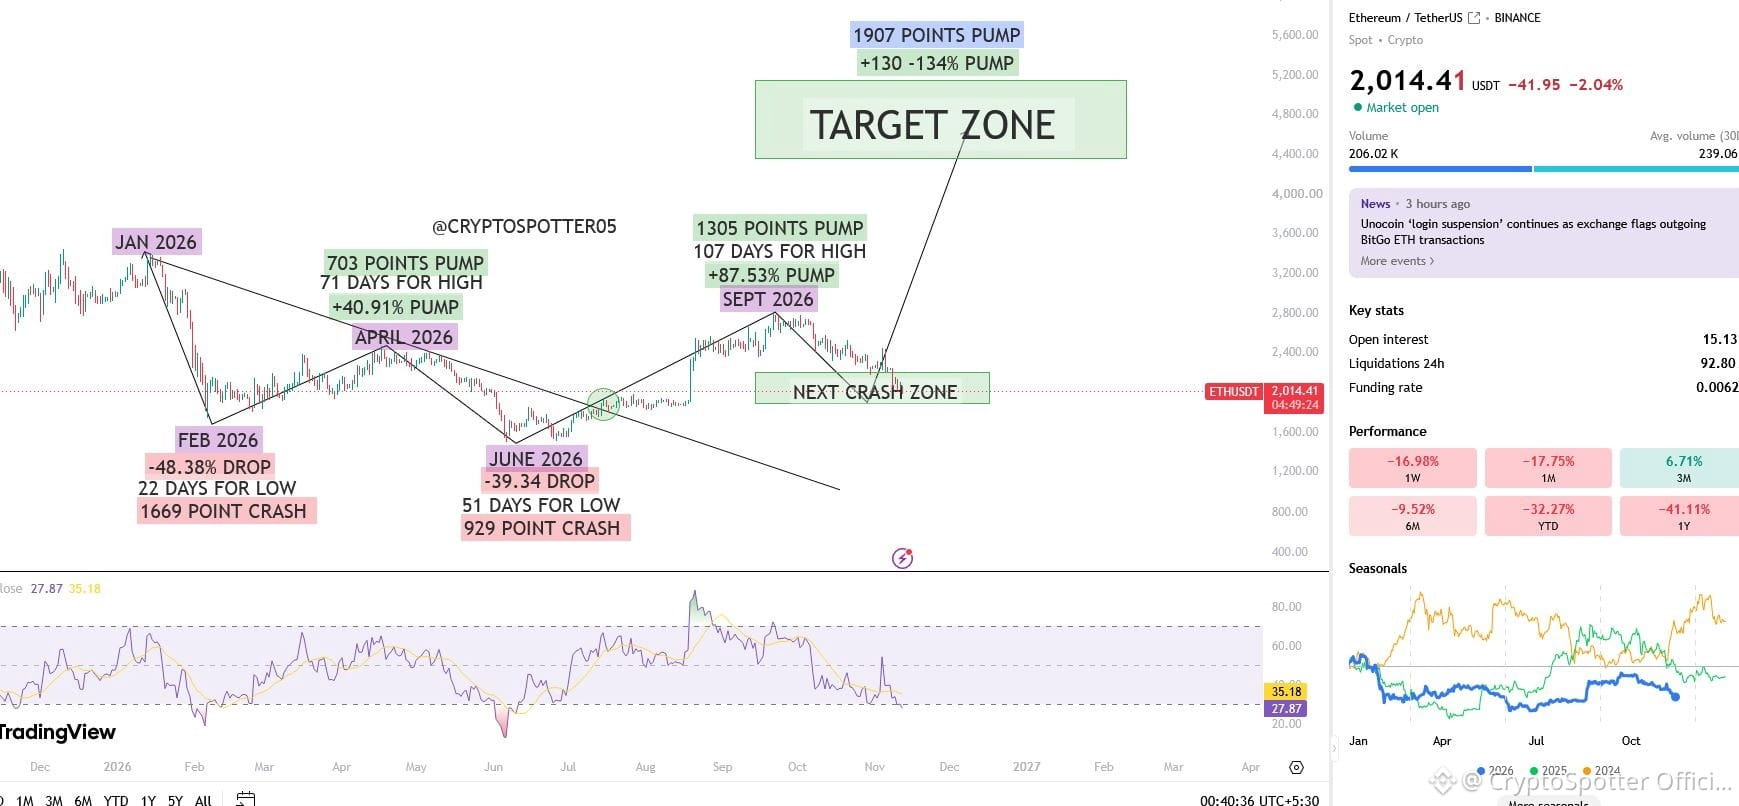
Most Top Accounts Are Now Claiming That $ETH Could Drop As Low As $1,000. But According To Our Points-Based Model, The Probability Of $ETH Dropping Below $1,000 Is Very Low. Interestingly, This Model Also Suggests That There Is A Very High Probability That The $ETH Bottom May Have Already Been Formed In June. But Why Are We Trusting This Model? Because We Have Already Successfully Predicted The Crash Into Our DROP ZONE Using This Same Model, Back When Everyone Was Shouting "BREAKOUT." So Far, The Model Has Played Out Extremely Well, And Its Latest Signals Suggest That We Are Now Getting Very Close To The Bottom. However, I Have Also Shared A Few Additional Strategies In Our Private Group, Explaining The Worst-Case Scenario In Case This Model Fails. Unfortunately, I Cannot Share Those Details Publicly. Overall, I Am Still Betting On This Model. But Remember, Nothing Is Guaranteed. Everything Is Based On Probability, Not Certainty. Let's See How This Plays Out. 👀 #ETH #ETHETFsApproved
Most Top Accounts Are Now Claiming That $ETH
Could Drop As Low As $1,000.
But According To Our Points-Based Model, The Probability Of $ETH Dropping Below $1,000 Is Very Low.

Interestingly, This Model Also Suggests That There Is A Very High Probability That The $ETH Bottom May Have Already Been Formed In June.

But Why Are We Trusting This Model?
Because We Have Already Successfully Predicted The Crash Into Our DROP ZONE Using This Same Model, Back When Everyone Was Shouting "BREAKOUT."

So Far, The Model Has Played Out Extremely Well, And Its Latest Signals Suggest That We Are Now Getting Very Close To The Bottom.
However, I Have Also Shared A Few Additional Strategies In Our Private Group, Explaining The Worst-Case Scenario In Case This Model Fails. Unfortunately, I Cannot Share Those Details Publicly.

Overall, I Am Still Betting On This Model.
But Remember, Nothing Is Guaranteed. Everything Is Based On Probability, Not Certainty.

Let's See How This Plays Out. 👀

#ETH #ETHETFsApproved
CryptoSpotter Official
·
--
When $ETH was trading around $2,700–$2,800, I uploaded a video in late September explaining why I expected another dump, including the mathematics, logic, and an estimated timeline. Today, $ETH
has entered that drop zone almost perfectly.,
And this is not the only one, I uploaded many videos and majority of my videos have perfectly hit the drop zone Targets..

But my video barely managed 400 views.

Meanwhile, some random video claiming $ETH
would hit $10,000 gets 100K views.

This is the reality of social media. Nobody wants honest analysis backed by data and logic. Everyone wants unrealistic targets, fake hopium, and moonboy predictions.

And the sad part? The clowns selling these dreams often get more support than people putting in the effort to deliver honest analysis, And I've even seen top exchanges promoting these so-called influencers, giving them awards and recognition. LOL. But that's the reality of this industry. Apparently, views matter more than credibility, and hype matters more than honest analysis.

Apparently, telling people what they WANT to hear gets you further than telling them what they NEED to hear. 🥲

#eth #ETH #ETH🔥🔥🔥🔥🔥🔥
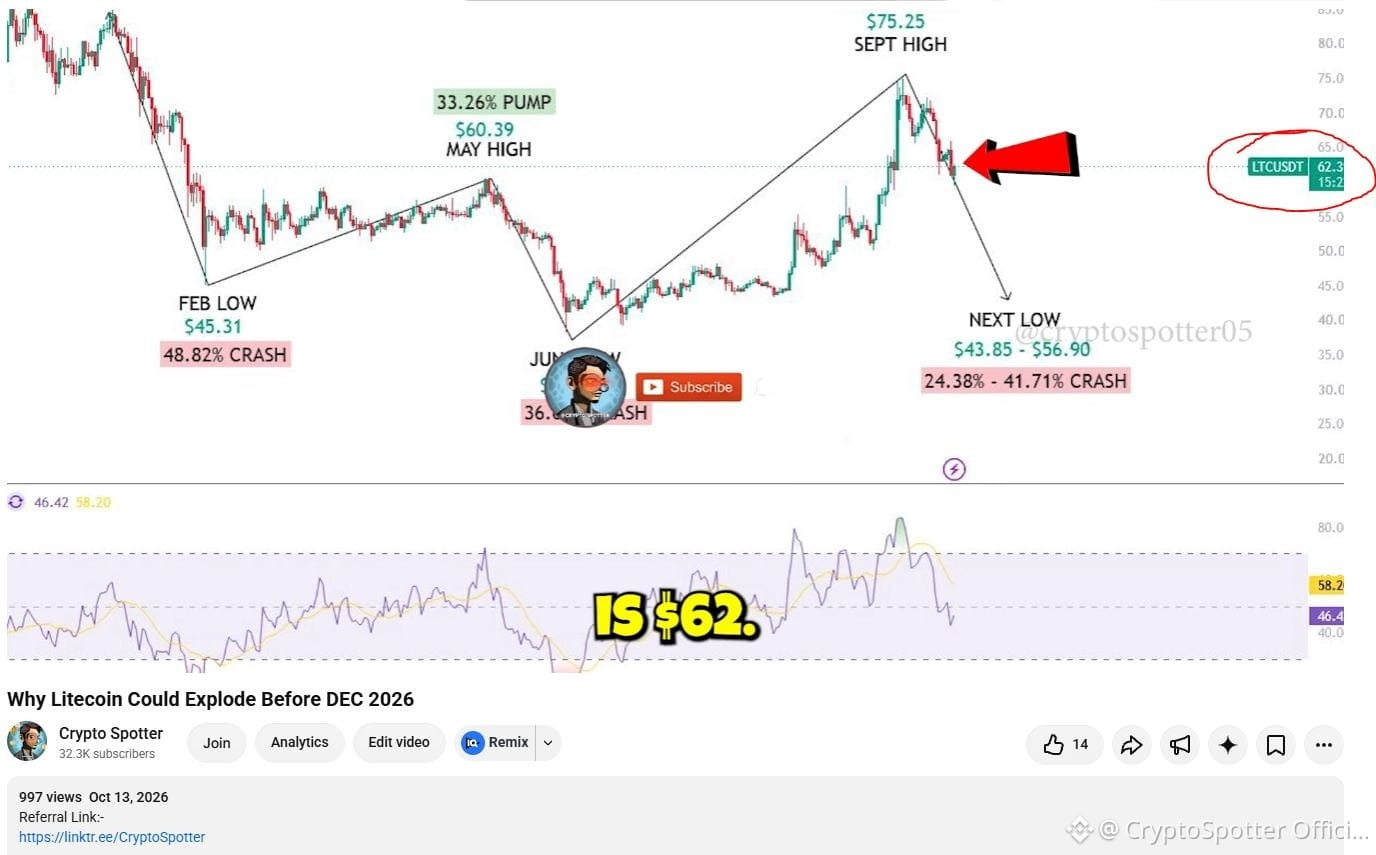
What's Next for $DOGE ? 🚨 In this video, I've tried to explain the most probable scenarios for #Dogecoin based on our mathematical analysis. Can $DOGE dump towards $0.03, or is that scenario off the table? Will it create a cycle bottom in 2026, or are we still far from it? This is a short-term scenario analysis covering what could happen next. Watch the full video here Follow @Cryptospotter1505 #doge #DOGE #Dogecoin‬⁩
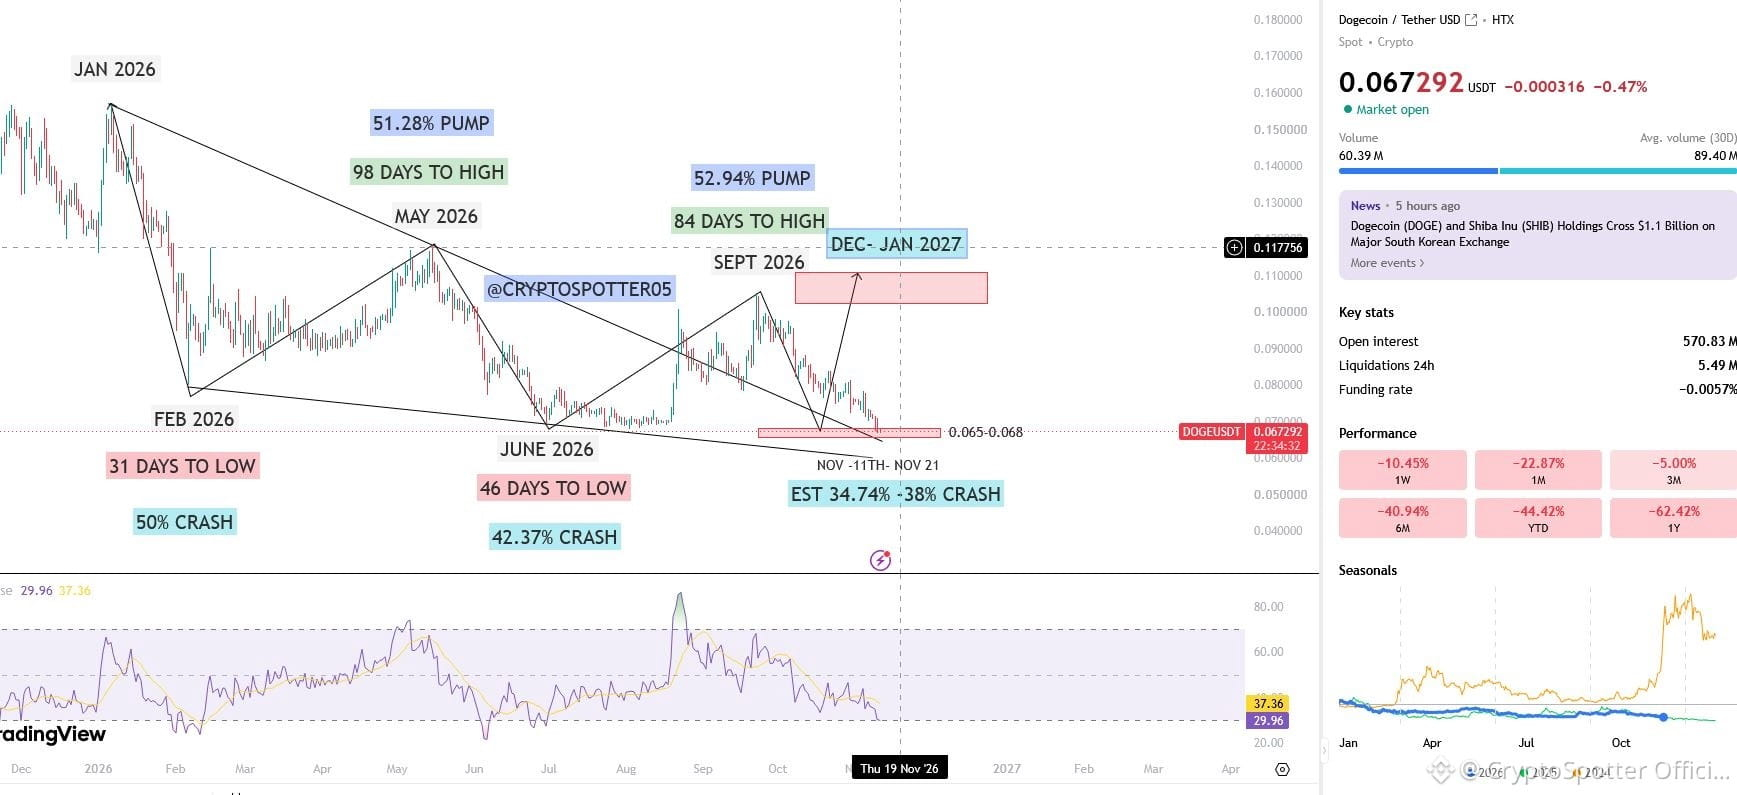
What's Next for $DOGE ? 🚨

In this video, I've tried to explain the most probable scenarios for #Dogecoin based on our mathematical analysis.

Can $DOGE dump towards $0.03, or is that scenario off the table?
Will it create a cycle bottom in 2026, or are we still far from it?

This is a short-term scenario analysis covering what could happen next.

Watch the full video here

Follow @CryptoSpotter Official

#doge #DOGE #Dogecoin‬⁩
I PREDICTED this move for $DOGE on September 24th in one of my YouTube videos. 🚨 Like always, many of you missed the video… and unfortunately, missed a great opportunity as well. This is just ONE of the many setups I've shared that have successfully hit their targets. I still remember when this video barely got 300–400 views at start, while random videos claiming $DOGE would hit $1 were getting thousands of views. Nobody seems to like realistic analysis backed by facts and math. Everyone just wants moonboy targets and unrealistic expectations. But here we are, barely 2 months later, and we've finally hit our target. 😏 MATH DOESN'T LIE! 😜 Follow your boy @Cryptospotter1505 #doge #Dogecoin‬⁩
I PREDICTED this move for $DOGE on September 24th in one of my YouTube videos. 🚨

Like always, many of you missed the video… and unfortunately, missed a great opportunity as well.
This is just ONE of the many setups I've shared that have successfully hit their targets.

I still remember when this video barely got 300–400 views at start, while random videos claiming $DOGE would hit $1 were getting thousands of views.

Nobody seems to like realistic analysis backed by facts and math. Everyone just wants moonboy targets and unrealistic expectations.
But here we are, barely 2 months later, and we've finally hit our target. 😏

MATH DOESN'T LIE! 😜

Follow your boy @CryptoSpotter Official

#doge #Dogecoin‬⁩
CryptoSpotter Official
·
--
$DOGE UPDATE! 🚨

I uploaded my $DOGE
video on September 24, where I tried my best to identify the exact Drop Zone using charts + math.
In fact, I also shared a rough timeline
for when we could expect the drop.

And as you can see, as we get closer to
our projected timeline, $DOGE
is also getting closer to our target zone. 😅

This is exactly why I focus on MATH!

Let's see how the roadmap plays out! 🎯

Follow @CryptoSpotter Official

#DOGE #Dogecoin‬⁩
$ZEC CHART REQUEST 🚨 Currently, $ZEC is trading near the higher end of its price range. I believe the beginning of Q1 2027 could be bullish for $ZEC, with a possibility of retesting its recent high or moving closer to that zone. However, on the longer timeframe, I expect a significant portion of the recent pump to be retraced, with the price potentially dropping back towards the levels from which this rally started. Especially post-Q1 2027, I believe the downside risk could increase. Personally, I'm avoiding $ZEC at these levels. I'm not saying this is a bad project. My concern is the risk-to-reward ratio. I believe there are other projects where I could potentially generate better returns with a more favourable risk-to-reward setup. Good project doesn't always mean a good investment at every price. 😅 #zcash #ZECUSDT
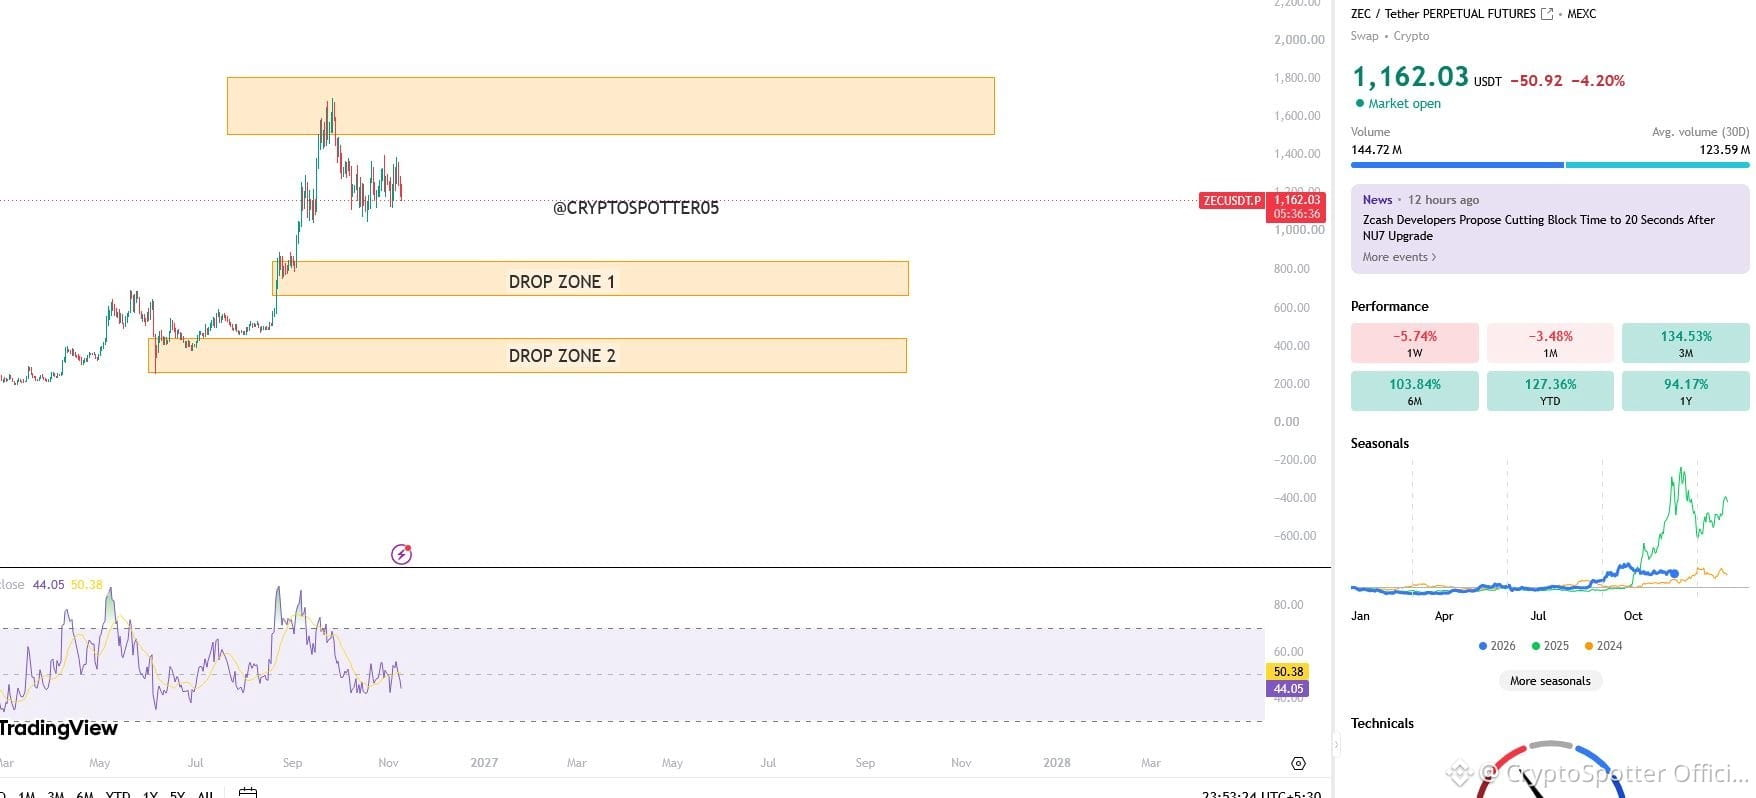
$ZEC CHART REQUEST 🚨

Currently, $ZEC is trading near the higher end of its price range.

I believe the beginning of Q1 2027 could be bullish for $ZEC , with a possibility of retesting its recent high or moving closer to that zone.
However, on the longer timeframe, I expect a significant portion of the recent pump to be retraced, with the price potentially dropping back towards the levels from which this rally started.

Especially post-Q1 2027, I believe the downside risk could increase.

Personally, I'm avoiding $ZEC at these levels.
I'm not saying this is a bad project. My concern is the risk-to-reward ratio. I believe there are other projects where I could potentially generate better returns with a more favourable risk-to-reward setup.

Good project doesn't always mean a good investment at every price. 😅

#zcash #ZECUSDT
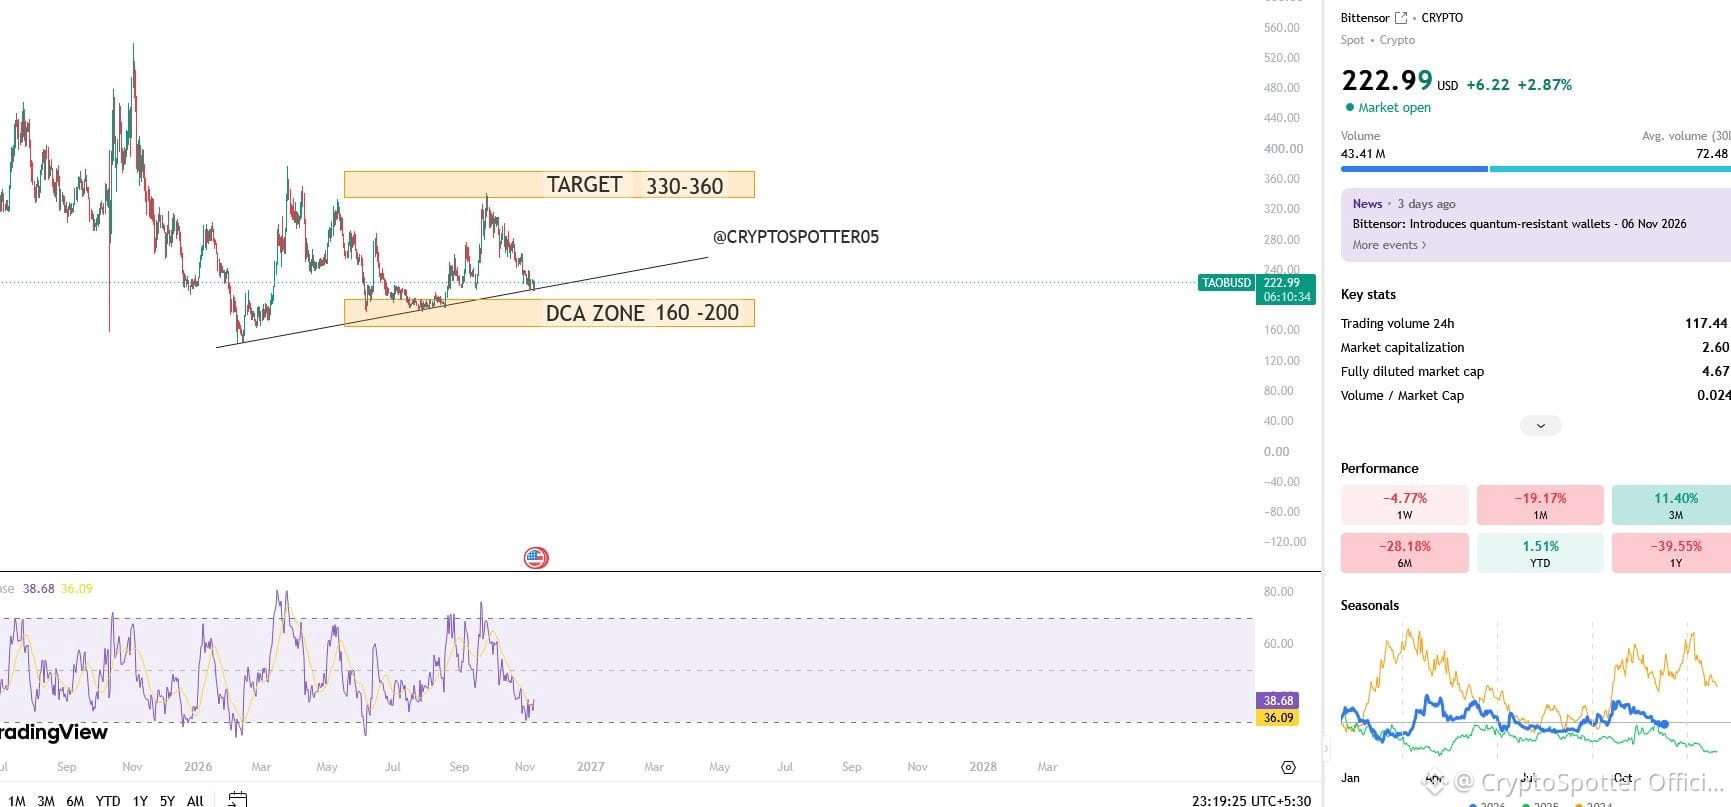
$TAO CHART REQUEST 🚨 I am personally not Following this Project Much, But here is a rough range Play FOR Q1 2027.. #TAO #TAOTrading
$TAO CHART REQUEST 🚨
I am personally not Following this Project Much,
But here is a rough range Play FOR Q1 2027..

#TAO #TAOTrading
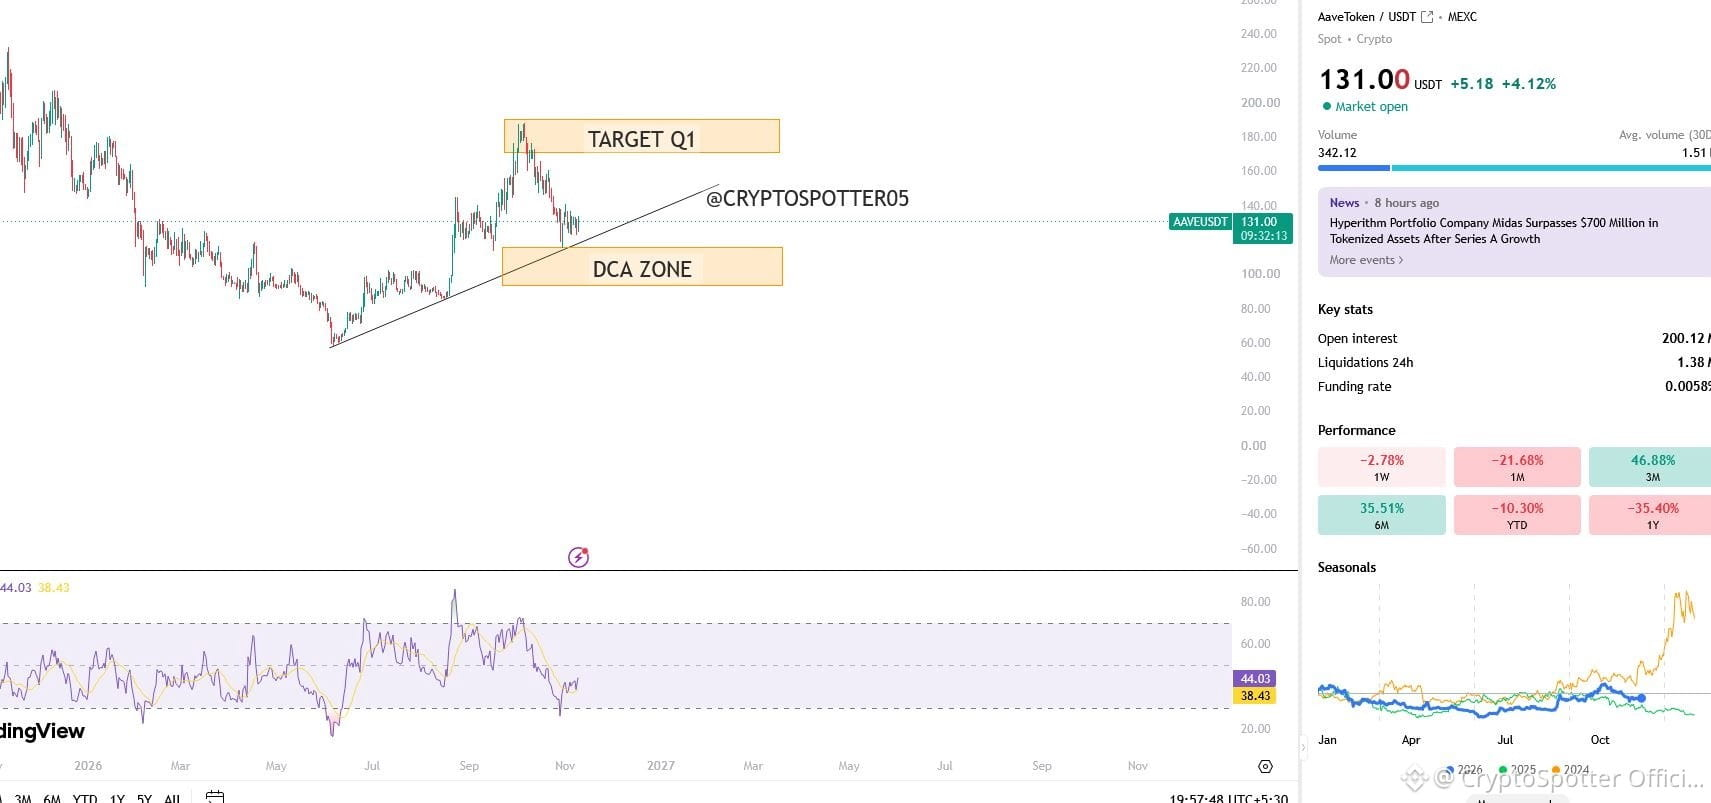
$AAVE CHART REQUEST 🚨 I am personally not following this project, But since this is a chart request i am giving you a rough outlook. As per the Current Chart i don't see any strong Move until the next year 2027. The Key buying zone should be our DCA Zone, And mostly by this year end we should tap that zone once. Range is around $93 -$115. And by Q1 we can tap the 165 to 170 range Target. Follow @Cryptospotter1505 #aave #AAVE
$AAVE CHART REQUEST 🚨
I am personally not following this project,
But since this is a chart request i am giving you a rough outlook.
As per the Current Chart i don't see any strong Move until the next year 2027.
The Key buying zone should be our DCA Zone,
And mostly by this year end we should tap that zone once. Range is around $93 -$115.
And by Q1 we can tap the 165 to 170 range Target.

Follow @CryptoSpotter Official

#aave #AAVE
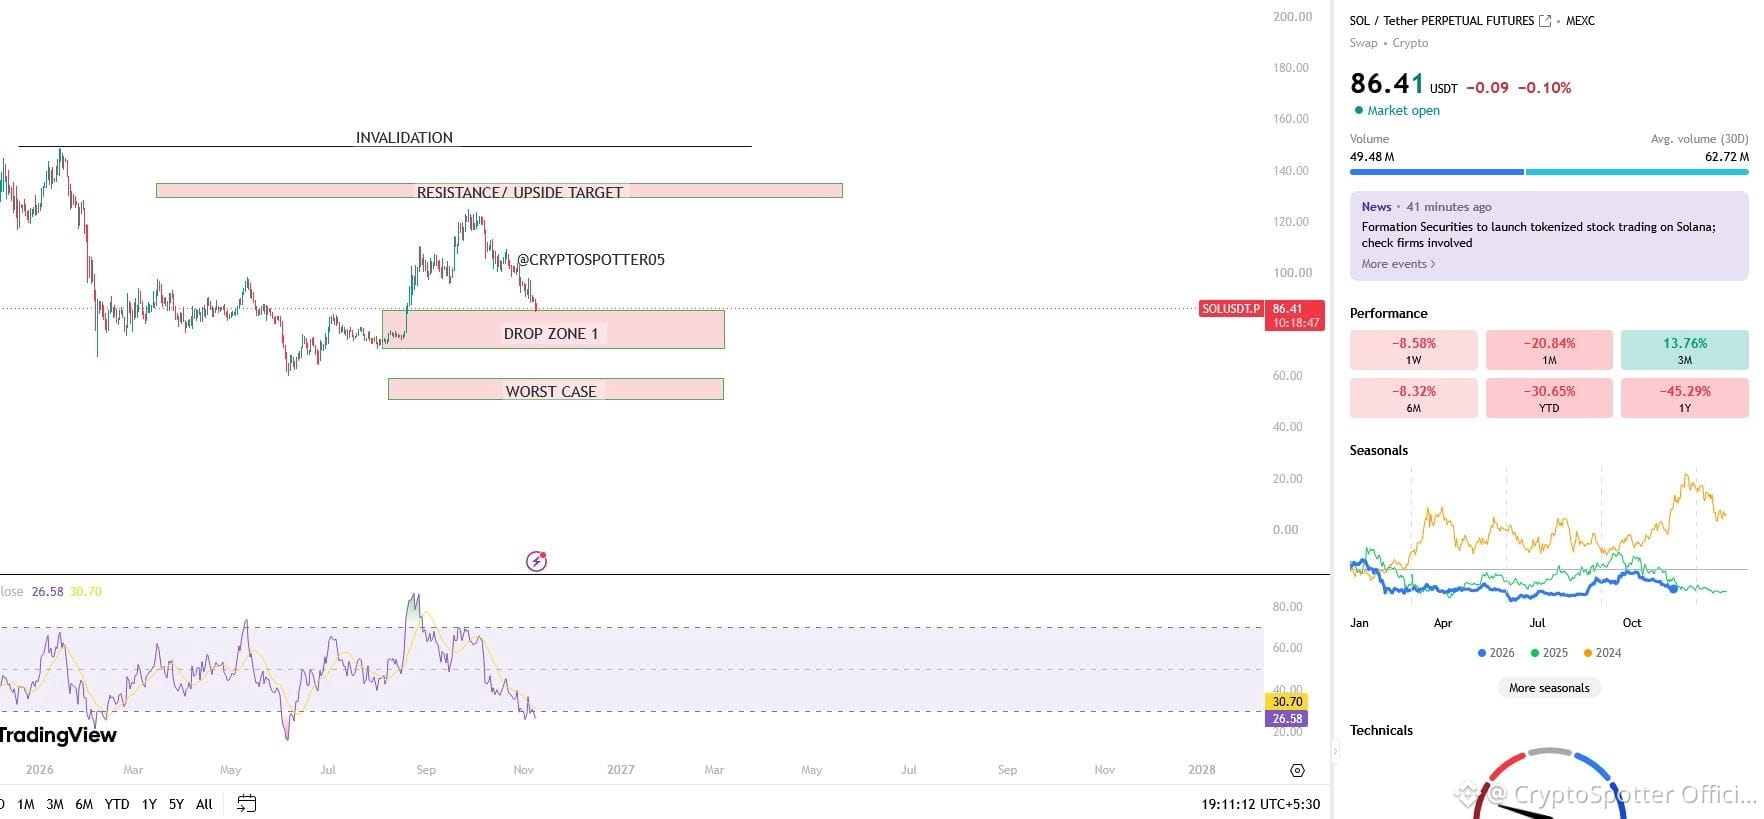
$SOL UPDATE 🚨 Today we have Tapped our DROP Target 1. Now from the Drop zone 1, We could get a dead cat bounce, But i am confident that it will Drop again and reach closer to the worst case scenario in few weeks or next Month. When to buy exactly? I will update when the time comes, Give me a follow and Switch on the notifications.. #solana #sol
$SOL UPDATE 🚨
Today we have Tapped our DROP Target 1.
Now from the Drop zone 1, We could get a dead cat bounce, But i am confident that it will Drop again and reach closer to the worst case scenario
in few weeks or next Month.

When to buy exactly?
I will update when the time comes,
Give me a follow and Switch on the notifications..

#solana #sol
CryptoSpotter Official
·
--
$SOL CHART REQUEST 🚨
This is my range Play Setup,
I know, A Lot of you guys have already started celebrating the bull run, But in my humble opinion,
As long as $SOL is below the invalidation Point.
It has a very high probability of a crash in the coming few weeks or so.
I have given Two Crash Targets.
The First one has higher probability but the worst case is also Possible.
And the Short Term Upside Target
is the resistance zone.
I know A lot of you guy's wont like to hear this , But i personally think Nov and Dec Will not be great months for #Solana, So keep an eye on these zones and invalidation point, My job is to Simply alert you,
Rest is your decision. 😉

Follow @CryptoSpotter Official

#solana #sol #sol板块
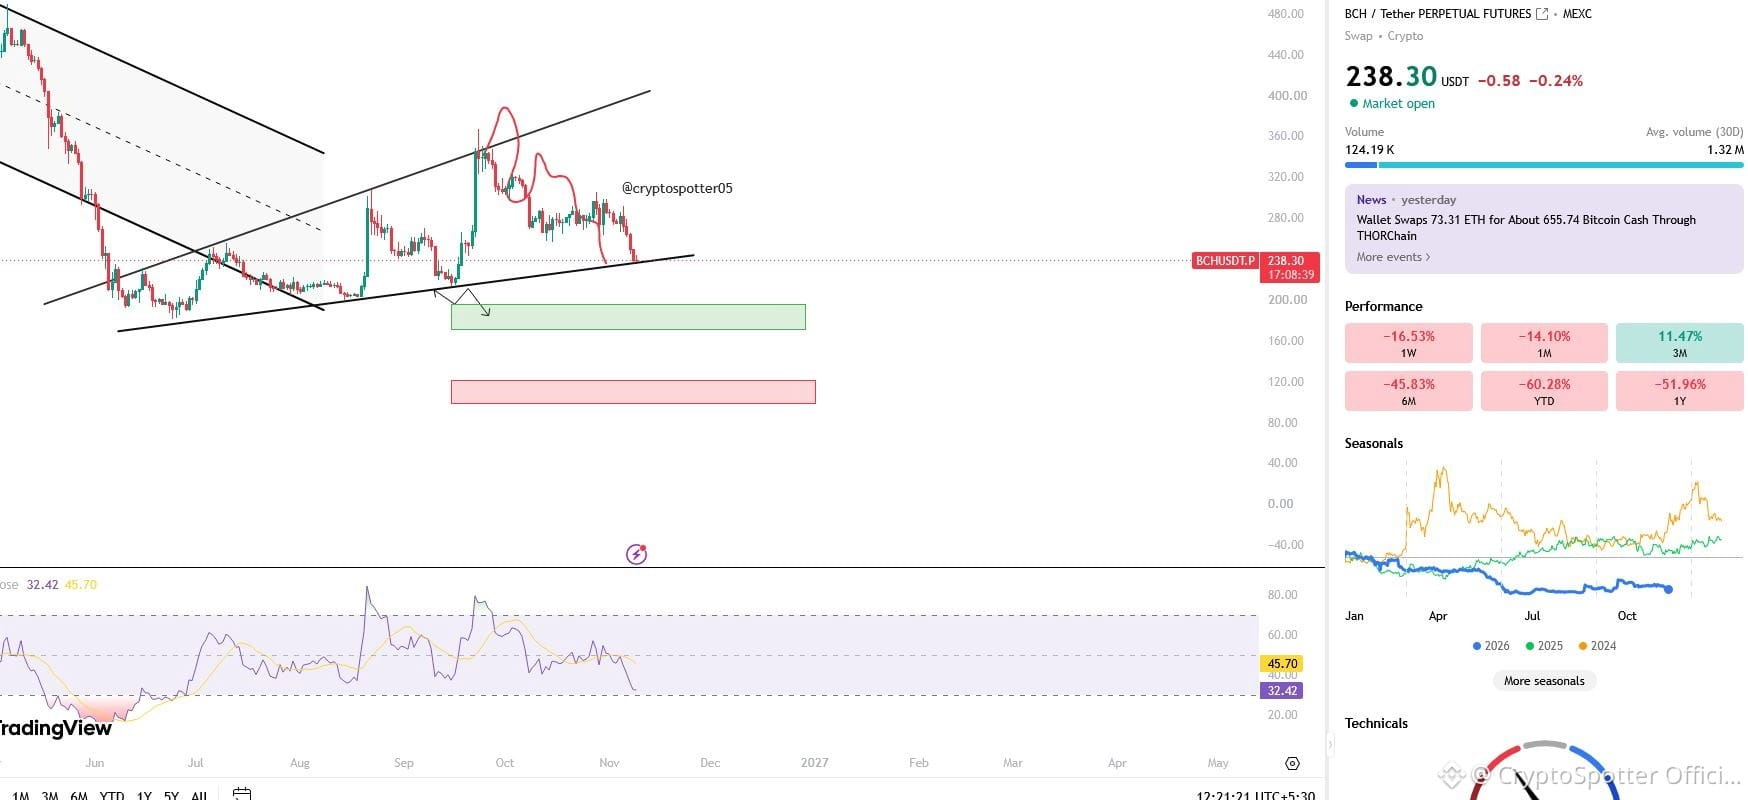
$BCH UPDATE🚨 That's what I call a PERFECT SETUP! 😅 Unfortunately, many of you missed this one because the market was flooded with bullish sentiment and FOMO. I warned about this scenario almost 3 months ago, but since I still have a relatively small following, not everyone took the warning seriously. And honestly, that's understandable. But you can check the BEFORE vs. AFTER charts and judge the results for yourself. 👇 All I'm trying to do is share data-driven analysis and help people navigate the market using math and probabilities, not blind predictions. Now, help me take this account from 4K to 100K followers! 😜 If my analysis adds value, a follow and repost would mean a lot.❤️ Follow @Cryptospotter1505 #BCH #BitcoinCash #crypto
$BCH UPDATE🚨
That's what I call a PERFECT SETUP! 😅
Unfortunately, many of you missed this one because the market was flooded with bullish sentiment and FOMO. I warned about this scenario almost 3 months ago, but since I still have a relatively small following, not everyone took the warning seriously. And honestly, that's understandable. But you can check the BEFORE vs. AFTER charts and judge the results for yourself.
👇
All I'm trying to do is share data-driven analysis and help people navigate the market using math and probabilities, not blind predictions. Now, help me take this account from 4K to 100K followers! 😜
If my analysis adds value,
a follow and repost would mean a lot.❤️

Follow @CryptoSpotter Official

#BCH #BitcoinCash #crypto
CryptoSpotter Official
·
--
$BCH UPDATE 🚨⬇️
Expecting something like this!

Follow @CryptoSpotter Official

#bitcoincash #BCH
CryptoSpotter Official
·
--
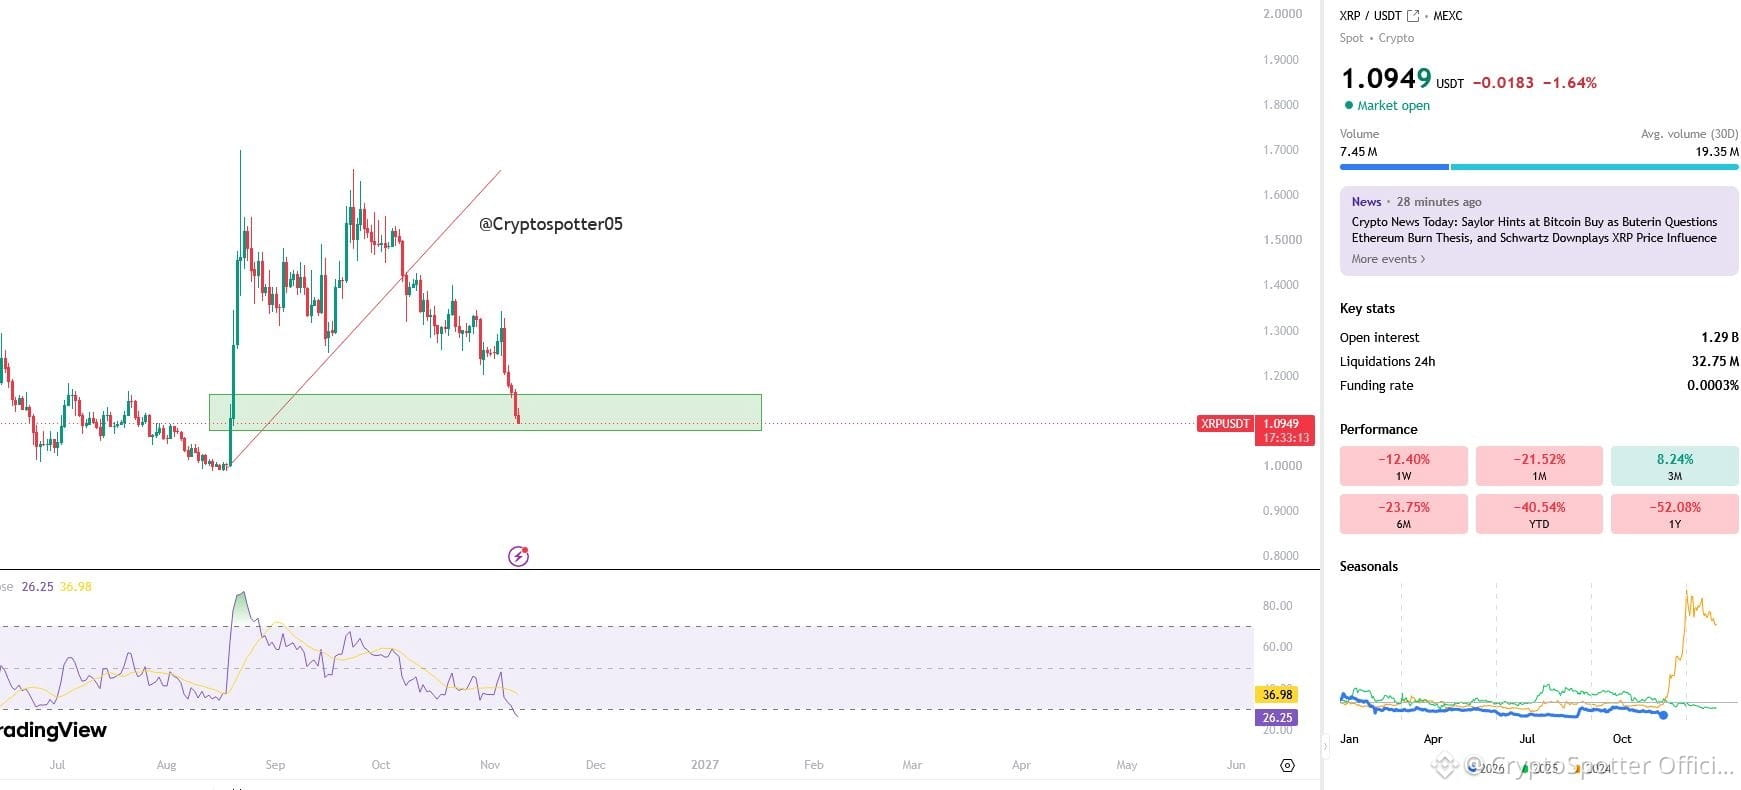
$XRP Chart Request 🚨

This is where i think $XRP Will Drop Next.

#XRP #Xrp🔥🔥
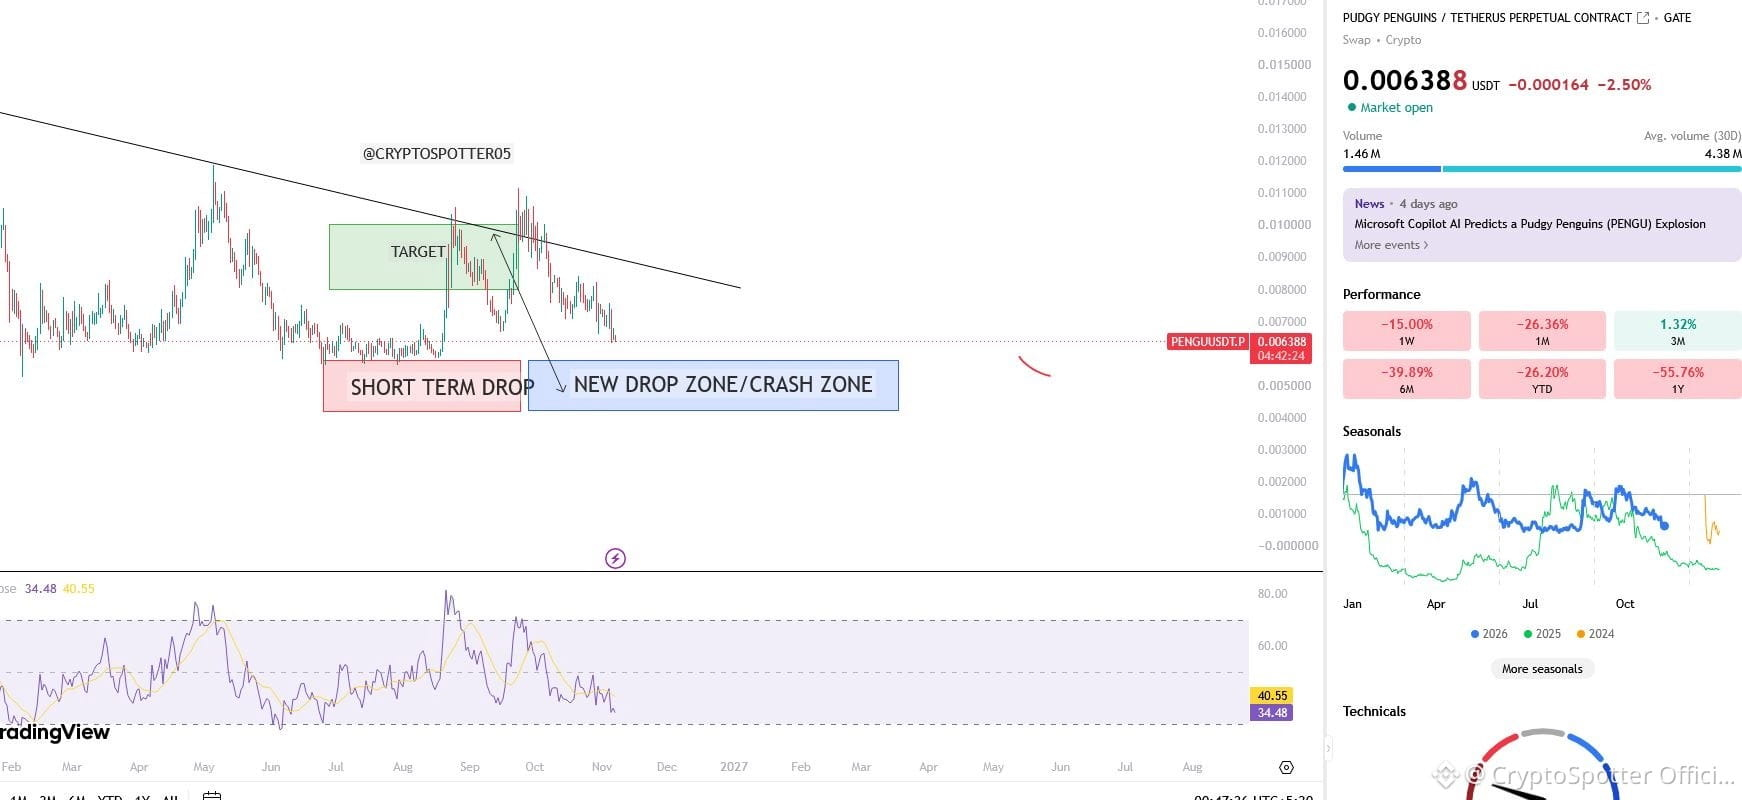
$PENGU Getting Closer to our Drop zone Target! 🔥 #pengu #PENGU #Crypto #Altcoins #BullRun
$PENGU Getting Closer to our Drop zone Target! 🔥

#pengu #PENGU #Crypto #Altcoins #BullRun
CryptoSpotter Official
·
--
$PENGU UPDATE 🚨

First, I gave you a Drop Zone (marked in red).
We successfully entered that range and then reached our Target.
After entering our Target, I told you to book profits.
If you followed my plan, you should be good. ✅

Then I gave you a Dump Target…
And now you can see the results. 👀

I’m confident that we will enter the Drop Zone again.

Once this Drop Zone is hit, I have already shared a detailed plan on what to do next inside our Private Group

Don’t Miss It. 🚨

Follow @CryptoSpotter Official

#PENGU #PENGU #Crypto #Altcoins #BullRun
CryptoSpotter Official
·
--
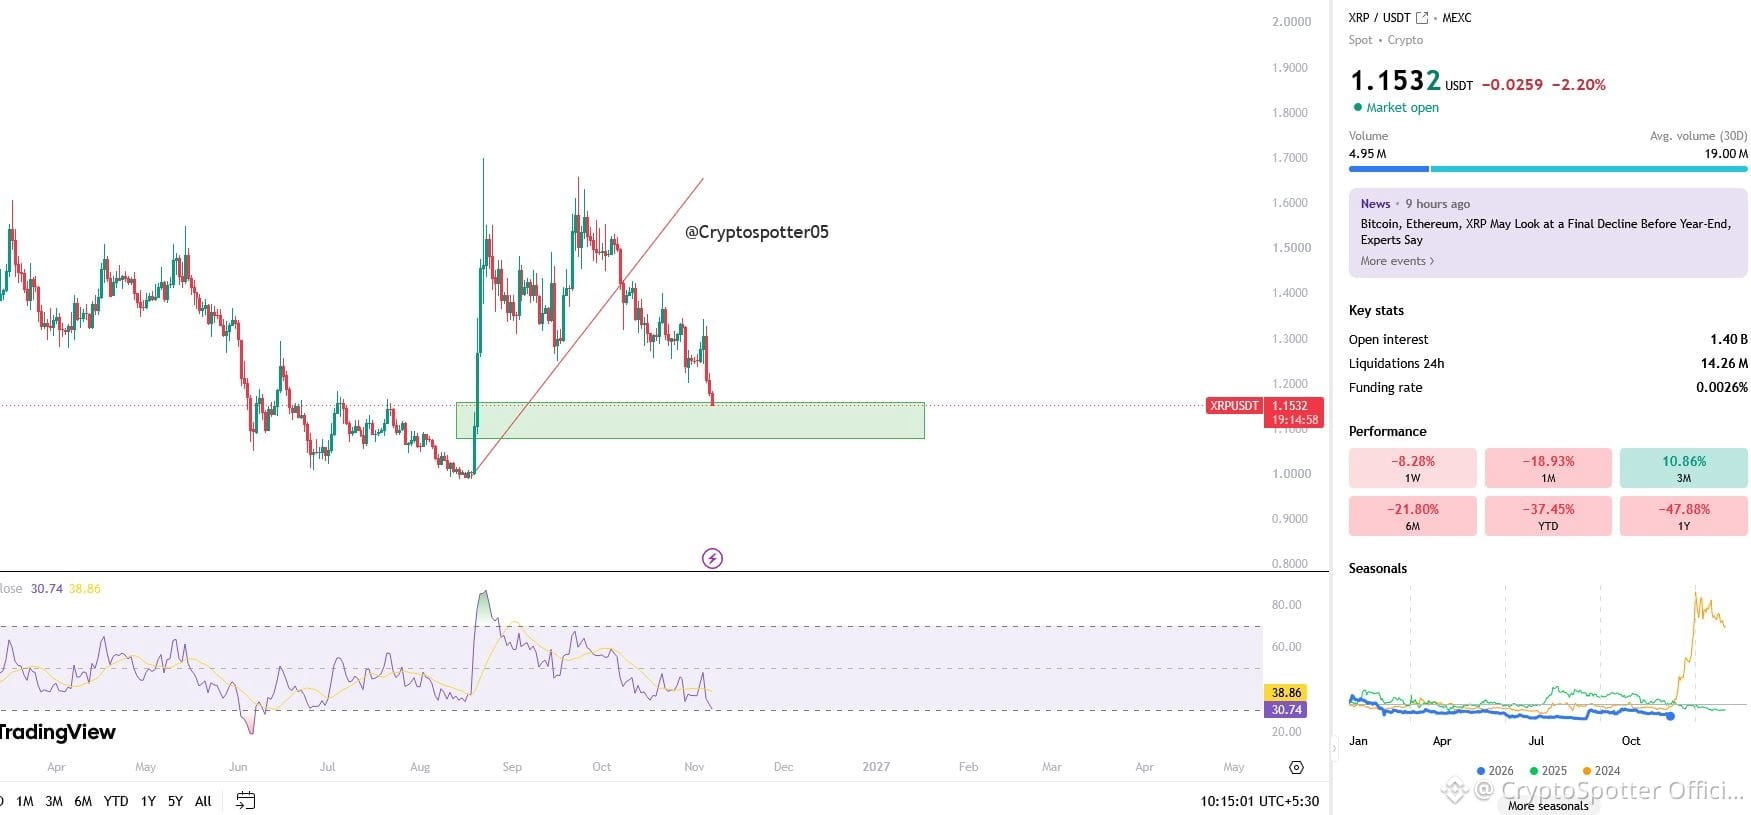
$XRP Chart Request 🚨

This is where i think $XRP Will Drop Next.

#XRP #Xrp🔥🔥
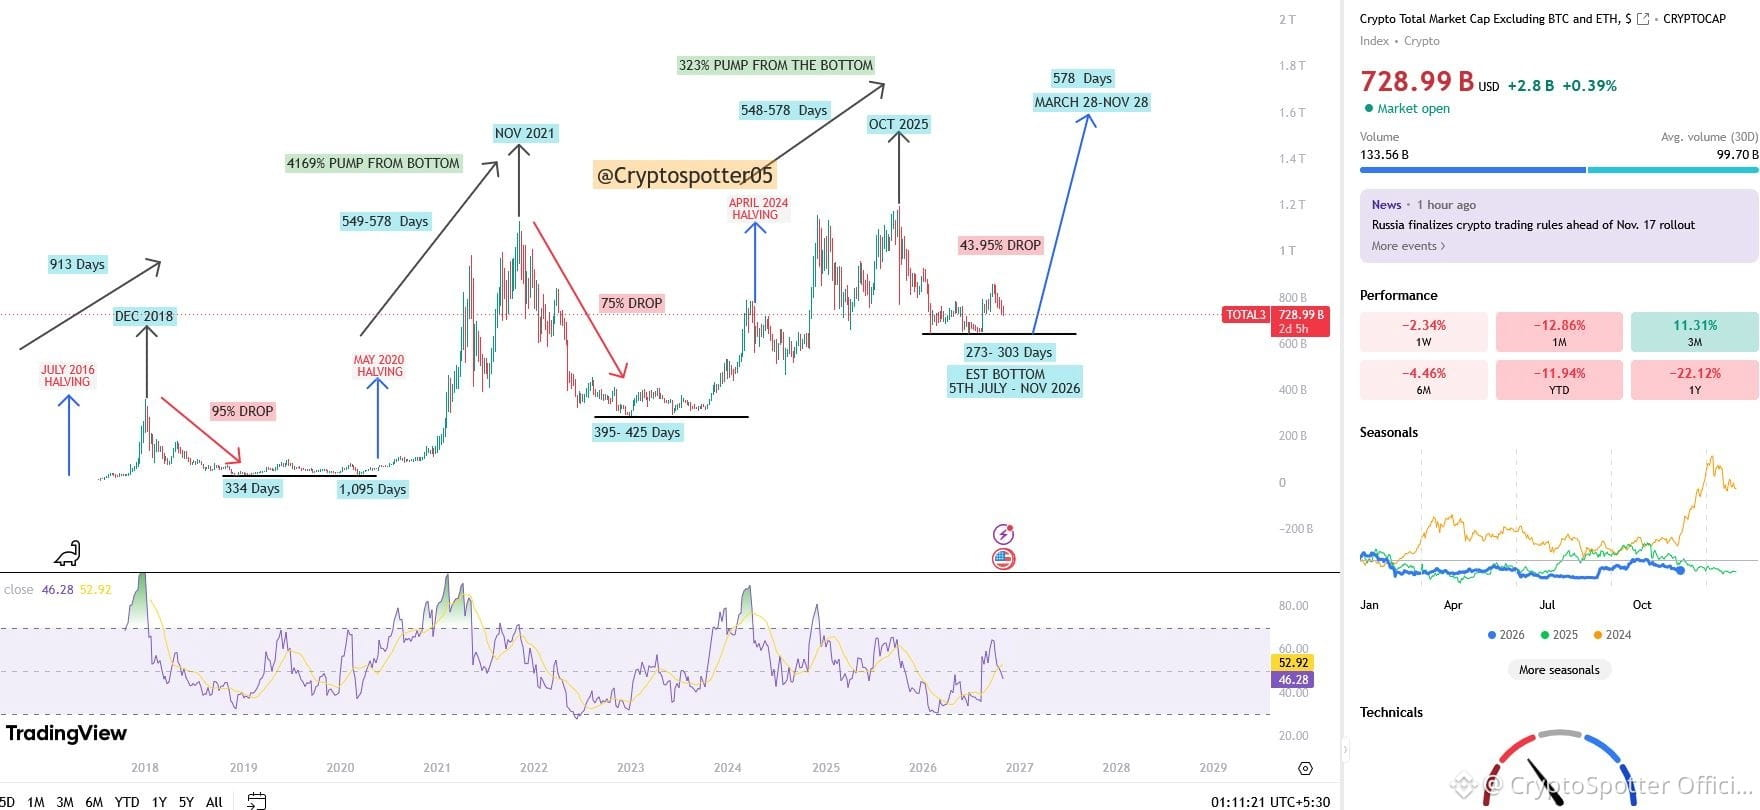
Everyone keeps asking me about #ALTSEASON , especially based on the #TOTAL3 charts. But I've already made a video on this and shared a rough timeline based on math. The first image is from the video I created in July 2026, while the second image shows the current chart. According to this timeline, the bottom could form somewhere between July and November 2026, while the next #Altseason peak could be around 2028. However, these are just rough timelines, not guaranteed dates. I also believe the major Altseason rally could kick in during 2027, so keep following me and check my updated charts as we progress. 🚨 Follow @Cryptospotter1505 #bitcoin #altseason #Bullrun
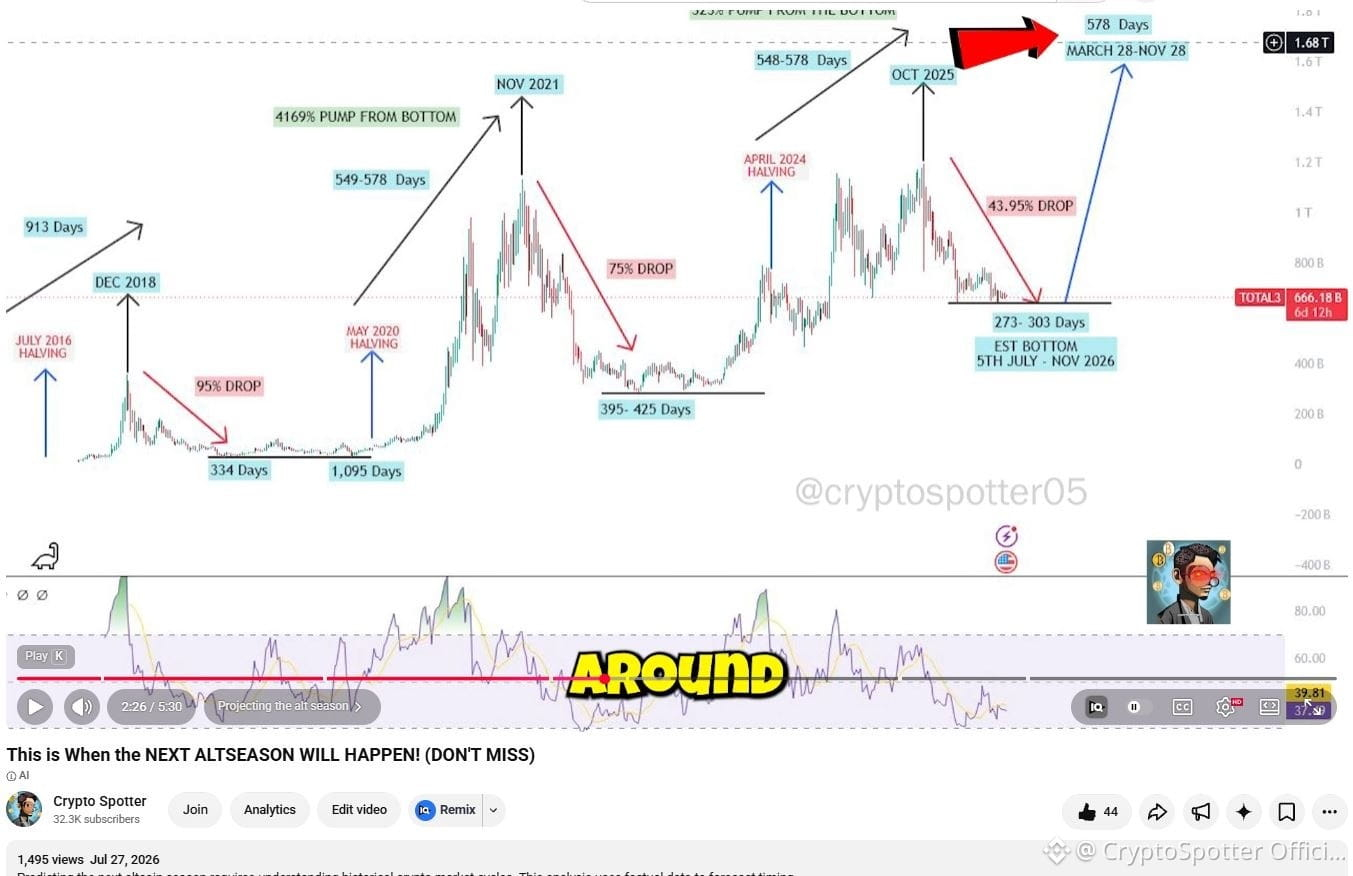
Everyone keeps asking me about #ALTSEASON , especially based on the #TOTAL3 charts.

But I've already made a video on this and shared a rough timeline based on math.
The first image is from the video I created in July 2026, while the second image shows the current chart.

According to this timeline, the bottom could form somewhere between July and November 2026, while the next #Altseason peak could be around 2028.

However, these are just rough timelines, not guaranteed dates.
I also believe the major Altseason rally could kick in during 2027, so keep following me and check my updated charts as we progress. 🚨

Follow @CryptoSpotter Official

#bitcoin #altseason #Bullrun
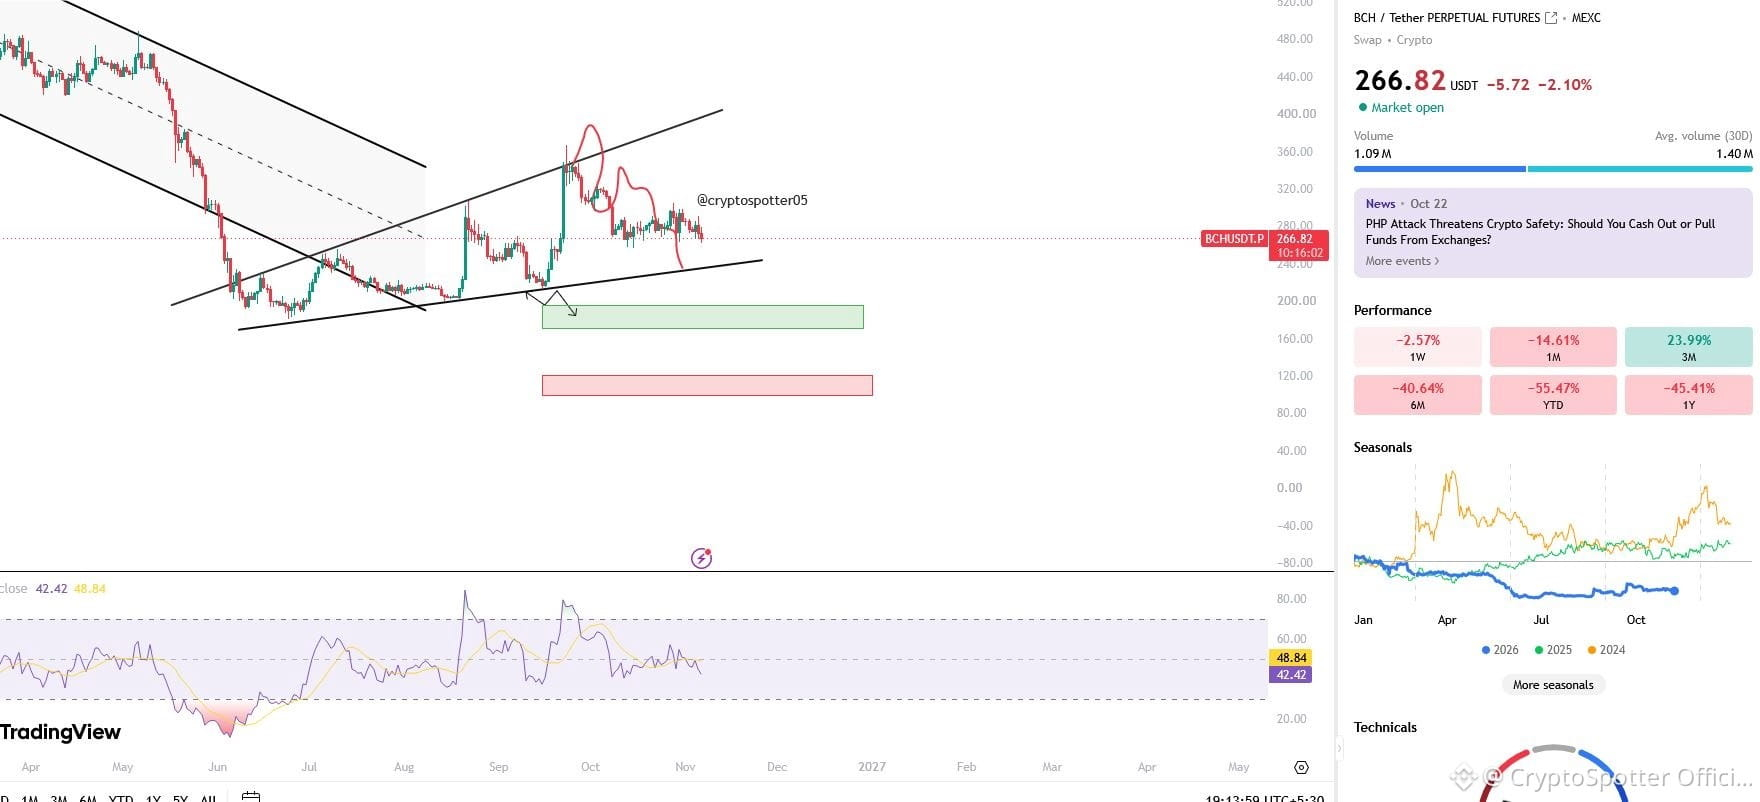
🚨 $BCH UPDATE! The first $BCH update was shared on September 25th. Today is November 6th, and you can see how perfectly our analysis has played out so far. Can $BCH still enter the Green and Red Dump Zones? Yes, it's possible. However, our first target is the Channel Support. Once we reach that level, I'll share an updated chart. For now, Always keep an open mind and be prepared for a potential dump towards both the Green and Red Zones, Which can happen only incase of a flash dump.📉 Follow @Cryptospotter1505 #bch #BCH
🚨 $BCH UPDATE!

The first $BCH
update was shared on September 25th.
Today is November 6th, and you can see how perfectly our analysis has played out so far.

Can $BCH
still enter the Green and Red Dump Zones? Yes, it's possible.
However, our first target is the Channel Support.
Once we reach that level, I'll share an updated chart.
For now, Always keep an open mind and be prepared for a potential dump towards both the Green and Red Zones, Which can happen only incase
of a flash dump.📉

Follow @CryptoSpotter Official

#bch #BCH
CryptoSpotter Official
·
--
$BCH UPDATE 🚨⬇️
Expecting something like this!

Follow @CryptoSpotter Official

#bitcoincash #BCH
🚨 $NEAR INVESTORS, THIS IS A REMINDER! For those of you who have invested your hard-earned money in $NEAR, In my earlier update, I had warned you about this dump. Obviously, many of you are attached to this project, so the warning was ignored. Instead, I got hate on the posts I shared. But that doesn't change the reality. I still believe $NEAR can give you 6x–10x returns, but for that, you need to invest at the right time. If you have invested at the local highs, you can't expect to make 6x or 10x from there. You need to strike at the right time. Now coming back to our warning, ✅ We have already entered Drop Zone 1. ⚠️ Next, we have a very high probability of dropping below $3.40, where we have a small support. If that support is lost, we could be heading towards Drop Zone 2. Also, in this chart, I have mentioned a Flush Zone below $1.60. Although it may look impossible to reach that level right now, November and December could be extremely bad for $NEAR, so please be very careful. I'm not here to scare you. I'm just here to warn you about the probabilities I can see on the charts. According to my analysis, $NEAR could tap the Flush Scenario either in 2026 or 2027, before it begins its major pump. Make sure to follow me @Cryptospotter1505 because I'll keep updating you as we progress. I would also love to hear your thoughts in the comments below. 👇 #NEAR #NEAR🚀🚀🚀
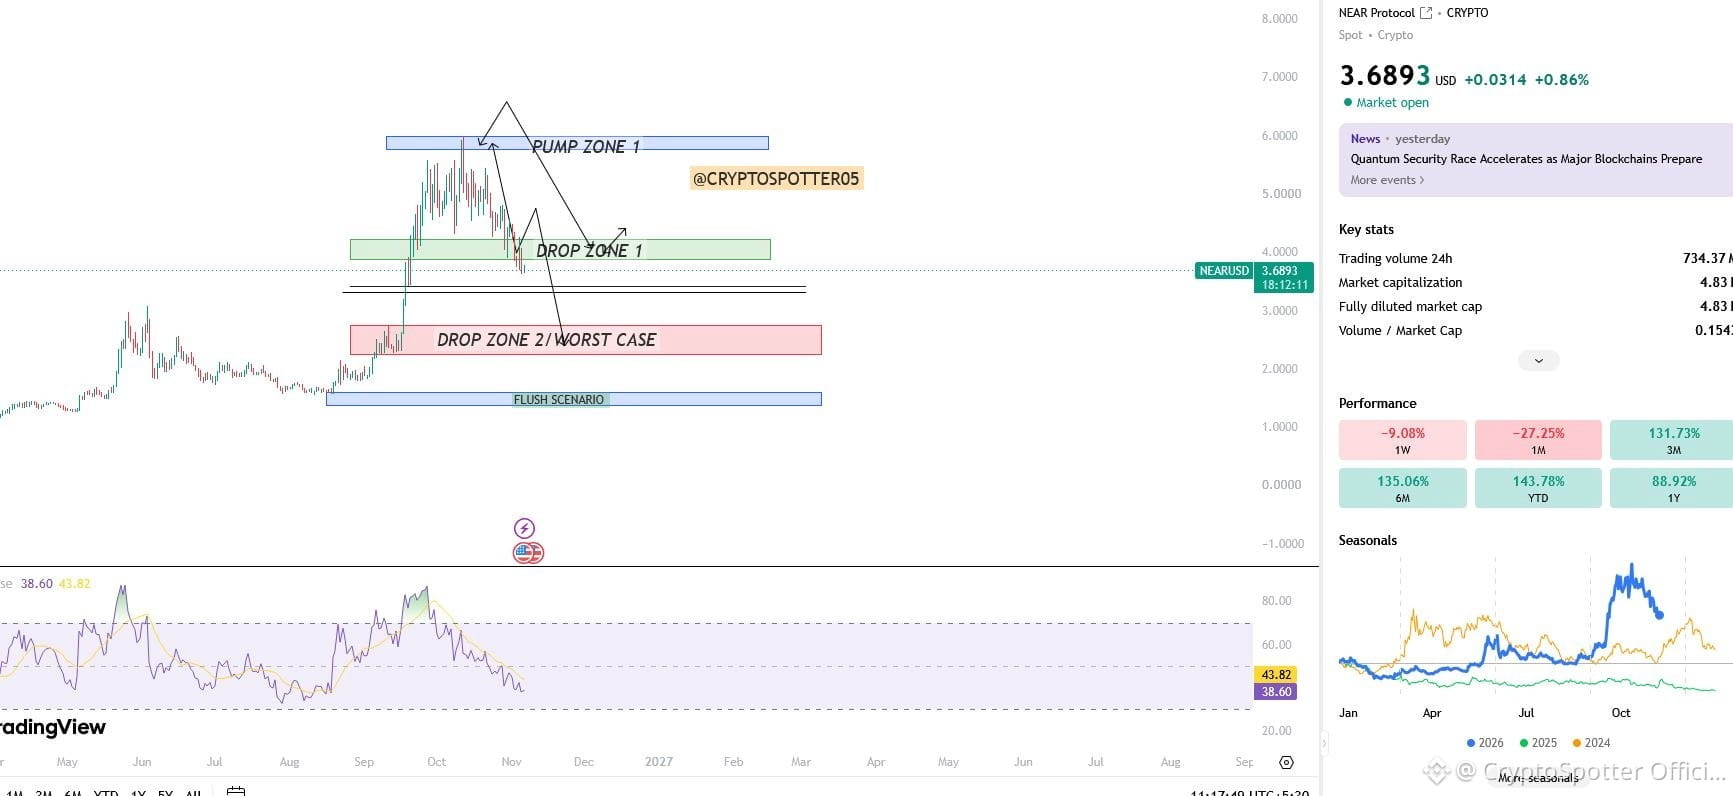
🚨 $NEAR INVESTORS, THIS IS A REMINDER!

For those of you who have invested your hard-earned money in $NEAR ,

In my earlier update, I had warned you about this dump. Obviously, many of you are attached to this project, so the warning was ignored. Instead, I got hate on the posts I shared.

But that doesn't change the reality.
I still believe $NEAR can give you 6x–10x returns, but for that, you need to invest at the right time. If you have invested at the local highs, you can't expect to make 6x or 10x from there. You need to strike at the right time.

Now coming back to our warning,

✅ We have already entered Drop Zone 1.

⚠️ Next, we have a very high probability of dropping below $3.40, where we have a small support.

If that support is lost, we could be heading towards Drop Zone 2.
Also, in this chart, I have mentioned a Flush Zone below $1.60.
Although it may look impossible to reach that level right now, November and December could be extremely bad for $NEAR , so please be very careful.

I'm not here to scare you. I'm just here to warn you about the probabilities I can see on the charts.
According to my analysis, $NEAR could tap the Flush Scenario either in 2026 or 2027, before it begins its major pump.

Make sure to follow me @CryptoSpotter Official because I'll keep updating you as we progress.
I would also love to hear your thoughts in the comments below. 👇

#NEAR #NEAR🚀🚀🚀
CryptoSpotter Official
·
--
When i told you $NEAR Is Running out of gas, Lot of people got upset, But trading doesn't work on emotions,
All my warnings were ignored!,
But guess what? Today we hit our Drop zone 1 Target 😅
Like $NEAR Many of my charts have hit our Target zone,
You can scroll through my profile and check all the Targets we have hit.

Don't forget to Follow me @CryptoSpotter Official
i always try to alert you before every crash..

#near #Near #NEARUSDT
Log in to explore more content
Join global crypto users on Binance Square
⚡️ Get latest and useful information about crypto.
💬 Trusted by the world’s largest crypto exchange.
👍 Discover real insights from verified creators.
Email / Phone number
Sitemap
Cookie Preferences
Platform T&Cs