
Aria Xuan萱
214 Posts

Aria Xuan萱
Report
Block User
150 Following
3.4K+ Followers
246 Liked
Posts
All
Quotes
Live
·
--
Bullish
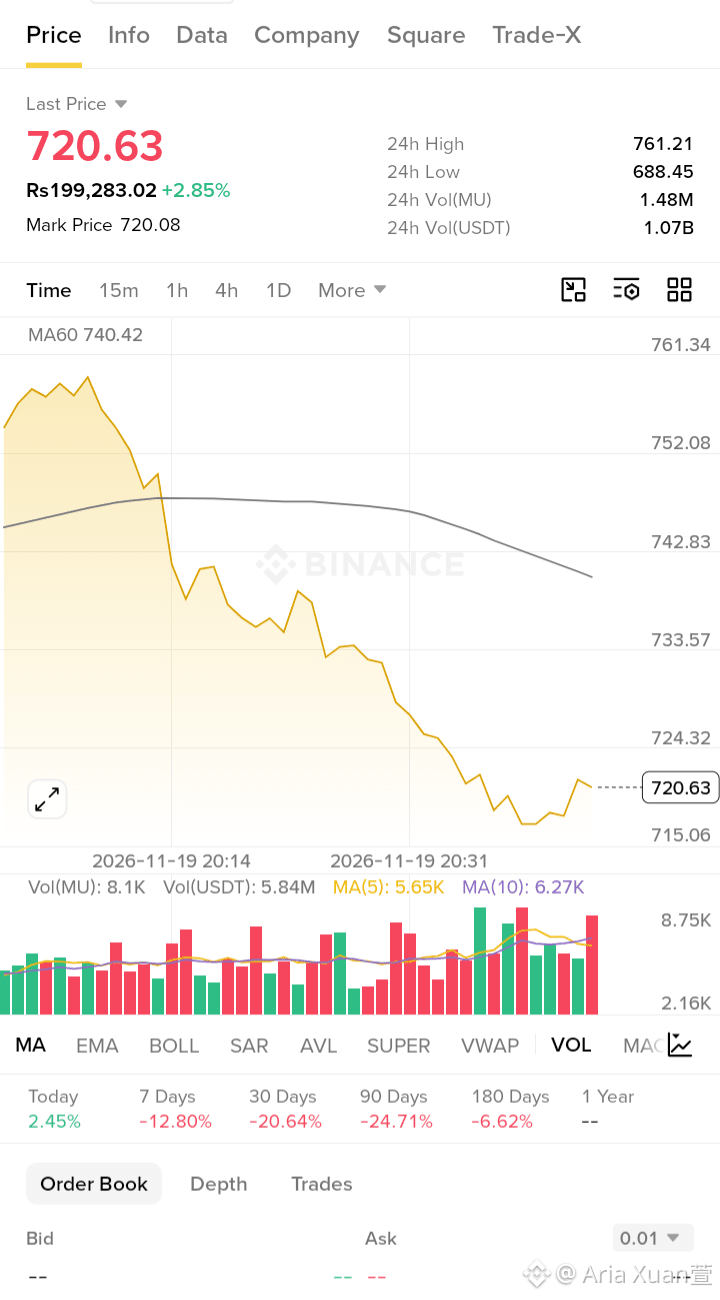
$MU / USDT Market Update | Nov 19, 2026*
Last Price:* $720.63 (Rs 199,283.02) *+2.85%*
Mark Price:* $720.08
24H High:* $761.21
24H Low:* $688.45
24H Vol:* 1.48M MU / 1.07B USDT
*Technical Analysis (15m):*
MU in a steep downtrend but showing signs of bottom formation!
Price crashed hard from $760+ to $715 in a single session, but after hitting near 24H Low at 20:31, it has formed a double bottom and started to bounce back to $720.63.
Currently at *$720.63*, still trading well *BELOW MA60 at $740.42*. MA60 is sloping down sharply - bears still in control. Price is far below MA60, indicating oversold condition.
Volume: Very high volume during the fall (8.75K), but now buying volume increasing with green bars at the bottom. MA(5) 5.65K below MA(10) 6.27K but gap narrowing - early sign of seller exhaustion.
Performance: Today +2.45% still green due to earlier high, but 7D -12.80%, 30D -20.64%, 90D -24.71% - deep correction phase.
*Key Levels:*
Resistance: $724.32 / $733.57 / $740.42 (MA60) / $742.83 - Heavy resistance zone ahead.
Support: $715.06 (Double Bottom) / $688.45 (24H Low)
This looks like a potential reversal zone. If MU holds above $715 and reclaims $724.32, short-term bounce towards $733 can be expected. Failure to hold $715 opens risk to $688.
Oversold bounce play - high risk.
{future}(MUUSDT)
Not Financial Advice. DYOR.
#MU #Micron #Binance #Stocks
$MU / USDT Market Update | Nov 19, 2026*
Last Price:* $720.63 (Rs 199,283.02) *+2.85%*
Mark Price:* $720.08
24H High:* $761.21
24H Low:* $688.45
24H Vol:* 1.48M MU / 1.07B USDT
*Technical Analysis (15m):*
MU in a steep downtrend but showing signs of bottom formation!
Price crashed hard from $760+ to $715 in a single session, but after hitting near 24H Low at 20:31, it has formed a double bottom and started to bounce back to $720.63.
Currently at *$720.63*, still trading well *BELOW MA60 at $740.42*. MA60 is sloping down sharply - bears still in control. Price is far below MA60, indicating oversold condition.
Volume: Very high volume during the fall (8.75K), but now buying volume increasing with green bars at the bottom. MA(5) 5.65K below MA(10) 6.27K but gap narrowing - early sign of seller exhaustion.
Performance: Today +2.45% still green due to earlier high, but 7D -12.80%, 30D -20.64%, 90D -24.71% - deep correction phase.
*Key Levels:*
Resistance: $724.32 / $733.57 / $740.42 (MA60) / $742.83 - Heavy resistance zone ahead.
Support: $715.06 (Double Bottom) / $688.45 (24H Low)
This looks like a potential reversal zone. If MU holds above $715 and reclaims $724.32, short-term bounce towards $733 can be expected. Failure to hold $715 opens risk to $688.
Oversold bounce play - high risk.
Not Financial Advice. DYOR.
#MU #Micron #Binance #Stocks
Last Price:* $720.63 (Rs 199,283.02) *+2.85%*
Mark Price:* $720.08
24H High:* $761.21
24H Low:* $688.45
24H Vol:* 1.48M MU / 1.07B USDT
*Technical Analysis (15m):*
MU in a steep downtrend but showing signs of bottom formation!
Price crashed hard from $760+ to $715 in a single session, but after hitting near 24H Low at 20:31, it has formed a double bottom and started to bounce back to $720.63.
Currently at *$720.63*, still trading well *BELOW MA60 at $740.42*. MA60 is sloping down sharply - bears still in control. Price is far below MA60, indicating oversold condition.
Volume: Very high volume during the fall (8.75K), but now buying volume increasing with green bars at the bottom. MA(5) 5.65K below MA(10) 6.27K but gap narrowing - early sign of seller exhaustion.
Performance: Today +2.45% still green due to earlier high, but 7D -12.80%, 30D -20.64%, 90D -24.71% - deep correction phase.
*Key Levels:*
Resistance: $724.32 / $733.57 / $740.42 (MA60) / $742.83 - Heavy resistance zone ahead.
Support: $715.06 (Double Bottom) / $688.45 (24H Low)
This looks like a potential reversal zone. If MU holds above $715 and reclaims $724.32, short-term bounce towards $733 can be expected. Failure to hold $715 opens risk to $688.
Oversold bounce play - high risk.
Not Financial Advice. DYOR.
#MU #Micron #Binance #Stocks
291
·
--
Bearish
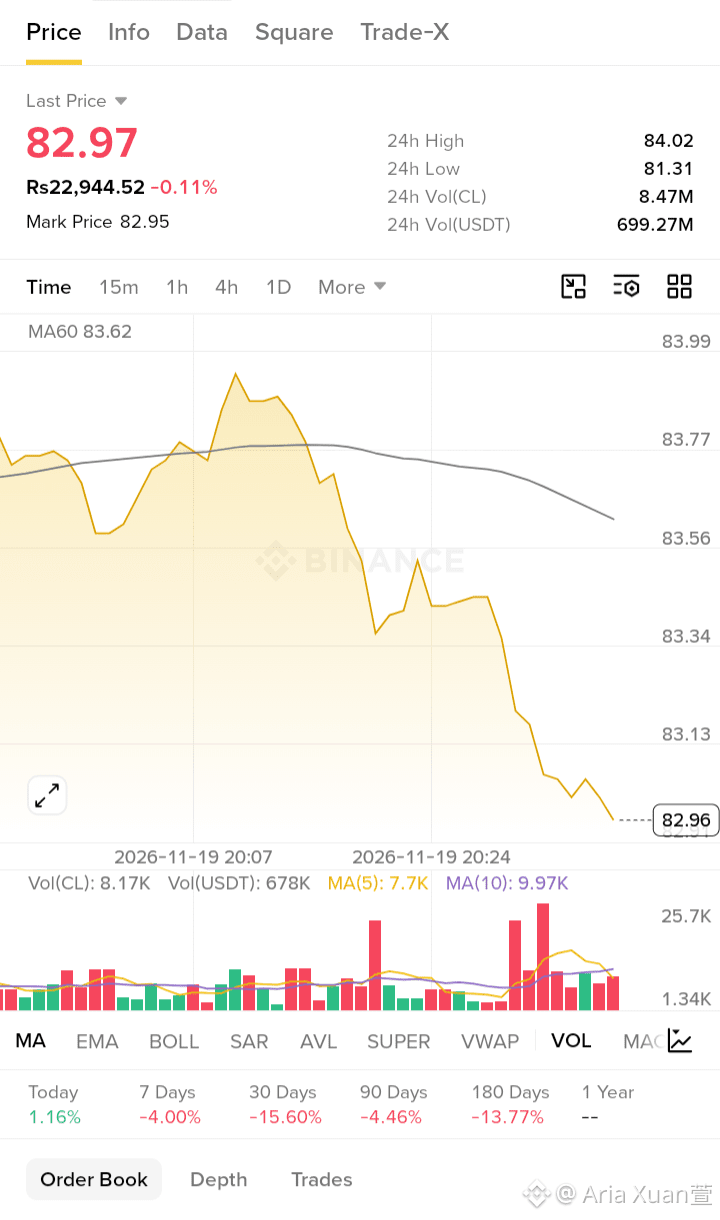
$CL / USDT Market Update | Nov 19, 2026*
Last Price:* $82.97 (Rs 22,944.52) *-0.11%*
Mark Price:* $82.95
24H High:* $84.02
24H Low:* $81.31
24H Vol:* 8.47M CL / 699.27M USDT
*Technical Analysis (15m):*
CL under strong selling pressure! Bearish breakdown in progress.
After a failed attempt to hold near $83.90 around 20:07, CL formed a lower high and then crashed sharply. From $83.45 it has dropped straight to $82.96 with no major bounce - showing aggressive selling.
Currently at *$82.96*, trading well *BELOW MA60 at $83.62*. MA60 is sloping down and price is widening the gap below it - classic bearish trend. The chart is making lower lows and lower highs.
Volume: Very high red volume spikes during the drop (25.7K volume), MA(5) 7.7K below MA(10) 9.97K - sellers dominating. Recent small green bars lack strength.
Performance: Today +1.16% still green due to earlier pump, but 7D -4.00%, 30D -15.60%, 180D -13.77% - broader downtrend intact. Today’s gain is getting erased.
*Key Levels:*
Resistance: $83.13 / $83.34 / $83.56 / $83.62 (MA60) - MA60 will be strong resistance now.
Support: $82.96 (Current) / $81.31 (24H Low)
If CL fails to reclaim $83.13, next target is $82.50 then 24H Low $81.31. Need to break above $83.62 MA60 to reverse bearish momentum.
Weak structure - avoid longs until bullish reversal.
{future}(CLUSDT)
Not Financial Advice. DYOR.
#CL #Oil #Binance #Bearish
$CL / USDT Market Update | Nov 19, 2026*
Last Price:* $82.97 (Rs 22,944.52) *-0.11%*
Mark Price:* $82.95
24H High:* $84.02
24H Low:* $81.31
24H Vol:* 8.47M CL / 699.27M USDT
*Technical Analysis (15m):*
CL under strong selling pressure! Bearish breakdown in progress.
After a failed attempt to hold near $83.90 around 20:07, CL formed a lower high and then crashed sharply. From $83.45 it has dropped straight to $82.96 with no major bounce - showing aggressive selling.
Currently at *$82.96*, trading well *BELOW MA60 at $83.62*. MA60 is sloping down and price is widening the gap below it - classic bearish trend. The chart is making lower lows and lower highs.
Volume: Very high red volume spikes during the drop (25.7K volume), MA(5) 7.7K below MA(10) 9.97K - sellers dominating. Recent small green bars lack strength.
Performance: Today +1.16% still green due to earlier pump, but 7D -4.00%, 30D -15.60%, 180D -13.77% - broader downtrend intact. Today’s gain is getting erased.
*Key Levels:*
Resistance: $83.13 / $83.34 / $83.56 / $83.62 (MA60) - MA60 will be strong resistance now.
Support: $82.96 (Current) / $81.31 (24H Low)
If CL fails to reclaim $83.13, next target is $82.50 then 24H Low $81.31. Need to break above $83.62 MA60 to reverse bearish momentum.
Weak structure - avoid longs until bullish reversal.
Not Financial Advice. DYOR.
#CL #Oil #Binance #Bearish
Last Price:* $82.97 (Rs 22,944.52) *-0.11%*
Mark Price:* $82.95
24H High:* $84.02
24H Low:* $81.31
24H Vol:* 8.47M CL / 699.27M USDT
*Technical Analysis (15m):*
CL under strong selling pressure! Bearish breakdown in progress.
After a failed attempt to hold near $83.90 around 20:07, CL formed a lower high and then crashed sharply. From $83.45 it has dropped straight to $82.96 with no major bounce - showing aggressive selling.
Currently at *$82.96*, trading well *BELOW MA60 at $83.62*. MA60 is sloping down and price is widening the gap below it - classic bearish trend. The chart is making lower lows and lower highs.
Volume: Very high red volume spikes during the drop (25.7K volume), MA(5) 7.7K below MA(10) 9.97K - sellers dominating. Recent small green bars lack strength.
Performance: Today +1.16% still green due to earlier pump, but 7D -4.00%, 30D -15.60%, 180D -13.77% - broader downtrend intact. Today’s gain is getting erased.
*Key Levels:*
Resistance: $83.13 / $83.34 / $83.56 / $83.62 (MA60) - MA60 will be strong resistance now.
Support: $82.96 (Current) / $81.31 (24H Low)
If CL fails to reclaim $83.13, next target is $82.50 then 24H Low $81.31. Need to break above $83.62 MA60 to reverse bearish momentum.
Weak structure - avoid longs until bullish reversal.
Not Financial Advice. DYOR.
#CL #Oil #Binance #Bearish
89
·
--
Bullish
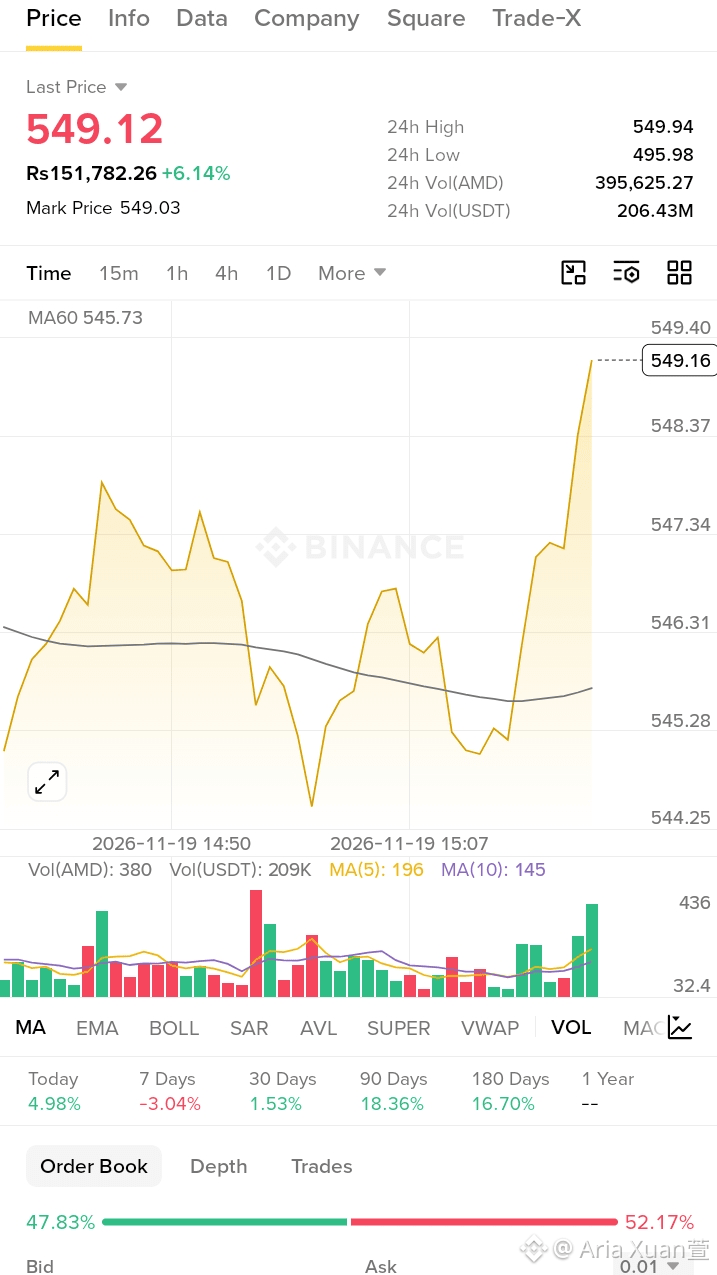
$AMD / USDT Market Update | Nov 19, 2026*
Last Price:* $549.12 (Rs 151,782.26) *+6.14%*
Mark Price:* $549.03
24H High:* $549.94
24H Low:* $495.98
24H Vol:* 395,625.27 AMD / 206.43M USDT
*Technical Analysis (15m):*
AMD is on FIRE! Explosive breakout!
After a choppy session with a dip to $544.25 around 14:50, AMD formed a double bottom and started climbing from 15:07. Now it has given a massive vertical rally, almost hitting the 24H High.
Currently at *$549.16*, trading way *ABOVE MA60 at $545.73*. MA60 had been falling all day but now has turned up sharply - strong bullish reversal signal. Price action is in full momentum, making higher highs.
Volume: Strong green volume bars in last few candles, MA(5) 196 crossed above MA(10) 145 - clear bullish volume crossover. Buying pressure at its peak.
Performance: *Today +4.98% (Top Gainer)*, 30D +1.53%, 90D +18.36%, 180D +16.70% - AMD outperforming the market today.
*Key Levels:*
Support: $548.37 / $547.34 / $546.31 / $545.73 (MA60)
Resistance: $549.40 / $549.94 (24H High)
If AMD breaks $549.94, it will enter price discovery and can target $550+ quickly. Any dip towards $548.30 is a buying opportunity as long as it holds above MA60.
Super bullish structure - momentum with volume.
{future}(AMDUSDT)
Not Financial Advice. DYOR.
#AMD #Stocks #Binance #Trading #Bullish
$AMD / USDT Market Update | Nov 19, 2026*
Last Price:* $549.12 (Rs 151,782.26) *+6.14%*
Mark Price:* $549.03
24H High:* $549.94
24H Low:* $495.98
24H Vol:* 395,625.27 AMD / 206.43M USDT
*Technical Analysis (15m):*
AMD is on FIRE! Explosive breakout!
After a choppy session with a dip to $544.25 around 14:50, AMD formed a double bottom and started climbing from 15:07. Now it has given a massive vertical rally, almost hitting the 24H High.
Currently at *$549.16*, trading way *ABOVE MA60 at $545.73*. MA60 had been falling all day but now has turned up sharply - strong bullish reversal signal. Price action is in full momentum, making higher highs.
Volume: Strong green volume bars in last few candles, MA(5) 196 crossed above MA(10) 145 - clear bullish volume crossover. Buying pressure at its peak.
Performance: *Today +4.98% (Top Gainer)*, 30D +1.53%, 90D +18.36%, 180D +16.70% - AMD outperforming the market today.
*Key Levels:*
Support: $548.37 / $547.34 / $546.31 / $545.73 (MA60)
Resistance: $549.40 / $549.94 (24H High)
If AMD breaks $549.94, it will enter price discovery and can target $550+ quickly. Any dip towards $548.30 is a buying opportunity as long as it holds above MA60.
Super bullish structure - momentum with volume.
Not Financial Advice. DYOR.
#AMD #Stocks #Binance #Trading #Bullish
Last Price:* $549.12 (Rs 151,782.26) *+6.14%*
Mark Price:* $549.03
24H High:* $549.94
24H Low:* $495.98
24H Vol:* 395,625.27 AMD / 206.43M USDT
*Technical Analysis (15m):*
AMD is on FIRE! Explosive breakout!
After a choppy session with a dip to $544.25 around 14:50, AMD formed a double bottom and started climbing from 15:07. Now it has given a massive vertical rally, almost hitting the 24H High.
Currently at *$549.16*, trading way *ABOVE MA60 at $545.73*. MA60 had been falling all day but now has turned up sharply - strong bullish reversal signal. Price action is in full momentum, making higher highs.
Volume: Strong green volume bars in last few candles, MA(5) 196 crossed above MA(10) 145 - clear bullish volume crossover. Buying pressure at its peak.
Performance: *Today +4.98% (Top Gainer)*, 30D +1.53%, 90D +18.36%, 180D +16.70% - AMD outperforming the market today.
*Key Levels:*
Support: $548.37 / $547.34 / $546.31 / $545.73 (MA60)
Resistance: $549.40 / $549.94 (24H High)
If AMD breaks $549.94, it will enter price discovery and can target $550+ quickly. Any dip towards $548.30 is a buying opportunity as long as it holds above MA60.
Super bullish structure - momentum with volume.
Not Financial Advice. DYOR.
#AMD #Stocks #Binance #Trading #Bullish
106
·
--
Bullish
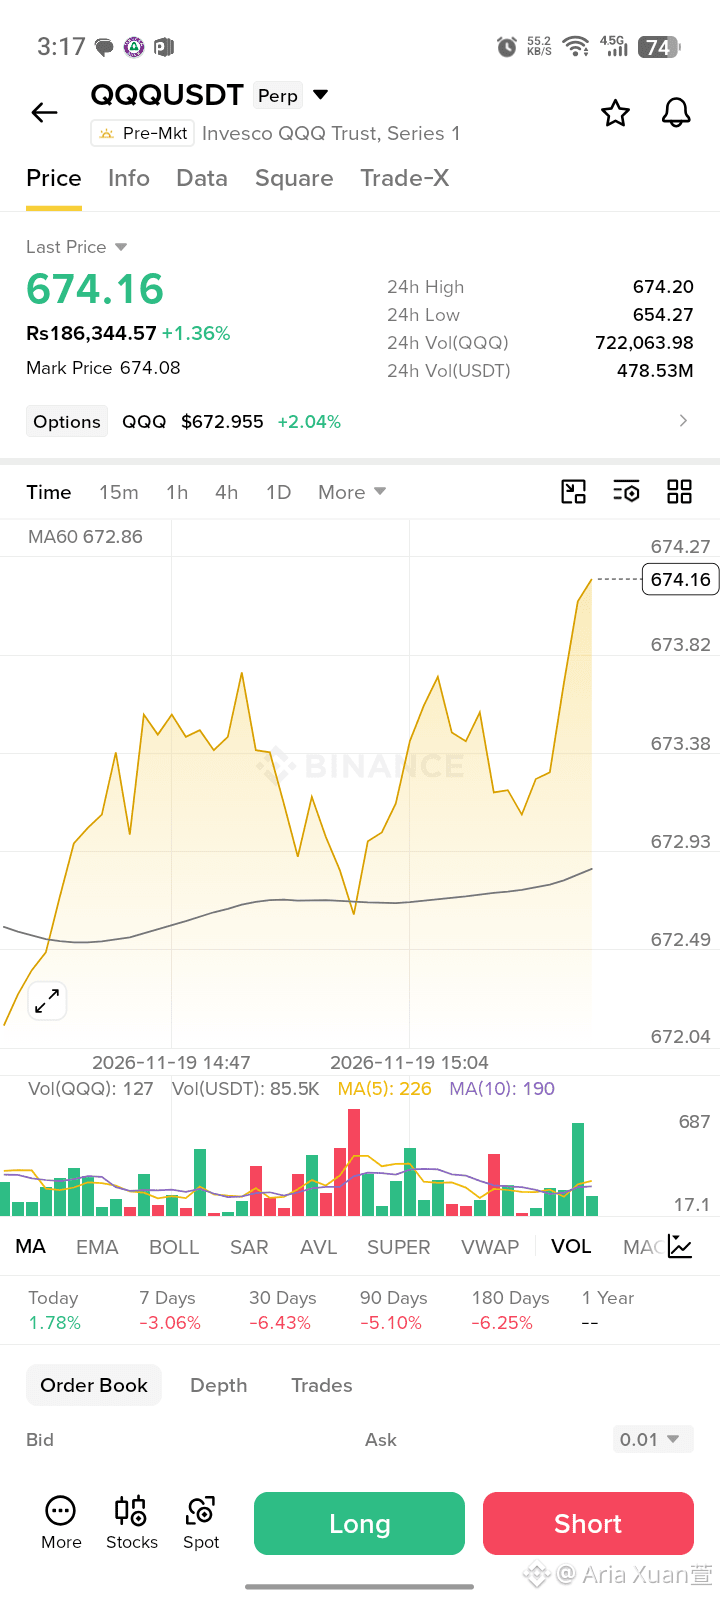
$QQQ / USDT Market Update | Nov 19, 2026*
*Last Price:* $674.16 (Rs 186,344.57) *+1.36%*
*Mark Price:* $674.08
*24H High:* $674.20
*24H Low:* $654.27
*24H Vol:* 722,063.98 QQQ / 478.53M USDT
*QQQ Index:* $672.955 +2.04%
*Technical Analysis (15m):*
QQQ in full bullish momentum! Super strong uptrend.
After a volatile morning with double top around 673.60, price dipped to find support near 672.70 around 15:04 and then launched a clean, vertical breakout. New 24H high being made right now at $674.20.
Currently at *$674.16*, trading comfortably *ABOVE MA60 at $672.86*. MA60 is rising steadily, confirming bullish structure. Price is holding above all intraday highs - shows strong demand.
Volume: Huge green volume bar at the breakout (687 volume), highest of the day. MA(5) 226 vs MA(10) 190 - bullish crossover, buying volume increasing.
Performance: Today +1.78% - leading recovery. Higher timeframe still in correction (7D -3.06%, 30D -6.43%) but today's move signals potential trend reversal.
*Key Levels:*
Support: $673.82 / $673.38 / $672.86 (MA60)
Resistance: $674.20 (24H High) / $674.27
As long as QQQ sustains above $673.38, bulls remain in full control. Close above $674.20 can open $675+ target.
Nasdaq proxy showing strength - bullish for broader market.
{future}(QQQUSDT)
Not Financial Advice. DYOR.
#QQQ #Nasdaq #Binance #Trading
$QQQ / USDT Market Update | Nov 19, 2026*
*Last Price:* $674.16 (Rs 186,344.57) *+1.36%*
*Mark Price:* $674.08
*24H High:* $674.20
*24H Low:* $654.27
*24H Vol:* 722,063.98 QQQ / 478.53M USDT
*QQQ Index:* $672.955 +2.04%
*Technical Analysis (15m):*
QQQ in full bullish momentum! Super strong uptrend.
After a volatile morning with double top around 673.60, price dipped to find support near 672.70 around 15:04 and then launched a clean, vertical breakout. New 24H high being made right now at $674.20.
Currently at *$674.16*, trading comfortably *ABOVE MA60 at $672.86*. MA60 is rising steadily, confirming bullish structure. Price is holding above all intraday highs - shows strong demand.
Volume: Huge green volume bar at the breakout (687 volume), highest of the day. MA(5) 226 vs MA(10) 190 - bullish crossover, buying volume increasing.
Performance: Today +1.78% - leading recovery. Higher timeframe still in correction (7D -3.06%, 30D -6.43%) but today's move signals potential trend reversal.
*Key Levels:*
Support: $673.82 / $673.38 / $672.86 (MA60)
Resistance: $674.20 (24H High) / $674.27
As long as QQQ sustains above $673.38, bulls remain in full control. Close above $674.20 can open $675+ target.
Nasdaq proxy showing strength - bullish for broader market.
Not Financial Advice. DYOR.
#QQQ #Nasdaq #Binance #Trading
*Last Price:* $674.16 (Rs 186,344.57) *+1.36%*
*Mark Price:* $674.08
*24H High:* $674.20
*24H Low:* $654.27
*24H Vol:* 722,063.98 QQQ / 478.53M USDT
*QQQ Index:* $672.955 +2.04%
*Technical Analysis (15m):*
QQQ in full bullish momentum! Super strong uptrend.
After a volatile morning with double top around 673.60, price dipped to find support near 672.70 around 15:04 and then launched a clean, vertical breakout. New 24H high being made right now at $674.20.
Currently at *$674.16*, trading comfortably *ABOVE MA60 at $672.86*. MA60 is rising steadily, confirming bullish structure. Price is holding above all intraday highs - shows strong demand.
Volume: Huge green volume bar at the breakout (687 volume), highest of the day. MA(5) 226 vs MA(10) 190 - bullish crossover, buying volume increasing.
Performance: Today +1.78% - leading recovery. Higher timeframe still in correction (7D -3.06%, 30D -6.43%) but today's move signals potential trend reversal.
*Key Levels:*
Support: $673.82 / $673.38 / $672.86 (MA60)
Resistance: $674.20 (24H High) / $674.27
As long as QQQ sustains above $673.38, bulls remain in full control. Close above $674.20 can open $675+ target.
Nasdaq proxy showing strength - bullish for broader market.
Not Financial Advice. DYOR.
#QQQ #Nasdaq #Binance #Trading
91
·
--
Bullish
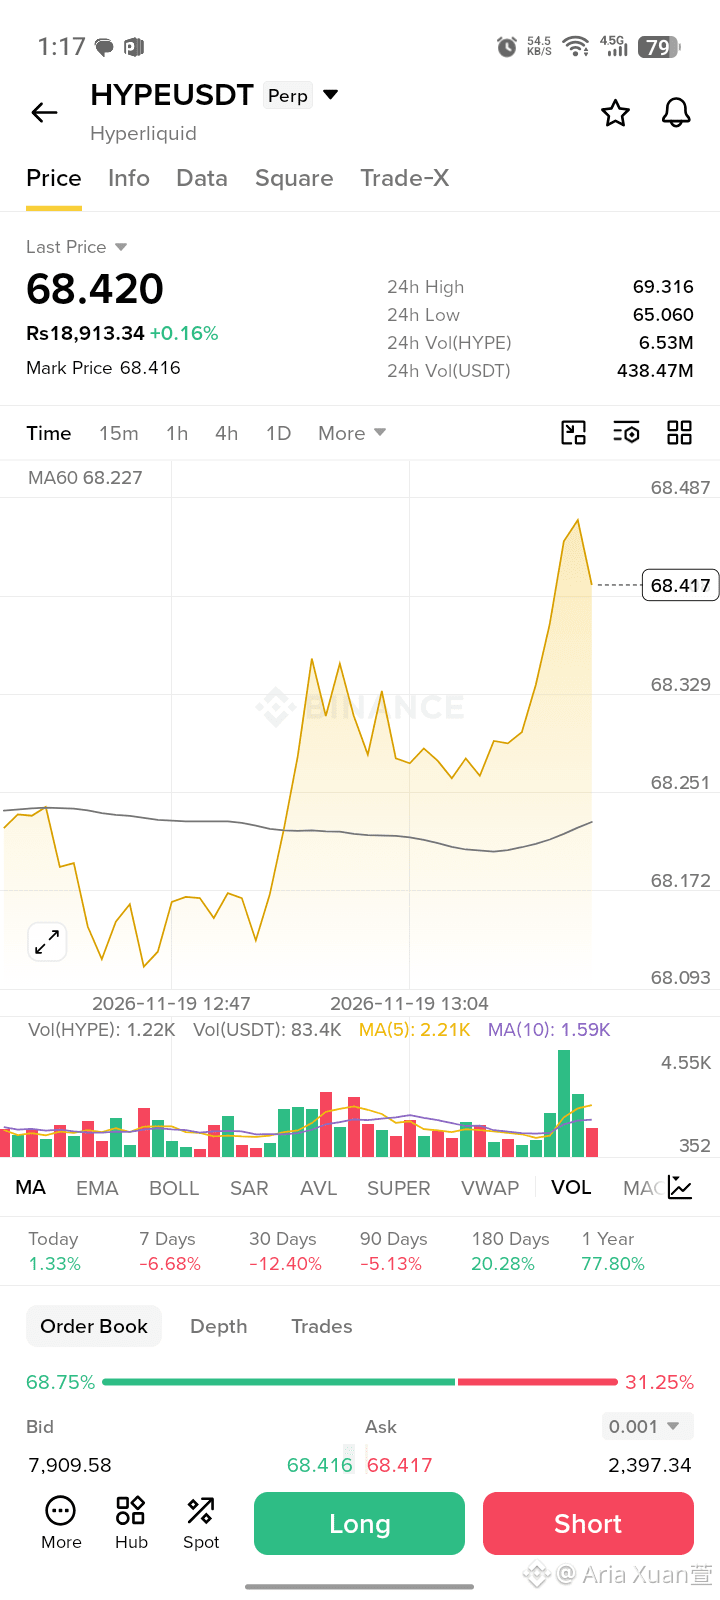
$HYPE / USDT Market Update | Nov 19, 2026*
Last Price:* $68.420 (Rs 18,913.34) *+0.16%*
Mark Price:* $68.416
24H High:* $69.316
24H Low:* $65.060
24H Vol:* 6.53M HYPE / 438.47M USDT
*Technical Analysis (15m):*
HYPE showing strong bullish breakout today!
After a dip to near $68.09 around 12:47, buyers stepped in aggressively. Price formed a strong base around $68.25 and then started a clean uptrend, breaking out powerfully around 13:04 and making a new intraday high near $68.487.
Currently at *$68.417*, holding well *ABOVE MA60 at $68.227*. MA60 was flat earlier but is now turning up, supporting the bullish momentum. Price is consolidating after the spike, which is healthy.
Volume: Massive green volume spike at breakout (4.55K), highest of the day - confirms strong buyer interest. MA5 (2.21K) crossed above MA10 (1.59K) - bullish signal.
Performance: Today +1.33%, 180 Days +20.28%, 1 Year +77.80% - long term trend still very strong.
*Key Levels:*
Support: $68.329 / $68.251 (Breakout Zone) / $68.227 (MA60)
Resistance: $68.487 (Intraday High) / $69.316 (24H High)
As long as HYPE holds above $68.32, bulls are in control. A continuation above $68.487 could open path to $69+.
Strong momentum coin.
{spot}(HYPEUSDT)
Not Financial Advice. DYOR.
#HYPE #Crypto #Binance #Altcoin
$HYPE / USDT Market Update | Nov 19, 2026*
Last Price:* $68.420 (Rs 18,913.34) *+0.16%*
Mark Price:* $68.416
24H High:* $69.316
24H Low:* $65.060
24H Vol:* 6.53M HYPE / 438.47M USDT
*Technical Analysis (15m):*
HYPE showing strong bullish breakout today!
After a dip to near $68.09 around 12:47, buyers stepped in aggressively. Price formed a strong base around $68.25 and then started a clean uptrend, breaking out powerfully around 13:04 and making a new intraday high near $68.487.
Currently at *$68.417*, holding well *ABOVE MA60 at $68.227*. MA60 was flat earlier but is now turning up, supporting the bullish momentum. Price is consolidating after the spike, which is healthy.
Volume: Massive green volume spike at breakout (4.55K), highest of the day - confirms strong buyer interest. MA5 (2.21K) crossed above MA10 (1.59K) - bullish signal.
Performance: Today +1.33%, 180 Days +20.28%, 1 Year +77.80% - long term trend still very strong.
*Key Levels:*
Support: $68.329 / $68.251 (Breakout Zone) / $68.227 (MA60)
Resistance: $68.487 (Intraday High) / $69.316 (24H High)
As long as HYPE holds above $68.32, bulls are in control. A continuation above $68.487 could open path to $69+.
Strong momentum coin.
Not Financial Advice. DYOR.
#HYPE #Crypto #Binance #Altcoin
Last Price:* $68.420 (Rs 18,913.34) *+0.16%*
Mark Price:* $68.416
24H High:* $69.316
24H Low:* $65.060
24H Vol:* 6.53M HYPE / 438.47M USDT
*Technical Analysis (15m):*
HYPE showing strong bullish breakout today!
After a dip to near $68.09 around 12:47, buyers stepped in aggressively. Price formed a strong base around $68.25 and then started a clean uptrend, breaking out powerfully around 13:04 and making a new intraday high near $68.487.
Currently at *$68.417*, holding well *ABOVE MA60 at $68.227*. MA60 was flat earlier but is now turning up, supporting the bullish momentum. Price is consolidating after the spike, which is healthy.
Volume: Massive green volume spike at breakout (4.55K), highest of the day - confirms strong buyer interest. MA5 (2.21K) crossed above MA10 (1.59K) - bullish signal.
Performance: Today +1.33%, 180 Days +20.28%, 1 Year +77.80% - long term trend still very strong.
*Key Levels:*
Support: $68.329 / $68.251 (Breakout Zone) / $68.227 (MA60)
Resistance: $68.487 (Intraday High) / $69.316 (24H High)
As long as HYPE holds above $68.32, bulls are in control. A continuation above $68.487 could open path to $69+.
Strong momentum coin.
Not Financial Advice. DYOR.
#HYPE #Crypto #Binance #Altcoin
49
·
--
Bullish
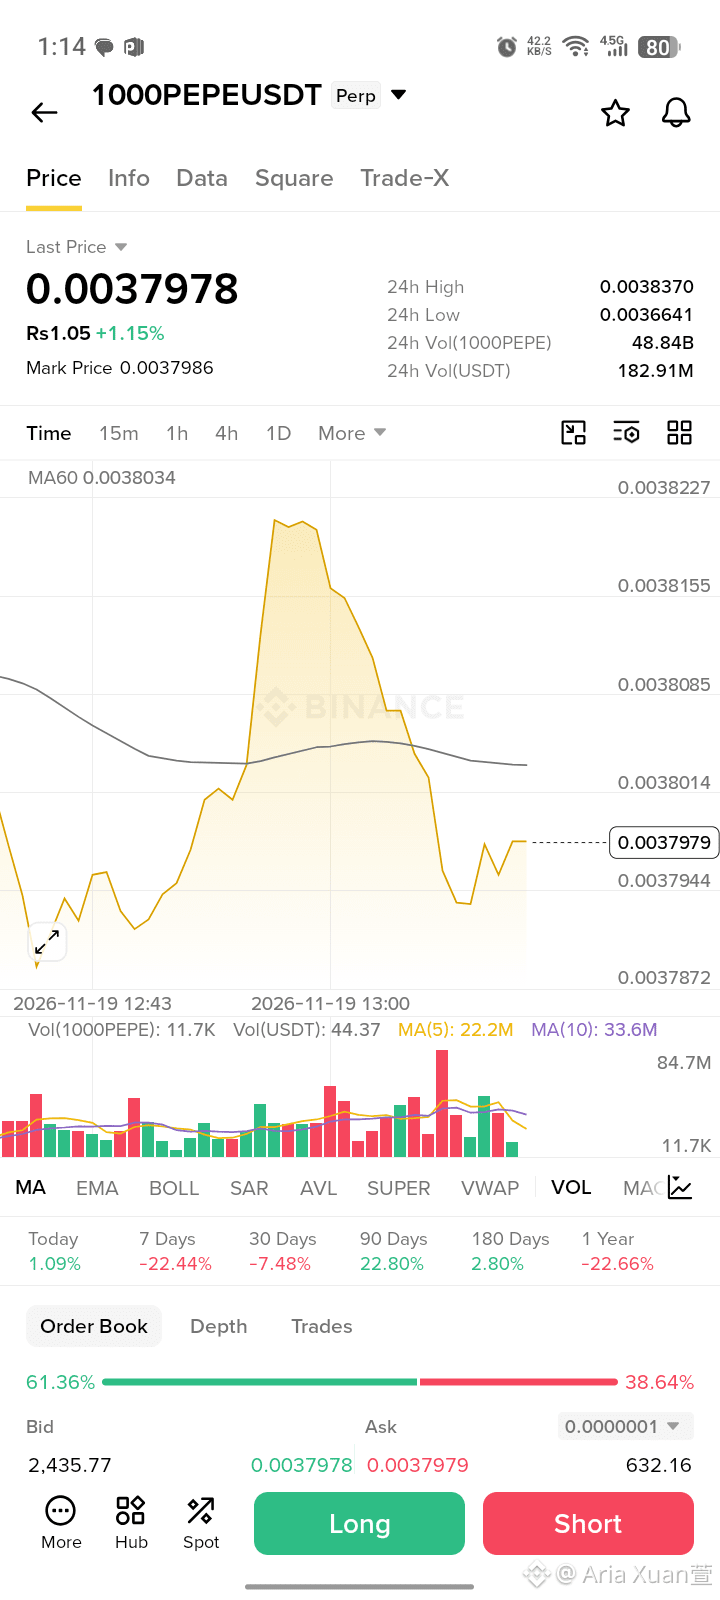
$1000PEPE / USDT Market Update | Nov 19, 2026*
Last Price:* $0.0037978 (Rs 1.05) *+1.15%*
Mark Price:* $0.0037986
24H High:* $0.0038370
24H Low:* $0.0036641
24H Vol:* 48.84B 1000PEPE / 182.91M USDT
*Technical Analysis (15m):*
1000PEPE saw a strong pump around 13:00, touching near 0.0038227, but then faced profit booking and corrected sharply. Now it's consolidating and trying to stabilize.
Currently at *$0.0037979*, trading just *below MA60 at $0.0038034*. MA60 is acting as immediate resistance and is sloping downwards, indicating short-term bearish pressure after the spike.
Chart pattern: After the pump, price made lower highs, but the last 3 candles show higher lows around $0.0037944 - sign of base formation. A tight consolidation phase.
Volume: Huge volume spike at the top (sell volume), now volume cooling off. Recent green bars show buyers accumulating at the low.
Performance: Today +1.09%, 90 Days +22.80% positive, but 7 Days -22.44% and 1 Year -22.66% shows volatility remains high.
*Key Levels:*
Support: $0.0037944 / $0.0037872
Resistance: $0.0038034 (MA60) / $0.0038085 / $0.0038155 / $0.0038227
Need to reclaim $0.0038034 to regain bullish momentum. If holds above $0.0037944, next leg up towards $0.0038155 possible.
Meme coin = High Volatility. Trade with caution.
{future}(1000PEPEUSDT)
Not Financial Advice. DYOR.
#1000PEPE #PEPE #Memecoin #Binance
$1000PEPE / USDT Market Update | Nov 19, 2026*
Last Price:* $0.0037978 (Rs 1.05) *+1.15%*
Mark Price:* $0.0037986
24H High:* $0.0038370
24H Low:* $0.0036641
24H Vol:* 48.84B 1000PEPE / 182.91M USDT
*Technical Analysis (15m):*
1000PEPE saw a strong pump around 13:00, touching near 0.0038227, but then faced profit booking and corrected sharply. Now it's consolidating and trying to stabilize.
Currently at *$0.0037979*, trading just *below MA60 at $0.0038034*. MA60 is acting as immediate resistance and is sloping downwards, indicating short-term bearish pressure after the spike.
Chart pattern: After the pump, price made lower highs, but the last 3 candles show higher lows around $0.0037944 - sign of base formation. A tight consolidation phase.
Volume: Huge volume spike at the top (sell volume), now volume cooling off. Recent green bars show buyers accumulating at the low.
Performance: Today +1.09%, 90 Days +22.80% positive, but 7 Days -22.44% and 1 Year -22.66% shows volatility remains high.
*Key Levels:*
Support: $0.0037944 / $0.0037872
Resistance: $0.0038034 (MA60) / $0.0038085 / $0.0038155 / $0.0038227
Need to reclaim $0.0038034 to regain bullish momentum. If holds above $0.0037944, next leg up towards $0.0038155 possible.
Meme coin = High Volatility. Trade with caution.
Not Financial Advice. DYOR.
#1000PEPE #PEPE #Memecoin #Binance
Last Price:* $0.0037978 (Rs 1.05) *+1.15%*
Mark Price:* $0.0037986
24H High:* $0.0038370
24H Low:* $0.0036641
24H Vol:* 48.84B 1000PEPE / 182.91M USDT
*Technical Analysis (15m):*
1000PEPE saw a strong pump around 13:00, touching near 0.0038227, but then faced profit booking and corrected sharply. Now it's consolidating and trying to stabilize.
Currently at *$0.0037979*, trading just *below MA60 at $0.0038034*. MA60 is acting as immediate resistance and is sloping downwards, indicating short-term bearish pressure after the spike.
Chart pattern: After the pump, price made lower highs, but the last 3 candles show higher lows around $0.0037944 - sign of base formation. A tight consolidation phase.
Volume: Huge volume spike at the top (sell volume), now volume cooling off. Recent green bars show buyers accumulating at the low.
Performance: Today +1.09%, 90 Days +22.80% positive, but 7 Days -22.44% and 1 Year -22.66% shows volatility remains high.
*Key Levels:*
Support: $0.0037944 / $0.0037872
Resistance: $0.0038034 (MA60) / $0.0038085 / $0.0038155 / $0.0038227
Need to reclaim $0.0038034 to regain bullish momentum. If holds above $0.0037944, next leg up towards $0.0038155 possible.
Meme coin = High Volatility. Trade with caution.
Not Financial Advice. DYOR.
#1000PEPE #PEPE #Memecoin #Binance
314
·
--
Bearish
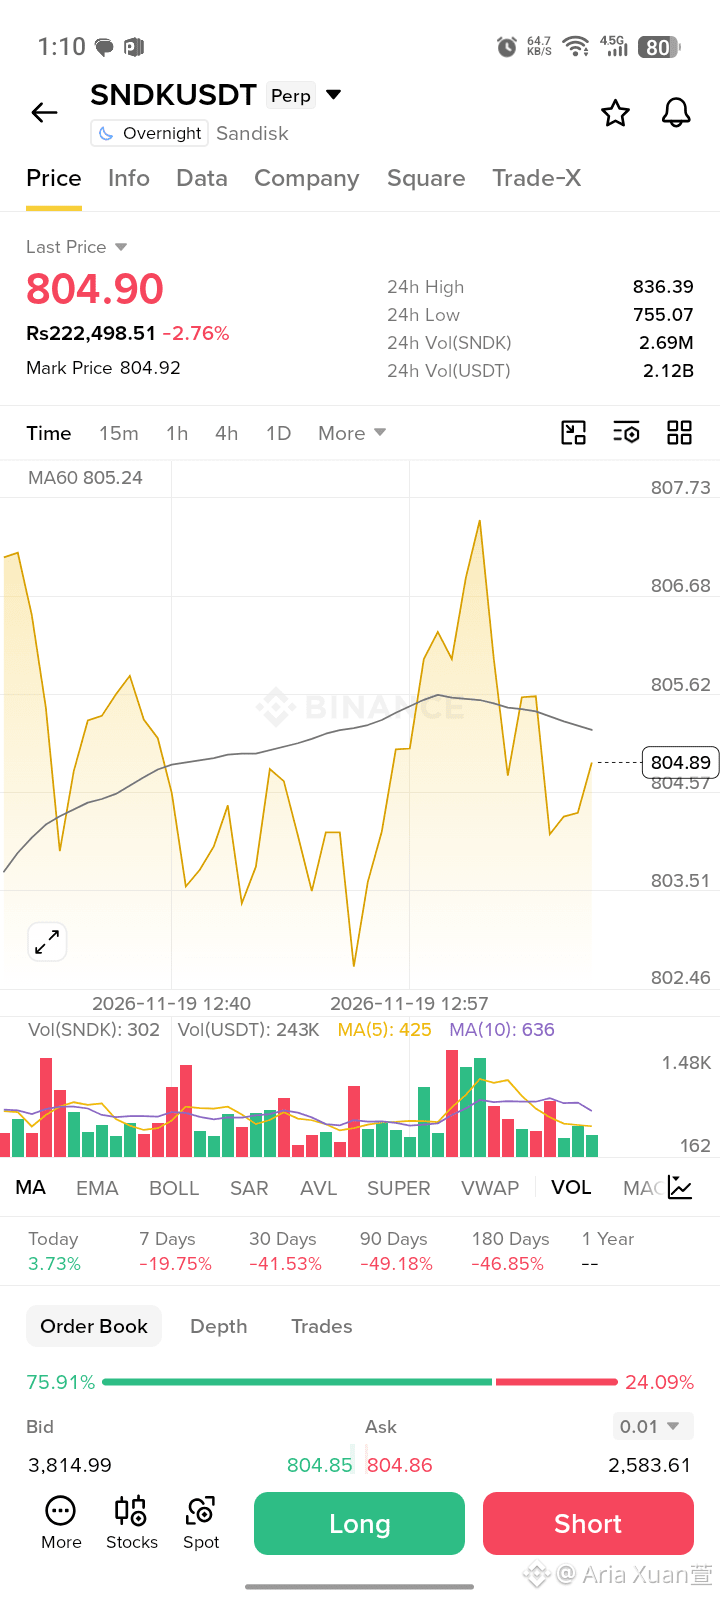
$SNDK / USDT Market Update | Nov 19, 2026*
Last Price:* $804.90 (Rs 222,498.51) *-2.76%*
Mark Price:* $804.92
24H High:* $836.39
24H Low:* $755.07
24H Vol:* 2.69M SNDK / 2.12B USDT
*Technical Analysis (15m):*
SNDK showing high volatility today. Price made a sharp crash to $802.46 around 12:57 and then gave a strong V-shaped recovery. Now it's trying to reclaim key levels.
Currently at *$804.89*, trading just *below MA60 at $805.24*. MA60 has flipped to resistance. The price was rejected from $807+ earlier and is now consolidating below the moving average.
Chart pattern: Double bottom formed near $802.50-803.00, followed by higher lows - a sign of buyers stepping in at dips. The recent bullish crossover in short-term MA (5) above MA (10) is positive.
Volume: Very high volume spike during the dip and recovery phase (12:57), showing strong fight between bulls and bears. Green volume is increasing in last few candles.
Performance: *Today +3.73%* - intraday recovery strong, but 7D -19.75%, 30D -41.53% shows it's still in broader correction.
*Key Levels:*
Support: $804.57 / $803.51 / $802.46 (Day Low)
Resistance: $805.24 (MA60) / $805.62 / $806.68 / $807.73
Break and close above $805.24 MA60 can open way to $806.68. Hold above $803.50 is crucial to maintain recovery.
High risk, high volatility - trade carefully.
{future}(SNDKUSDT)
Not Financial Advice. DYOR.
#SNDK #Crypto #Binance #Trading
$SNDK / USDT Market Update | Nov 19, 2026*
Last Price:* $804.90 (Rs 222,498.51) *-2.76%*
Mark Price:* $804.92
24H High:* $836.39
24H Low:* $755.07
24H Vol:* 2.69M SNDK / 2.12B USDT
*Technical Analysis (15m):*
SNDK showing high volatility today. Price made a sharp crash to $802.46 around 12:57 and then gave a strong V-shaped recovery. Now it's trying to reclaim key levels.
Currently at *$804.89*, trading just *below MA60 at $805.24*. MA60 has flipped to resistance. The price was rejected from $807+ earlier and is now consolidating below the moving average.
Chart pattern: Double bottom formed near $802.50-803.00, followed by higher lows - a sign of buyers stepping in at dips. The recent bullish crossover in short-term MA (5) above MA (10) is positive.
Volume: Very high volume spike during the dip and recovery phase (12:57), showing strong fight between bulls and bears. Green volume is increasing in last few candles.
Performance: *Today +3.73%* - intraday recovery strong, but 7D -19.75%, 30D -41.53% shows it's still in broader correction.
*Key Levels:*
Support: $804.57 / $803.51 / $802.46 (Day Low)
Resistance: $805.24 (MA60) / $805.62 / $806.68 / $807.73
Break and close above $805.24 MA60 can open way to $806.68. Hold above $803.50 is crucial to maintain recovery.
High risk, high volatility - trade carefully.
Not Financial Advice. DYOR.
#SNDK #Crypto #Binance #Trading
Last Price:* $804.90 (Rs 222,498.51) *-2.76%*
Mark Price:* $804.92
24H High:* $836.39
24H Low:* $755.07
24H Vol:* 2.69M SNDK / 2.12B USDT
*Technical Analysis (15m):*
SNDK showing high volatility today. Price made a sharp crash to $802.46 around 12:57 and then gave a strong V-shaped recovery. Now it's trying to reclaim key levels.
Currently at *$804.89*, trading just *below MA60 at $805.24*. MA60 has flipped to resistance. The price was rejected from $807+ earlier and is now consolidating below the moving average.
Chart pattern: Double bottom formed near $802.50-803.00, followed by higher lows - a sign of buyers stepping in at dips. The recent bullish crossover in short-term MA (5) above MA (10) is positive.
Volume: Very high volume spike during the dip and recovery phase (12:57), showing strong fight between bulls and bears. Green volume is increasing in last few candles.
Performance: *Today +3.73%* - intraday recovery strong, but 7D -19.75%, 30D -41.53% shows it's still in broader correction.
*Key Levels:*
Support: $804.57 / $803.51 / $802.46 (Day Low)
Resistance: $805.24 (MA60) / $805.62 / $806.68 / $807.73
Break and close above $805.24 MA60 can open way to $806.68. Hold above $803.50 is crucial to maintain recovery.
High risk, high volatility - trade carefully.
Not Financial Advice. DYOR.
#SNDK #Crypto #Binance #Trading
303
·
--
Bearish
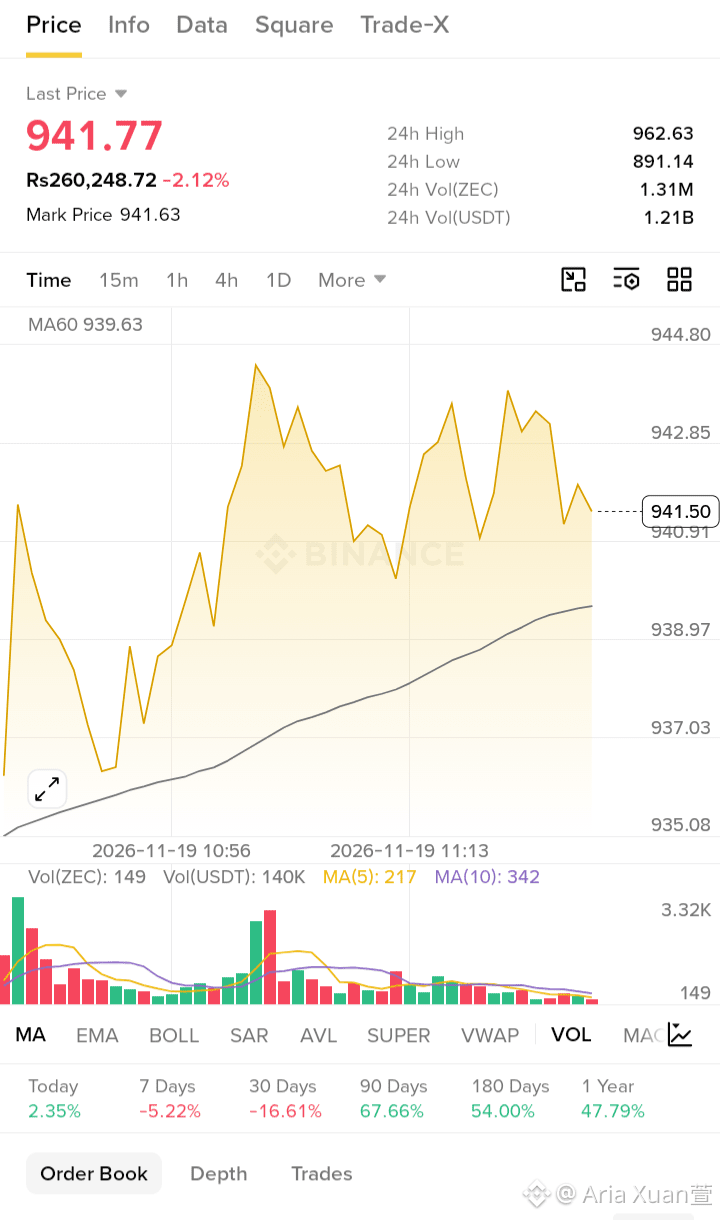
$ZEC / USDT Market Update | Nov 19, 2026*
Last Price:* $941.77 (Rs 260,248.72) *-2.12%*
Mark Price:* $941.63
24H High:* $962.63
24H Low:* $891.14
24H Vol:* 1.31M ZEC / 1.21B USDT
*Technical Analysis (15m):*
ZEC is consolidating after a strong rally. Price tested near $944.80 around 11:00 and is now in a tight range holding above key support.
Currently at *$941.50*, trading comfortably *ABOVE MA60 at $939.63*. MA60 is rising steadily which is a bullish sign - it has acted as strong support throughout the day. Price formed higher lows since the 10:56 dip.
Volume: High volume spike was seen at the breakout around 11:00, now volume is cooling down indicating healthy consolidation, not distribution. Low volume pullback is positive.
Performance: *Today +2.35% (Top Gainer)*, 90 Days +67.66%, 180 Days +54.00%, 1 Year +47.79% - Long term trend remains very strong despite short term correction.
*Key Levels:*
Support: $939.63 (MA60) / $938.97 / $937.03
Resistance: $942.85 / $944.80 / $962.63 (24H High)
As long as ZEC holds above $939.63 MA60, bulls remain in control. A breakout above $942.85 can target $944.80+.
Bullish structure intact.
{spot}(ZECUSDT)
Not Financial Advice. DYOR.
#ZEC #Zcash #ZECUSDT #Binance
$ZEC / USDT Market Update | Nov 19, 2026*
Last Price:* $941.77 (Rs 260,248.72) *-2.12%*
Mark Price:* $941.63
24H High:* $962.63
24H Low:* $891.14
24H Vol:* 1.31M ZEC / 1.21B USDT
*Technical Analysis (15m):*
ZEC is consolidating after a strong rally. Price tested near $944.80 around 11:00 and is now in a tight range holding above key support.
Currently at *$941.50*, trading comfortably *ABOVE MA60 at $939.63*. MA60 is rising steadily which is a bullish sign - it has acted as strong support throughout the day. Price formed higher lows since the 10:56 dip.
Volume: High volume spike was seen at the breakout around 11:00, now volume is cooling down indicating healthy consolidation, not distribution. Low volume pullback is positive.
Performance: *Today +2.35% (Top Gainer)*, 90 Days +67.66%, 180 Days +54.00%, 1 Year +47.79% - Long term trend remains very strong despite short term correction.
*Key Levels:*
Support: $939.63 (MA60) / $938.97 / $937.03
Resistance: $942.85 / $944.80 / $962.63 (24H High)
As long as ZEC holds above $939.63 MA60, bulls remain in control. A breakout above $942.85 can target $944.80+.
Bullish structure intact.
Not Financial Advice. DYOR.
#ZEC #Zcash #ZECUSDT #Binance
Last Price:* $941.77 (Rs 260,248.72) *-2.12%*
Mark Price:* $941.63
24H High:* $962.63
24H Low:* $891.14
24H Vol:* 1.31M ZEC / 1.21B USDT
*Technical Analysis (15m):*
ZEC is consolidating after a strong rally. Price tested near $944.80 around 11:00 and is now in a tight range holding above key support.
Currently at *$941.50*, trading comfortably *ABOVE MA60 at $939.63*. MA60 is rising steadily which is a bullish sign - it has acted as strong support throughout the day. Price formed higher lows since the 10:56 dip.
Volume: High volume spike was seen at the breakout around 11:00, now volume is cooling down indicating healthy consolidation, not distribution. Low volume pullback is positive.
Performance: *Today +2.35% (Top Gainer)*, 90 Days +67.66%, 180 Days +54.00%, 1 Year +47.79% - Long term trend remains very strong despite short term correction.
*Key Levels:*
Support: $939.63 (MA60) / $938.97 / $937.03
Resistance: $942.85 / $944.80 / $962.63 (24H High)
As long as ZEC holds above $939.63 MA60, bulls remain in control. A breakout above $942.85 can target $944.80+.
Bullish structure intact.
Not Financial Advice. DYOR.
#ZEC #Zcash #ZECUSDT #Binance
1
180
·
--
Bearish
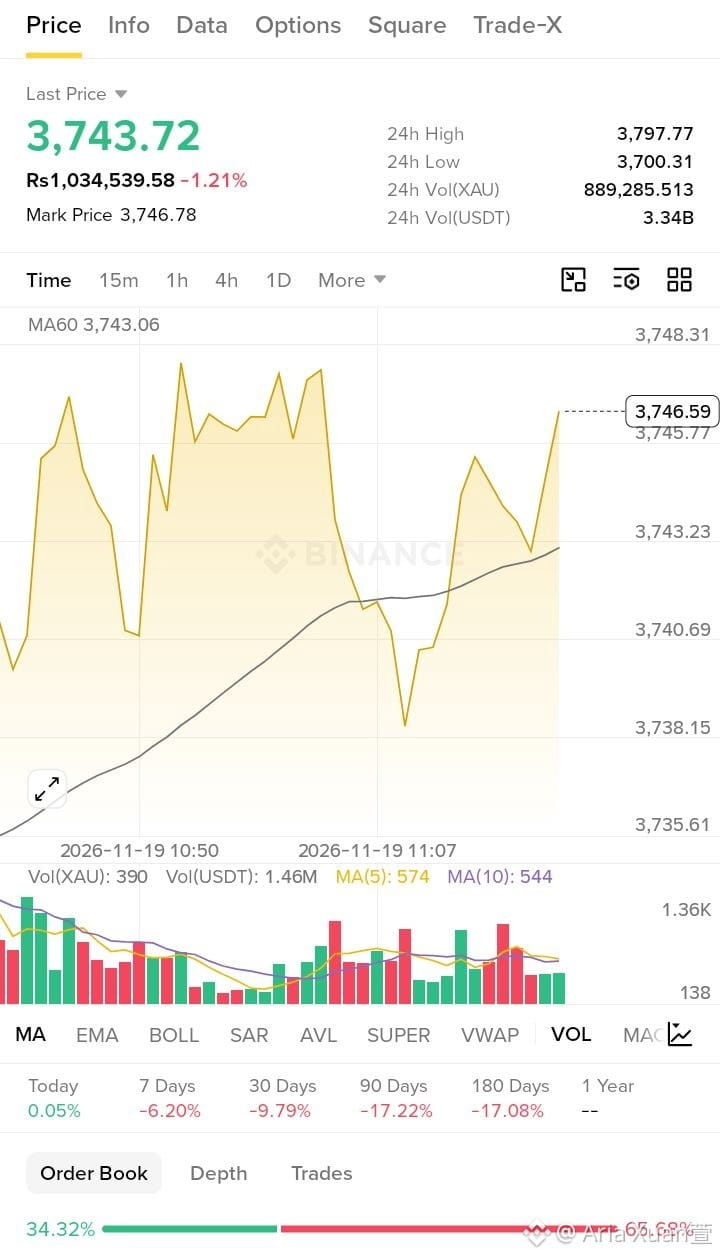
$XAU / USDT (Gold) Market Update | Nov 19, 2026*
*Last Price:* $3,743.72 (Rs 1,034,539.58) *-1.21%*
*Mark Price:* $3,746.78
*24H High:* $3,797.77
*24H Low:* $3,700.31
*24H Vol:* 889,285 XAU / 3.34B USDT
*Technical Analysis (15m):*
Gold showing strong recovery after a sharp dip. Price dropped to around $3,738 after testing highs near $3,748, but buyers defended strongly and pushed it back up.
Currently trading at *$3,746.59*, well *ABOVE MA60 at $3,743.06*. This is bullish. MA60 is rising steadily, acting as strong dynamic support. The chart structure shows higher lows formation.
Volume: Buyers returning with increasing green volume bars in last candles, confirming the bounce. Buy/Sell ratio 34.32% vs 65.68% shows sellers still have edge but buying pressure is increasing.
Performance: Today +0.05% flat but holding strong after recent correction (-6.20% in 7D).
*Key Levels:*
Support: $3,743.23 (MA60) / $3,740.69 / $3,738.15 (Dip Low)
Resistance: $3,748.31 / $3,797.77 (24H High)
If price sustains above $3,743, next target is $3,748 - $3,755. A breakdown below MA60 could trigger short-term pullback.
{future}(XAUUSDT)
Gold remains in strong uptrend on higher timeframe.
Not Financial Advice. DYOR.
#XAU #Gold #XAUUSDT #Binance
$XAU / USDT (Gold) Market Update | Nov 19, 2026*
*Last Price:* $3,743.72 (Rs 1,034,539.58) *-1.21%*
*Mark Price:* $3,746.78
*24H High:* $3,797.77
*24H Low:* $3,700.31
*24H Vol:* 889,285 XAU / 3.34B USDT
*Technical Analysis (15m):*
Gold showing strong recovery after a sharp dip. Price dropped to around $3,738 after testing highs near $3,748, but buyers defended strongly and pushed it back up.
Currently trading at *$3,746.59*, well *ABOVE MA60 at $3,743.06*. This is bullish. MA60 is rising steadily, acting as strong dynamic support. The chart structure shows higher lows formation.
Volume: Buyers returning with increasing green volume bars in last candles, confirming the bounce. Buy/Sell ratio 34.32% vs 65.68% shows sellers still have edge but buying pressure is increasing.
Performance: Today +0.05% flat but holding strong after recent correction (-6.20% in 7D).
*Key Levels:*
Support: $3,743.23 (MA60) / $3,740.69 / $3,738.15 (Dip Low)
Resistance: $3,748.31 / $3,797.77 (24H High)
If price sustains above $3,743, next target is $3,748 - $3,755. A breakdown below MA60 could trigger short-term pullback.
Gold remains in strong uptrend on higher timeframe.
Not Financial Advice. DYOR.
#XAU #Gold #XAUUSDT #Binance
*Last Price:* $3,743.72 (Rs 1,034,539.58) *-1.21%*
*Mark Price:* $3,746.78
*24H High:* $3,797.77
*24H Low:* $3,700.31
*24H Vol:* 889,285 XAU / 3.34B USDT
*Technical Analysis (15m):*
Gold showing strong recovery after a sharp dip. Price dropped to around $3,738 after testing highs near $3,748, but buyers defended strongly and pushed it back up.
Currently trading at *$3,746.59*, well *ABOVE MA60 at $3,743.06*. This is bullish. MA60 is rising steadily, acting as strong dynamic support. The chart structure shows higher lows formation.
Volume: Buyers returning with increasing green volume bars in last candles, confirming the bounce. Buy/Sell ratio 34.32% vs 65.68% shows sellers still have edge but buying pressure is increasing.
Performance: Today +0.05% flat but holding strong after recent correction (-6.20% in 7D).
*Key Levels:*
Support: $3,743.23 (MA60) / $3,740.69 / $3,738.15 (Dip Low)
Resistance: $3,748.31 / $3,797.77 (24H High)
If price sustains above $3,743, next target is $3,748 - $3,755. A breakdown below MA60 could trigger short-term pullback.
Gold remains in strong uptrend on higher timeframe.
Not Financial Advice. DYOR.
#XAU #Gold #XAUUSDT #Binance
57
·
--
Bearish
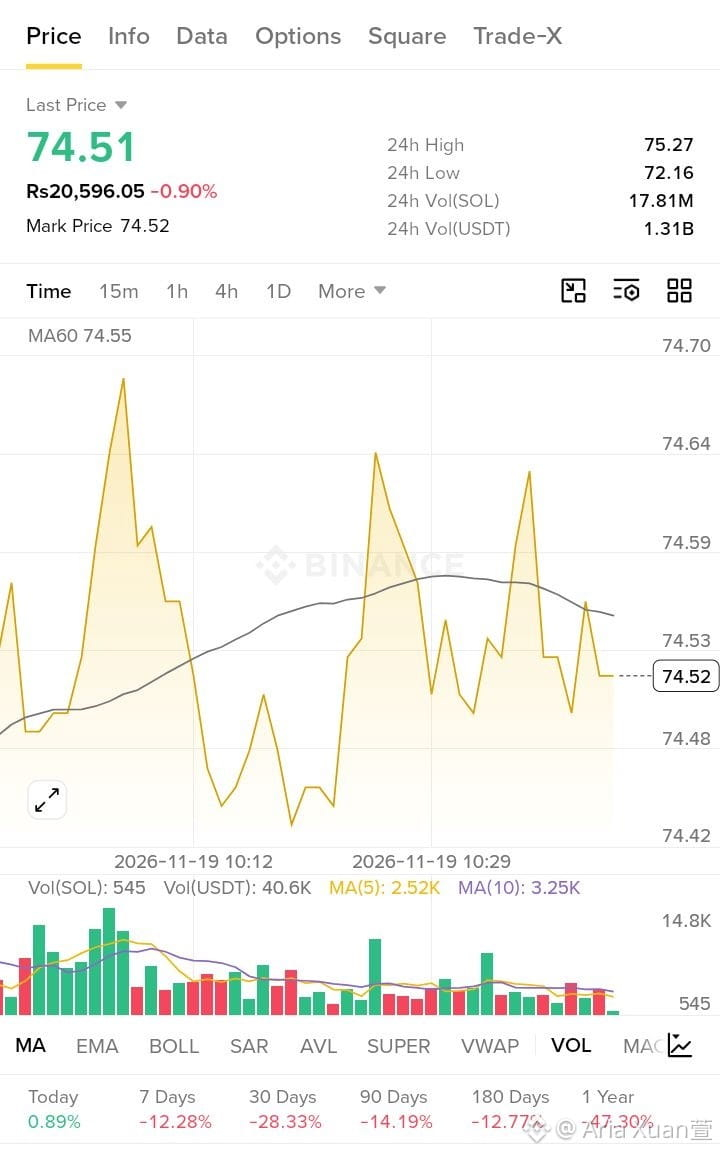
$SOL / USDT Market Update | Nov 19, 2026*
Last Price:* $74.51 (Rs 20,596.05) *-0.90%*
Mark Price:* $74.52
24H High:* $75.27
24H Low:* $72.16
24H Vol:* 17.81M SOL / 1.31B USDT
*Technical Analysis (15m):*
SOL is in a volatile, choppy session. After a strong spike to near $74.70 at 10:12, price faced heavy profit booking and dropped sharply. It then attempted two more recoveries around 10:29, forming lower highs.
Currently at *$74.52*, trading just *below MA60 at $74.55*. MA60 was support earlier but is now acting as resistance. The MA60 line has started to curve downwards, indicating short-term weakness.
Volume shows selling pressure is cooling down - volume bars are decreasing after the high volume spike earlier. This suggests consolidation before the next move.
Performance: Today +0.89% (green) but 7D -12.28% and 30D -28.33% - overall larger trend still in correction phase.
*Key Levels:*
Support: $74.48 / $74.42 (Intraday Low)
Resistance: $74.55 (MA60) / $74.64 / $74.70
Need to reclaim and close above $74.55 to regain bullish momentum. If not, a retest of $74.42 is possible.
{spot}(SOLUSDT)
Not Financial Advice.
#SOL #Solana #CryptoTrading #Binance
$SOL / USDT Market Update | Nov 19, 2026*
Last Price:* $74.51 (Rs 20,596.05) *-0.90%*
Mark Price:* $74.52
24H High:* $75.27
24H Low:* $72.16
24H Vol:* 17.81M SOL / 1.31B USDT
*Technical Analysis (15m):*
SOL is in a volatile, choppy session. After a strong spike to near $74.70 at 10:12, price faced heavy profit booking and dropped sharply. It then attempted two more recoveries around 10:29, forming lower highs.
Currently at *$74.52*, trading just *below MA60 at $74.55*. MA60 was support earlier but is now acting as resistance. The MA60 line has started to curve downwards, indicating short-term weakness.
Volume shows selling pressure is cooling down - volume bars are decreasing after the high volume spike earlier. This suggests consolidation before the next move.
Performance: Today +0.89% (green) but 7D -12.28% and 30D -28.33% - overall larger trend still in correction phase.
*Key Levels:*
Support: $74.48 / $74.42 (Intraday Low)
Resistance: $74.55 (MA60) / $74.64 / $74.70
Need to reclaim and close above $74.55 to regain bullish momentum. If not, a retest of $74.42 is possible.
Not Financial Advice.
#SOL #Solana #CryptoTrading #Binance
Last Price:* $74.51 (Rs 20,596.05) *-0.90%*
Mark Price:* $74.52
24H High:* $75.27
24H Low:* $72.16
24H Vol:* 17.81M SOL / 1.31B USDT
*Technical Analysis (15m):*
SOL is in a volatile, choppy session. After a strong spike to near $74.70 at 10:12, price faced heavy profit booking and dropped sharply. It then attempted two more recoveries around 10:29, forming lower highs.
Currently at *$74.52*, trading just *below MA60 at $74.55*. MA60 was support earlier but is now acting as resistance. The MA60 line has started to curve downwards, indicating short-term weakness.
Volume shows selling pressure is cooling down - volume bars are decreasing after the high volume spike earlier. This suggests consolidation before the next move.
Performance: Today +0.89% (green) but 7D -12.28% and 30D -28.33% - overall larger trend still in correction phase.
*Key Levels:*
Support: $74.48 / $74.42 (Intraday Low)
Resistance: $74.55 (MA60) / $74.64 / $74.70
Need to reclaim and close above $74.55 to regain bullish momentum. If not, a retest of $74.42 is possible.
Not Financial Advice.
#SOL #Solana #CryptoTrading #Binance
66
·
--
Bullish
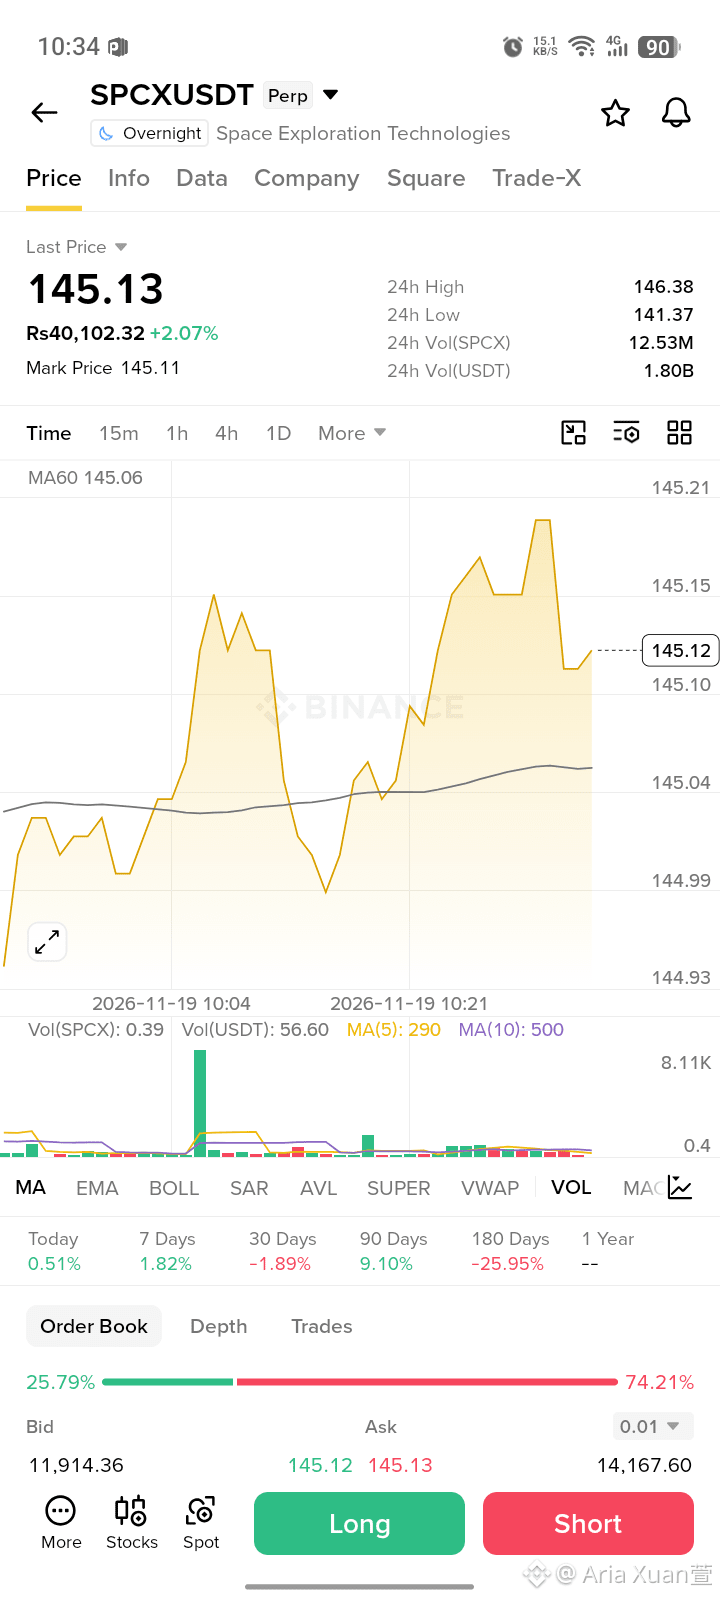
$SPCXB / USDT Market Update | Nov 19, 2026*
Last Price:* $145.13 (Rs 40,102.32) *+2.07%*
Mark Price:* $145.11
24H High:* $146.38
24H Low:* $141.37
24H Vol:* 12.53M SPCX / 1.80B USDT
SPCX is showing strong bullish momentum today and is one of the top gainers. Price made two strong impulsive moves - first spike around 10:04 to $145.12, then a second higher run around 10:21 testing $145.21.
Currently price is *$145.12*, holding firmly *ABOVE MA60 at $145.06*. This is a bullish sign. The MA60 line is sloping upwards, supporting the uptrend. The price is in a healthy consolidation after the second spike.
Volume: A massive green volume spike was seen during the first breakout, confirming buyer interest. Current volume is stable.
Performance: Today +0.51%, 7 Days +1.82%, 90 Days +9.10% - showing positive momentum in short to medium term.
Support: $145.06 (MA60) / $144.99
Resistance: $145.15 / $145.21 (Today's High) / $146.38 (24H High)
As long as price holds above $145.06, the bullish structure remains intact. A breakout above $145.21 could target $146.38.
{spot}(SPCXBUSDT)
NFA. DYOR.
#SPCX #crypto #Binance #Altcoin
$SPCXB / USDT Market Update | Nov 19, 2026*
Last Price:* $145.13 (Rs 40,102.32) *+2.07%*
Mark Price:* $145.11
24H High:* $146.38
24H Low:* $141.37
24H Vol:* 12.53M SPCX / 1.80B USDT
SPCX is showing strong bullish momentum today and is one of the top gainers. Price made two strong impulsive moves - first spike around 10:04 to $145.12, then a second higher run around 10:21 testing $145.21.
Currently price is *$145.12*, holding firmly *ABOVE MA60 at $145.06*. This is a bullish sign. The MA60 line is sloping upwards, supporting the uptrend. The price is in a healthy consolidation after the second spike.
Volume: A massive green volume spike was seen during the first breakout, confirming buyer interest. Current volume is stable.
Performance: Today +0.51%, 7 Days +1.82%, 90 Days +9.10% - showing positive momentum in short to medium term.
Support: $145.06 (MA60) / $144.99
Resistance: $145.15 / $145.21 (Today's High) / $146.38 (24H High)
As long as price holds above $145.06, the bullish structure remains intact. A breakout above $145.21 could target $146.38.
NFA. DYOR.
#SPCX #crypto #Binance #Altcoin
Last Price:* $145.13 (Rs 40,102.32) *+2.07%*
Mark Price:* $145.11
24H High:* $146.38
24H Low:* $141.37
24H Vol:* 12.53M SPCX / 1.80B USDT
SPCX is showing strong bullish momentum today and is one of the top gainers. Price made two strong impulsive moves - first spike around 10:04 to $145.12, then a second higher run around 10:21 testing $145.21.
Currently price is *$145.12*, holding firmly *ABOVE MA60 at $145.06*. This is a bullish sign. The MA60 line is sloping upwards, supporting the uptrend. The price is in a healthy consolidation after the second spike.
Volume: A massive green volume spike was seen during the first breakout, confirming buyer interest. Current volume is stable.
Performance: Today +0.51%, 7 Days +1.82%, 90 Days +9.10% - showing positive momentum in short to medium term.
Support: $145.06 (MA60) / $144.99
Resistance: $145.15 / $145.21 (Today's High) / $146.38 (24H High)
As long as price holds above $145.06, the bullish structure remains intact. A breakout above $145.21 could target $146.38.
NFA. DYOR.
#SPCX #crypto #Binance #Altcoin
78
·
--
Bearish
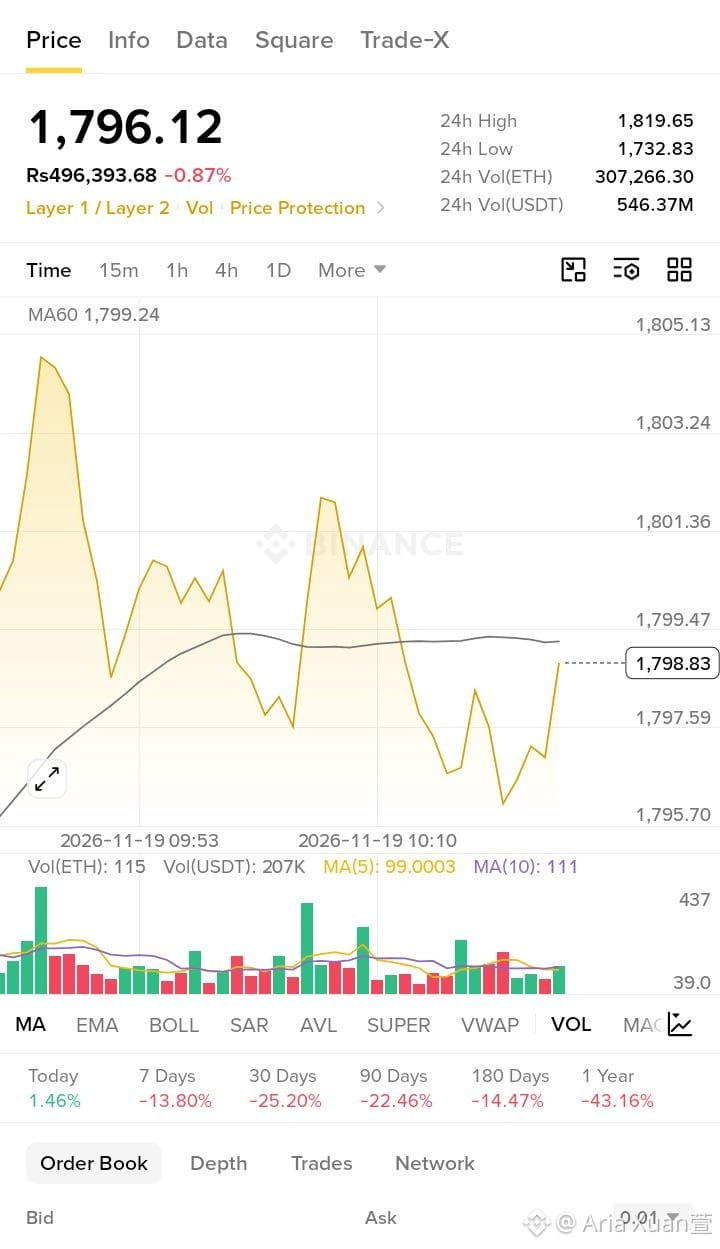
$ETH /USDT Market Update | Nov 19, 2026*
Price:* $1,796.12 (Rs 496,393.68) *-0.87%*
24H High:* $1,819.65
24H Low:* $1,732.83
24H Vol:* 307,266.30 ETH / 546.37M USDT
*Chart Analysis:*
ETH saw a strong spike earlier in the day and faced sharp rejection from the top. After that, price corrected and is now attempting a recovery.
Currently trading at *$1,798.83*, just below *MA60 at $1,799.24*. The MA60 line is acting as immediate resistance and has been flat, indicating consolidation.
On the 15m timeframe, ETH made a double-top structure around $1,805 and then dropped to $1,795.70 where buyers defended. The current bounce is backed by rising volume.
Performance: Today +1.46% but still down on higher timeframes (7D -13.80%, 30D -25.20%), showing this is a relief bounce within a downtrend.
*Key Levels:*
Support: $1,795.70 / $1,732.83 (24H Low)
Resistance: $1,799.24 (MA60) / $1,801.36 / $1,805.13
A clean breakout and close above $1,799.24 (MA60) can push ETH toward $1,803 - $1,805. Rejection from here could lead to another dip to $1,795.
{spot}(ETHUSDT)
Not Financial Advice. Do your own research.
#ETH #Ethereum #ETHUSDT #Crypto #Binance
$ETH /USDT Market Update | Nov 19, 2026*
Price:* $1,796.12 (Rs 496,393.68) *-0.87%*
24H High:* $1,819.65
24H Low:* $1,732.83
24H Vol:* 307,266.30 ETH / 546.37M USDT
*Chart Analysis:*
ETH saw a strong spike earlier in the day and faced sharp rejection from the top. After that, price corrected and is now attempting a recovery.
Currently trading at *$1,798.83*, just below *MA60 at $1,799.24*. The MA60 line is acting as immediate resistance and has been flat, indicating consolidation.
On the 15m timeframe, ETH made a double-top structure around $1,805 and then dropped to $1,795.70 where buyers defended. The current bounce is backed by rising volume.
Performance: Today +1.46% but still down on higher timeframes (7D -13.80%, 30D -25.20%), showing this is a relief bounce within a downtrend.
*Key Levels:*
Support: $1,795.70 / $1,732.83 (24H Low)
Resistance: $1,799.24 (MA60) / $1,801.36 / $1,805.13
A clean breakout and close above $1,799.24 (MA60) can push ETH toward $1,803 - $1,805. Rejection from here could lead to another dip to $1,795.
Not Financial Advice. Do your own research.
#ETH #Ethereum #ETHUSDT #Crypto #Binance
Price:* $1,796.12 (Rs 496,393.68) *-0.87%*
24H High:* $1,819.65
24H Low:* $1,732.83
24H Vol:* 307,266.30 ETH / 546.37M USDT
*Chart Analysis:*
ETH saw a strong spike earlier in the day and faced sharp rejection from the top. After that, price corrected and is now attempting a recovery.
Currently trading at *$1,798.83*, just below *MA60 at $1,799.24*. The MA60 line is acting as immediate resistance and has been flat, indicating consolidation.
On the 15m timeframe, ETH made a double-top structure around $1,805 and then dropped to $1,795.70 where buyers defended. The current bounce is backed by rising volume.
Performance: Today +1.46% but still down on higher timeframes (7D -13.80%, 30D -25.20%), showing this is a relief bounce within a downtrend.
*Key Levels:*
Support: $1,795.70 / $1,732.83 (24H Low)
Resistance: $1,799.24 (MA60) / $1,801.36 / $1,805.13
A clean breakout and close above $1,799.24 (MA60) can push ETH toward $1,803 - $1,805. Rejection from here could lead to another dip to $1,795.
Not Financial Advice. Do your own research.
#ETH #Ethereum #ETHUSDT #Crypto #Binance
246
·
--
Bearish
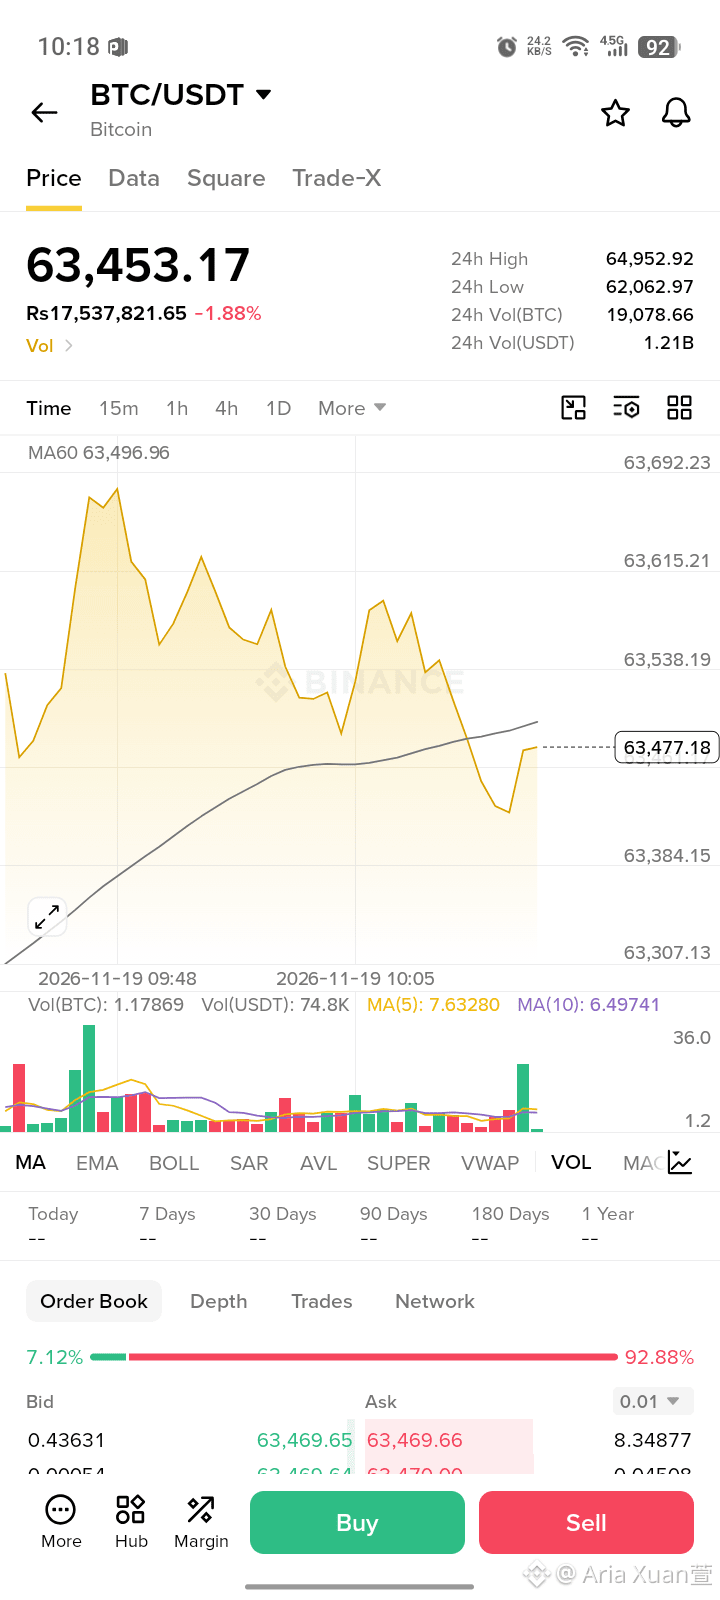
$BTC /USDT Market Update | Nov 19, 2026*
Price:* $63,453.17 (Rs 17,537,821.65) *-1.88%*
24H High:* $64,952.92
24H Low:* $62,062.97
24H Vol:* 19,078.66 BTC / 1.21B USDT
*Technical Analysis:*
BTC is showing a clear intraday correction after testing the $64,952 high. On the chart, price made a strong top around 09:48 and then formed lower highs, dropping to near $63,300 before a bounce.
Key level is *MA60 at $63,496.96*. Price is currently at $63,477.18, trading just below MA60. MA60 is acting as dynamic resistance. Until we get a strong close above $63,496, the short-term pressure remains.
Volume indicator shows a fresh green volume spike at the bottom, which indicates buyers are stepping in at the low. The buy/sell ratio is 7.12% vs 92.88%, showing heavy selling dominance but a possible reversal attempt.
*Levels to Watch:*
Immediate Support: $63,384 / $63,307
Immediate Resistance: $63,496 (MA60) / $63,538 / $63,615
Break above MA60 with volume can target $63,600+. If it fails, retest of $63,384 likely.
{spot}(BTCUSDT)
NFA - For educational purpose only. #BTC #Bitcoin #Crypto
$BTC /USDT Market Update | Nov 19, 2026*
Price:* $63,453.17 (Rs 17,537,821.65) *-1.88%*
24H High:* $64,952.92
24H Low:* $62,062.97
24H Vol:* 19,078.66 BTC / 1.21B USDT
*Technical Analysis:*
BTC is showing a clear intraday correction after testing the $64,952 high. On the chart, price made a strong top around 09:48 and then formed lower highs, dropping to near $63,300 before a bounce.
Key level is *MA60 at $63,496.96*. Price is currently at $63,477.18, trading just below MA60. MA60 is acting as dynamic resistance. Until we get a strong close above $63,496, the short-term pressure remains.
Volume indicator shows a fresh green volume spike at the bottom, which indicates buyers are stepping in at the low. The buy/sell ratio is 7.12% vs 92.88%, showing heavy selling dominance but a possible reversal attempt.
*Levels to Watch:*
Immediate Support: $63,384 / $63,307
Immediate Resistance: $63,496 (MA60) / $63,538 / $63,615
Break above MA60 with volume can target $63,600+. If it fails, retest of $63,384 likely.
NFA - For educational purpose only. #BTC #Bitcoin #Crypto
Price:* $63,453.17 (Rs 17,537,821.65) *-1.88%*
24H High:* $64,952.92
24H Low:* $62,062.97
24H Vol:* 19,078.66 BTC / 1.21B USDT
*Technical Analysis:*
BTC is showing a clear intraday correction after testing the $64,952 high. On the chart, price made a strong top around 09:48 and then formed lower highs, dropping to near $63,300 before a bounce.
Key level is *MA60 at $63,496.96*. Price is currently at $63,477.18, trading just below MA60. MA60 is acting as dynamic resistance. Until we get a strong close above $63,496, the short-term pressure remains.
Volume indicator shows a fresh green volume spike at the bottom, which indicates buyers are stepping in at the low. The buy/sell ratio is 7.12% vs 92.88%, showing heavy selling dominance but a possible reversal attempt.
*Levels to Watch:*
Immediate Support: $63,384 / $63,307
Immediate Resistance: $63,496 (MA60) / $63,538 / $63,615
Break above MA60 with volume can target $63,600+. If it fails, retest of $63,384 likely.
NFA - For educational purpose only. #BTC #Bitcoin #Crypto
97
·
--
Bullish
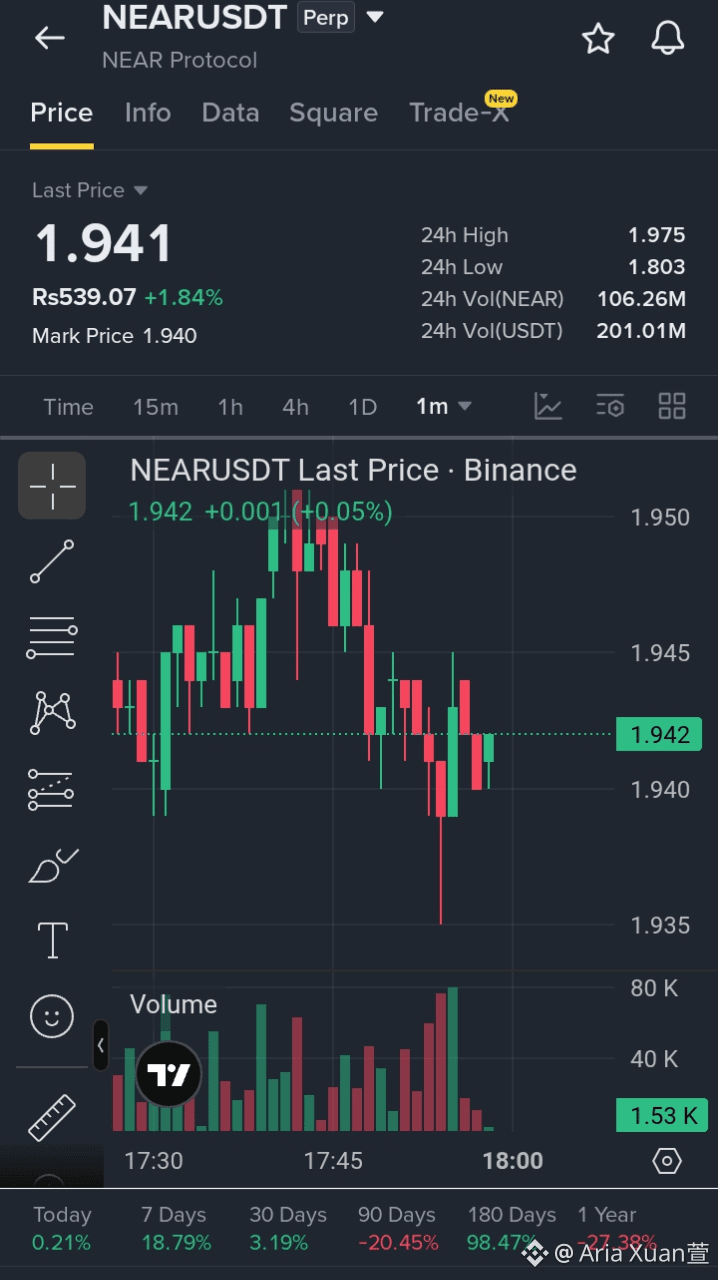
NEARUSDT CM 🌐
Rebound Setup ✅ NEAR Protocol holding +1.84% after dip to 1.935
Current: 1.941 📊
Entry: 1.940 - 1.942 🎯
Exit: 1.946 - 1.950 💰
SL: 1.936 ❌
Tip 1: 1m candles recovering from 1.935 wick with volume 1.53K. Wait for close above 1.944 to confirm upside ⚡
Tip 2: Resistance at 1.946. Break above targets 1.950 - 1.955. If 1.936 breaks, drop to 1.930 support 🔥
+1.84% on the day with 201.01M USDT volume. Range 1.803 - 1.975 active. Trade Here 👇
{future}(NEARUSDT)
#Near
NEARUSDT CM 🌐
Rebound Setup ✅ NEAR Protocol holding +1.84% after dip to 1.935
Current: 1.941 📊
Entry: 1.940 - 1.942 🎯
Exit: 1.946 - 1.950 💰
SL: 1.936 ❌
Tip 1: 1m candles recovering from 1.935 wick with volume 1.53K. Wait for close above 1.944 to confirm upside ⚡
Tip 2: Resistance at 1.946. Break above targets 1.950 - 1.955. If 1.936 breaks, drop to 1.930 support 🔥
+1.84% on the day with 201.01M USDT volume. Range 1.803 - 1.975 active. Trade Here 👇
#Near
Rebound Setup ✅ NEAR Protocol holding +1.84% after dip to 1.935
Current: 1.941 📊
Entry: 1.940 - 1.942 🎯
Exit: 1.946 - 1.950 💰
SL: 1.936 ❌
Tip 1: 1m candles recovering from 1.935 wick with volume 1.53K. Wait for close above 1.944 to confirm upside ⚡
Tip 2: Resistance at 1.946. Break above targets 1.950 - 1.955. If 1.936 breaks, drop to 1.930 support 🔥
+1.84% on the day with 201.01M USDT volume. Range 1.803 - 1.975 active. Trade Here 👇
#Near
100
·
--
Bullish
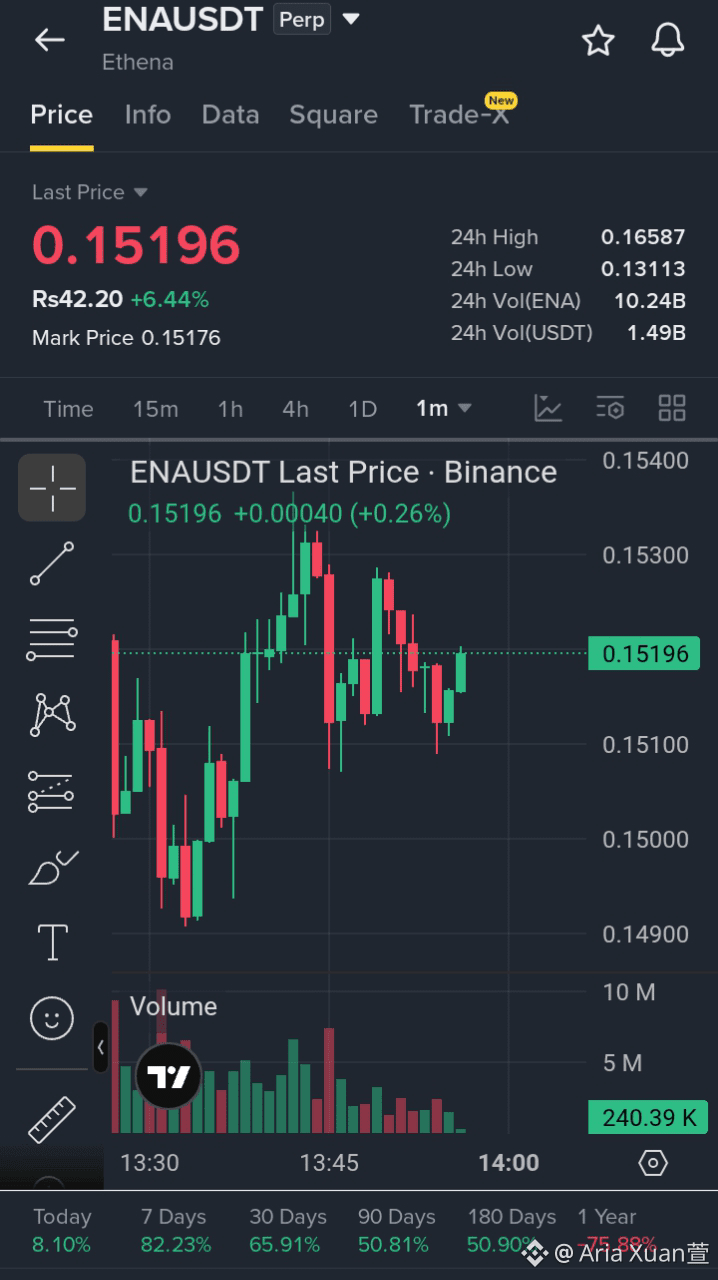
ENAUSDT CM 🔺
Bounce Setup ✅ Ethena holding +6.44% after reclaiming 0.15100
Current: 0.15196 📊
Entry: 0.15180 - 0.15200 🎯
Exit: 0.15280 - 0.15350 💰
SL: 0.15080 ❌
Tip 1: 1m candles bouncing from 0.15080 with volume 240.39K. Wait for close above 0.15220 to confirm next push ⚡
Tip 2: Resistance at 0.15300. Break above targets 0.15350 - 0.15400. If 0.15080 breaks, drop to 0.15000 support 🔥
+6.44% on the day with 1.49B USDT volume. Range 0.13113 - 0.16587 active. Trade Here 👇
{future}(ENAUSDT)
#ENA走势分析
ENAUSDT CM 🔺
Bounce Setup ✅ Ethena holding +6.44% after reclaiming 0.15100
Current: 0.15196 📊
Entry: 0.15180 - 0.15200 🎯
Exit: 0.15280 - 0.15350 💰
SL: 0.15080 ❌
Tip 1: 1m candles bouncing from 0.15080 with volume 240.39K. Wait for close above 0.15220 to confirm next push ⚡
Tip 2: Resistance at 0.15300. Break above targets 0.15350 - 0.15400. If 0.15080 breaks, drop to 0.15000 support 🔥
+6.44% on the day with 1.49B USDT volume. Range 0.13113 - 0.16587 active. Trade Here 👇
#ENA走势分析
Bounce Setup ✅ Ethena holding +6.44% after reclaiming 0.15100
Current: 0.15196 📊
Entry: 0.15180 - 0.15200 🎯
Exit: 0.15280 - 0.15350 💰
SL: 0.15080 ❌
Tip 1: 1m candles bouncing from 0.15080 with volume 240.39K. Wait for close above 0.15220 to confirm next push ⚡
Tip 2: Resistance at 0.15300. Break above targets 0.15350 - 0.15400. If 0.15080 breaks, drop to 0.15000 support 🔥
+6.44% on the day with 1.49B USDT volume. Range 0.13113 - 0.16587 active. Trade Here 👇
#ENA走势分析
143
·
--
Bullish
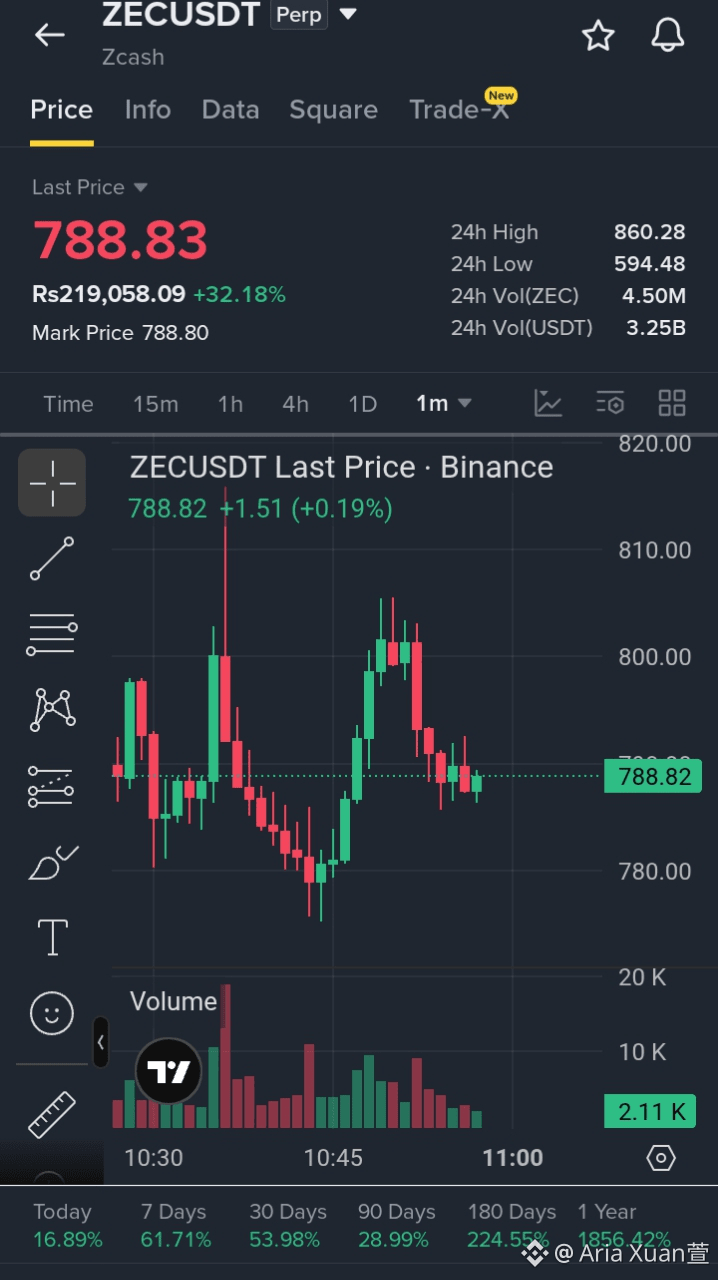
ZECUSDT CM 🛡️
Scalp Range Setup ✅ Zcash consolidating after wild +32.18% move
Current: 788.83 📊
Entry: 788.50 - 789.00 🎯
Exit: 795.00 - 800.00 💰
SL: 784.00 ❌
Tip 1: 1m candles chopping 788-800 with volume spike 2.11K. Wait for close above 790.00 to confirm upside ⚡
Tip 2: Resistance at 800.00. Break above targets 810.00 - 820.00. If 784.00 breaks, drop to 780.00 support 🔥
+32.18% on the day with 3.25B USDT volume. Range 594.48 - 860.28. High volatility trade. Trade Here 👇
{future}(ZECUSDT)
#ZECUSDT
ZECUSDT CM 🛡️
Scalp Range Setup ✅ Zcash consolidating after wild +32.18% move
Current: 788.83 📊
Entry: 788.50 - 789.00 🎯
Exit: 795.00 - 800.00 💰
SL: 784.00 ❌
Tip 1: 1m candles chopping 788-800 with volume spike 2.11K. Wait for close above 790.00 to confirm upside ⚡
Tip 2: Resistance at 800.00. Break above targets 810.00 - 820.00. If 784.00 breaks, drop to 780.00 support 🔥
+32.18% on the day with 3.25B USDT volume. Range 594.48 - 860.28. High volatility trade. Trade Here 👇
#ZECUSDT
Scalp Range Setup ✅ Zcash consolidating after wild +32.18% move
Current: 788.83 📊
Entry: 788.50 - 789.00 🎯
Exit: 795.00 - 800.00 💰
SL: 784.00 ❌
Tip 1: 1m candles chopping 788-800 with volume spike 2.11K. Wait for close above 790.00 to confirm upside ⚡
Tip 2: Resistance at 800.00. Break above targets 810.00 - 820.00. If 784.00 breaks, drop to 780.00 support 🔥
+32.18% on the day with 3.25B USDT volume. Range 594.48 - 860.28. High volatility trade. Trade Here 👇
#ZECUSDT
171
·
--
Bullish
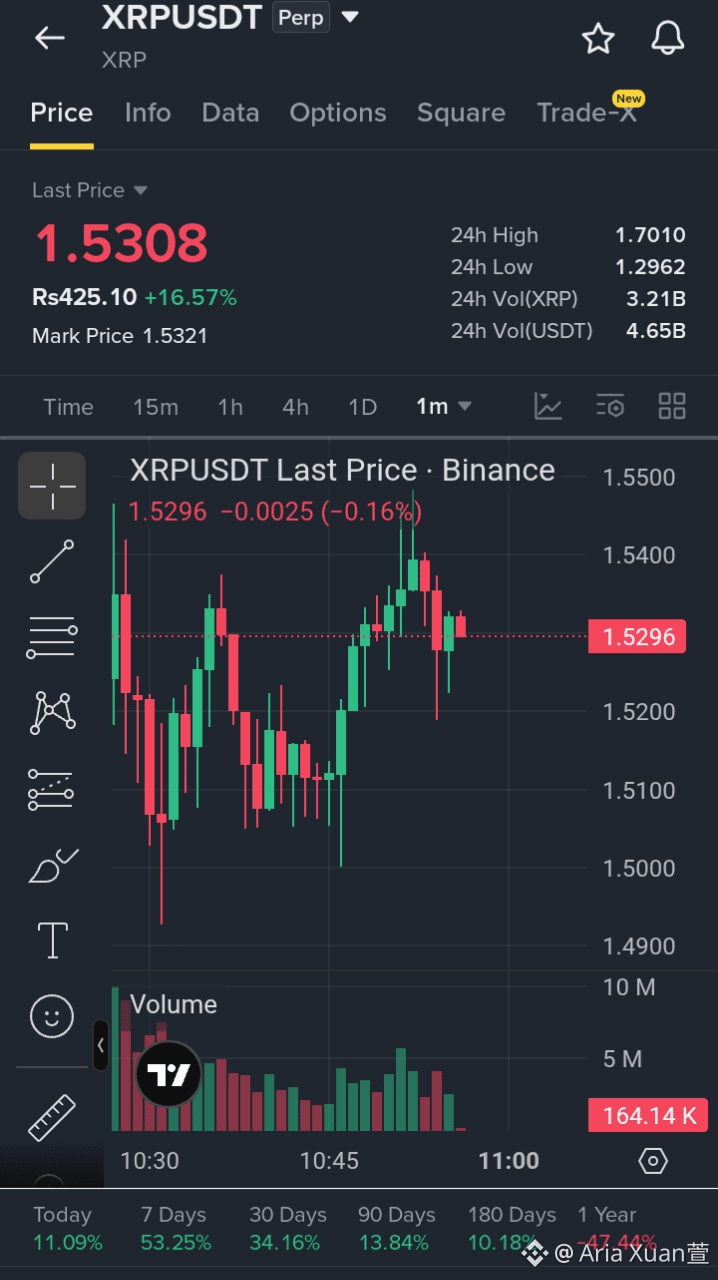
XRPUSDT CM ⚡
Breakout Watch Setup ✅ XRP holding gains +16.57% after massive run
Current: 1.5308 📊
Entry: 1.5290 - 1.5310 🎯
Exit: 1.5380 - 1.5500 💰
SL: 1.5200 ❌
Tip 1: 1m candles consolidating under 1.5400 with volume 164K. Wait for close above 1.5320 to confirm next push ⚡
Tip 2: Resistance at 1.5500. Break above targets 1.5600 - 1.5700. If 1.5200 breaks, pullback to 1.5100 support 🔥
+16.57% on the day with 4.65B USDT volume. Range 1.2962 - 1.7010 wide. Trade Here 👇
{future}(XRPUSDT)
#xrp
XRPUSDT CM ⚡
Breakout Watch Setup ✅ XRP holding gains +16.57% after massive run
Current: 1.5308 📊
Entry: 1.5290 - 1.5310 🎯
Exit: 1.5380 - 1.5500 💰
SL: 1.5200 ❌
Tip 1: 1m candles consolidating under 1.5400 with volume 164K. Wait for close above 1.5320 to confirm next push ⚡
Tip 2: Resistance at 1.5500. Break above targets 1.5600 - 1.5700. If 1.5200 breaks, pullback to 1.5100 support 🔥
+16.57% on the day with 4.65B USDT volume. Range 1.2962 - 1.7010 wide. Trade Here 👇
#xrp
Breakout Watch Setup ✅ XRP holding gains +16.57% after massive run
Current: 1.5308 📊
Entry: 1.5290 - 1.5310 🎯
Exit: 1.5380 - 1.5500 💰
SL: 1.5200 ❌
Tip 1: 1m candles consolidating under 1.5400 with volume 164K. Wait for close above 1.5320 to confirm next push ⚡
Tip 2: Resistance at 1.5500. Break above targets 1.5600 - 1.5700. If 1.5200 breaks, pullback to 1.5100 support 🔥
+16.57% on the day with 4.65B USDT volume. Range 1.2962 - 1.7010 wide. Trade Here 👇
#xrp
1
177
·
--
Bullish
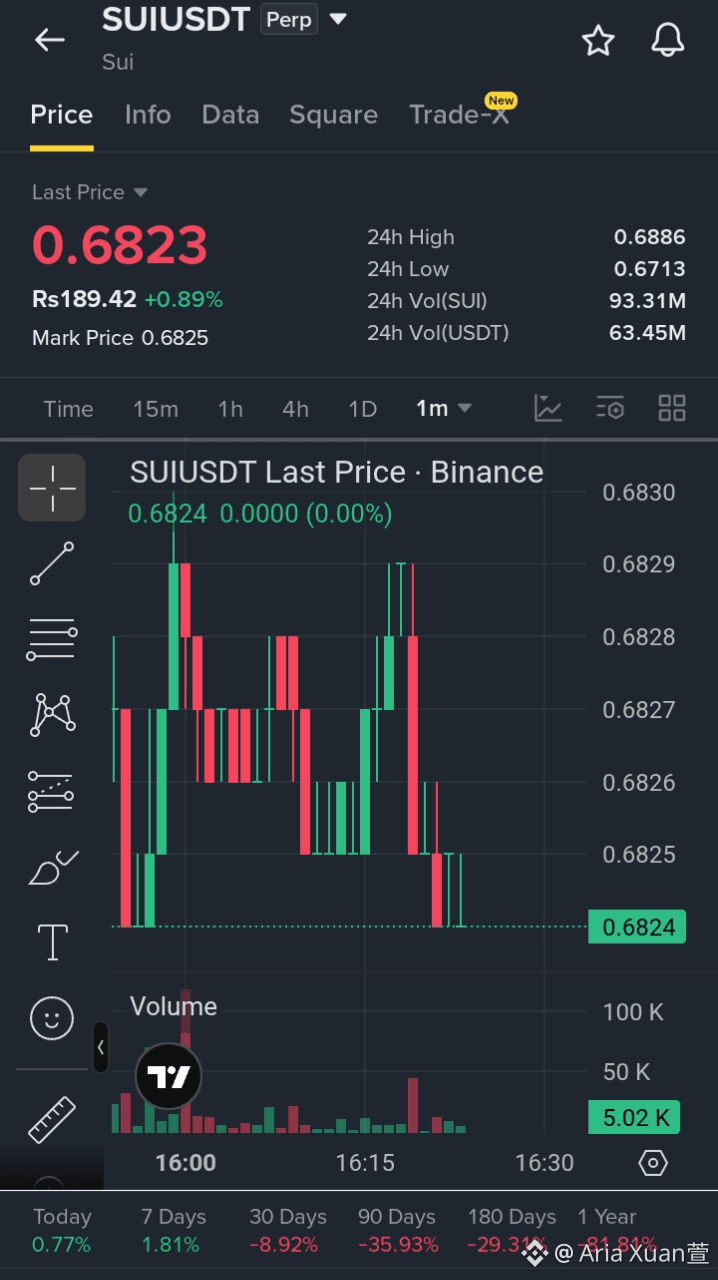
SUIUSDT CM 🔷
Scalp Setup ✅ SUI holding near 0.6886 high after small dip
Current: 0.6823 📊
Entry: 0.6820 - 0.6825 🎯
Exit: 0.6850 - 0.6886 💰
SL: 0.6800 ❌
Tip 1: 1m candles tight between 0.6825-0.6829 with volume 5.02K. Wait for close above 0.6829 to confirm push ⚡
Tip 2: Resistance at 0.6886. Break above targets 0.6900 - 0.6950. If 0.6800 breaks, drop to 0.6780 support 🔥
+0.89% on the day with 63.45M USDT volume. Structure neutral in 0.6713 - 0.6886 range. Trade Here 👇
{future}(SUIUSDT)
#SUIU
SUIUSDT CM 🔷
Scalp Setup ✅ SUI holding near 0.6886 high after small dip
Current: 0.6823 📊
Entry: 0.6820 - 0.6825 🎯
Exit: 0.6850 - 0.6886 💰
SL: 0.6800 ❌
Tip 1: 1m candles tight between 0.6825-0.6829 with volume 5.02K. Wait for close above 0.6829 to confirm push ⚡
Tip 2: Resistance at 0.6886. Break above targets 0.6900 - 0.6950. If 0.6800 breaks, drop to 0.6780 support 🔥
+0.89% on the day with 63.45M USDT volume. Structure neutral in 0.6713 - 0.6886 range. Trade Here 👇
#SUIU
Scalp Setup ✅ SUI holding near 0.6886 high after small dip
Current: 0.6823 📊
Entry: 0.6820 - 0.6825 🎯
Exit: 0.6850 - 0.6886 💰
SL: 0.6800 ❌
Tip 1: 1m candles tight between 0.6825-0.6829 with volume 5.02K. Wait for close above 0.6829 to confirm push ⚡
Tip 2: Resistance at 0.6886. Break above targets 0.6900 - 0.6950. If 0.6800 breaks, drop to 0.6780 support 🔥
+0.89% on the day with 63.45M USDT volume. Structure neutral in 0.6713 - 0.6886 range. Trade Here 👇
#SUIU
111
·
--
Bullish
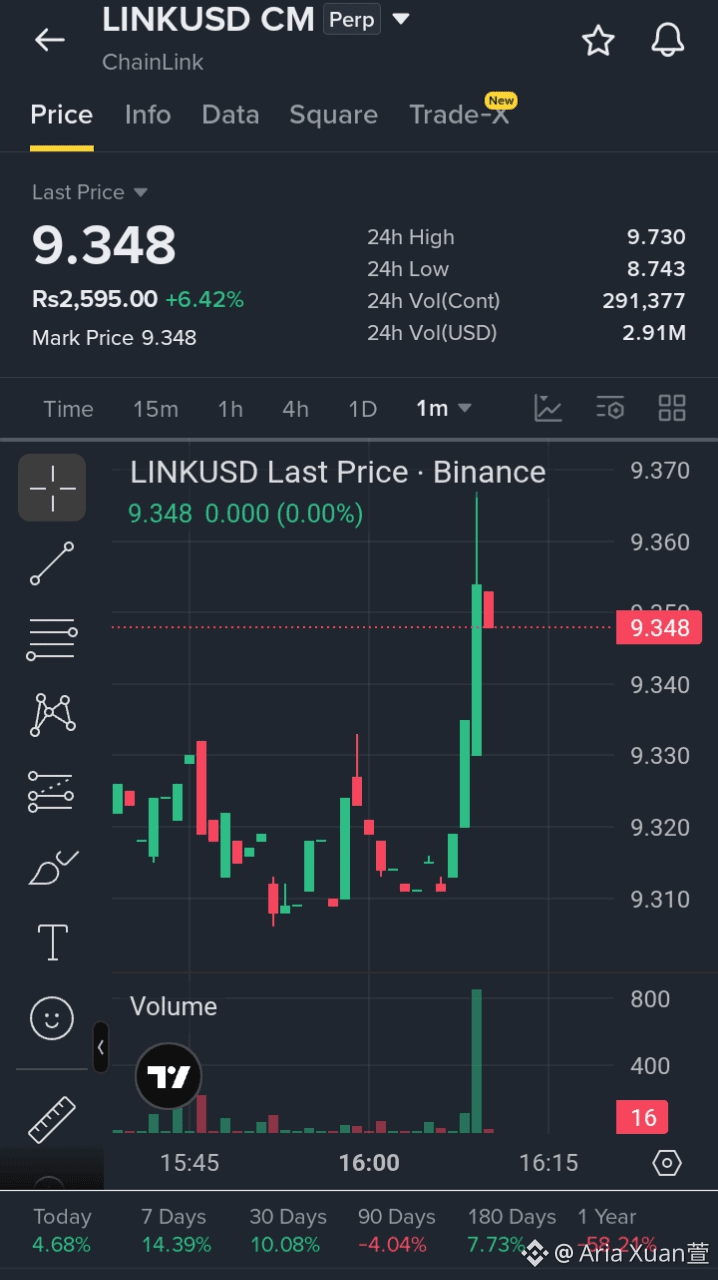
LINKUSD CM 🔗
Momentum Play Setup ✅ Chainlink ripping +6.42% toward 9.730 high
Current: 9.348 📊
Entry: 9.340 - 9.350 🎯
Exit: 9.450 - 9.730 💰
SL: 9.280 ❌
Tip 1: 1m candles showing volume spike 800+. Wait for close above 9.360 to confirm next leg up ⚡
Tip 2: Resistance at 9.730. Break above targets 9.800 - 9.900. If 9.280 breaks, pullback to 9.200 support 🔥
+6.42% on the day with 2.91M USD volume. Strong structure from 8.743 low. Trade Here 👇
{future}(LINKUSDT)
#LİNK
LINKUSD CM 🔗
Momentum Play Setup ✅ Chainlink ripping +6.42% toward 9.730 high
Current: 9.348 📊
Entry: 9.340 - 9.350 🎯
Exit: 9.450 - 9.730 💰
SL: 9.280 ❌
Tip 1: 1m candles showing volume spike 800+. Wait for close above 9.360 to confirm next leg up ⚡
Tip 2: Resistance at 9.730. Break above targets 9.800 - 9.900. If 9.280 breaks, pullback to 9.200 support 🔥
+6.42% on the day with 2.91M USD volume. Strong structure from 8.743 low. Trade Here 👇
#LİNK
Momentum Play Setup ✅ Chainlink ripping +6.42% toward 9.730 high
Current: 9.348 📊
Entry: 9.340 - 9.350 🎯
Exit: 9.450 - 9.730 💰
SL: 9.280 ❌
Tip 1: 1m candles showing volume spike 800+. Wait for close above 9.360 to confirm next leg up ⚡
Tip 2: Resistance at 9.730. Break above targets 9.800 - 9.900. If 9.280 breaks, pullback to 9.200 support 🔥
+6.42% on the day with 2.91M USD volume. Strong structure from 8.743 low. Trade Here 👇
#LİNK
89
·
--
Bullish
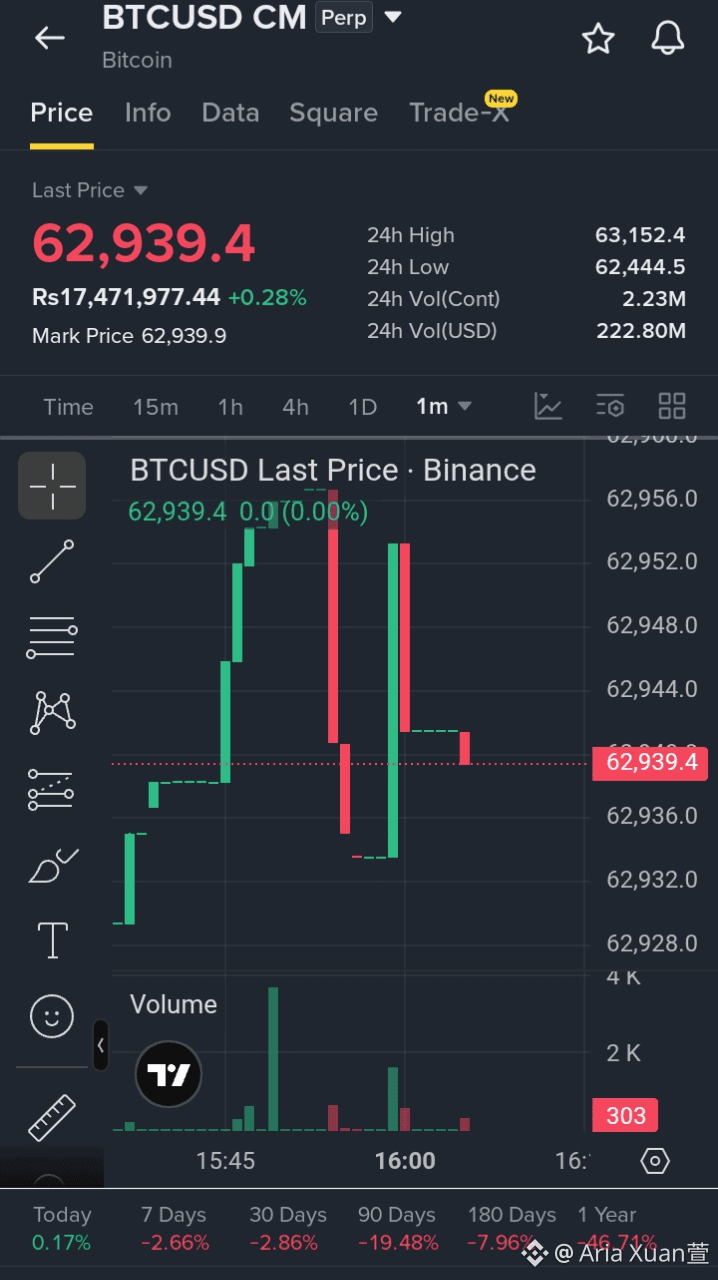
BTCUSD CM ₿
Scalp Range Setup ✅ Bitcoin consolidating between 62,444 - 63,152
Current: 62,939.4 📊
Entry: 62,930 - 62,940 🎯
Exit: 63,050 - 63,152 💰
SL: 62,850 ❌
Tip 1: 1m candles chopping with volume spike 303. Wait for close above 62,952 to confirm upside push ⚡
Tip 2: Resistance at 63,152.4. Break above targets 63,250. If 62,850 breaks, drop to 62,700 support 🔥
+0.28% on the day with 222.80M USD volume. Structure neutral, waiting for direction. Trade Here 👇
{future}(BTCUSDT)
#BTC☀
BTCUSD CM ₿
Scalp Range Setup ✅ Bitcoin consolidating between 62,444 - 63,152
Current: 62,939.4 📊
Entry: 62,930 - 62,940 🎯
Exit: 63,050 - 63,152 💰
SL: 62,850 ❌
Tip 1: 1m candles chopping with volume spike 303. Wait for close above 62,952 to confirm upside push ⚡
Tip 2: Resistance at 63,152.4. Break above targets 63,250. If 62,850 breaks, drop to 62,700 support 🔥
+0.28% on the day with 222.80M USD volume. Structure neutral, waiting for direction. Trade Here 👇
#BTC☀
Scalp Range Setup ✅ Bitcoin consolidating between 62,444 - 63,152
Current: 62,939.4 📊
Entry: 62,930 - 62,940 🎯
Exit: 63,050 - 63,152 💰
SL: 62,850 ❌
Tip 1: 1m candles chopping with volume spike 303. Wait for close above 62,952 to confirm upside push ⚡
Tip 2: Resistance at 63,152.4. Break above targets 63,250. If 62,850 breaks, drop to 62,700 support 🔥
+0.28% on the day with 222.80M USD volume. Structure neutral, waiting for direction. Trade Here 👇
#BTC☀
109
Log in to explore more content
Join global crypto users on Binance Square
⚡️ Get latest and useful information about crypto.
💬 Trusted by the world’s largest crypto exchange.
👍 Discover real insights from verified creators.
Email / Phone number
Trending Topics
IsAnthropic’s$1.5TMarketCapJustified?
230 views
9 Discussing
Anthropic Set to Open at $105 in Record Nasdaq Debut
Binance News
·0 Likes
·544 views
BTCRemainsUnderPressureAfterHawkishFOMCMinutes
149,988 views
1,676 Discussing
NvidiaBoardReportedlySplitOverHuang’sReturn
70,454 views
862 Discussing