Daily share
The big coin reached a low of 87577 this morning. Although it did not break 87500, it should be considered that the probability of a short-term drop at the 4-hour level is very high. After the 4-hour level drop is complete, we can then judge the specific situation of the next daily level rebound. The overall medium and short-term thinking remains unchanged; currently, we are looking bearish. Once the 4-hour level drop is complete, we will look for a rebound at the daily level for about 2 months.
BTC medium to long term
Weekly:
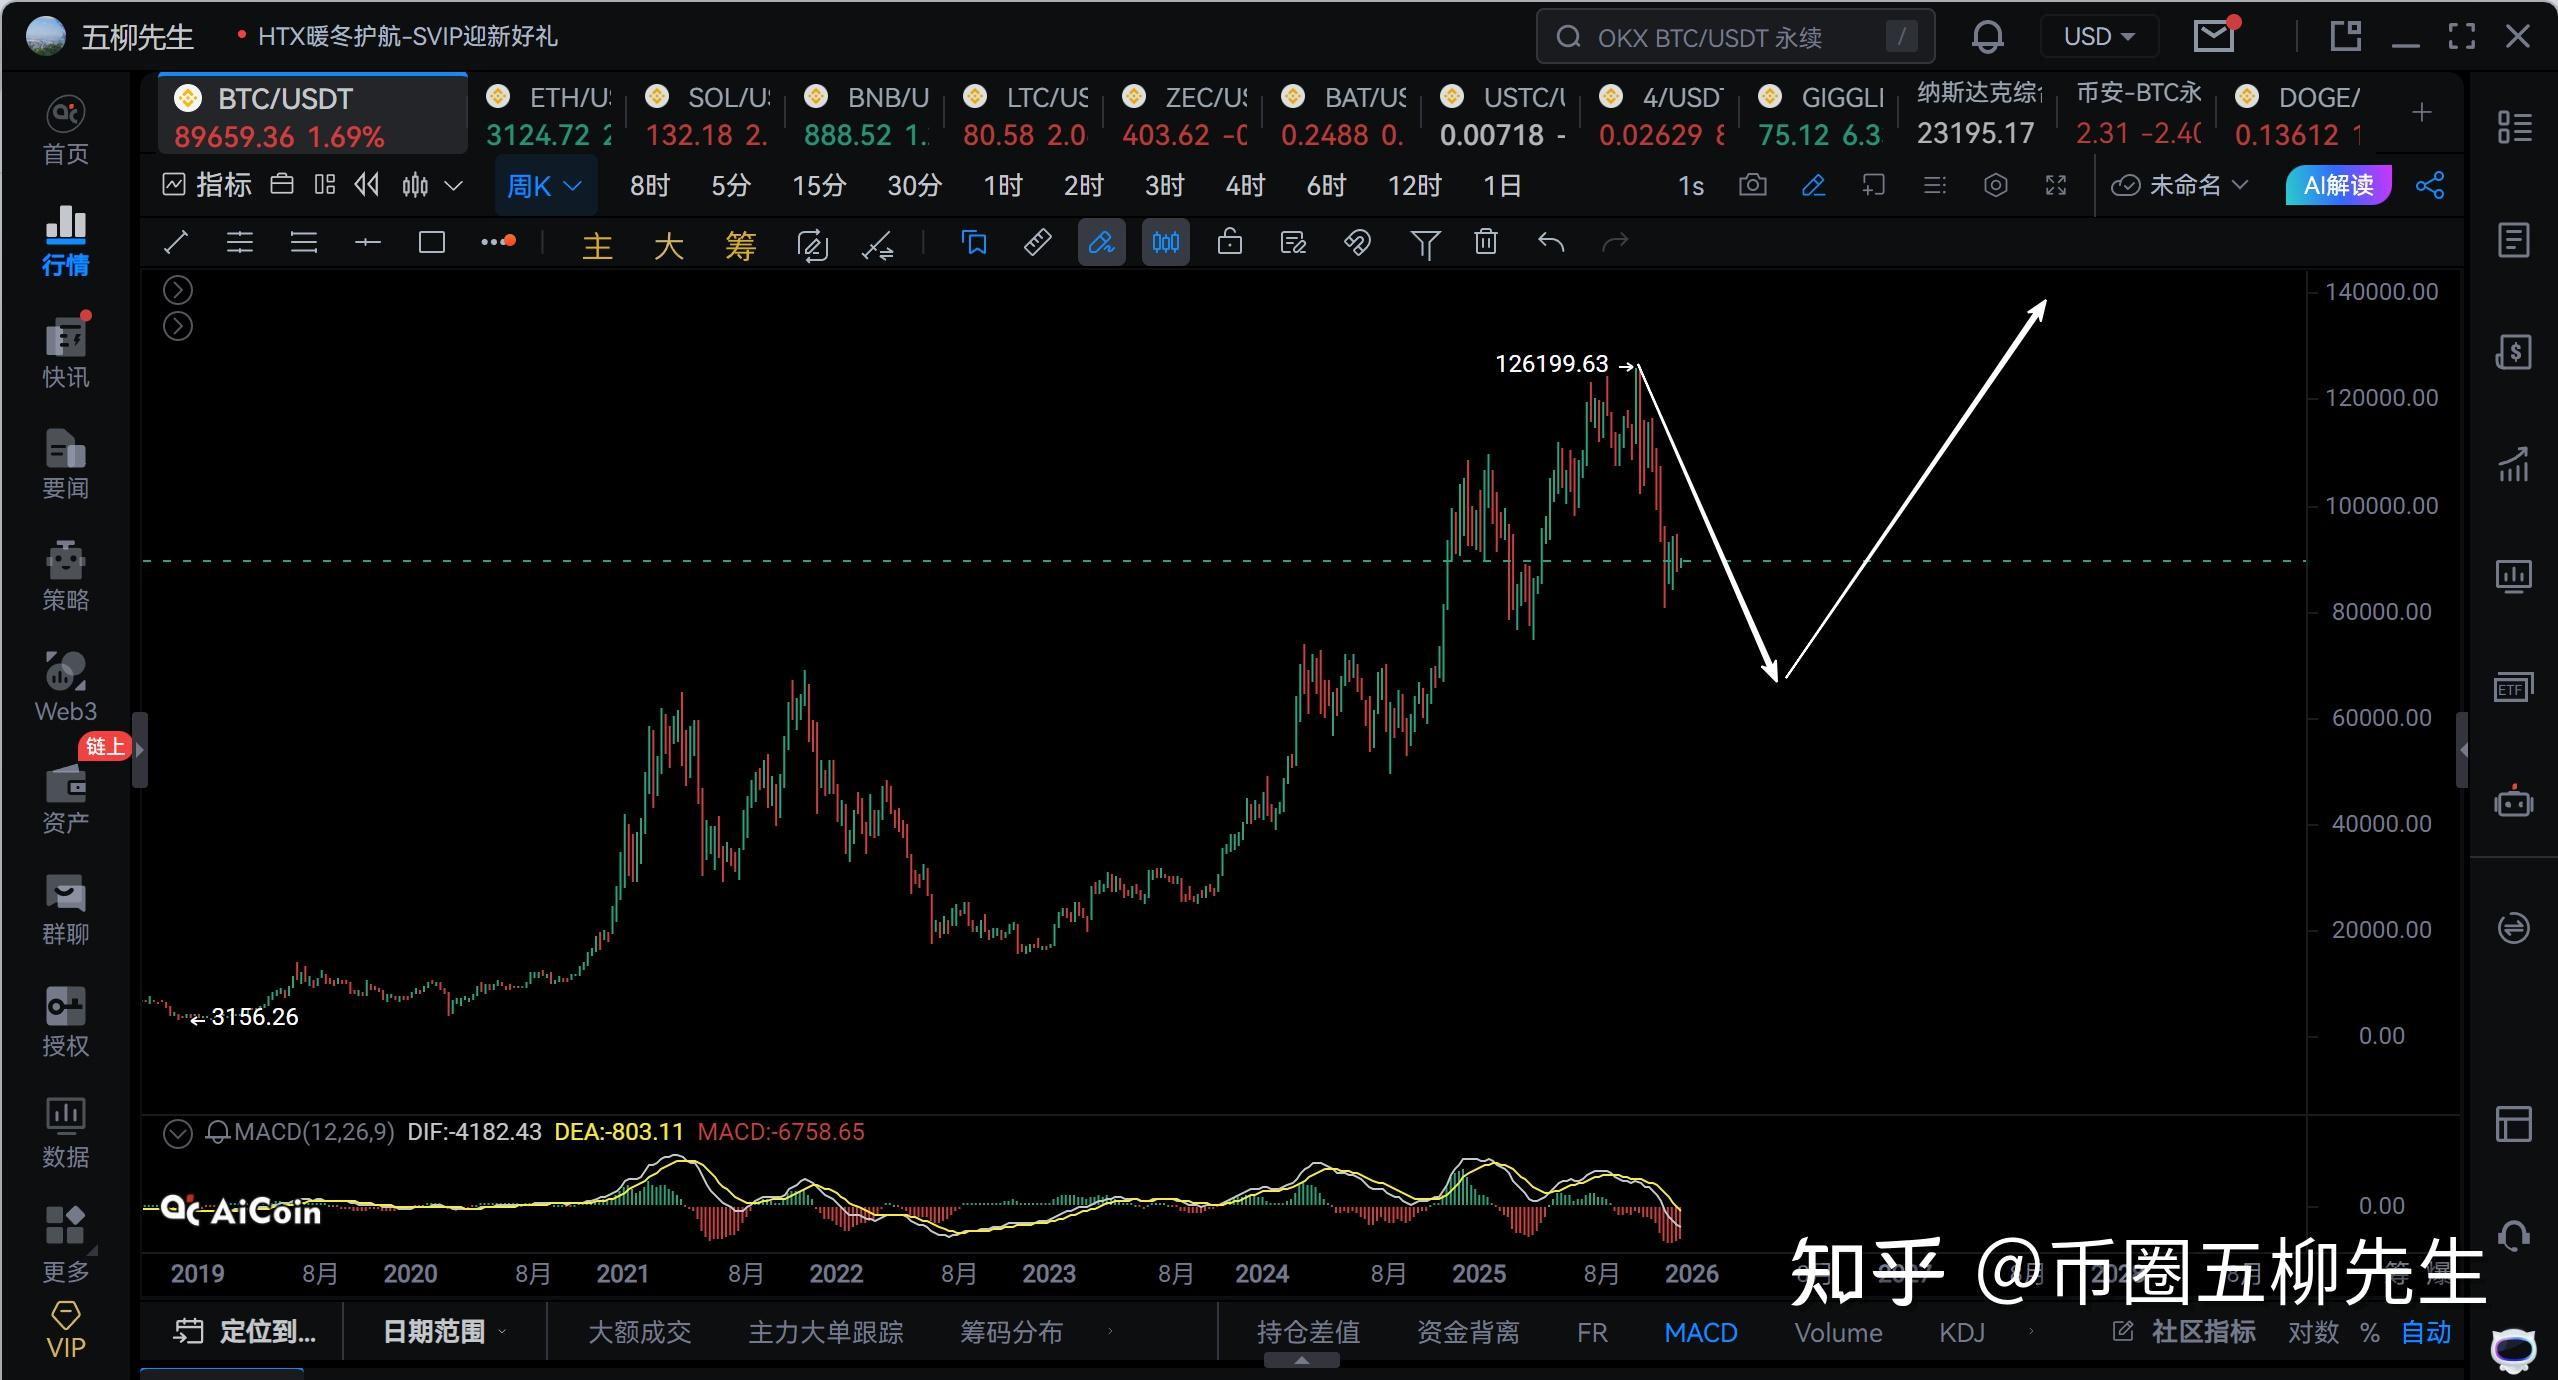
At the weekly level, we first look at the MACD of the weekly chart, which has now started to cross below the 0 axis, and the red energy bars of the weekly MACD are significantly larger than those in the first quarter of 2024 and 2025. Therefore, we can confirm that the big coin's decline starting from 126199 will not stop here. Thus, our conclusion is that the big coin is indeed experiencing a weekly level decline.
This weekly level decline has a primary target at 70000; if it breaks below, then look towards around 62000. The time cycle of the weekly decline mainly looks at two phases; if the structure is simple, it should roughly end around May or June of 2026. If the weekly level decline structure is complex, it will need to wait until October 2026.
Due to Bitcoin gradually having institutional support, with several countries incorporating Bitcoin into national strategic reserves, according to current data statistics, institutional holdings have reached 594 million BTC, accounting for about 30% of the circulating supply. Therefore, I believe that the decline starting from over 126000 is merely a weekly level decline and not a monthly level decline lasting for several years. Thus, after the completion of the weekly level decline, there will be a continuation into the next round of climbing. The next weekly level upward target is around 190000.
In the next 5 years, Bitcoin will only become more expensive; ordinary people will basically no longer be able to climb up. The contract aspect may be something everyone can continuously participate in, but the difficulty of trading is also constantly increasing.
Daily level:
Of course, whether the weekly level goes up or down, how much it can rise or fall, actually has no relation to everyone anymore. As the roles of market participants become increasingly complex, the long-term fluctuations of the market become more difficult to predict accurately, and as Bitcoin becomes more expensive, it is hard for everyone to make money from weekly level waves.
Without discussing anything else, just say that in 2024 it could drop to 49000; even if you bottomed out at 49000, it would be hard for you to sell out at the high point of the weekly level upward at 126199. In the meantime, can you resist making any trades while it drops from 109000 to 74000 and from 112000 to 98000? So, regarding the weekly level trend, everyone can just take a look; it's basically not participatory. What you can participate in are the waves below the weekly level, such as daily level waves, 4-hour level waves, or 1-hour level waves.
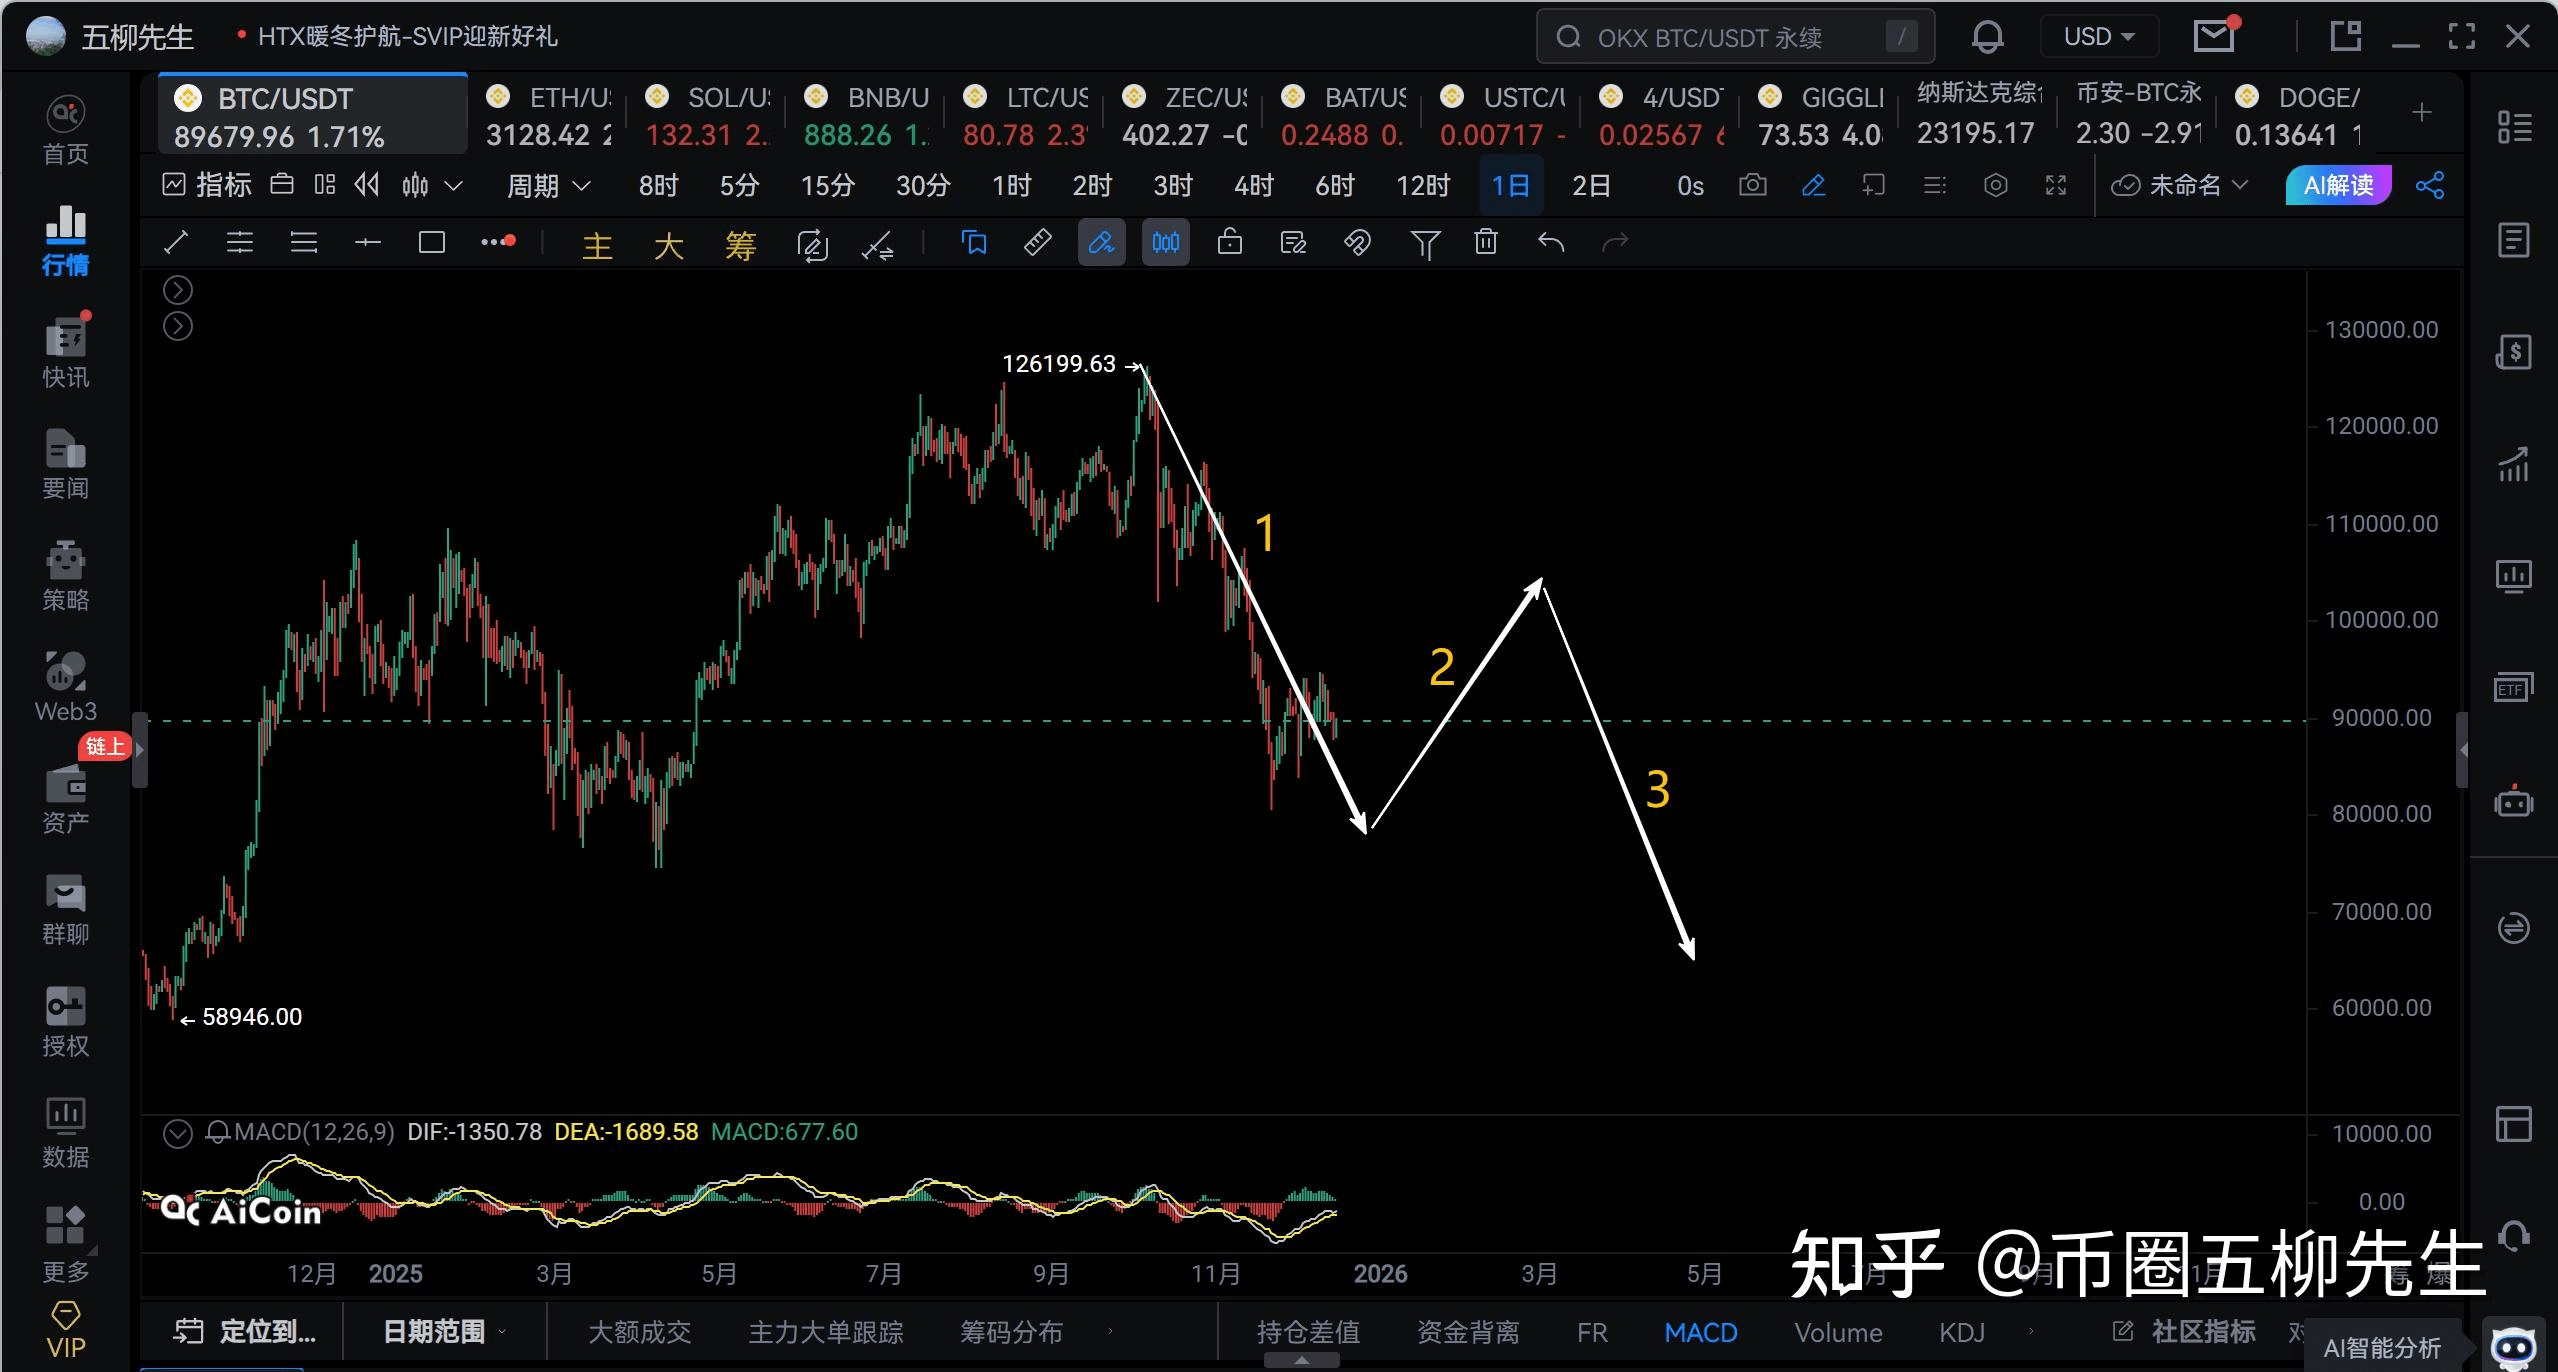
Returning to the current daily level trend, Bitcoin's first daily level decline starting from 126199 has not yet shown a clear ending signal; I personally tend to believe there’s a probability of another drop to around 79000 to end this daily level decline. After that, between late December and February, Bitcoin has a probability of making the second daily level rebound.
The target for the daily level rebound focuses on the range of 102000~106000.
After the second daily level rebound is completed, it is very likely to move towards a third daily level decline. For the third daily level decline, first look at the support at 70000; if it breaks, then look towards around 62000.
4H:
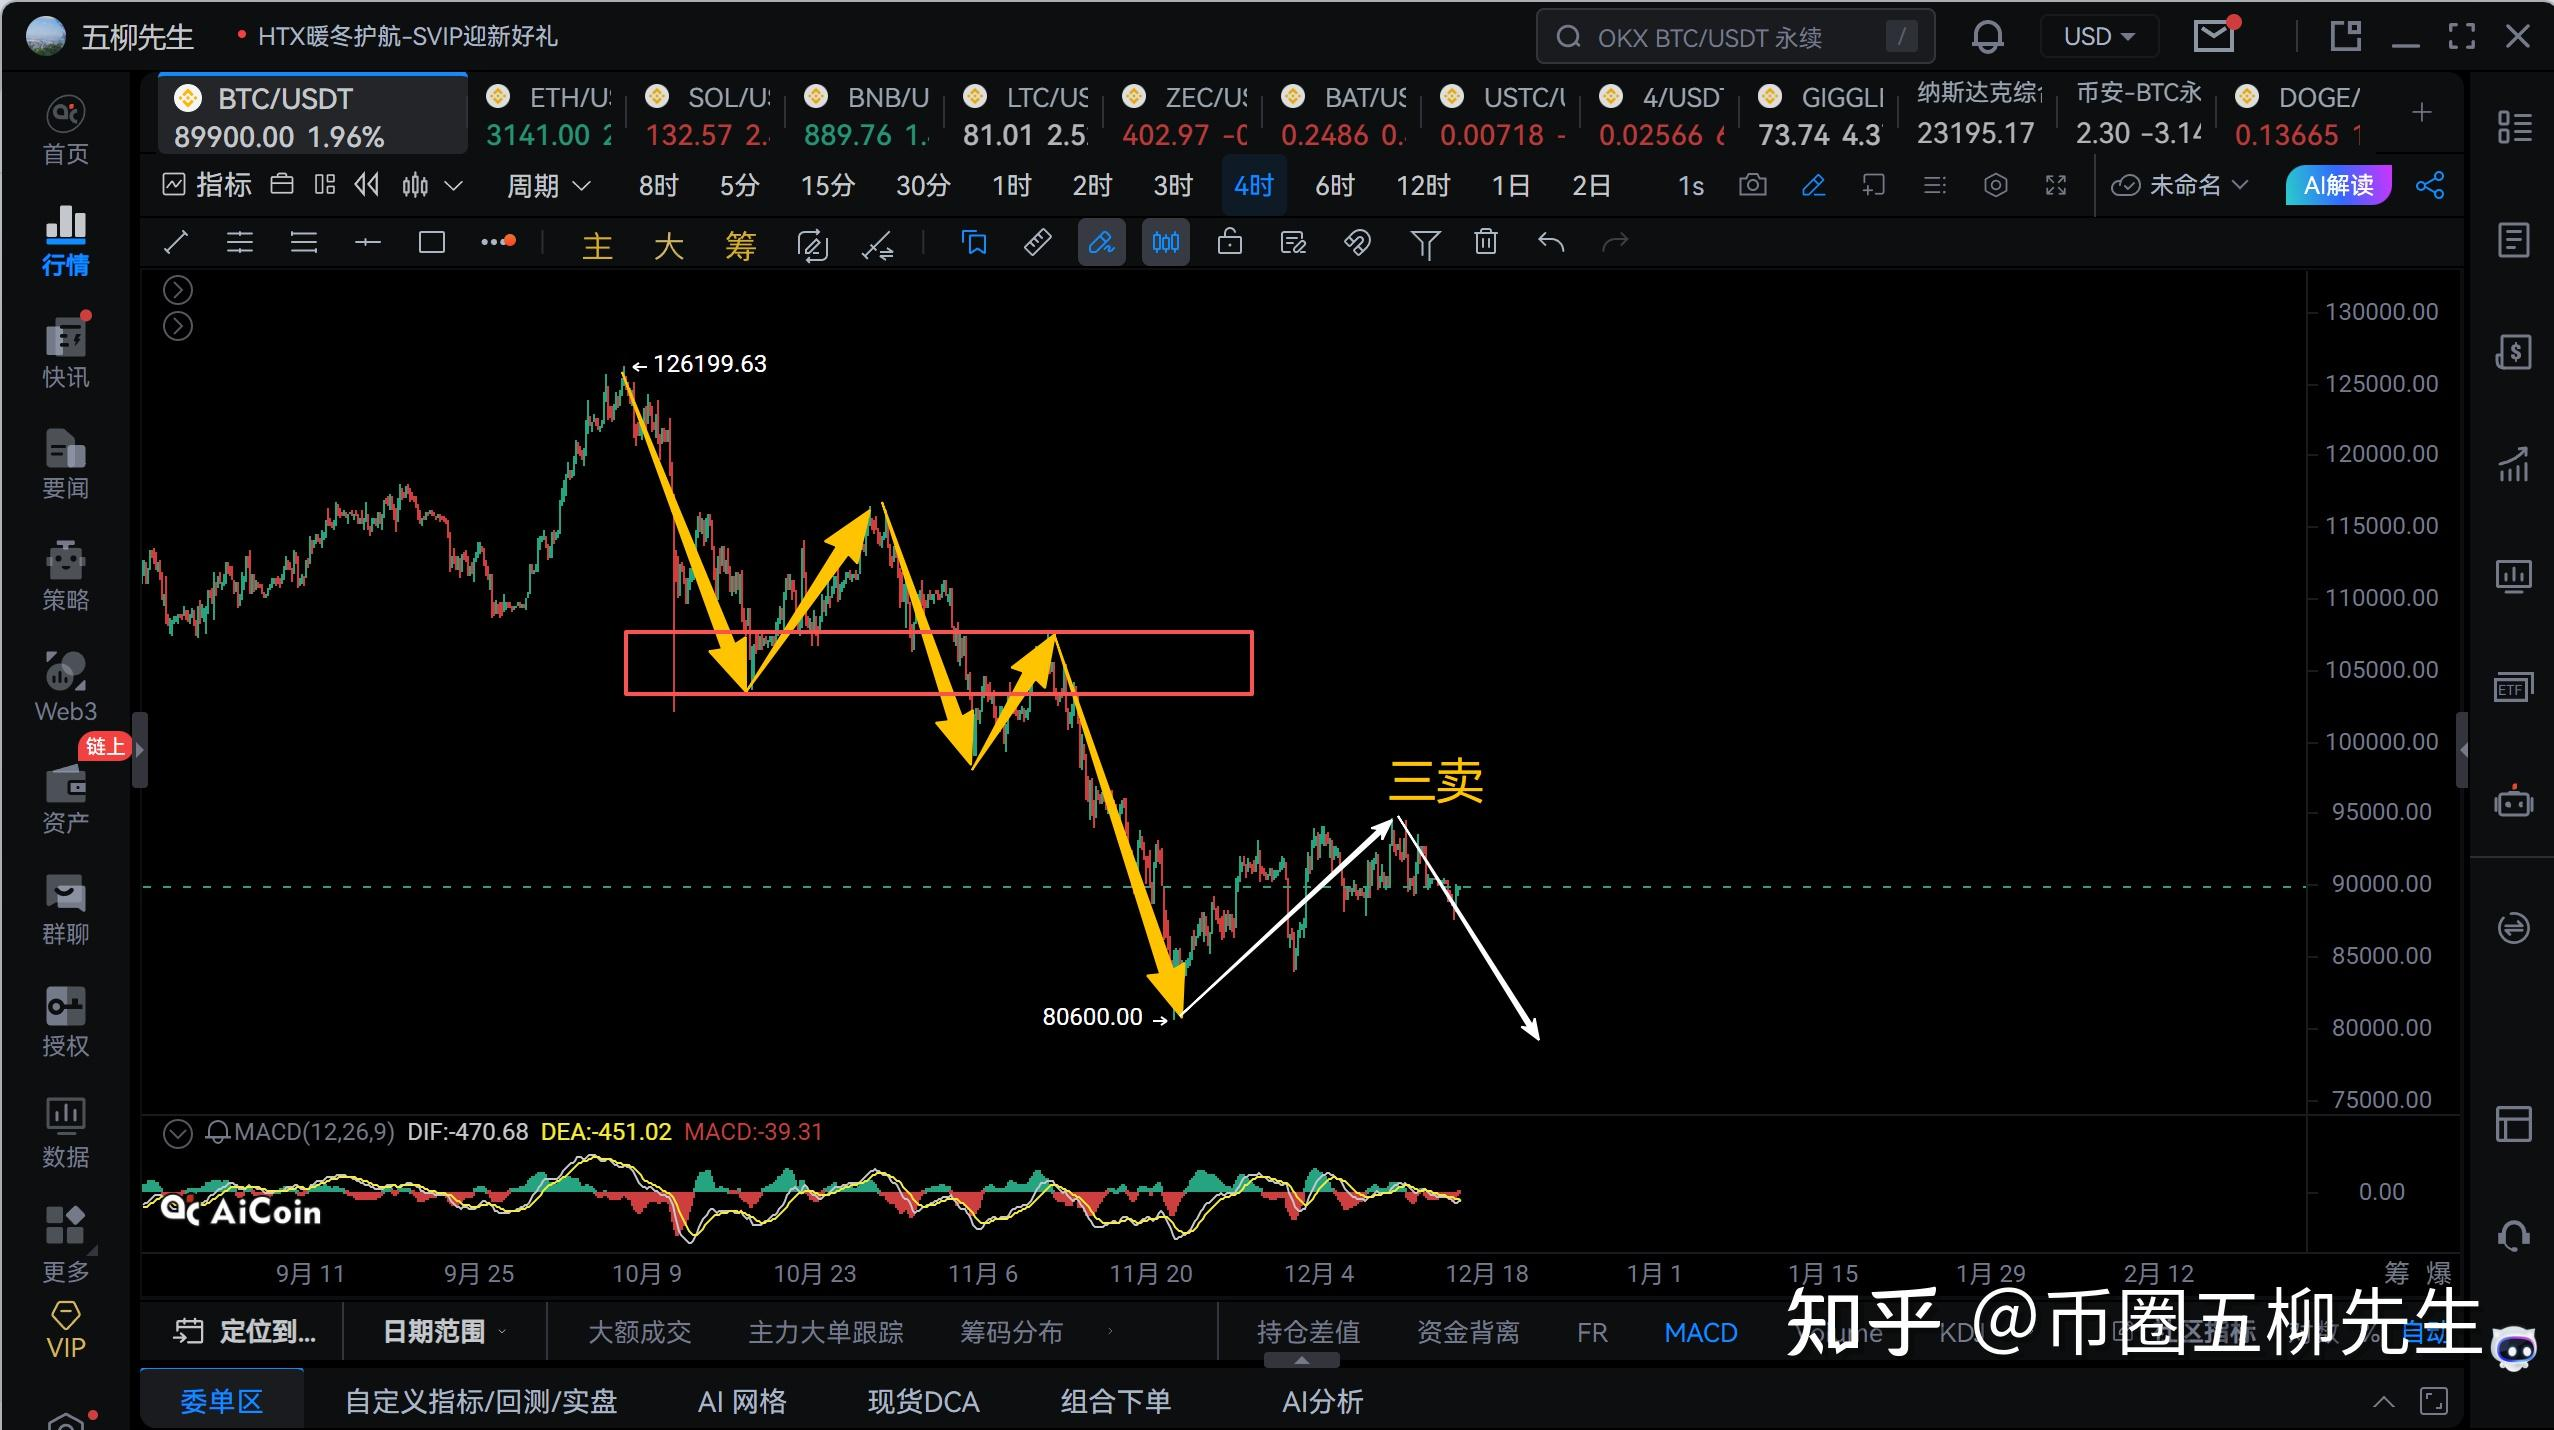
4-hour level, starting from 126199, Bitcoin has currently completed 5 4-hour level structures in this daily level decline. Among them, the fifth 4-hour level decline, from 107500 to 80600, has a single decline amplitude of 25%. This central leaving segment's 4-hour level decline is clearly not diverging. Therefore, theoretically, Bitcoin will still have a sixth 4-hour level rebound and a seventh 4-hour level decline.
The 4-hour level rebound starting from 80600 is the sixth 4-hour level rebound, peaking at 94588, but the rebound did not break through 95000 to open up space upwards. Therefore, I personally believe that the current 4-hour level decline starting from 94588 still has a probability of breaking below 80600.
Of course, if it drops below 80600 again in the future, do not panic; this is clearly the best bottom-fishing opportunity in the short to medium term. Because after the seventh 4-hour level decline is completed, what awaits everyone is likely a daily level fluctuating rebound market lasting about 2 months.
The current 4-hour level decline has not yet ended; wait and see if it can end from Sunday to next Tuesday.
BTC short-term
Due to the rapid changes in the market, the article can only make predictions based on the market changes at the moment of publication. Short-term players should pay attention to the latest changes in the market; this is merely for reference.
1H:
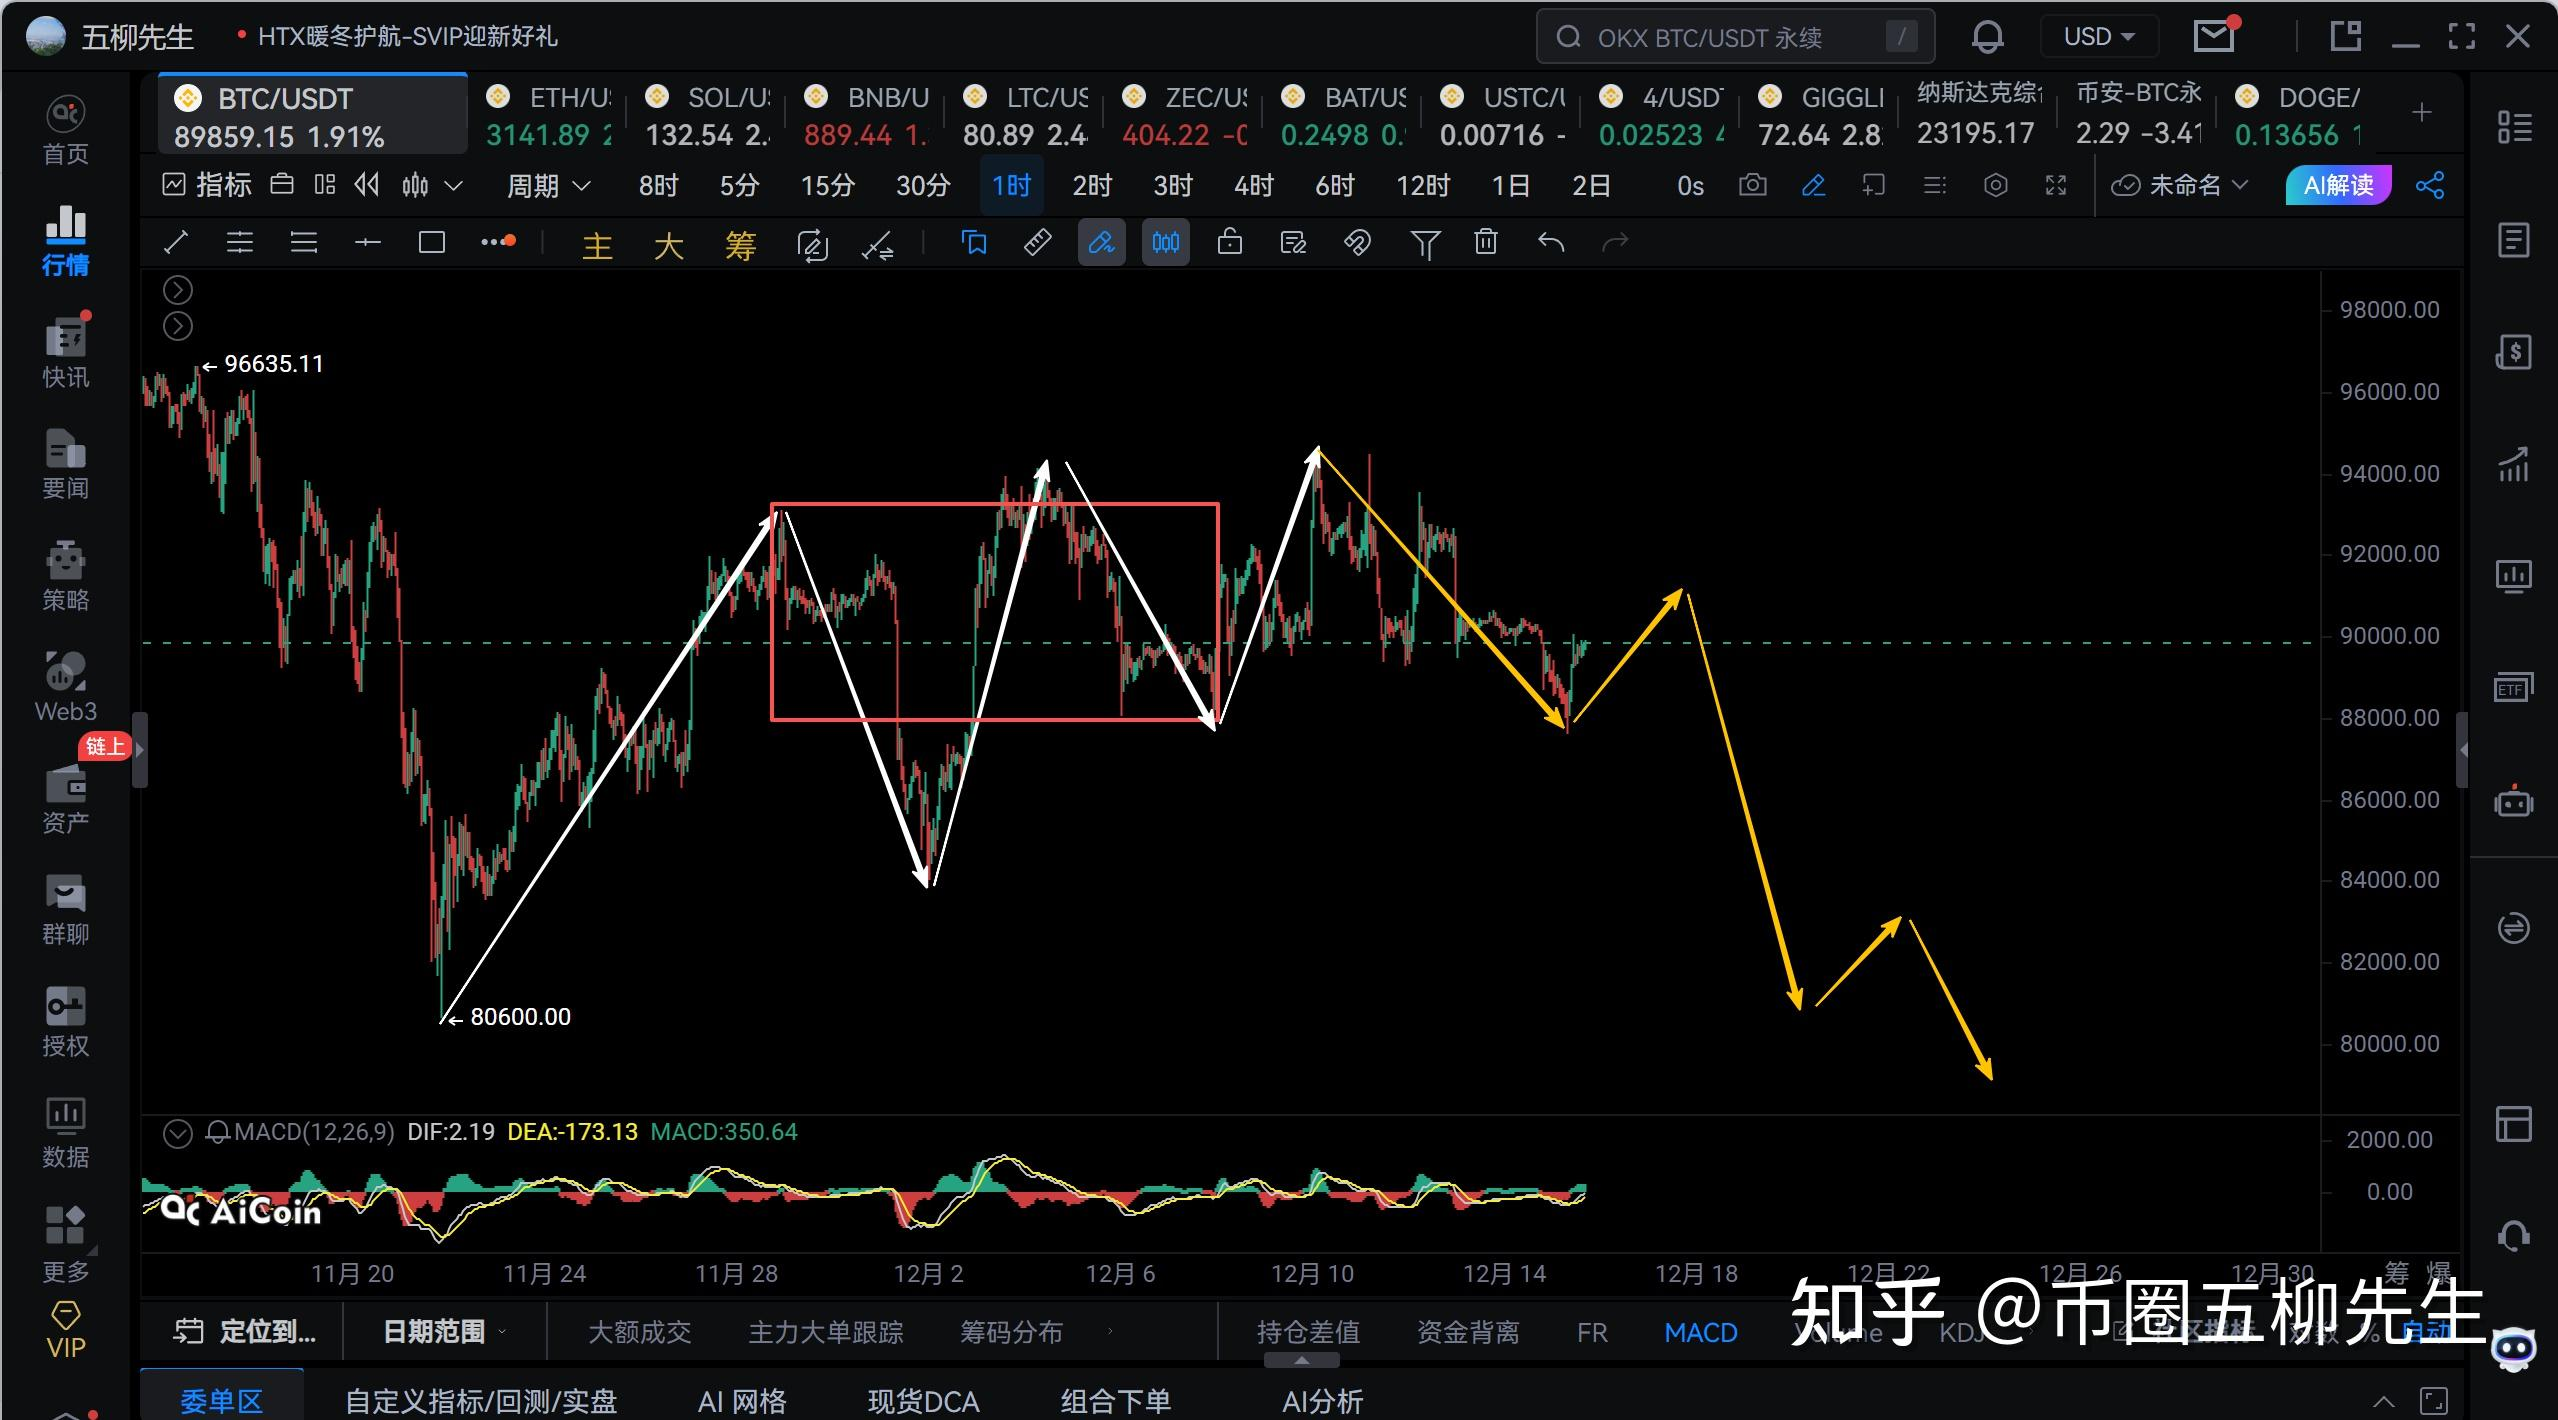
1-hour level, from 94588~87577, this is a 1-hour level decline that has been fluctuating downwards for about 4 days. It is expected that there should be a 1-hour level rebound here, focusing on around 91200 for the rebound, and afterwards, it is expected that there will be three more 1-hour level declines, observing whether the third 1-hour level decline breaks below 83000. Of course, this is one possible trend; if the structure is a bit more complex, Bitcoin may first continue to fluctuate between 87000~91500 for 3 days, building a 1-hour level center, and then proceed with a downward 1-hour level decline.
Overall, short-term focus should be on the strength of the 1-hour level rebound; as long as it does not break through 93500 again, the overall 4-hour level decline can be confirmed 100%.
15M:
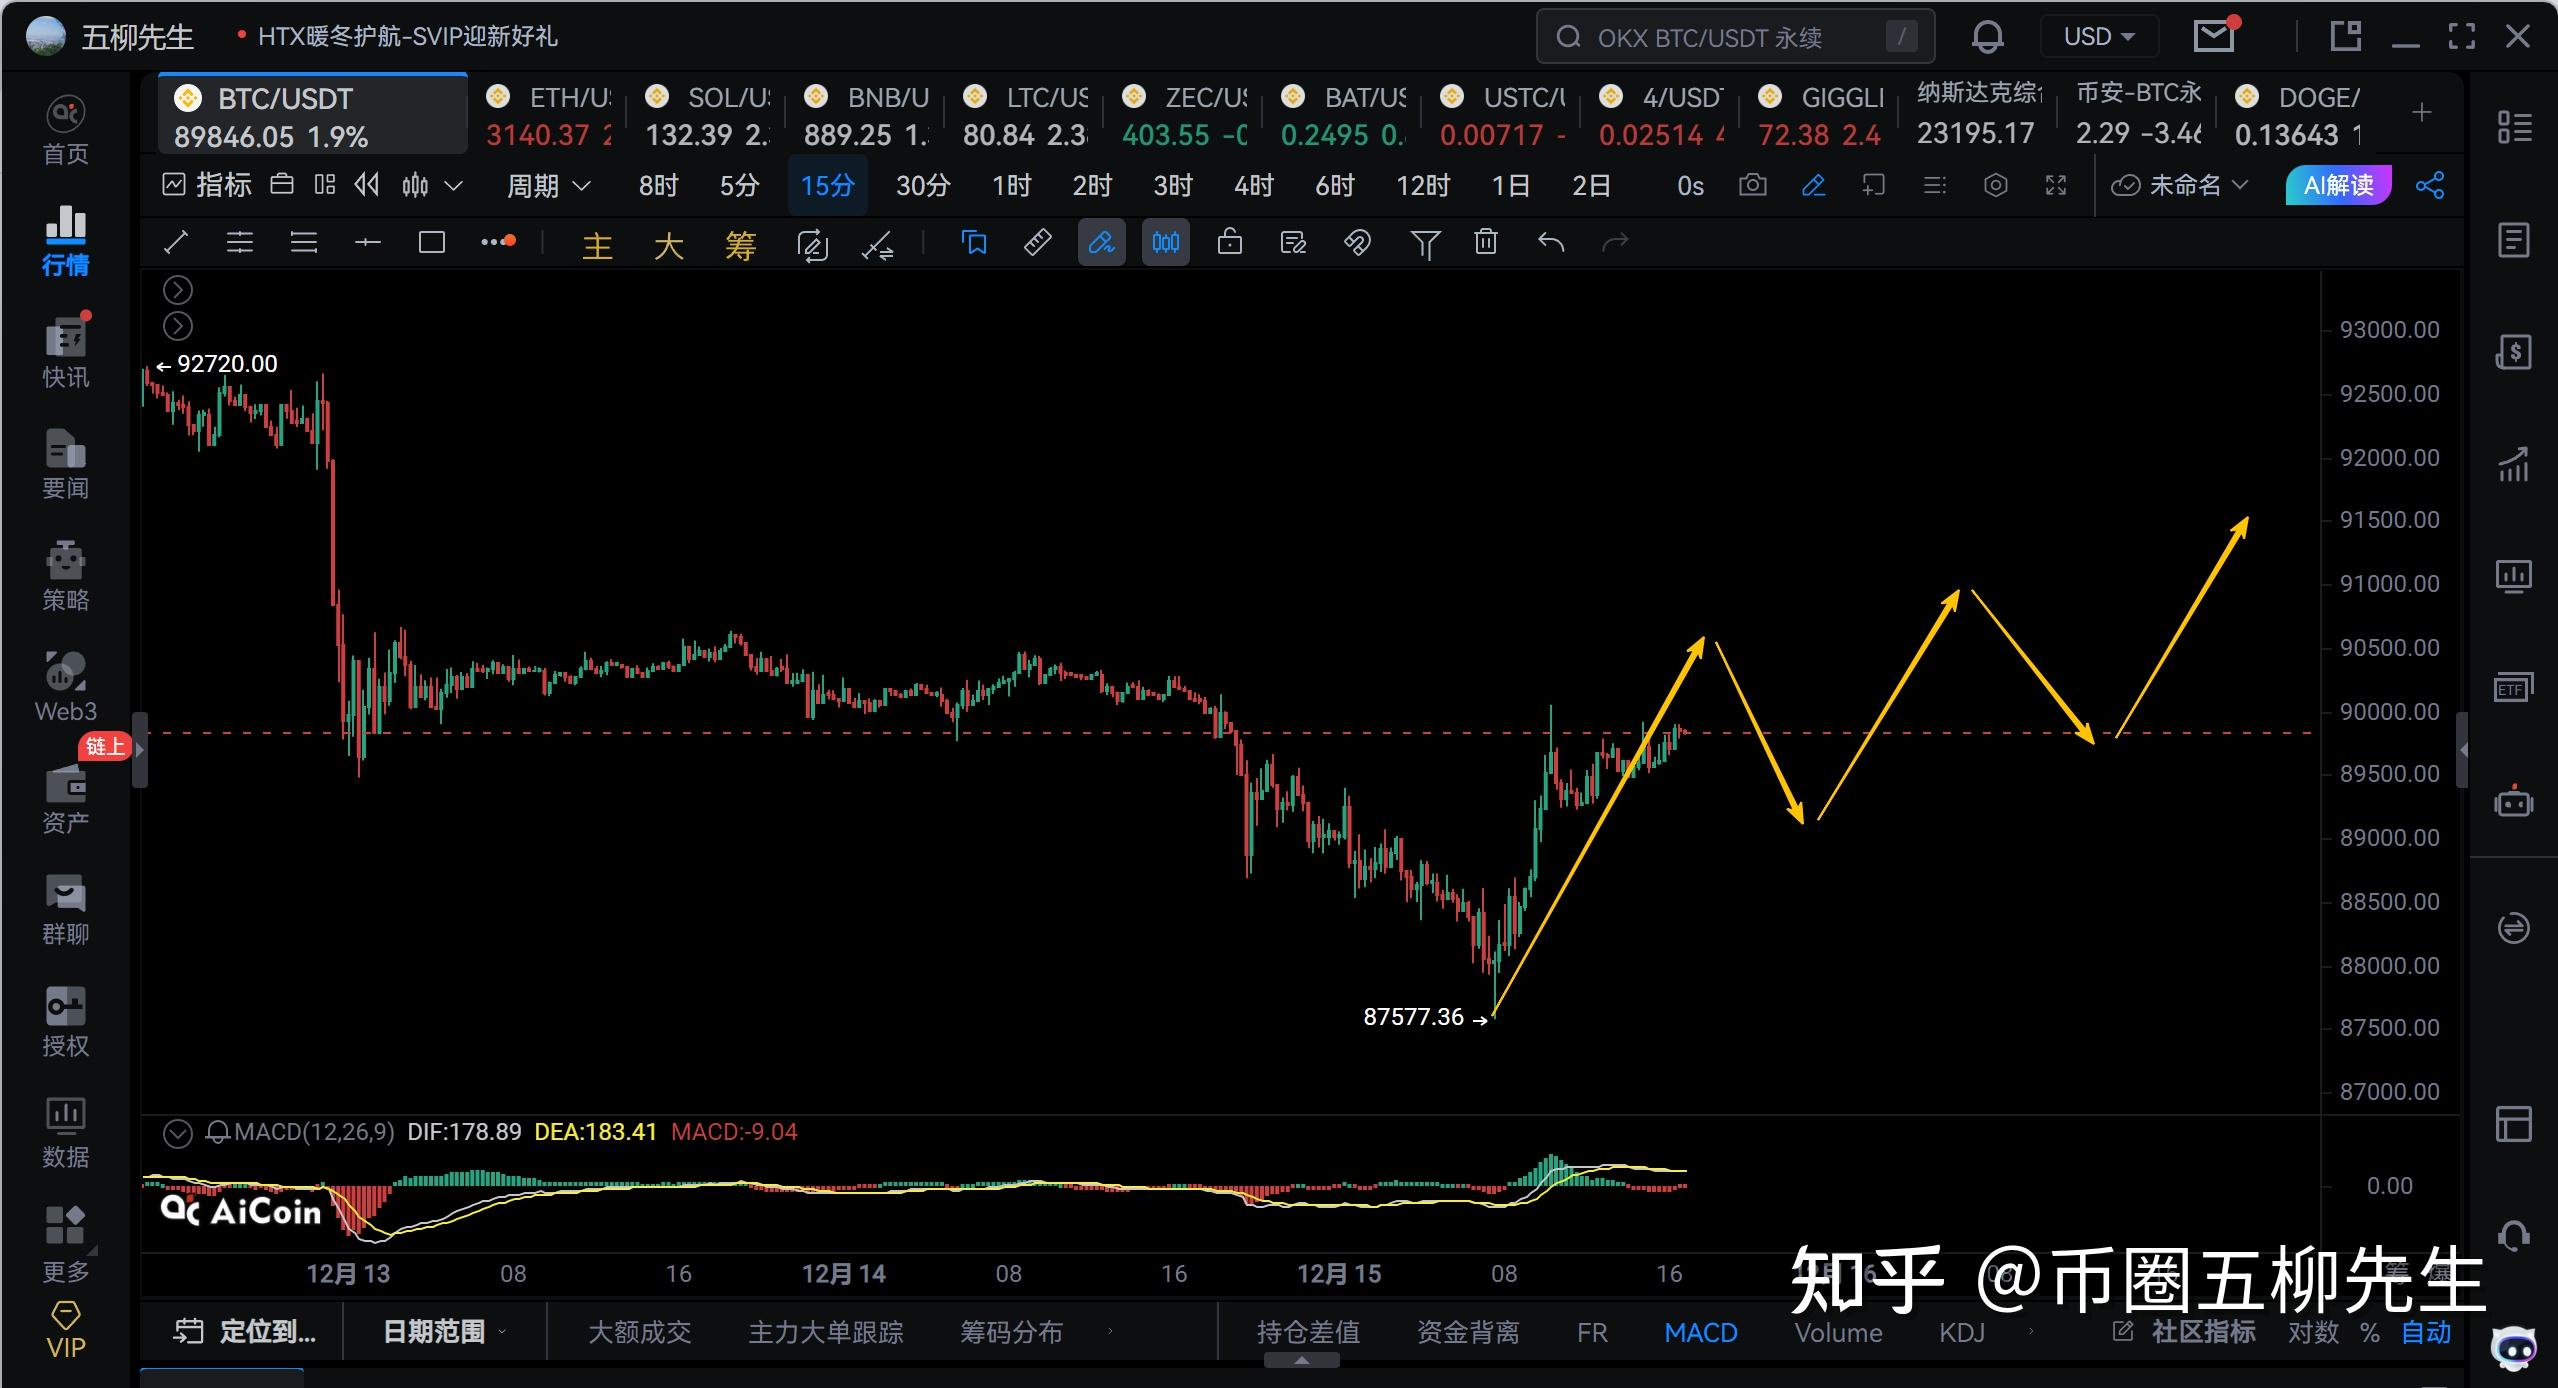
15-minute level, here it should normally be in a 1-hour level rebound; currently, it is the first 15-minute level rebound. The subsequent structure can be observed as it progresses; it can either end with a 15-minute level up and down or consolidate in a center and then extend another wave.
ETH
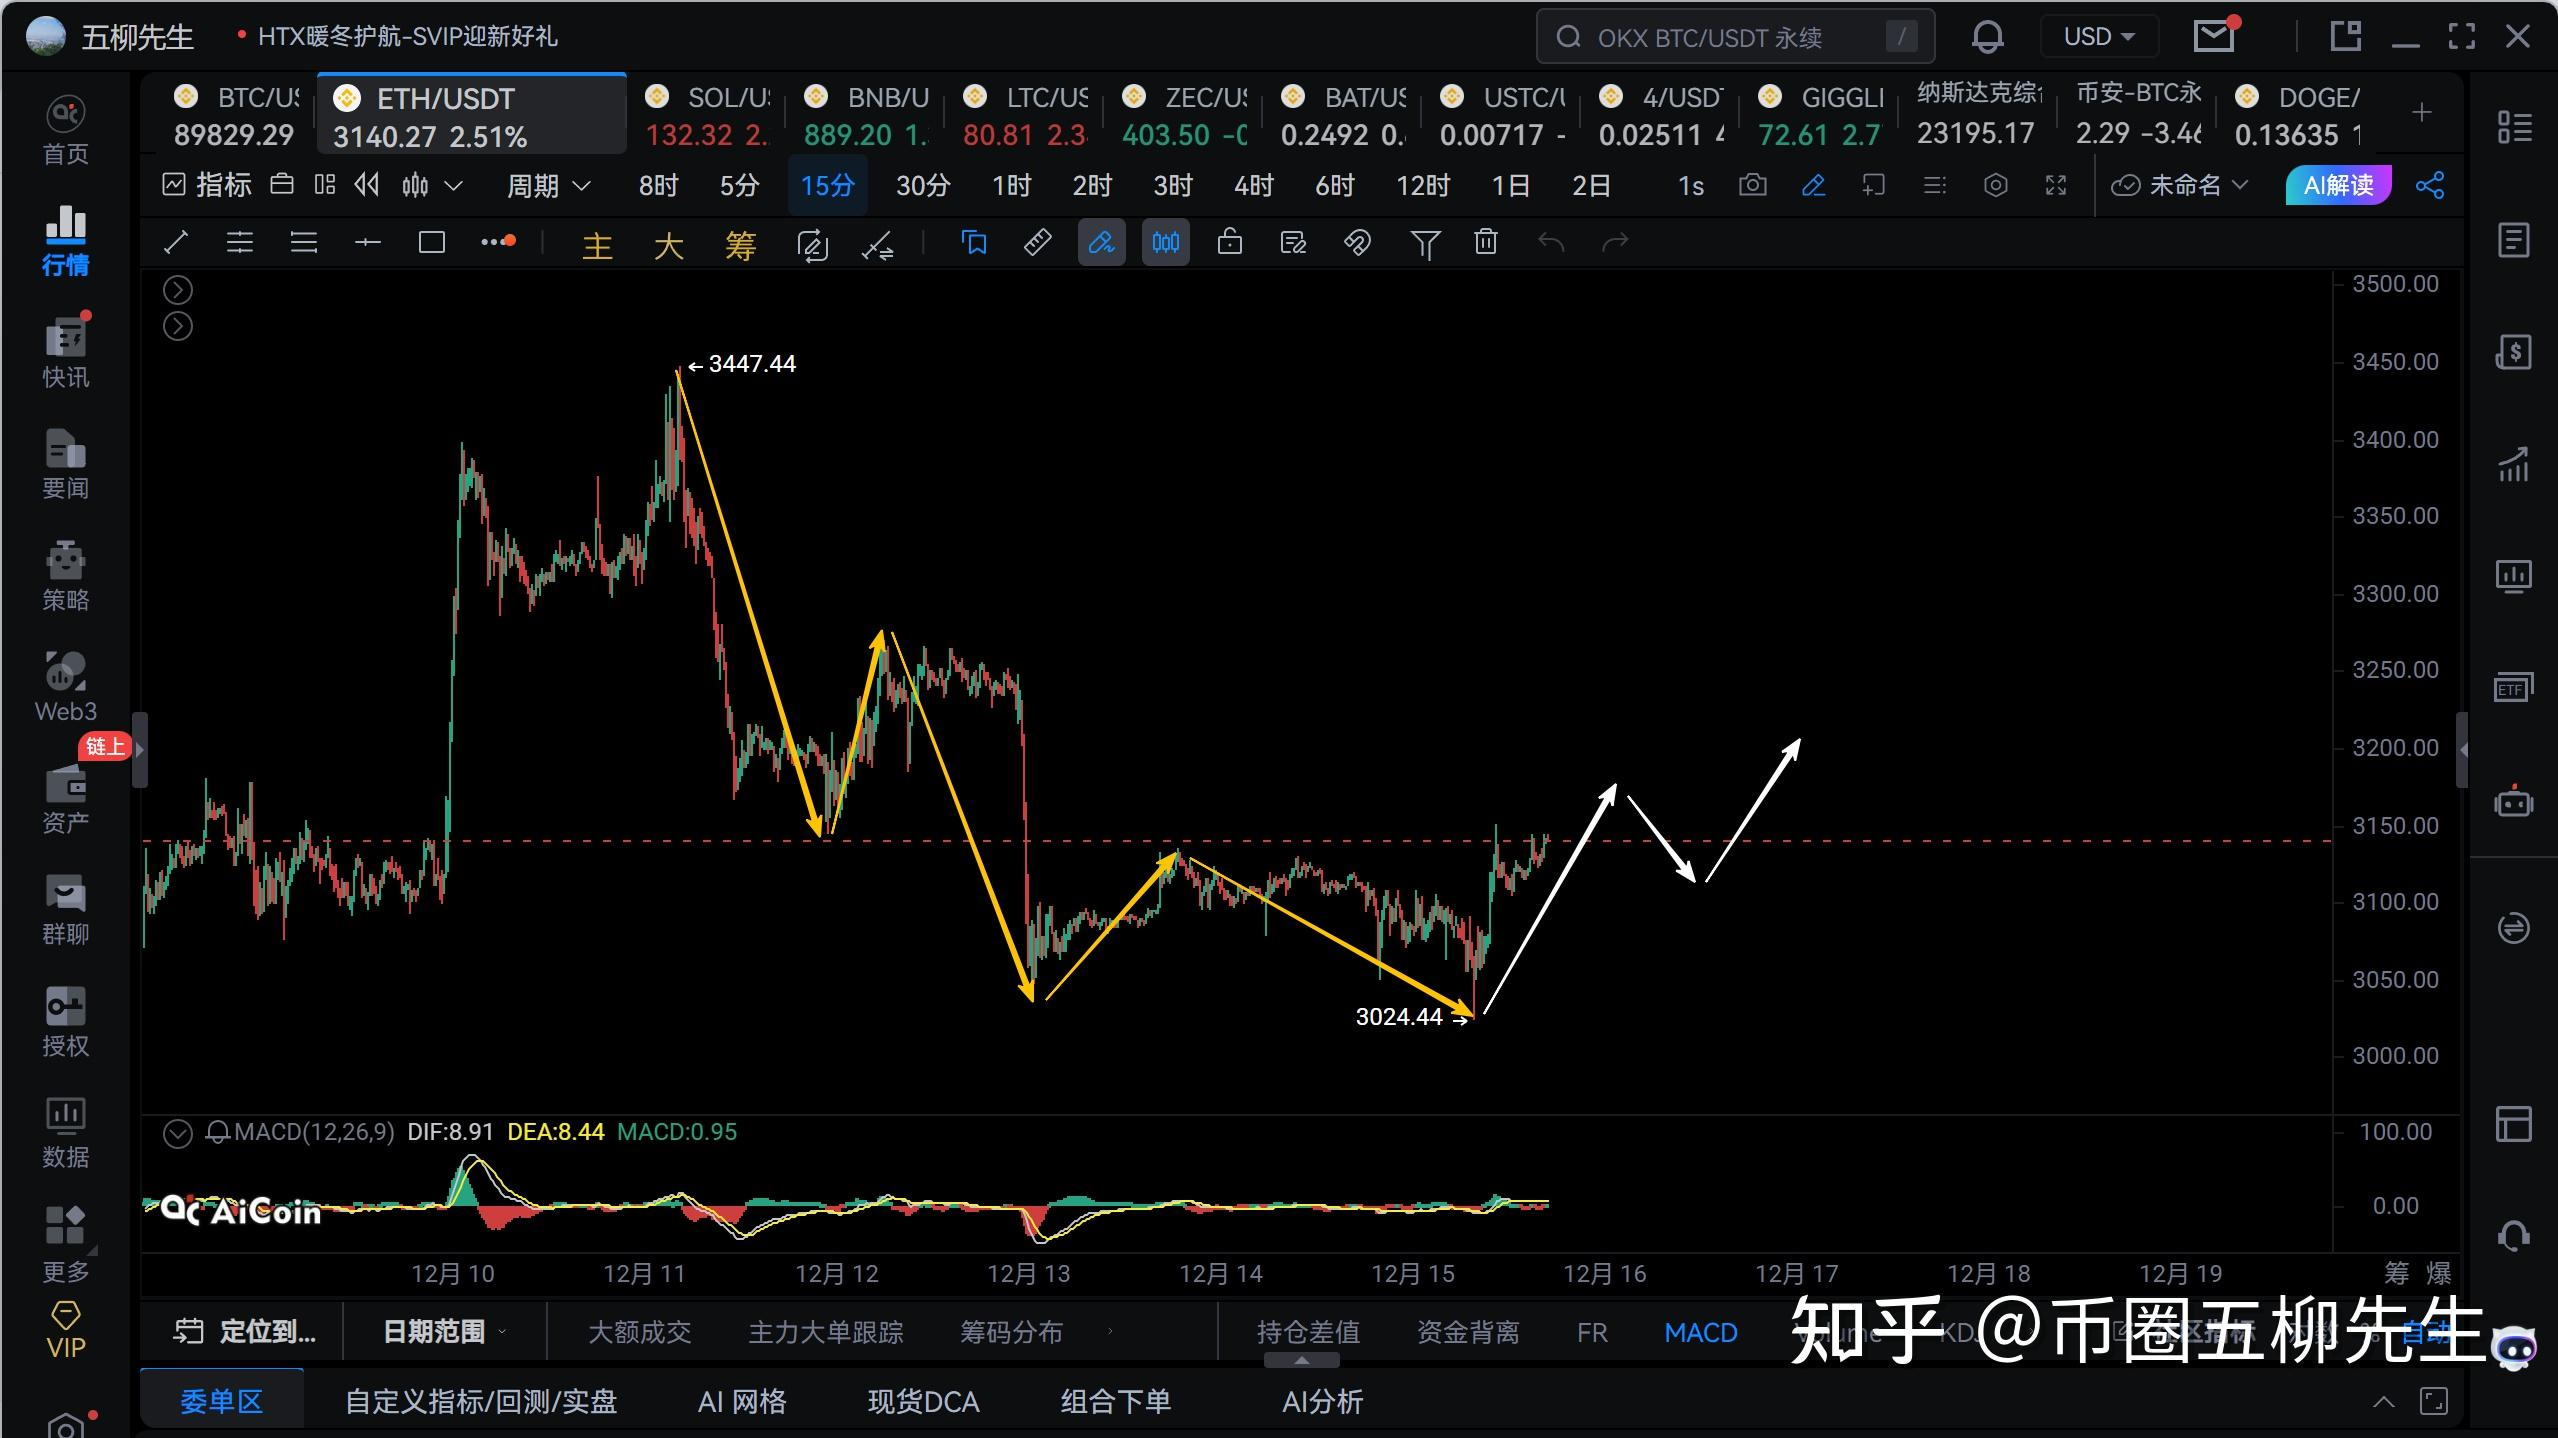
Ethereum 15-minute level, here it is expected to be in the second 1-hour level rebound; this rebound has only completed the first 15-minute level rebound internally, and there will still be a second 15-minute level pullback and a third 15-minute level rebound. The third rebound will see if it touches around 3200.
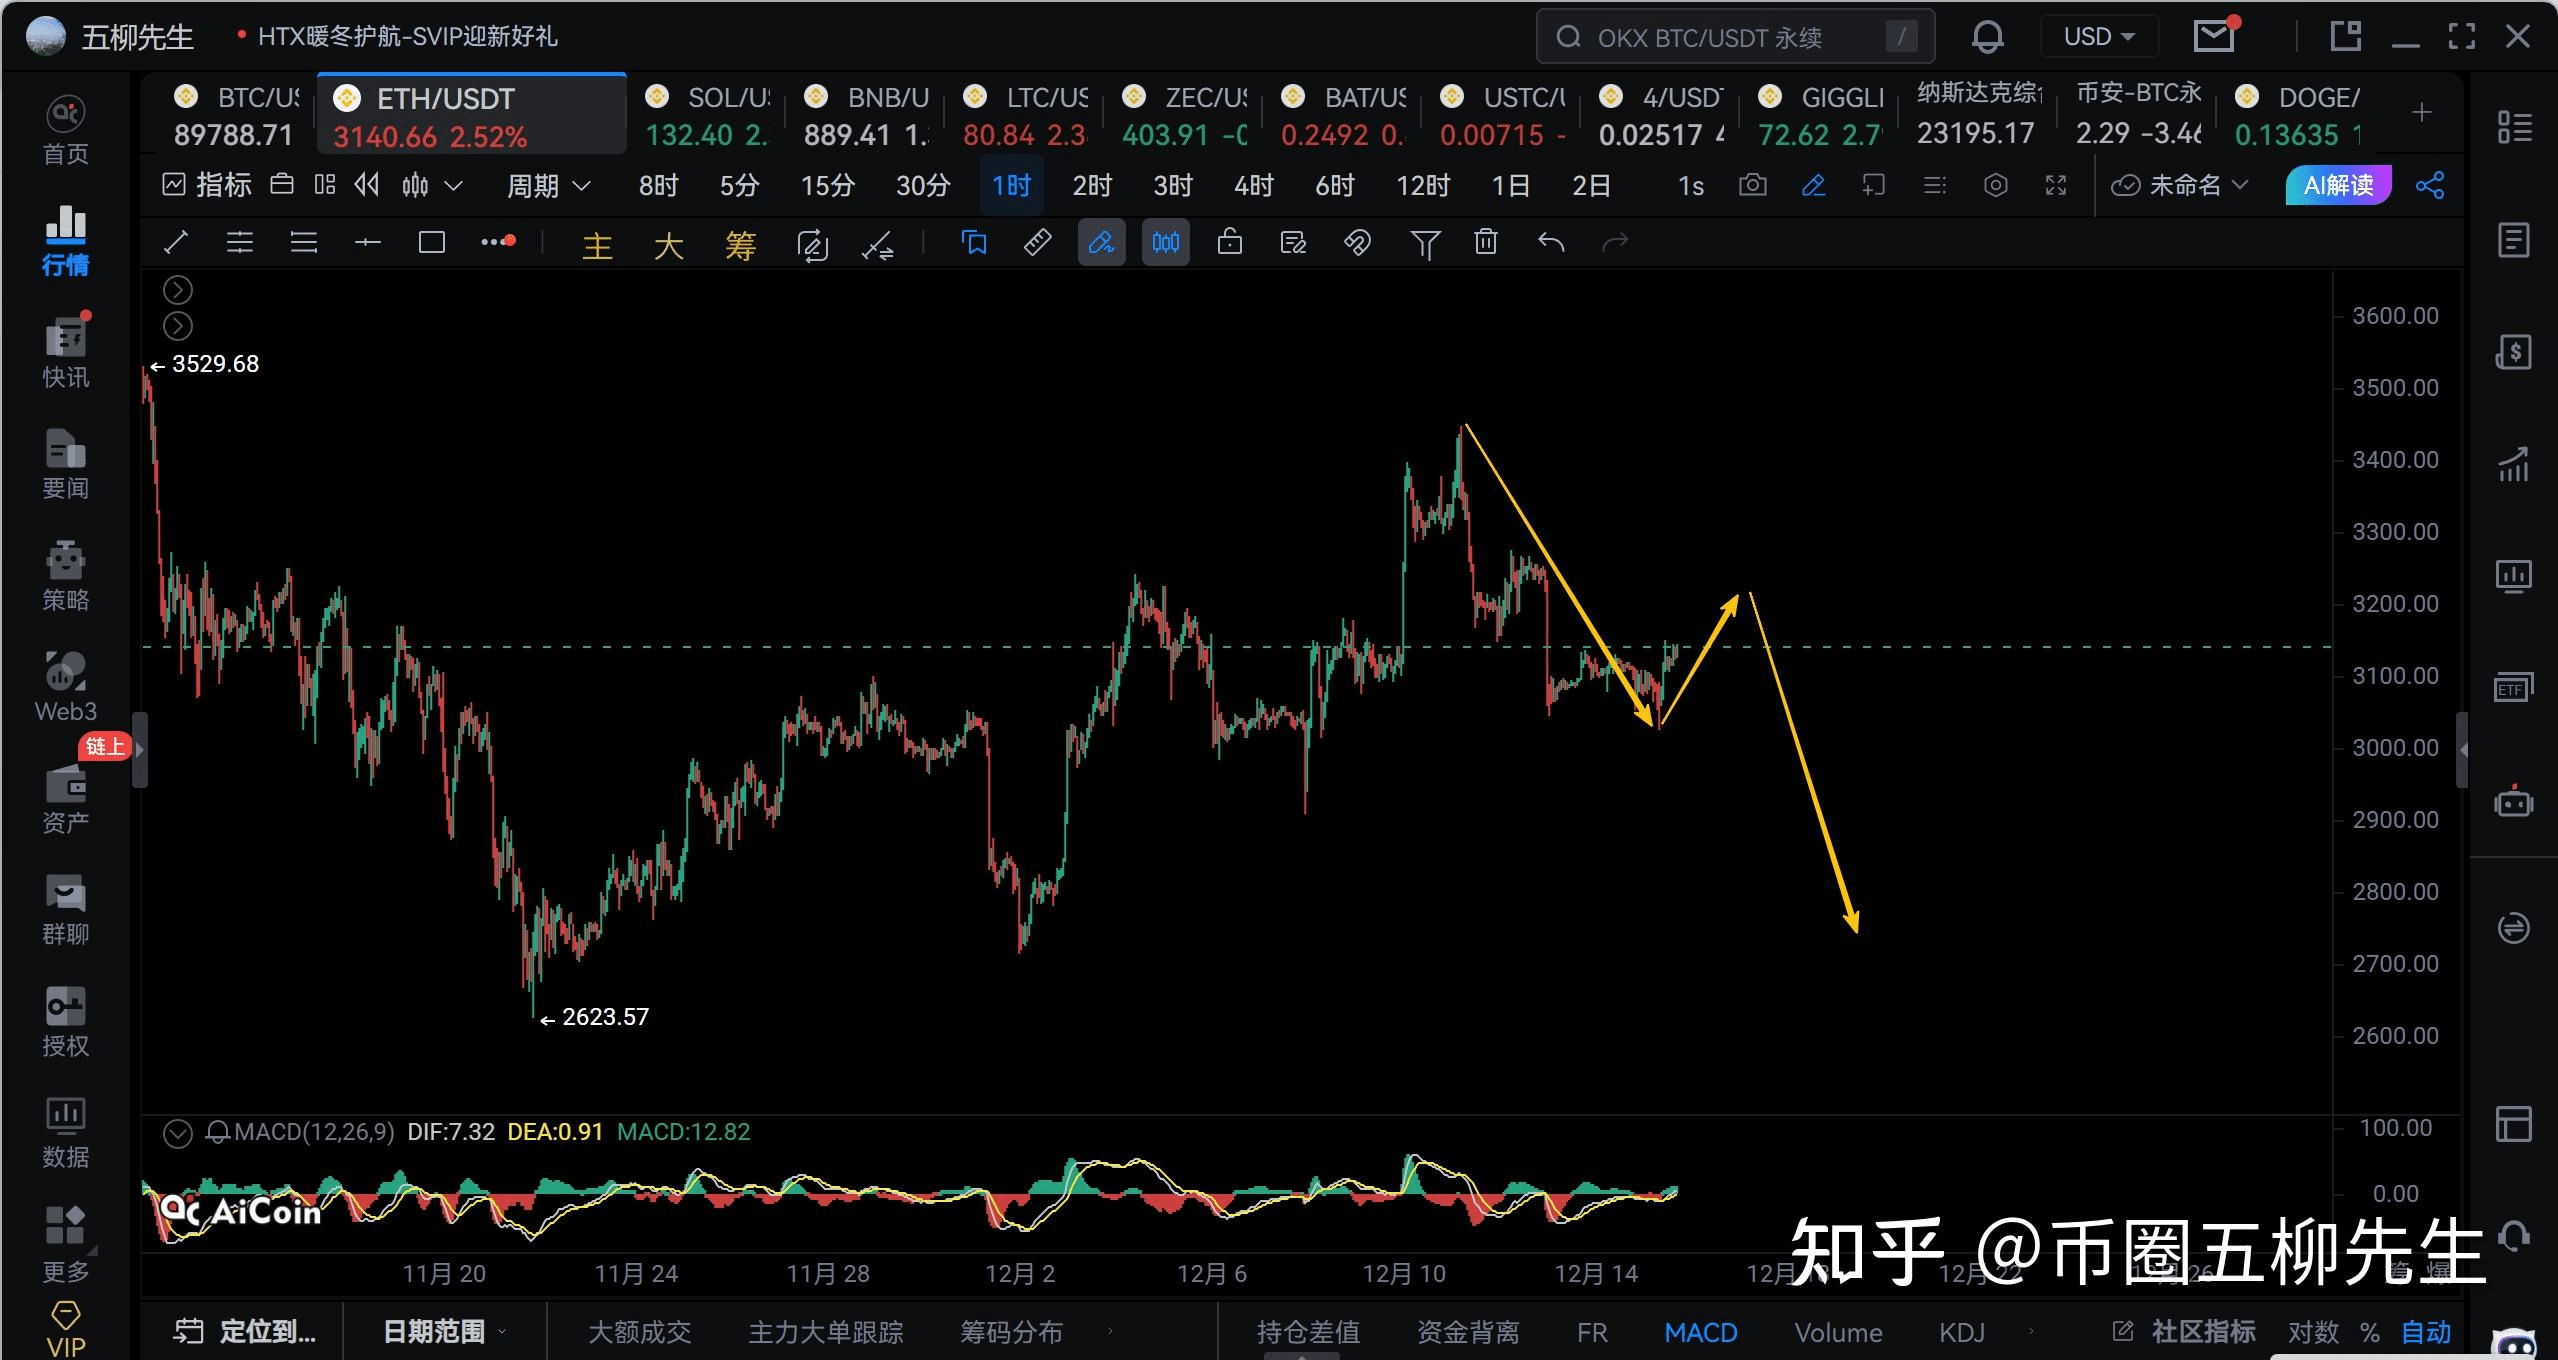
Ethereum here is likely in a 4-hour level decline; currently, it has already completed the first 1-hour level decline internally, and in the short term, it may be running the second 1-hour level rebound. After the second 1-hour level rebound is completed, there will also be a third 1-hour level decline. The specific strength of the third 1-hour level decline still needs observation; overall, it will break below 2800, but whether it breaks below 2623 needs to be observed as it progresses.
Trend direction
Weekly level: direction down, there’s a high probability that the weekly level decline has already begun.
Daily level: direction down, the daily level decline is expected to end early next week.
4-hour level: direction down, currently should be in a 4-hour level decline, with a probability of breaking below 80600.
1-hour level: direction upwards, short-term looks like a 1-hour level rebound; as long as it does not break 93500, it can confirm a 4-hour level decline.
15-minute level: direction upwards

